Embed Size (px)
Citation preview

2013 – 2017 IRRIGATION PRICING SUBMISSION TO QCA
SS Page 1 of 42
�
�
�
�
�
Logan River Water Supply
Scheme
Network Service Plan
�
�
�

2013 – 2017 IRRIGATION PRICING SUBMISSION TO QCA
SS Page 2 of 42
�
1. Introduction
Review Context
The QCA has been directed by the Queensland Government to develop irrigation prices for the Logan River Water Supply Scheme (the Scheme) for the four-year regulatory period 1 July 2013 to 30 June 2017.
The QCA is required to provide a draft report including draft irrigation prices by 30 November 2012 and a final report with recommended price paths by April 2013.
The current irrigation prices were set when the Scheme was owned by SunWater, and commenced from 1 July 2006. The Scheme was transferred to Seqwater in 2008-09, along with the SunWater pricing arrangements. This is the first review of irrigation prices since the Scheme has been in Seqwater ownership.
This document is the Network Service Plan (NSP) for the Scheme. It sets out information relevant to the QCA’s review, including Seqwater’s expenditure proposals over the regulatory period and specific pricing proposals for the Scheme.
It should be noted that this review is occurring alongside a separate review of Grid Service Charges, and that certain costs also form part of that review, although over a different timeframe.
About Seqwater
Seqwater owns different types of water supply assets and service types, namely:
• Storage assets - Seqwater owns 26 dams and 48 weirs which provide bulk water storage services to a range of water entitlement holders in South East Queensland, including irrigators, local governments, industrial users and the SEQ Water Grid Manager (WGM);
• Bulk distribution assets - Seqwater also provides distribution system services to irrigators from pipelines and channel systems;
• Water treatment assets - Seqwater provides drinking water to the WGM from 46 water treatment plants;
• A desalination plant - provides bulk drinking water to the WGM;
• An advanced recycled water scheme, which provides treated recycled water to the WGM;

2013 – 2017 IRRIGATION PRICING SUBMISSION TO QCA
SS Page 3 of 42
�
• Groundwater - Seqwater provides drinking water to the WGM from 14 groundwater bore fields.
Seqwater owns, manages and operates physical assets with a book value of $6.3 billion. Seqwater provides irrigation services to around 1,200 rural customers in seven water supply schemes.
Seqwater also owns unregulated assets such as its head office building at 240 Margaret Street, water entitlements held for trading in the Upper Mary Water Supply Scheme, and two hydro-electricity plants. No costs of these assets are attributed to regulated assets.
Seqwater’s total regulated revenue allowance for 2011-12 was $705M to $709M, of which some $3.3M relates to irrigation supplies. Of this $3.3M, some $1.9M is sourced directly from irrigation charges, with the balance sourced from a Community Service Obligation (CSO) payment.
Interpretation of terms used
For the purposes of this NSP, the following terms are defined as follows:
Water Access Entitlement (WAE) – means water allocations, interim water allocations or water licences.
Scheme background and context
The Scheme supplies water access entitlements owned by irrigators, industrial users, Seqwater and the South East Queensland Water Grid Manager (WGM). The Scheme was transferred to Seqwater from SunWater Limited on 1 July, 2008. The map in section 2 below presents an overview of the Scheme, including the locations of storages and monitoring/gauging stations.
The Scheme is regulated under the Logan River Water Supply Scheme Resource Operations Licence, issued on 7 December 2009. Seqwater must comply with the Logan Basin Resource Operations Plan as part of this Licence.
The scheme consists of bulk water supply assets only. No distribution systems are associated with this scheme. All irrigators take their water supply directly from the river systems.
Customers served
The Scheme supplies water to:
• Irrigation users;

2013 – 2017 IRRIGATION PRICING SUBMISSION TO QCA
SS Page 4 of 42
�
• SEQ Water Grid Manager;
• Five other users; and
• Seqwater.
Further details are set out in section 2 below.
Asset base
The asset base of the scheme consists of bulk water storage assets. These assets are listed in section 2 below and details of individual assets can be found in Appendix A.
Organisational resourcing arrangements
Seqwater is well advanced in transitioning its resourcing arrangements from those inherited in July 2008. Key achievements include:
• replacing service level agreements with previous asset owners (e.g. Councils) with internal staff appointments;
• negotiating a single enterprise bargaining agreement (refer below) to standardise work conditions; and
• developing and refining the structure of the organisation and recruiting the necessary resources.
Seqwater has also substantially completed its procurement arrangements for external resources, including consultants and contractors. Seqwater continues to outsource many maintenance activities for its assets, usually with local suppliers. In most cases suppliers were providing similar services to the previous asset owner, and Seqwater has retained these contractors to ensure continuity in asset performance and retention of asset knowledge.
Seqwater inherited 14 different enterprise agreements which required 47 separate payroll runs. Seqwater has since consolidated these into a single enterprise agreement, with a single payroll.
The enterprise agreement process also provided for more standardised work hours and overtime arrangements, and included the establishment of a 38 hour week.
The standardisation achieved through a single enterprise agreement has allowed more streamlined systems to be implemented, reducing the implementation costs for the payroll system and enabling a reduction in the number of staff required to administer the payroll from seven to two.

2013 – 2017 IRRIGATION PRICING SUBMISSION TO QCA
SS Page 5 of 42
�
Seqwater’s current enterprise agreement, which was certified on 2 November 2009, will expire on 30 June 2012. Seqwater is now meeting with all unions in regards to a replacement agreement.
Key systems and processes
Seqwater also inherited a diverse range of systems and business processes from previous asset owners. Since 2008-09, Seqwater has given priority to developing its systems so that they can support the business and enable more streamlined business processes.
Seqwater is in the second year of using its Corporate Information System (CIS) and has completed a post implementation review across all modules. As a result, Seqwater is committed to a series of continuous improvements for better business performance.
Seqwater is continuing with its program of end-to-end process reviews to identify improvements and generate cost savings in performing its business support and related activities.
Asset management
Asset management practice within Seqwater does not distinguish between irrigation and non-irrigation assets. Assets are managed as a portfolio and not on an industry sector basis.
Seqwater acquired the Logan River Water Supply Scheme from SunWater Limited. While the physical assets were transferred, much of the asset history was not. The staff members who also transferred to Seqwater were mostly operations rather than maintenance staff. This meant that corporate asset management knowledge was not transferred along with the assets.
Seqwater’s maintenance and renewals program is evolving and moving towards industry best practice. However, this process is resource-intensive and relies on a long history of quality, consistent asset information before reaching full maturity.
Seqwater’s maintenance tasks and associated expenditure follows three broad categories:
• Scheduled maintenance – which relates to regular maintenance items that are planned in advance;
• Corrective maintenance – relating to maintenance that is made in reaction to events or new information/inspections during the year; and
• Strategic asset maintenance – which relates to asset replacements and renewals and involves a mix of operating and capital expenditure.

2013 – 2017 IRRIGATION PRICING SUBMISSION TO QCA
SS Page 6 of 42
�
Seqwater uses the Asset Management module within CIS to plan and schedule asset maintenance work. Work orders are produced on the system for each parcel of work required to be performed to capture the costs of performing the work.
Renewals and refurbishments are determined through a strategic asset management process. This process and its outcomes are documented in Facility Asset Management Plans (FAMPs), which are being rolled out across all assets. Irrigation assets are currently not as advanced in this process as the high-priority water treatment plants.
Procurement
Seqwater complies with the State Procurement Policy (SPP). Policies, procedures and processes consistent with, and supporting, the requirements of the SPP have been developed and are in operation. Where possible, procurement processes are system based using the Supply Chain Module in Seqwater’s Corporate Information System (CIS).
Procurement activities are undertaken at all business sites.
Seqwater’s Procurement Team monitors and analyses a range of performance indicators to identify opportunities to improve performance and minimise costs.
Seqwater is currently reviewing its “procure to pay” process to streamline the procurement of services and goods, management of delivery and payment for services.
Customer and Financial Management
Customer information management including invoicing and accounts receivable operations for the Scheme are carried out from Seqwater’s Karalee office. Financial management including financial reporting and accounts payable processing is centralised in Seqwater’s Finance group in the Margaret Street office. Accounts payable is carried out using the AP module in CIS.
Insurance
Seqwater’s portfolio of assets is insured with differing premium and deductible arrangements in place for bulk water and channel distribution systems. This requires specialist management of the insurances held, including management of claims and renewals and providing information to insurers and brokers.
Insurance premiums are obtained for a portfolio of Seqwater assets.
Although insurance premiums have not been allocated directly to schemes previously, these costs will be properly allocated to each WSS in future.

2013 – 2017 IRRIGATION PRICING SUBMISSION TO QCA
SS Page 7 of 42
�
2. Scheme details
The Scheme is located in the Logan River Basin and supplies bulk raw water to WAE in the nine zones that comprise the Scheme. The scheme stretches along a 101.4 km length of the Logan River and along 27 km of Burnett Creek. It was designed to supplement natural flows for the fertile alluvial areas along Burnett Creek and Logan River.
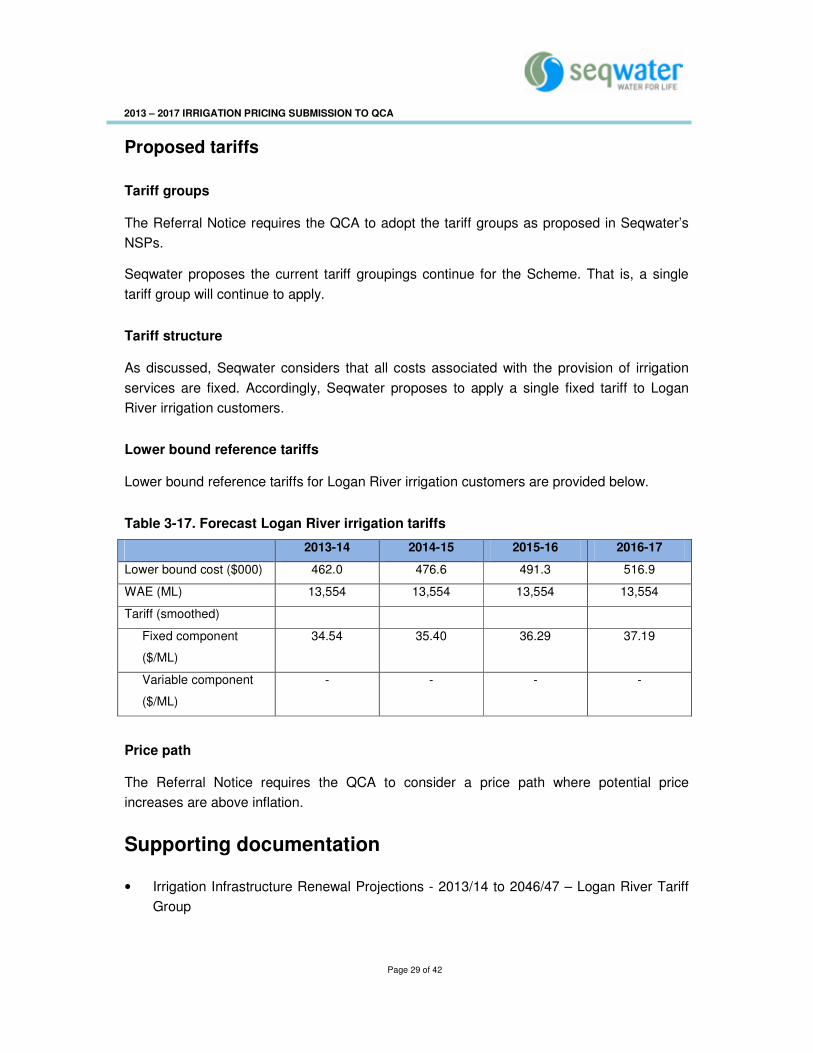
The Scheme was established following construction of Maroon Dam in 1974. Since that time, new storages were developed, namely Cedar Grove Weir, Bromelton Weir, South Maclean Weir and Bromelton Off-Stream Storage.
Most recently, Wyaralong Dam has been developed and a consultation process was commenced in 2010 to amend the ROP to include the Dam. The Dam was transferred to Seqwater in July 2011.
�

2013 – 2017 IRRIGATION PRICING SUBMISSION TO QCA
SS Page 8 of 42
Scheme map

2013 – 2017 IRRIGATION PRICING SUBMISSION TO QCA
SS Page 9 of 42
�
Infrastructure details
The table below sets out the bulk water assets that comprise the scheme.
Table 2-1. Bulk water assets
Dams Maroon Dam, Wyaralong Dam Weirs Cedar Grove Weir, Bromelton Weir, South Maclean Weir Off-stream storages Bromelton Off-Stream Storage. Other bulk water assets Gauging stations
Seqwater has excluded Wyaralong Dam from the scheme assets considered for irrigation pricing purposes, on the basis that:
• the dam was developed with the stated intention that it would provide water for future urban and industrial demands in SEQ; and
• it is not included in the water sharing rules for irrigation at this stage.
Also excluded are Bromelton Off-Stream Storage and Cedar Grove Weir as these are drought mitigation assets constructed for the water grid and not for irrigation purposes.
For details of the assets, see Appendix A
Customers and water entitlements serviced
The Scheme supplies water to:
• Irrigation users, comprising 136 customers who hold 13,554.5 ML of medium priority WAE;
• the SEQWGM, who holds 8,910 ML of high priority WAE; and
• Five other users (plus Seqwater), who together hold 946 ML of high priority WAE.�
The following charts illustrate the distribution of WAE amongst classes of customers.

2013 – 2017 IRRIGATION PRICING SUBMISSION TO QCA
SS Page 10 of 42
Figure 2-1. WAE Distribution�
There are two different types of WAE in the scheme being medium priority (MP) and high priority (HP). The following table sets out the ownership (as at 30 November 2011) of WAE in the Logan River WSS, by priority:
Table 2-2. Ownership of Entitlements
Type of WA holder No. of
Seqwater customers
MP Vol (ML)
HP Vol (ML)
Irrigation 136 13,552 -
MP Industrial 1 2.5 -
HP Industrial 5 - 936
Seqwater (QBWSA) 7 - 10
SEQWGM - - 8,910
Totals 149 13,554.5 9,856
Source: Logan Basin Resource Operations Plan which was approved by the Governor in Council in December 2009 and Seqwater’s customer information data.
Accordingly, irrigation WAE comprise 58% of all WAE issued in the Scheme.
Water availability and use
The announced allocation determines the percentage of nominal WAE volume that is available in a water year (1 July to 30 June). The following table sets out the announced allocation over the past four years for medium priority WAE.
Table 2-3. Announced allocations (%)
2003/04 2004/05 2005/06 2006/07 2007/08 2008/09 2009/10 2010/11 2011/12 HP 0-50 100 0 0 0-100 100 100 100 100 MP 0 10 0 0 0-90 95-100 100 100 100
���������
�� �� �
� ����
���� � �
��� � ��
����� �
������������� �� ����� ���������
��� ����!
��"� �
��#$ ����
�� �
��� ������� ������ ��������
� %���� ����!�
�� � ��

2013 – 2017 IRRIGATION PRICING SUBMISSION TO QCA
SS Page 11 of 42
The current irrigation price paths adopted a usage forecast of 55% of the nominal amount of MP WAEs, equivalent to 7,454ML/annum. The comparison of MP forecast usage to actual quarterly usage for the last 9 years is illustrated in the graph below.
Figure 2-2. Actual Usage 2002-11�
As can be seen from the graph above, the continuing drought conditions impacted the availability of water during 2004, and 2006 to 2008. The reduction in high priority usage from July, 2008 resulted from the transfer of Beaudesert Shire Council WAE to the SEQ Water Grid Manager under the SEQ water reforms.
Average annual usage comparison of Medium Priority water
The average annual usage comparison to MP forecast usage is set out in the table below:
Table 2-4. Forecast vs actual usage �
Forecast annual usage for 2006-11 price path 7,454 ML/annum Average actual annual usage for 2006-11 price path 2,707 ML/annum Average actual annual usage for 9 years to December 2011 3,267�ML/annum
�
��
���
��
����
� ��
����
� ��
��&'��
(�)'��
���'��
* �'��
��&'��
(�)'��
���'��
* �'��
��&'��
(�)'��
���'�
* �'�
��&'�
(�)'�
���'�"
* �'�"
��&'�"
(�)'�"
���'�+
* �'�+
��&'�+
(�)'�+
���'��
* �'��
��&'��
(�)'��
���'��
* �'��
��&'��
(�)'��
���'�
* �'�
��&'�
(�)'�
���'
* �'
��&'
(�)'
���������
� ��� , -��� .���)���� %�/����!���&��)��&����0 1 2 � %�/���������!���

2013 – 2017 IRRIGATION PRICING SUBMISSION TO QCA
SS Page 12 of 42
�
Temporary transfers
Temporary transfers or seasonal water assignments are useful for meeting additional short-term water needs. Under these transfers or assignments, some or all of the water that may be taken under a water entitlement in any water year can be assigned to another person or place.
In practice, a volume of water from the amount available under the entitlement may only be assigned after the announced allocation. The volume assigned is therefore not affected by any increase in the announced allocation during the water year, the benefits of which go to the holder of the entitlement and not the person to whom the water has been assigned.
The following table sets out the volumes of temporary transfers by year from 1July 2008 to 31 March 2012.
Table 2-5. Temporary transfers
Year 2008-09 2009-10 2010-11 2011-31/3/12 Volume in ML 201 126.5 302 21.8
Customer service standards
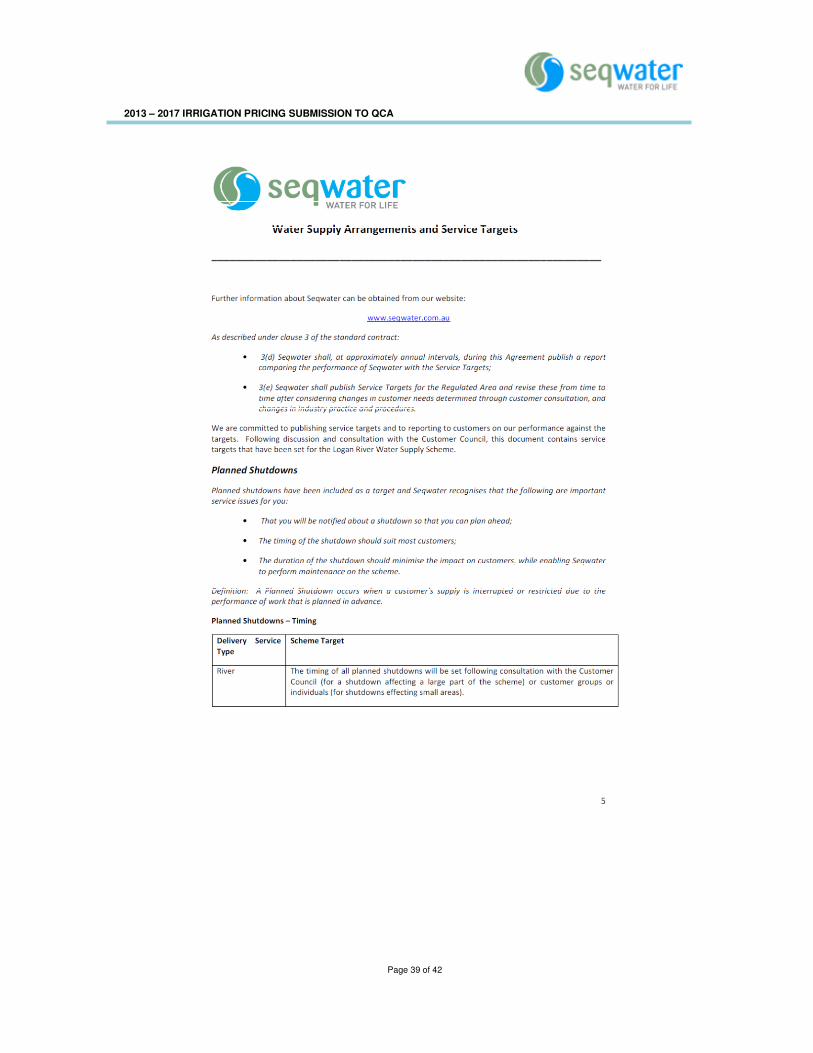
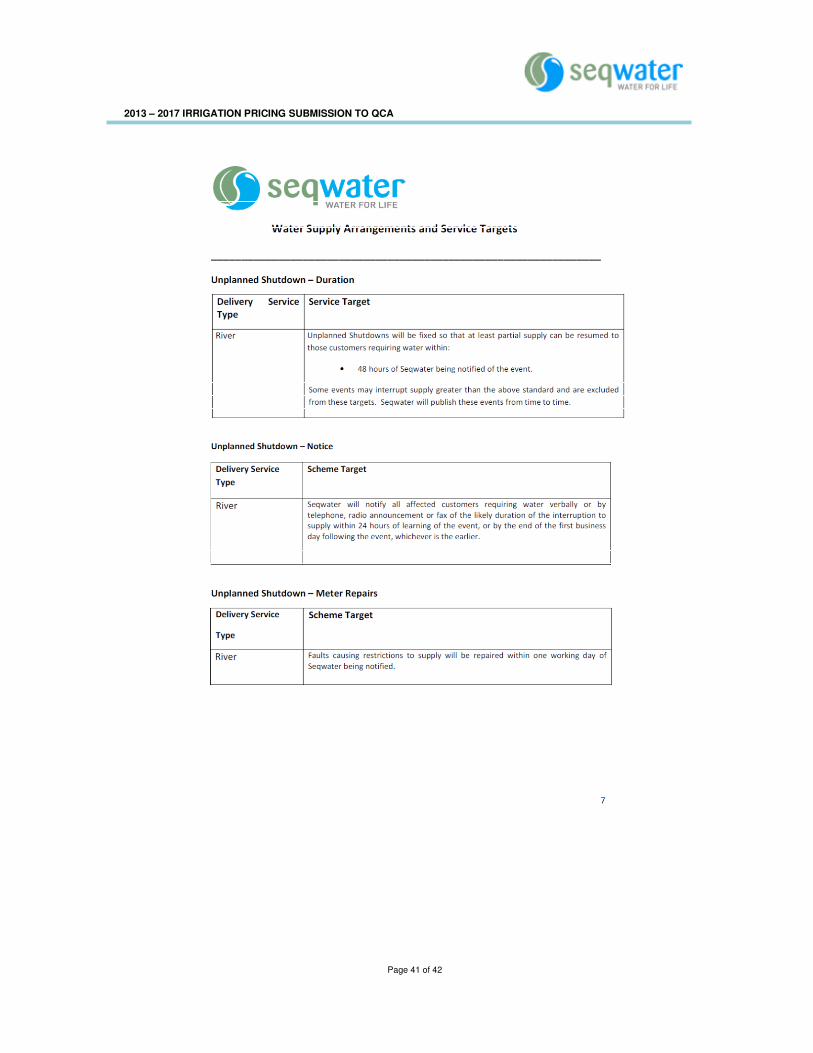
The current service standards were established in consultation with customer representatives in 2001 and were carried across to Seqwater from SunWater Limited. Although it is not intended that service standards should undergo major change during the price path period, they are to be periodically reviewed on an as-needs basis such as in response to requests by customer representatives or by Seqwater. This NSP is based on the existing service standards continuing throughout the regulatory 4 year period.
The document “Water Supply Arrangements and Service Targets” for Logan River is attached to this NSP in Appendix B. This document sets out the customer service standards for the Scheme.
2006 lower bound costs
The 2006 price review process conducted by SunWater with customer representatives established the lower bound cost for the Scheme. These lower bound costs are:
• Operations and maintenance costs;
• Administration costs, including a share of overhead; and
• The cost of asset renewals, via a renewals annuity.

2013 – 2017 IRRIGATION PRICING SUBMISSION TO QCA
SS Page 13 of 42
The five year average lower bound cost recovery target established for this Scheme was $306,669. The following table sets out the yearly targets and the five year average efficient lower bound costs:
Table 2-6. 2006 Lower Bound Costs
Current pricing arrangements
The current prices were set with reference to the lower bound cost target above. For this Scheme the current prices were found to be sufficient to recover the 2006 lower bound target.
In the 2006-11 irrigation price review, the Logan River Tier 2 group opted to retain the price cap arrangement in preference to a revenue cap. The Tier 2 group did not opt to take up a drought tariff option.
Prices were increased based on the Brisbane – All Groups Consumer Price Index (CPI) each year.
Prices in the 2006-11 irrigation price path were set to recover, at a minimum, efficient lower bound costs. No CSO was required.
The Scheme has only one nominated tariff group for 2013-14 to 2016-17 being River (including regulated section of Burnett Creek).
A two part tariff applied:
• Part A, a fixed charge payable per ML of nominal water entitlement (regardless of use); and
• Part B, which was a consumption charge.

2013 – 2017 IRRIGATION PRICING SUBMISSION TO QCA
SS Page 14 of 42
The table below shows the prices for the scheme since 2006-07 to 2011-12 in nominal terms.
Table 2-7. Historical Prices
Renewals accounting and forecast ARR balance
A renewals annuity approach applies to the current price paths, and is to continue to apply in accordance with the Ministerial Referral Notice.
The renewals annuity approach requires an accounting system to monitor renewals income and expenditure, to monitor the status of the renewals account or Asset Renewals Reserve (ARR). This balance can be either positive or negative, and is incorporated into the calculation of the renewals annuity itself. Interest is applied to the balance, at the same rate used to determine the original renewals annuity.
In order to calculate lower bound costs from 2013-14, a projected closing ARR balance at 30 June, 2013 must be made. This balance is forecast to be a negative balance (i.e. deficit) of $932,884.
In order to calculate the respective annuity balances, Seqwater has undertaken the following steps:
• Obtained relevant data for the water supply schemes from SunWater dating back to 2001 when the existing annuity balances were established;
• Established a closing balance at 30 June 2008 based on the renewals expenditure and income over the period the schemes were owned and managed by SunWater. Seqwater sought advice and guidance from SunWater to establish these balances;
• Established a closing balance at 30 June 2011 based on actual renewals expenditure and income since the schemes were transferred to Seqwater;

2013 – 2017 IRRIGATION PRICING SUBMISSION TO QCA
SS Page 15 of 42
�
• Forecast a closing balance at 30 June 2013 based on the budgeted renewals expenditure and irrigation income for the 2011-12 year and the estimated renewals income and expenditure for 2012-13; and
• The availability of data necessitated that the ARR balances be calculated on an irrigation only basis prior to being converted to whole of scheme balances for tariff calculation purposes. This approach was adopted to match the availability of data at the time of preparing the draft NSPs.
In calculating the closing ARR balance, Seqwater has:
• Obtained actual renewals expenditure from SunWater from 2000-01 to 2007-08 for the Scheme, and included actual expenditure following the transfer of the assets to Seqwater in the 2008-09 year for the period ending 2010-11. Renewals expenditure for 2011-12 and 2012-13 is a forecast only.
• Assigned the following percentages renewals expenditure to the irrigation sector, consistent with the cost allocation percentage used to develop irrigation’s share of lower bound costs for the 2006-07 to 2010-11 Irrigation Price Path. The 2011-12 and 2012-13 years have been based on the percentages applicable for the 2010-11 year.
Table 2-8. Irrigation Share of Renewals Expenditure applicable to the ARR (%)
Tariff Group 2006-07 2007-08 2008-09 2009-10 2010-11 2011-12 2012-13
Logan 99.8 99.8 99.8 99.8 99.8 99.8 99.8
• Obtained the actual irrigation revenue (including CSO) from SunWater for the period 2000-01 to 2007-08 inclusive, along with actual irrigation (including CSO) revenue from 2008-09 until 2010-11 from Seqwater’s accounting system. A budget forecast is used for 2011-12 and 2012-13.
• Assigned the following percentages of irrigation revenue (including CSO) to the ARR. This percentage reflects the percentage of the renewals annuity to the total lower bound cost recovery target set for the 2006-07 to 2010-11 Irrigation Price Path. The 2011-12 and 2012-13 years have been based on the percentages applicable for the 2010-11 year.
Table 2-9. Share of Irrigation Revenues applicable to the ARR (%)
Tariff Group 2006-07 2007-08 2008-09 2009-10 2010-11 2011-12 2012-13
Logan 9.4 9.3 9.3 9.2 9.3 9.3 9.3
• Applied interest to closing balances for the period 2006-07 to 2013-14 at the equivalent rate used to calculate the 2007-2011 price path annuities (7.76% nominal). No interest

2013 – 2017 IRRIGATION PRICING SUBMISSION TO QCA
SS Page 16 of 42
�
has been applied to balances between 2000-01 and 2005-06 based on advice from SunWater that the 2001-2006 price path made offsetting adjustments on the account that no interest would apply to ARR balances in that price path.
The following table sets out irrigation renewals expenditure and revenue and the annual change applicable to the ARR for the financial years 2006-07 to 2012-13:
Table 2-10. Annual Change in Irrigation ARR Balances ($)
Tariff
Group
Item 2006-07 2007-08 2008-09 2009-10 2010-11 2011-12 2012-13
Logan Expenditure 22,124 30,374 22,240 30,042 47,838 8,926 4,139
Revenue (21,221) (27,486) (27,769) (30,648) (26,599) (31,192) (33,045)
Change 904 2,888 (5,529) (606) 21,329 (22,265) (28,906)
3. Proposed lower bound costs and tariffs
Lower Bound costs
The following provides a summary of Seqwater’s proposed lower bound costs for the scheme over the 1 July 2013 to 30 June 2017 forecast period. Lower bound costs include operating and renewals costs. None of the costs vary proportional to water demand. That is, the short run marginal cost in this scheme is $0, and all costs are fixed.
In order to determine lower bound estimates for irrigation customers within the scheme, aggregate scheme costs are attributed to irrigation customers based on an assessment of storage that relates to irrigation entitlements.
Operating costs
Operating activities for this scheme include service provision, compliance, recreation, and other supporting activities:
• Service provision relates to:
− scheduling and releasing bulk water from storages, surveillance of water levels and flows in the river, and quarterly meter reading; and
− customer service and account management.
• Compliance requirements relates to:
− Requirements set out in the Resource Operations Plan (ROP) and Resource Operations Licence;

2013 – 2017 IRRIGATION PRICING SUBMISSION TO QCA
SS Page 17 of 42
�
− Dam safety obligations under the Water Act 2000;
− Environmental management obligations to comply with the ROP and Environmental Protection Act 1994; and
− Land management, workplace health and safety obligations and other reporting obligations.
• Recreation relates to the operation and maintenance of recreation facilities in the Cedar Pocket scheme; and
• Other supporting activities cover a range of services including central procurement, human resources and legal services.
Operating cost forecasting approach
Seqwater has adopted an approach to forecasting whereby operating expenditure for schemes is derived for a representative base year (2012-13) and escalated forward over each year of the regulatory period on the basis of predetermined escalation factors.
The 2012-13 year was adopted as the base year as it provides the best and most current representation of the costs required to deliver Seqwater’s service standards and obligations during the regulatory period. Aggregate operating costs for 2012-13 (including costs associated with both grid and irrigation services but excluding costs associated with unregulated activities) were derived as part of Seqwater’s 2012-13 grid service charges submission to the QCA. Seqwater has developed its 2012-13 budget on the basis of a zero base build-up, taking into account costs which could be reasonably anticipated at the time of budget development. In addition, the 2012-13 operating expenditure forecasts provided in the grid service charges submission have been reviewed by the QCA for prudency and efficiency.
Further details on the forecasting methodology are provided in the Irrigation Pricing submission provided to the QCA.
The following escalators have been applied to 2012-13 operating costs to derive forecasts for the regulatory period:
• direct labour, materials and contractors’ costs and repairs and maintenance were escalated at 4% per annum over the regulatory period; and
• ‘other’ direct costs and all non-direct costs were escalated at forecast CPI (2.5% per annum).
Details of the direct and non-direct operating expenditure forecasts for the Cedar Pocket scheme are provided below.

2013 – 2017 IRRIGATION PRICING SUBMISSION TO QCA
SS Page 18 of 42
�
Direct operating and maintenance costs
Direct costs are those costs that have been budgeted at the individual asset level.
Operations
Operations relates to the day-to-day costs of delivering water and meeting compliance obligations. The primary activities relate to dam operations and group support (and catchment management).
Dam operations are the largest contributor to direct operating costs. Dam Operations aims to deliver best practice management of dams and water sources while being fully compliant and effective in operating, maintaining and monitoring its water source infrastructure.
Dam operations must meet the regulatory requirements under various Acts including those relating to Dam Safety, Flood Management, Resource Operating Plans, and providing sufficient water to meet standards of service.
Dam operations is relatively labour intensive and expenditure is driven by:
• providing efficient service to irrigation customers in terms of information and management and delivery of service;
• developing robust and acceptable systems to monitor water flows to manage water sources, floods and regulations;
• developing an effective and technically capable and resilient flood operations centre utilising systems of quality standards;
• improving data management to ensure compliance on a wide variety of water management areas;
• ensuring security and safety at our water sources is meeting regulatory and community standards; and
• developing system operating plans to ensure the efficiency and operation of dams, weirs, bores and other water sources.
Group support (and catchment management) has responsibility for the development and delivery of recreation and catchment maintenance services for all operational assets. The team ensures that asset management plans, processes, systems and practices are implemented in accordance with relevant regulatory requirements.
In particular, Seqwater has responsibility for the ongoing management and maintenance of recreation sites transferred from SunWater. While the use of Seqwater assets for recreational purposes is secondary to Seqwater’s main function of water supply and

2013 – 2017 IRRIGATION PRICING SUBMISSION TO QCA
SS Page 19 of 42
�
treatment. However, recreation facilities must be managed in a sustainable and environmentally responsible manner to ensure that Seqwater’s core responsibilities and accountabilities are not adversely impacted.
Direct operations costs are presented in terms of the type of cost: labour; contractors and materials; and “other”.
• labour costs are derived on the basis of budgeted work in the scheme for 2012-13 and the related salary costs for routine activities. Consistent with the current Enterprise Bargaining Agreement for Seqwater and the recommendation of the QCA in its draft SunWater report, Seqwater has escalated internal labour costs at 4% per annum for the regulatory period 2013-14 to 2016-17;
• contractor and materials costs for 2012-13 are based on the quantities required in the work instructions for the scheme. As per the QCA’s draft SunWater report, contractor and material costs have been escalated at 4% per annum for the regulatory period; and
• “other” direct operating costs incorporate a range of expenses including plant and fleet hire, water quality monitoring expenses and fixed energy costs. These costs have been escalated at forecast CPI for the regulatory period.
Forecast operations costs are provided below.
Table 3-1. Forecast direct operations costs ($000)
Cost 2013-14 2014-15 2015-16 2016-17
Labour 408.8 425.2 442.2 459.9
Contractors and
materials 49.0 51.0 53.0 55.1
Other 99.3 101.8 104.3 106.9
TOTAL 557.1 577.9 599.5 621.9
Repairs and maintenance
Repairs and maintenance is performed at the scheme in accordance with Seqwater’s maintenance system. This system identifies the maintenance requirements for each asset, and then sets out a schedule for maintenance over the year(s) for that asset. In addition, maintenance requirements are developed through Facilities Asset Management Plans and as a result of scheduled inspections.
There is also unplanned maintenance which is required in response to asset breakdown or failure, or where new information emerges about asset condition (e.g. via regular

2013 – 2017 IRRIGATION PRICING SUBMISSION TO QCA
SS Page 20 of 42
�
inspections). Expenditure on unplanned maintenance for 2012-13 is derived based on past experience.
Seqwater have set a target ratio of 71:29 for planned maintenance to unplanned maintenance in 2012-13. This ratio has been applied for the forecast period.
Repairs and maintenance for 2012-13 has been escalated at 4% per annum over the regulatory period.
The table below presents a summary of forecast repairs and maintenance costs.
Table 3-2. Table XX. Forecast repairs and maintenance by expenditure type ($000)
Type 2013-14 2014-15 2015-16 2016-17
Planned 79.5 82.7 86.0 89.4
Unplanned 32.5 33.8 35.1 36.5
TOTAL 112.0 116.5 121.1 126.0
Dam safety inspections
Routine dam safety inspections are carried out to identify and plan maintenance requirements and to provide information for management planning of water delivery assets. These costs are included in forecast operations expenditure.
In addition, more thorough periodic dam safety inspections are carried out on a 5 yearly basis. Costs associated with these inspections have been added to forecast direct operating expenditure in the year in which the expenditure is expected to be incurred. Forecast dam safety inspections expenditure is provided below.
Table 3-3. Forecast dam safety inspections ($000)
Dam 2013-14 2014-15 2015-16 2016-17
Maroon 27.6
Total - - - 27.6
These inspections are based on the dam safety compliance requirements for the dams and the cost estimates are based on actual historic cost of inspection.
The table below presents consolidated forecast repairs and maintenance costs for the Cedar Pocket scheme.

2013 – 2017 IRRIGATION PRICING SUBMISSION TO QCA
SS Page 21 of 42
�
Table 3-4. Total repairs and maintenance forecast ($000)
Type 2013-14 2014-15 2015-16 2016-17
Planned 79.5 82.7 86.0 89.4
Unplanned 32.5 33.8 35.1 36.5
Dam safety
inspections
- - - 27.6
TOTAL 112.0 116.5 121.1 153.6
Rates
Seqwater incurs rates in relation to its land portfolio, including storages. Seqwater has forecast rates expenses for the Logan River scheme based on 2011-12 actual rates, and has forecast these to increase annually by CPI for the regulatory period.
Table 3-5. Forecast rates cost ($000)
Year 2013-14 2014-15 2015-16 2016-17
Cost 57.6 59.1 60.5 62.1
Metering
Consistent with the Referral Notice to the QCA, capital expenditure (renewals) costs for meter upgrades to meet national metering standards have been excluded. Similarly, operating costs associated with complying with the new standards have not been included in the cost estimates.
Non-direct costs
Non-direct costs are common costs which are not directly attributable to the operations and management of a specific scheme and include both indirect and overhead costs associated with the provision of corporate and other business services. In the absence of suitably disaggregated data at the project level, allocations of non-direct costs to renewals / capital expenditure were not examined. All non-direct costs were therefore allocated to operating expenditure only.
Non-direct costs for 2012-13 were derived at the aggregate level for all schemes and allocated to individual schemes based on the proportion of direct costs attributable to the individual scheme. These costs were then escalated forward to derive forecast non-direct costs for the regulatory period.
Non-direct costs are categorised by type of expenditure:

2013 – 2017 IRRIGATION PRICING SUBMISSION TO QCA
SS Page 22 of 42
�
• Water delivery includes non-direct costs associated with dam operations, infrastructure maintenance, environmental management and recreation and catchment maintenance services;
• Asset delivery costs are associated with project planning and managing the delivery of projects;
• Corporate costs include business services, organisational development and the office of the CEO. These include costs associated with the provision of IT services, finance, procurement, legal and risk, governance and compliance activities; and
• Other costs primarily reflect costs associated with the North Quay facilities and flood control centres.
As discussed, the Logan River scheme was allocated a portion of 2012-13 total business non-direct costs on the basis of direct costs attributable to the scheme. This estimate was escalated by CPI to derive forecasts for each year of the regulatory period.
Forecast non-direct operating costs are provided below.
Table 3-6. Forecast non-direct operating cost ($000)
Type 2013-14 2014-15 2015-16 2016-17
Water Delivery 70.8 72.6 74.4 76.2
Asset Delivery 31.6 32.4 33.2 34.0
Corporate 252.9 259.2 265.7 272.4
Other 21.6 22.1 22.6 23.2
TOTAL 376.8 386.3 395.9 405.8
In addition to non-direct operating costs, Seqwater has allocated costs to the Logan River scheme associated with the use of non-infrastructure assets, insurance and working capital.
Non-infrastructure assets
The Logan River scheme utilises a range of non-infrastructure assets (buildings and plant and equipment). These assets are not included in the renewals expenditure forecasts. However, it is necessary for costs associated with the use of these assets to be attributed to the Scheme. Seqwater has used depreciation costs as a proxy for the cost associated with use of these assets. However, these depreciation costs are not captured for the WSS. Accordingly, aggregate non-infrastructure depreciation for 2012-13 has been allocated to facilities on the basis of direct costs and escalated forward over the forecast period.

2013 – 2017 IRRIGATION PRICING SUBMISSION TO QCA
SS Page 23 of 42
�
Table xx provides a breakdown of forecast non-infrastructure asset costs allocated to the Logan River scheme over the forecast period.
Table 3-7. Forecast non-infrastructure operating cost ($000)
Year 2013-14 2014-15 2015-16 2016-17
Cost 31.5 32.3 33.1 33.9
Insurance
Seqwater’s annual insurance premium cost for 2012-13 is forecast at $6.96 million. The major components to the premium include industrial special risks, machinery breakdown, public liability, professional indemnity, contract works and directors and officers insurance.1
Seqwater is in the process of placing insurances, and proposes to update this forecast once new premiums are set.
Seqwater has allocated its 2012-13 premium to the Logan River scheme using the replacement value of scheme assets. This value has been escalated by CPI to determine a premium for each year of the forecast period. The table below shows the forecast premiums for the Logan River scheme.
Table 3-8. Forecast insurance cost ($000)
Year 2013-14 2014-15 2015-16 2016-17
Cost 166.9 171.1 175.3 179.7
Working capital
The QCA has already adopted a methodology for calculating Seqwater’s working capital in Grid Service Charges. Seqwater has calculated the working capital allowance using this methodology and the values submitted to the QCA for 2012-132, at $5.538M.
Seqwater has allocated a portion of this working capital allowance to the Logan River scheme on the basis of revenue attributable to the scheme. The 2012-13 working capital allowance has then been escalated by CPI to provide a forecast for each year of the regulatory period.
������������������������������������������������������
��� ������������ ��������������� ��������� �� ������������������������������ ��� ������������������������������ ����������� ������������� � ������������������������ ��� ����������� ������ ���� ���������� ��� �� ���!"�#������������$%��!"����%&'�%(�
$�� ���������$%�$!"���)&�

2013 – 2017 IRRIGATION PRICING SUBMISSION TO QCA
SS Page 24 of 42
�
Table 3-9. Forecast working capital ($000)
Year 2013-14 2014-15 2015-16 2016-17
Cost 11.1 11.3 11.6 11.9
Total operating costs for the forecast period are provided below.
Table 3-10. Total operating cost forecast ($000)
Cost 2013-14 2014-15 2015-16 2016-17
Direct
Operations 557.1 577.9 599.5 621.9
Repairs and
maintenance
112.0 116.5 121.1 126.0
Dam safety - - - 27.6
Rates 57.6 59.1 60.5 62.1
Non-direct - - - -
Operations 376.8 386.3 395.9 405.8
Non-
infrastructure
31.5 32.3 33.1 33.9
Insurance 166.9 171.1 175.3 179.7
Working capital 11.1 11.3 11.6 11.9
Total 1,313.0 1,354.4 1,397.1 1,468.9
Revenue offsets
Seqwater receives revenue from other sources, including property leases, recreation fees and the provision of town water supplies. The estimated revenue from these sources for the Logan River scheme for the regulatory period is provided in Table xx. These forecasts are based on expected revenue received in 2012-13 escalated by CPI for the regulatory period.
Table 3-11. Forecast revenue offset ($000)
Year 2013-14 2014-15 2015-16 2016-17
Revenue 25.0 25.6 26.2 26.9
To ensure that Seqwater is not overcompensated for the provision of services, this revenue has been removed from the estimate of scheme costs for the regulatory period.

2013 – 2017 IRRIGATION PRICING SUBMISSION TO QCA
SS Page 25 of 42
�
Renewals
The renewals outlays for the irrigation schemes consist of the same cost elements as their operating costs, namely direct labour, materials and contractors’ services, other direct costs (such as rates and land taxes) and miscellaneous administrative costs and non-direct (indirect and overhead) costs.
Seqwater has adopted the same rates for escalation of renewals expenditure as for operating expenditure.
Accordingly, renewal expenditure has been escalated for direct labour, materials and contractors costs at 4% per annum for the years 2013-14 to 2016-17 and forecast inflation thereafter for the remainder of the planning period. All other direct costs and non-direct costs are escalated at forecast inflation for both the regulatory period and the remainder of the planning period.
Inflation is forecast to increase at 2.5% per annum over the forecast period and beyond.
Renewals forecast
Seqwater has proposed a rolling 20 year renewals annuity, consistent with the approach adopted for SunWater’s irrigation pricing in the QCA’s draft report.
Seqwater has defined renewals as non-maintenance expenditure that is required to maintain the service capacity of the assets.
Seqwater has based its renewals forecast on the more significant and predictable renewals expenditure items. Seqwater has not attempted to include minor renewals projects (less than $10,000), or renewals on water treatment plants at recreation areas, or make any allowance or contingency for renewals expenditure arising from damage or changes in law. This approach has been adopted to focus the renewals forecasting effort on more material items of expenditure.
Seqwater identified renewals needs and the schedule of projects through a range of processes, including:
• the existing Facility Asset Management Plans (FAMPs);
• the existing asset maintenance program;
• reports from site safety inspections and dam safety management program; and
• advice from operators.
Seqwater then evaluated potential projects against criticality and other criteria, and conducted workshops with local staff as well as site inspections to validate and adjust the�
2013 – 2017 IRRIGATION PRICING SUBMISSION TO QCA
SS Page 26 of 42
scope and timing of projects. In many cases, Seqwater has revised the timing of major renewals jobs to a later time where there was not sufficient evidence that the asset required renewal, or renewal of the asset could be deferred at an acceptable risk of failing to meet service standards or compliance obligations.
Forecast renewals expenditure for the regulatory period is provided below.�
Table 3-12. Forecast renewals expenditure to 2016-17 ($2012-13, $000)
2013-14 2014-15 2015-16 2016-17
Renewals expenditure 165.0 15.0 - -
This excludes any dam safety or meter upgrade expenditure, in accordance with the Referral Notice.
The figure below shows the long term renewals profile over a 24 year period.
Figure 3-1: Logan River renewals profile ($2012-13)
The major projects that have a material 10% impact on the annuity are described below:
-
50
100
150
200
250
300
350
$000

2013 – 2017 IRRIGATION PRICING SUBMISSION TO QCA
SS Page 27 of 42
�
Table 3-13. Major renewals projects
Asset Description of Work Timing of
Work
Project
Value
$’000
Significance*
Bromelton Weir Refurbish valve 2014-15 5 HAV
Maroon Dam Replace Piezometer Hut 2014-15 10 HAV
* HAV – Higher than Average Value (for period from 2013/14 to 2016/17) IA – Project has an impact on the annuity of greater than 10%
Total Lower Bound Costs
The total lower bound costs for the Logan River scheme are set out in the table below.
Table 3-14. Total Lower Bound costs ($000)
Cost 2013-14 2014-15 2015-16 2016-17
Direct operations* 589.7 611.4 633.8 684.6
Repairs and maintenance
112.0 116.5 121.1 126.0
Non-direct opex** 586.3 601.0 616.0 631.4
Renewals annuity 163.3 168.3 170.9 173.5
TOTAL 1,451.3 1,497.1 1,541.8 1,615.5
* Incorporates revenue offset ** Incorporates operations, non-infrastructure costs, insurance and working capital.
Cost allocation to irrigation
Seqwater proposes that renewals and maintenance costs are allocated to irrigation using the Headworks Utilisation Factor (HUF). Seqwater commissioned Parsons Brinckerhoff (PB) to calculate the HUF percentage for the scheme, using the methodology endorsed by the QCA for irrigation pricing in SunWater schemes.
PB calculated a HUF for medium priority customers of 16%.
The balance of costs have been allocated to the irrigation sector based on a 50:50 split between the HUF (16%) and the nominal ML entitlements attributable to medium priority customers (57.9%).
The table below presents the outcomes of this sector cost allocation.

2013 – 2017 IRRIGATION PRICING SUBMISSION TO QCA
SS Page 28 of 42
�
Table 3-15. Total Lower Bound costs allocated to irrigation sector ($000)
Cost 2013-14 2014-15 2015-16 2016-17
Direct operations* 223.8 232.0 240.5 259.8
Repairs and maintenance 20.2 21.0 21.8 22.7
Non-direct opex** 188.6 193.3 198.2 203.1
Renewals annuity 29.4 30.3 30.8 31.2
Distribution losses - - - -
TOTAL 462.0 476.6 491.3 516.9
* Incorporates revenue offset ** Incorporates operations, non-infrastructure costs, insurance and working capital.
A comparison against the lower bound costs allocated to irrigation in the SunWater 2006 Irrigation Pricing Review is provided below. To facilitate comparison with Seqwater’s forecast costs, SunWater’s 2010-11 lower bound cost estimates have been indexed forward to $2013-14 by actual and forecast inflation.
Table 3-16. Total Lower Bound Costs allocated to irrigation sector ($000)
Lower bound cost
SunWater
2006 LBC
($2013-14)
2013-14 2014-15 2015-16 2016-17
358.0 462.0 476.6 491.3 516.9
While indicative, the lower bound cost benchmarks developed for the 2006 SunWater Irrigation Price Review are not directly comparable to the Seqwater forecasts. In particular, the published SunWater cost information:
• provides aggregate operations, maintenance and administration data, with no breakdown between direct and non-direct costs; and
• applies a productivity adjustment to proposed lower bound costs, but does not identify the adjustment attributable to operating expenditure.
Moreover, these lower bound costs were developed more than 6 years ago and amidst very different conditions. While comparisons between the 2006 benchmarks may be of interest where data is disaggregated, there is little value in attempting to explain departures from the 2006 data given Seqwater had no input to these forecasts and did not have (due to circumstances surrounding its formation) the financial systems to gather and report this data in any case.
2013 – 2017 IRRIGATION PRICING SUBMISSION TO QCA
SS Page 29 of 42
�
Proposed tariffs
Tariff groups
The Referral Notice requires the QCA to adopt the tariff groups as proposed in Seqwater’s NSPs.
Seqwater proposes the current tariff groupings continue for the Scheme. That is, a single tariff group will continue to apply.
Tariff structure
As discussed, Seqwater considers that all costs associated with the provision of irrigation services are fixed. Accordingly, Seqwater proposes to apply a single fixed tariff to Logan River irrigation customers.
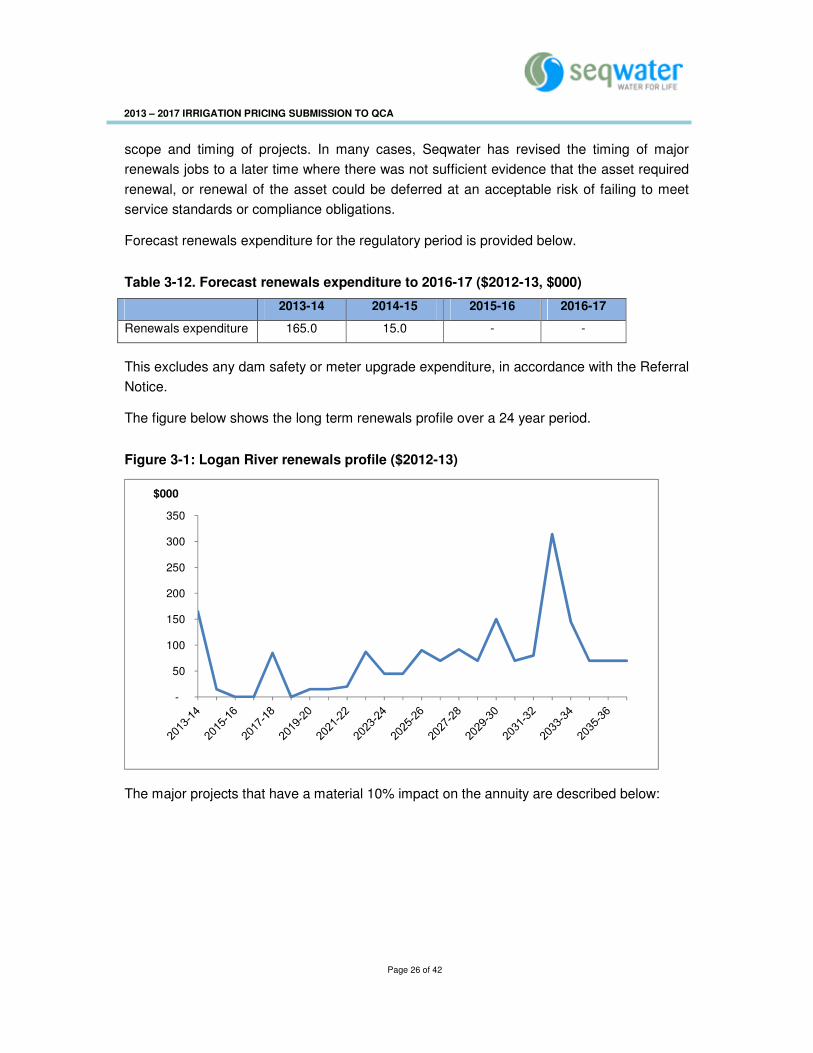
Lower bound reference tariffs
Lower bound reference tariffs for Logan River irrigation customers are provided below.
Table 3-17. Forecast Logan River irrigation tariffs
2013-14 2014-15 2015-16 2016-17
Lower bound cost ($000) 462.0 476.6 491.3 516.9
WAE (ML) 13,554 13,554 13,554 13,554
Tariff (smoothed)
Fixed component
($/ML)
34.54 35.40 36.29 37.19
Variable component
($/ML)
- - - -
Price path
The Referral Notice requires the QCA to consider a price path where potential price increases are above inflation.
Supporting documentation
• Irrigation Infrastructure Renewal Projections - 2013/14 to 2046/47 – Logan River Tariff Group
�

2013 – 2017 IRRIGATION PRICING SUBMISSION TO QCA
SS Page 30 of 42
Appendix A – Asset details

2013 – 2017 IRRIGATION PRICING SUBMISSION TO QCA
SS Page 31 of 42
2013 – 2017 IRRIGATION PRICING SUBMISSION TO QCA
SS Page 32 of 42

2013 – 2017 IRRIGATION PRICING SUBMISSION TO QCA
SS Page 33 of 42

2013 – 2017 IRRIGATION PRICING SUBMISSION TO QCA
SS Page 34 of 42

2013 – 2017 IRRIGATION PRICING SUBMISSION TO QCA
SS Page 35 of 42
Appendix B – Customer service standards

2013 – 2017 IRRIGATION PRICING SUBMISSION TO QCA
SS Page 36 of 42

2013 – 2017 IRRIGATION PRICING SUBMISSION TO QCA
SS Page 37 of 42

2013 – 2017 IRRIGATION PRICING SUBMISSION TO QCA
SS Page 38 of 42
2013 – 2017 IRRIGATION PRICING SUBMISSION TO QCA
SS Page 39 of 42

2013 – 2017 IRRIGATION PRICING SUBMISSION TO QCA
SS Page 40 of 42
2013 – 2017 IRRIGATION PRICING SUBMISSION TO QCA
SS Page 41 of 42

2013 – 2017 IRRIGATION PRICING SUBMISSION TO QCA
SS Page 42 of 42