Embed Size (px)
Citation preview
Logan City Council Executive Financial Performance Report For the Month of September 2011
Doc #7258238 1
LOGAN CITY COUNCIL EXECUTIVE FINANCIAL PERFORMANCE REPORT
For the period ended 30 September 2011
INDEX Page No.
Chief Financial Officer's Comments 3-4 Key Performance Indicators 5 Budget Overview by:-
Council 6-7
Capital Schedules by:-
Key Capital Projects 8-9 Key Budget Success Factors:
Significant Items of Operating Revenue 10
Rates and Accounts Receivable Analysis 11 Rates and Charges Statistics 12 Sundry Debtors Age Analysis 13-15 Cash and Investment Performance 16 Financial Ratio Analysis 17
Adopted Budget Template 18
Balance Sheet and Cash Flow Statement 19

Logan City /Council Executive Financial Performance Report For the Month of September 2011
Doc #7258238 2
Logan City /Council Executive Financial Performance Report For the Month of September 2011
Doc #7258238 3
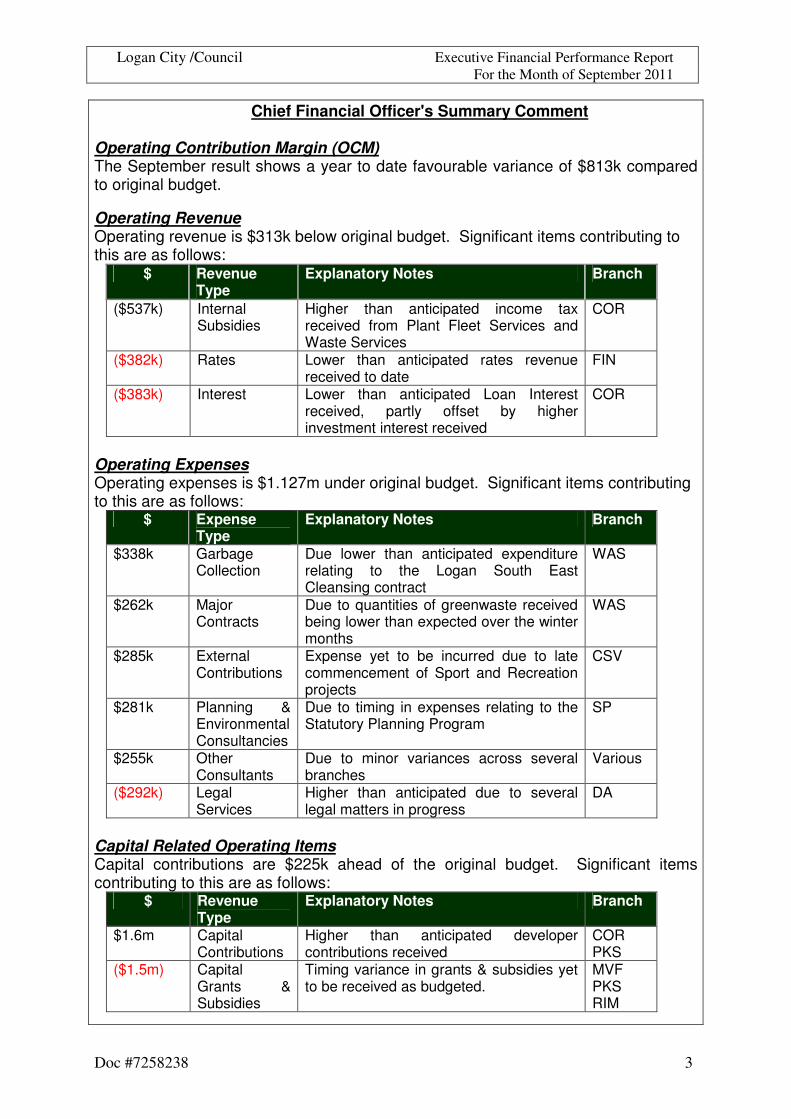
Chief Financial Officer's Summary Comment
Operating Contribution Margin (OCM) The September result shows a year to date favourable variance of $813k compared to original budget. Operating Revenue Operating revenue is $313k below original budget. Significant items contributing to this are as follows:
$ Revenue Type
Explanatory Notes Branch
($537k) Internal Subsidies
Higher than anticipated income tax received from Plant Fleet Services and Waste Services
COR
($382k) Rates Lower than anticipated rates revenue received to date
FIN
($383k) Interest Lower than anticipated Loan Interest received, partly offset by higher investment interest received
COR
Operating Expenses Operating expenses is $1.127m under original budget. Significant items contributing to this are as follows:
$ Expense Type
Explanatory Notes Branch
$338k Garbage Collection
Due lower than anticipated expenditure relating to the Logan South East Cleansing contract
WAS
$262k Major Contracts
Due to quantities of greenwaste received being lower than expected over the winter months
WAS
$285k External Contributions
Expense yet to be incurred due to late commencement of Sport and Recreation projects
CSV
$281k Planning & Environmental Consultancies
Due to timing in expenses relating to the Statutory Planning Program
SP
$255k Other Consultants
Due to minor variances across several branches
Various
($292k) Legal Services
Higher than anticipated due to several legal matters in progress
DA
Capital Related Operating Items Capital contributions are $225k ahead of the original budget. Significant items contributing to this are as follows:
$ Revenue Type
Explanatory Notes Branch
$1.6m Capital Contributions
Higher than anticipated developer contributions received
COR PKS
($1.5m) Capital Grants & Subsidies
Timing variance in grants & subsidies yet to be received as budgeted.
MVF PKS RIM
Logan City /Council Executive Financial Performance Report For the Month of September 2011
Doc #7258238 4
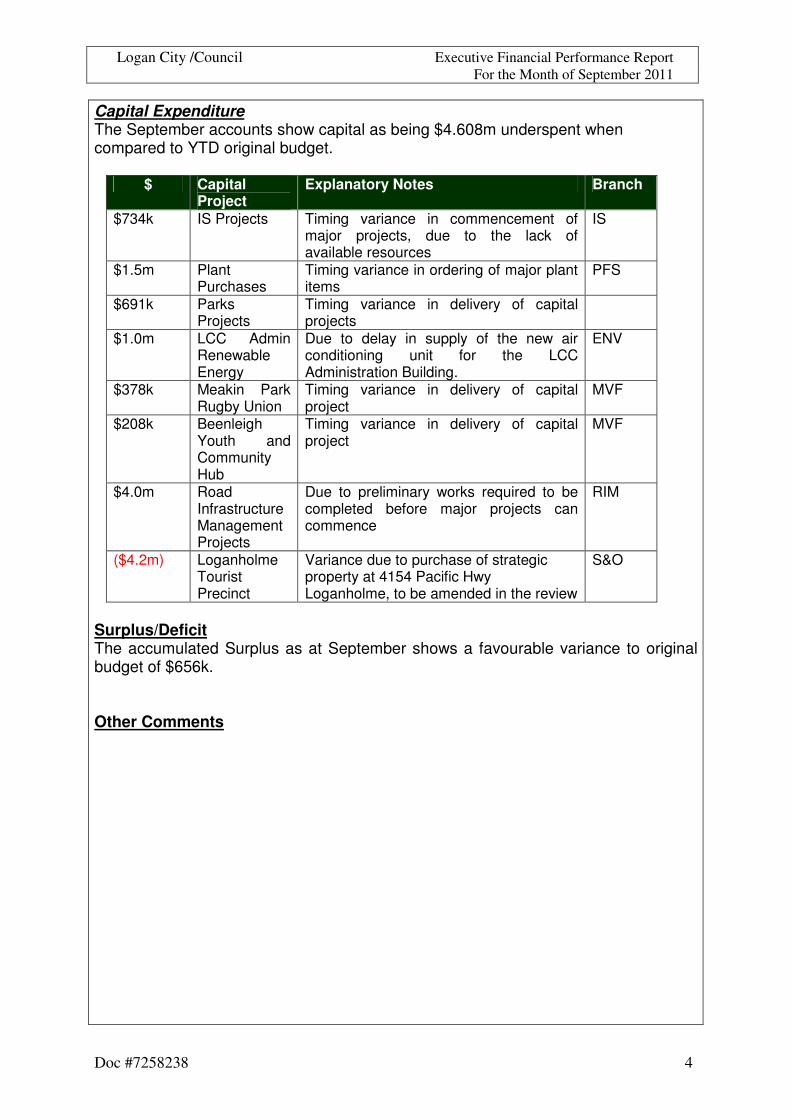
Capital Expenditure The September accounts show capital as being $4.608m underspent when compared to YTD original budget.
$ Capital Project
Explanatory Notes Branch
$734k IS Projects Timing variance in commencement of major projects, due to the lack of available resources
IS
$1.5m Plant Purchases
Timing variance in ordering of major plant items
PFS
$691k Parks Projects
Timing variance in delivery of capital projects
$1.0m LCC Admin Renewable Energy
Due to delay in supply of the new air conditioning unit for the LCC Administration Building.
ENV
$378k Meakin Park Rugby Union
Timing variance in delivery of capital project
MVF
$208k Beenleigh Youth and Community Hub
Timing variance in delivery of capital project
MVF
$4.0m Road Infrastructure Management Projects
Due to preliminary works required to be completed before major projects can commence
RIM
($4.2m) Loganholme Tourist Precinct
Variance due to purchase of strategic property at 4154 Pacific Hwy Loganholme, to be amended in the review
S&O
Surplus/Deficit The accumulated Surplus as at September shows a favourable variance to original budget of $656k. Other Comments
Logan City /Council Executive Financial Performance Report For the Month of September 2011
Doc #7258238 5
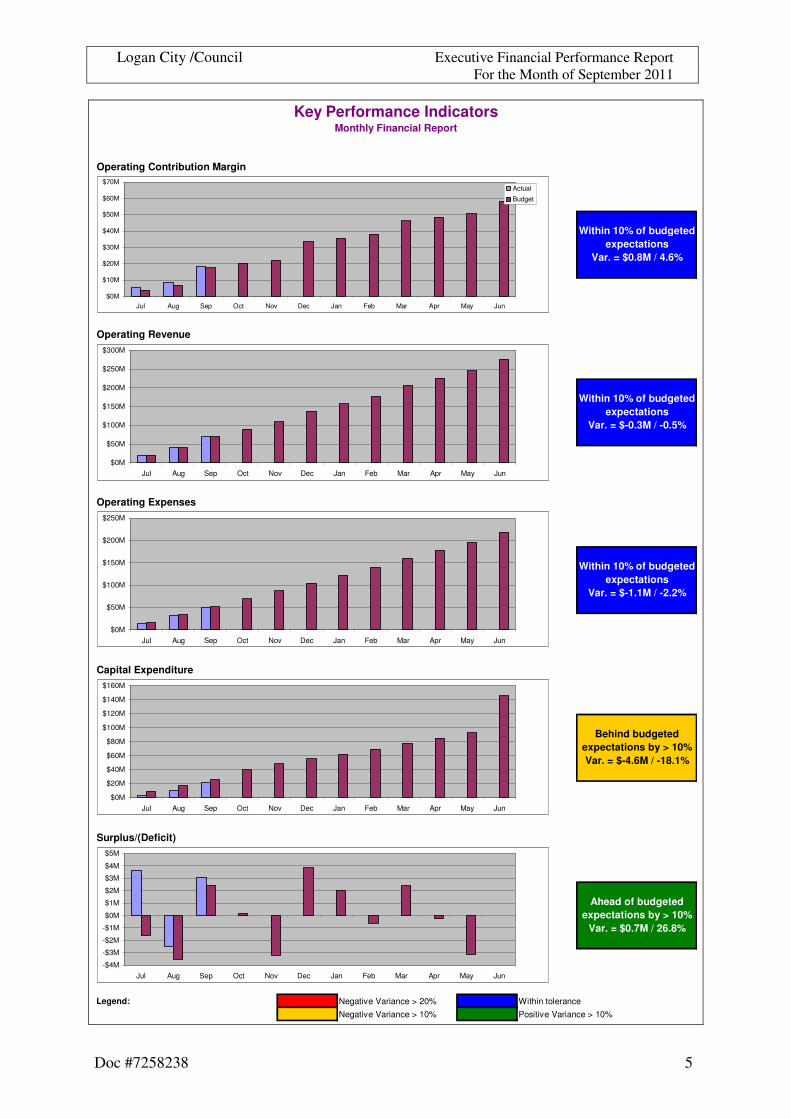
Key Performance IndicatorsMonthly Financial Report
Operating Contribution Margin
Operating Revenue
Operating Expenses
Capital Expenditure
Surplus/(Deficit)
Legend: Negative Variance > 20% Within toleranceNegative Variance > 10% Positive Variance > 10%
Ahead of budgeted expectations by > 10%
Var. = $0.7M / 26.8%
Within 10% of budgeted expectations
Var. = $0.8M / 4.6%
Within 10% of budgeted expectations
Var. = $-0.3M / -0.5%
Within 10% of budgeted expectations
Var. = $-1.1M / -2.2%
Behind budgeted expectations by > 10%Var. = $-4.6M / -18.1%
$0M
$10M
$20M
$30M
$40M
$50M
$60M
$70M
Jul Aug Sep Oct Nov Dec Jan Feb Mar Apr May Jun
Actual
Budget
$0M
$50M
$100M
$150M
$200M
$250M
$300M
Jul Aug Sep Oct Nov Dec Jan Feb Mar Apr May Jun
$0M
$50M
$100M
$150M
$200M
$250M
Jul Aug Sep Oct Nov Dec Jan Feb Mar Apr May Jun
$0M
$20M
$40M
$60M
$80M
$100M
$120M
$140M
$160M
Jul Aug Sep Oct Nov Dec Jan Feb Mar Apr May Jun
-$4M
-$3M
-$2M
-$1M
$0M
$1M
$2M
$3M
$4M
$5M
Jul Aug Sep Oct Nov Dec Jan Feb Mar Apr May Jun
Logan City /Council Executive Financial Performance Report For the Month of September 2011
Doc #7258238 6
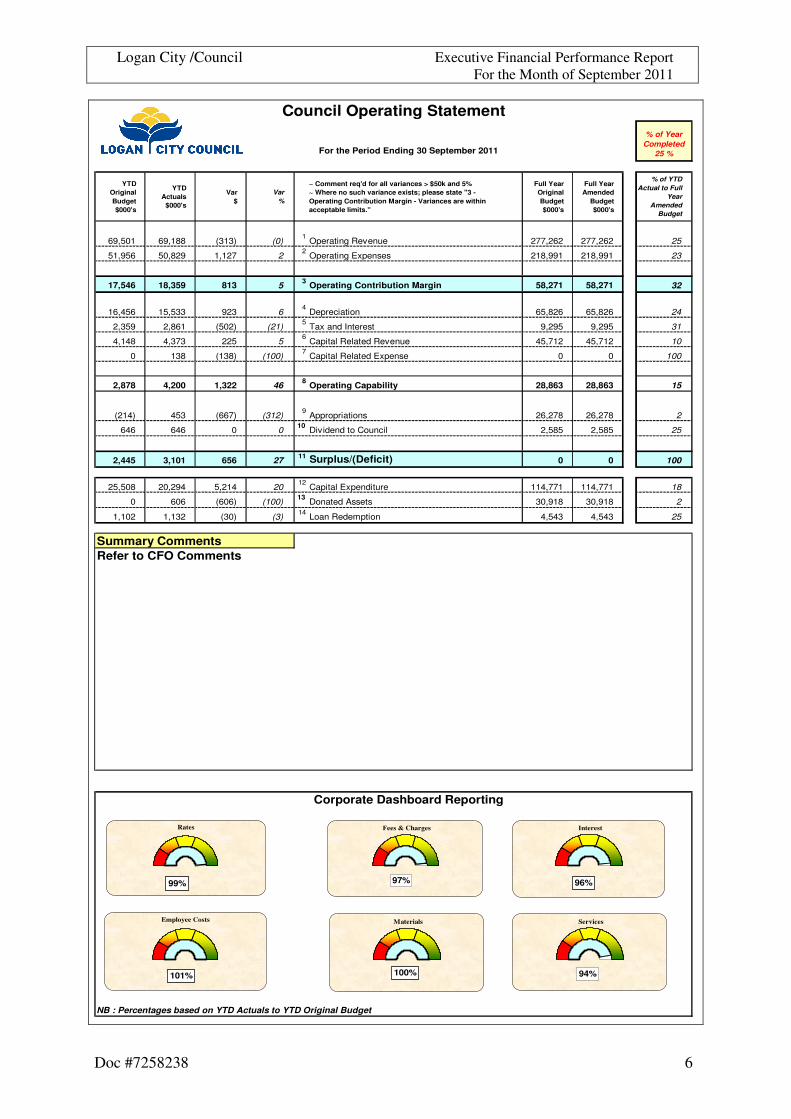
For the Period Ending 30 September 2011
YTD Original Budget $000's
YTD Actuals
$000's
Var $
Var %
~ Comment req'd for all variances > $50k and 5%~ Where no such variance exists; please state "3 - Operating Contribution Margin - Variances are within acceptable limits."
Full Year Original Budget $000's
Full Year Amended
Budget $000's
% of YTD Actual to Full
Year Amended
Budget
69,501 69,188 (313) (0)1
Operating Revenue 277,262 277,262 25
51,956 50,829 1,127 22
Operating Expenses 218,991 218,991 23
17,546 18,359 813 5 3 Operating Contribution Margin 58,271 58,271 32
16,456 15,533 923 64
Depreciation 65,826 65,826 24
2,359 2,861 (502) (21)5
Tax and Interest 9,295 9,295 31
4,148 4,373 225 56
Capital Related Revenue 45,712 45,712 10
0 138 (138) (100)7
Capital Related Expense 0 0 100
2,878 4,200 1,322 46 8 Operating Capability 28,863 28,863 15
(214) 453 (667) (312)9
Appropriations 26,278 26,278 2
646 646 0 0 10 Dividend to Council 2,585 2,585 25
2,445 3,101 656 27 11 Surplus/(Deficit) 0 0 100
25,508 20,294 5,214 2012
Capital Expenditure 114,771 114,771 18
0 606 (606) (100) 13 Donated Assets 30,918 30,918 2
1,102 1,132 (30) (3) 14 Loan Redemption 4,543 4,543 25
Corporate Dashboard Reporting
NB : Percentages based on YTD Actuals to YTD Original Budget
Refer to CFO Comments
Council Operating Statement
Summary Comments
% of Year Completed
25 %
Rates Fees & Charges
97%
Employee Costs
101%
Materials
100%
Interest
Services
94%
96%99%
Logan City /Council Executive Financial Performance Report For the Month of September 2011
Doc #7258238 7
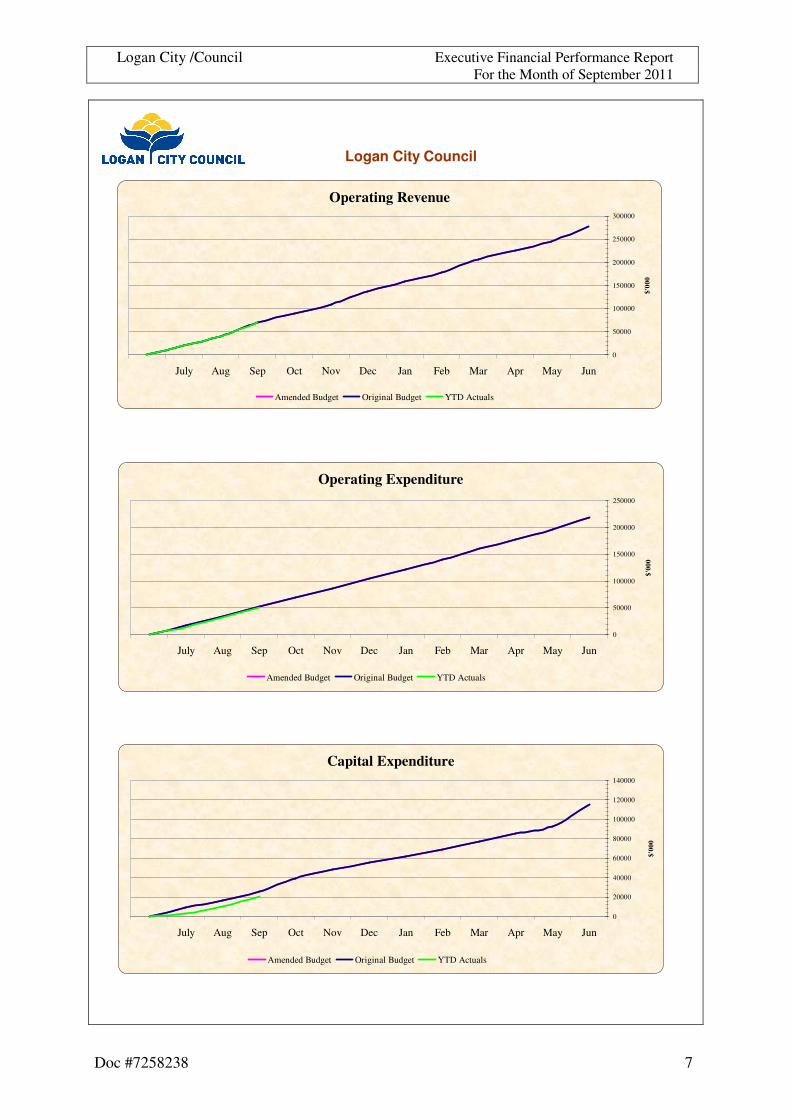
Logan City Council
Operating Revenue
0
50000
100000
150000
200000
250000
300000
July Aug Sep Oct Nov Dec Jan Feb Mar Apr May Jun
$'00
0
Amended Budget Original Budget YTD Actuals
Operating Expenditure
0
50000
100000
150000
200000
250000
July Aug Sep Oct Nov Dec Jan Feb Mar Apr May Jun$'
000
Amended Budget Original Budget YTD Actuals
Capital Expenditure
0
20000
40000
60000
80000
100000
120000
140000
July Aug Sep Oct Nov Dec Jan Feb Mar Apr May Jun
$'00
0
Amended Budget Original Budget YTD Actuals
Logan City Council Executive Financial Performance Report For the Month of September 2011
8
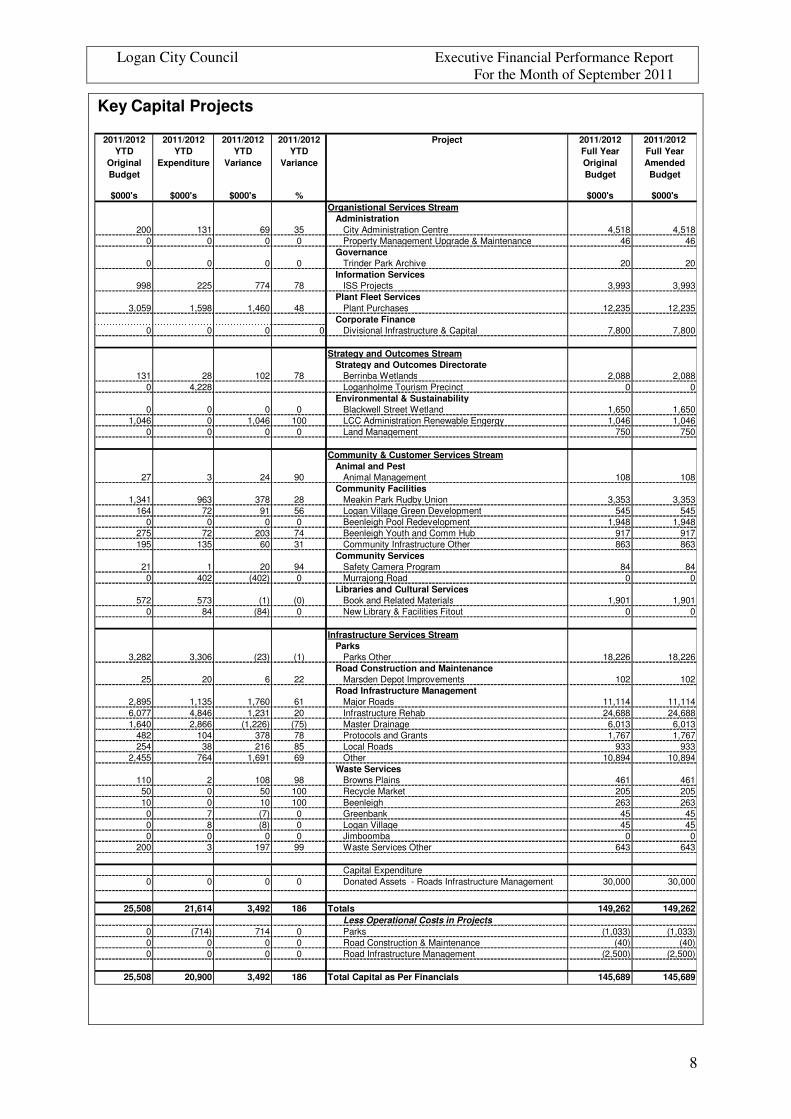
Key Capital Projects
2011/2012YTD
Original Budget
2011/2012YTD
Expenditure
2011/2012YTD
Variance
2011/2012YTD
Variance
Project 2011/2012Full YearOriginal Budget
2011/2012Full YearAmended Budget
$000's $000's $000's % $000's $000'sOrganistional Services Stream
Administration200 131 69 35 City Administration Centre 4,518 4,518
0 0 0 0 Property Management Upgrade & Maintenance 46 46Governance
0 0 0 0 Trinder Park Archive 20 20Information Services
998 225 774 78 ISS Projects 3,993 3,993Plant Fleet Services
3,059 1,598 1,460 48 Plant Purchases 12,235 12,235Corporate Finance
0 0 0 0 Divisional Infrastructure & Capital 7,800 7,800
Strategy and Outcomes StreamStrategy and Outcomes Directorate
131 28 102 78 Berrinba Wetlands 2,088 2,0880 4,228 Loganholme Tourism Precinct 0 0
Environmental & Sustainability0 0 0 0 Blackwell Street Wetland 1,650 1,650
1,046 0 1,046 100 LCC Administration Renewable Engergy 1,046 1,0460 0 0 0 Land Management 750 750
Community & Customer Services StreamAnimal and Pest
27 3 24 90 Animal Management 108 108Community Facilities
1,341 963 378 28 Meakin Park Rudby Union 3,353 3,353164 72 91 56 Logan Village Green Development 545 545
0 0 0 0 Beenleigh Pool Redevelopment 1,948 1,948275 72 203 74 Beenleigh Youth and Comm Hub 917 917195 135 60 31 Community Infrastructure Other 863 863
Community Services21 1 20 94 Safety Camera Program 84 840 402 (402) 0 Murrajong Road 0 0
Libraries and Cultural Services572 573 (1) (0) Book and Related Materials 1,901 1,901
0 84 (84) 0 New Library & Facilities Fitout 0 0
Infrastructure Services StreamParks
3,282 3,306 (23) (1) Parks Other 18,226 18,226Road Construction and Maintenance
25 20 6 22 Marsden Depot Improvements 102 102Road Infrastructure Management
2,895 1,135 1,760 61 Major Roads 11,114 11,1146,077 4,846 1,231 20 Infrastructure Rehab 24,688 24,6881,640 2,866 (1,226) (75) Master Drainage 6,013 6,013
482 104 378 78 Protocols and Grants 1,767 1,767254 38 216 85 Local Roads 933 933
2,455 764 1,691 69 Other 10,894 10,894Waste Services
110 2 108 98 Browns Plains 461 46150 0 50 100 Recycle Market 205 20510 0 10 100 Beenleigh 263 2630 7 (7) 0 Greenbank 45 450 8 (8) 0 Logan Village 45 450 0 0 0 Jimboomba 0 0
200 3 197 99 Waste Services Other 643 643
Capital Expenditure0 0 0 0 Donated Assets - Roads Infrastructure Management 30,000 30,000
25,508 21,614 3,492 186 Totals 149,262 149,262Less Operational Costs in Projects
0 (714) 714 0 Parks (1,033) (1,033)0 0 0 0 Road Construction & Maintenance (40) (40)0 0 0 0 Road Infrastructure Management (2,500) (2,500)
25,508 20,900 3,492 186 Total Capital as Per Financials 145,689 145,689
Logan City /Council Executive Financial Performance Report For the Month of September 2011
Doc #7258238 9
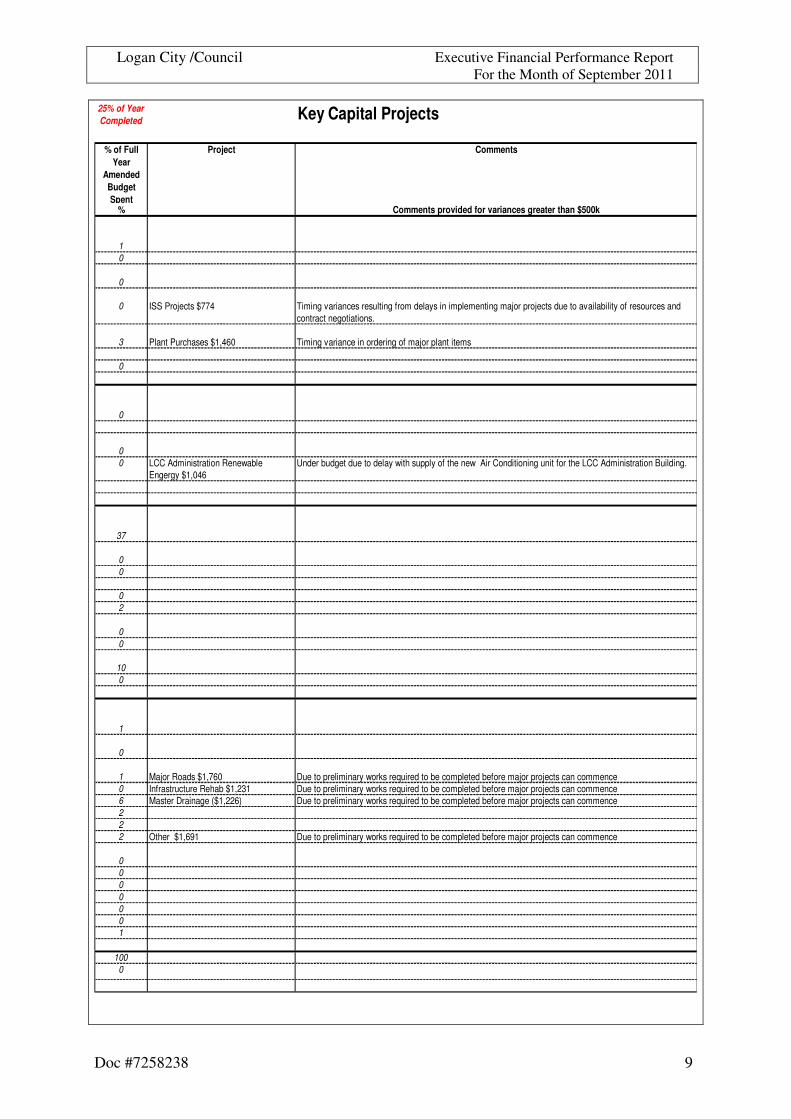
25% of Year Completed Key Capital Projects
% of Full Year
Amended Budget Spent
Project Comments
% Comments provided for variances greater than $500k
10
0
0 ISS Projects $774 Timing variances resulting from delays in implementing major projects due to availability of resources and contract negotiations.
3 Plant Purchases $1,460 Timing variance in ordering of major plant items
0
0
00 LCC Administration Renewable
Engergy $1,046Under budget due to delay with supply of the new Air Conditioning unit for the LCC Administration Building.
37
00
02
00
100
1
0
1 Major Roads $1,760 Due to preliminary works required to be completed before major projects can commence0 Infrastructure Rehab $1,231 Due to preliminary works required to be completed before major projects can commence6 Master Drainage ($1,226) Due to preliminary works required to be completed before major projects can commence222 Other $1,691 Due to preliminary works required to be completed before major projects can commence
0000001
1000
Logan City /Council Executive Financial Performance Report For the Month of September 2011
Doc #7258238 10
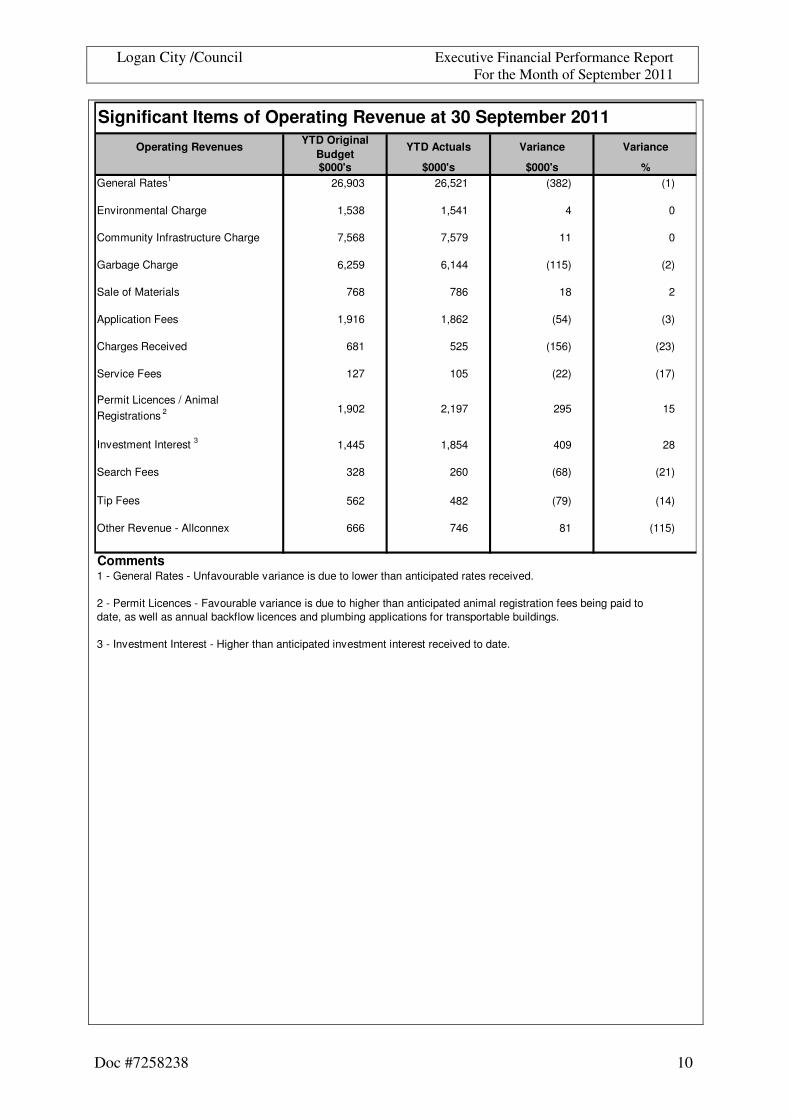
General Rates1 26,903 26,521 (382) (1)
Environmental Charge 1,538 1,541 4 0
Community Infrastructure Charge 7,568 7,579 11 0
Garbage Charge 6,259 6,144 (115) (2)
Sale of Materials 768 786 18 2
Application Fees 1,916 1,862 (54) (3)
Charges Received 681 525 (156) (23)
Service Fees 127 105 (22) (17)
Permit Licences / Animal Registrations 2 1,902 2,197 295 15
Investment Interest 3 1,445 1,854 409 28
Search Fees 328 260 (68) (21)
Tip Fees 562 482 (79) (14)
Other Revenue - Allconnex 666 746 81 (115)
1 - General Rates - Unfavourable variance is due to lower than anticipated rates received.
2 - Permit Licences - Favourable variance is due to higher than anticipated animal registration fees being paid to date, as well as annual backflow licences and plumbing applications for transportable buildings.
3 - Investment Interest - Higher than anticipated investment interest received to date.
$000's $000's $000's
Comments
%
Significant Items of Operating Revenue at 30 September 2011
Operating Revenues YTD Original Budget
YTD Actuals Variance Variance
Logan City /Council Executive Financial Performance Report For the Month of September 2011
Doc #7258238 11
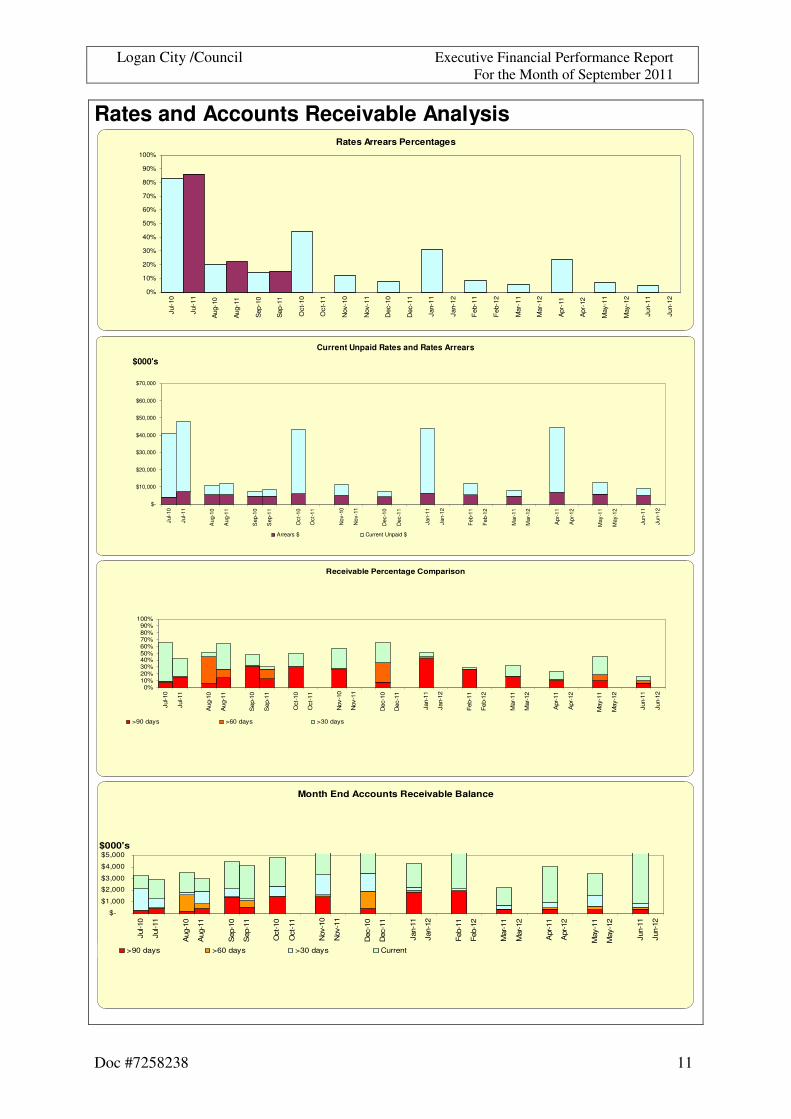
Rates and Accounts Receivable Analysis Rates Arrears Percentages
0%
10%
20%
30%
40%
50%
60%
70%
80%
90%
100%
Jul-1
0
Jul-1
1
Aug
-10
Aug
-11
Sep
-10
Sep
-11
Oct
-10
Oct
-11
Nov
-10
Nov
-11
Dec
-10
Dec
-11
Jan-
11
Jan-
12
Feb
-11
Feb
-12
Mar
-11
Mar
-12
Apr
-11
Apr
-12
May
-11
May
-12
Jun-
11
Jun-
12
Current Unpaid Rates and Rates Arrears
$-
$10,000
$20,000
$30,000
$40,000
$50,000
$60,000
$70,000
Jul-1
0
Jul-1
1
Aug
-10
Aug
-11
Sep
-10
Sep
-11
Oct
-10
Oct
-11
Nov
-10
Nov
-11
Dec
-10
Dec
-11
Jan-
11
Jan-
12
Feb-
11
Feb-
12
Mar
-11
Mar
-12
Apr
-11
Apr
-12
May
-11
May
-12
Jun-
11
Jun-
12
$000's
Arrears $ Current Unpaid $
Receivable Percentage Comparison
0%10%20%30%40%50%60%70%80%90%
100%
Jul-1
0
Jul-1
1
Aug
-10
Aug
-11
Sep
-10
Sep
-11
Oct
-10
Oct
-11
Nov
-10
Nov
-11
Dec
-10
Dec
-11
Jan-
11
Jan-
12
Feb-
11
Feb-
12
Mar
-11
Mar
-12
Apr
-11
Apr
-12
May
-11
May
-12
Jun-
11
Jun-
12
>90 days >60 days >30 days
Month End Accounts Receivable Balance
$-
$1,000
$2,000
$3,000
$4,000
$5,000
Jul-1
0
Jul-1
1
Aug
-10
Aug
-11
Sep
-10
Sep
-11
Oct
-10
Oct
-11
Nov
-10
Nov
-11
Dec
-10
Dec
-11
Jan-
11
Jan-
12
Feb-
11
Feb-
12
Mar
-11
Mar
-12
Apr
-11
Apr
-12
May
-11
May
-12
Jun-
11
Jun-
12
$000's
>90 days >60 days >30 days Current
Logan City /Council Executive Financial Performance Report For the Month of September 2011
Doc #7258238 12
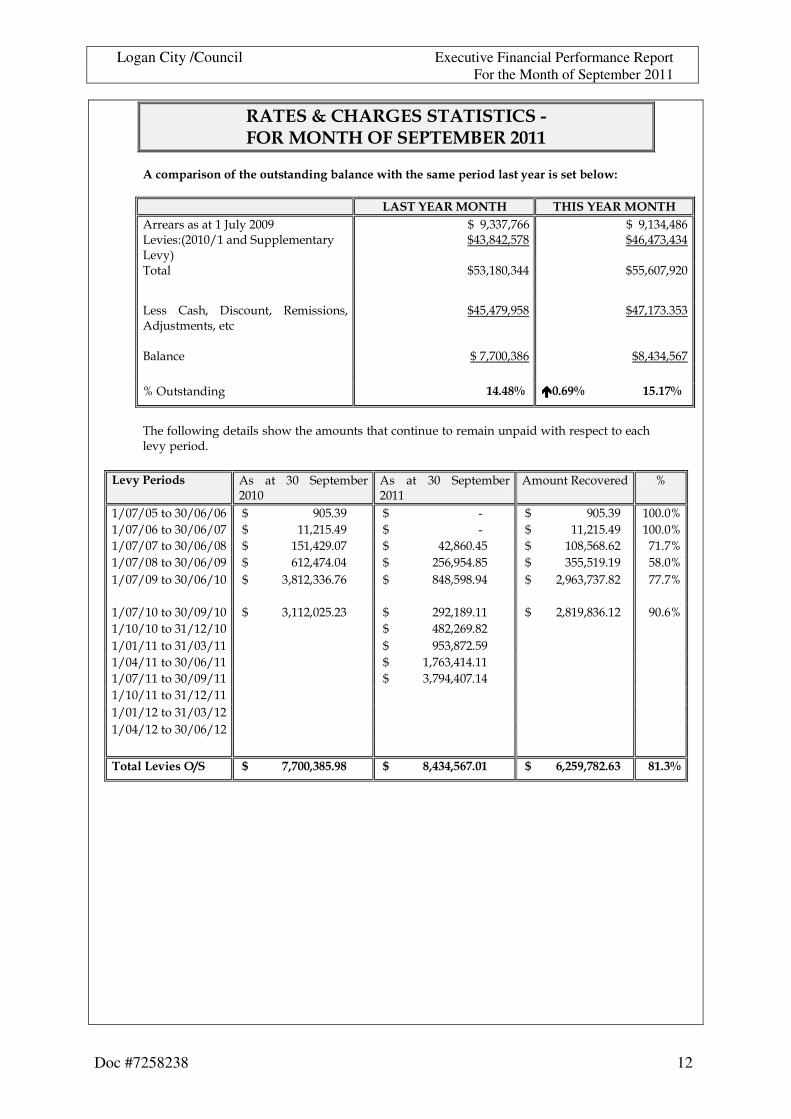
��������������������������� ���� ����� ������� ���������
����������������� !"��# � ��$��%�&�'���"�(� !� !"����"��"���$�'�� �)"�������" �&"'�(*��
� +����,����� ���� ����,����� ����
������������������� ���� ���������������������������� ������������������������������� ����������� ��!�����������"�
������ �#��� �������������
$%���� �#���������� �##������ ���
� � �
����� &��'�� (��)%���� *�!����%������+��!��������)�
��#������#�� �������,�#��
�-����)��
�������������
��������#����
� � �
.�/��������0� ������������������������������������������-.-/0������������������������������.120��������������������3.�40����������������������������������������������
�$'��1%��%2��0����������'%2��'���!%�����'���)%�������%���!����� ����2��'���� �)���%���)'������ ���%�,��
�
+"5)��"���$���
��� ��� ��� �� ��!3��� ����
��� ��� ��� �� ��!3��� ����
�!%���*�)%������ .�
������#��%���������� �������������������������#,���� �������������������������������4���� ����������������������#,���� ���,�.�
���������%���������� ��������������������� �#,���� �������������������������������4���� ������������������ �#,���� ���,�.�
���������%���������� �����������������#��� �,���� ������������������� ����,�#�� �����������������#��,� �� ��,�.�
���������%���������� ������������������ ����,���� ���������������� #���#�,�#�� ��������������##�#��,���� #�,�.�
���������%���������� ����������������� ����,���� ��������������������#��,���� ���������� ��������,� �� ��,�.�
�� � �� ��
���������%���������� ����������������� �� #, ��� ���������������� � ����,���� ���������� ��������,� �� ��,�.�
���������%����� ���� ������������������ � ��,� �� ���������%���������� �� �����������������#���� ,#��� �� ��
���������%���������� �� ����������������������,���� �� ��
���������%���������� �� ����������������������,���� �� ��
���������%����� ���� �� �� ��
������ ��%�������� � �� � �� ��
������ ��%�������� � �� � �� ��
�� �� �� �� ��
�� �'�+"5�"���6�� �7�����������484��89/3.2/�� �7�����������/8-9-8314.���� �7��������18�3284/�.19�� /�.90�
Logan City /Council Executive Financial Performance Report For the Month of September 2011
Doc #7258238 13
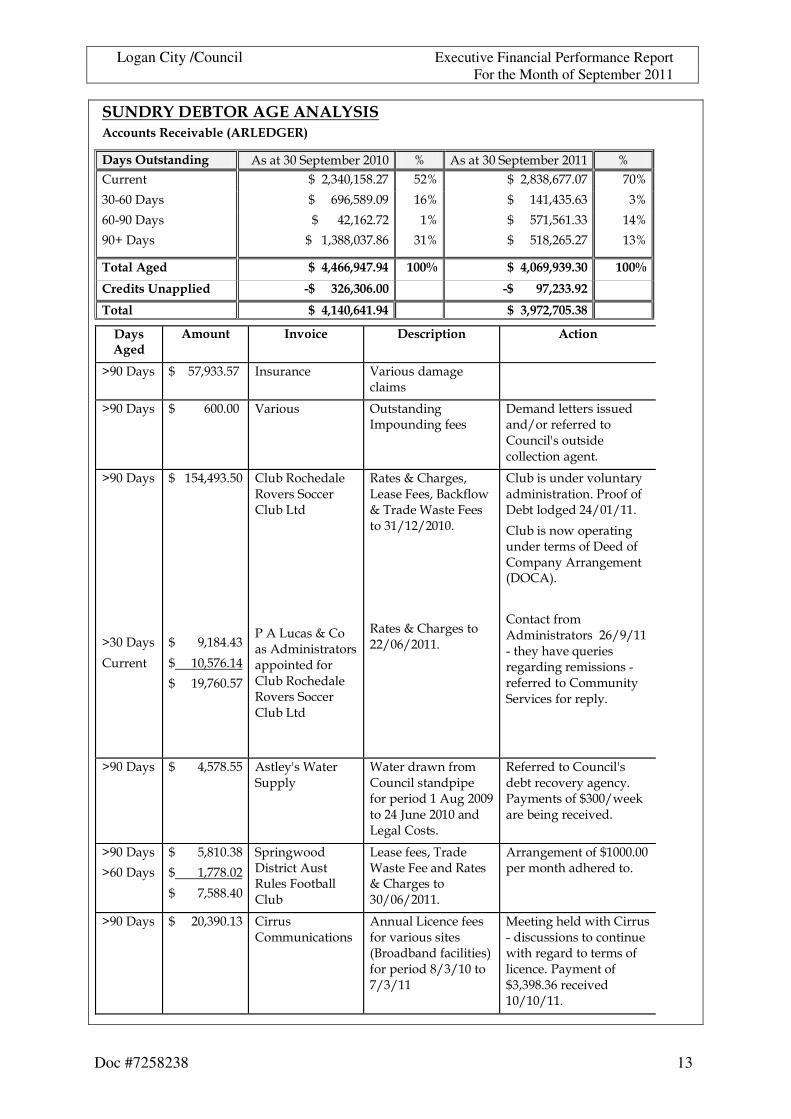
�:�;�,�;������������+,��������#� ���"�"�5�&'"�<��+�;��=�
;�)���# � ��$��%� ����������� ��!3��� ����� .� ����������� ��!3��� ����� .�
&������ ��� ������#�, ������ # .� ��� ��������,��� ��.�
��4���(���� ����������#��,������� ��.� ������������#,��� �.�
��4���(���� �������� ��� ,� �� �.� ������#���#��,��� ��.�
��5�(���� �������������,������ ��.� ������#��� �#, ����� ��.�
�� �'��%"$� 7��-8-1182-4.2-� ���0� 7��-8�128292.9�� ���0�
��"$� ��:����'�"$� �7�����9�189�1.�������� � �7�������248�99.2�� �
�� �'�� 7��-8�-�81-�.2-�� � 7��9824�84�3.9/�� ��
;�)���%"$�
���#� � ��5���"� ;"����� ���� �� ����
6���(���� �����#�����,#�� 7�����)��� 8���%����!�0��)���!��
�
6���(���� �������������,��� 8���%�� /��������0�7! %����0�1����
(�!����������������������%����1�������%�&%�)��9��%������)%���)��%���0���,�
6���(����
�
�
�
�
�
�
�
6���(����
&������
�
�
�
�
�����#�����,#��
�
�
�
�
�
�
�
�������������,���
���������#��,���
������������,#��
�
�
&�3�*%)'������*%������%))���&�3�����
�
�
�
�
�
:����)���;�&%������!��������%���� %������1%��&�3�*%)'������*%������%))���&�3�����
*�����;�&'��0����������<�����-�)=1�%2�;�$�����> �����<�����%����� � ���,�
�
�
�
�
*�����;�&'��0����%� ���� ���,�
�
�
�
&�3����������%���������!���������%�,�:�%%1�%1�(�3���%�0��� �������,�
&�3�����%2�% ������0���������!��%1�(����%1�&%! ���������0�!�����(/&�",�
�
&%���)��1�%!���!��������%���� �������4��'���'����?��������0�����0���!����%���4���1�������%�&%!!����������)���1%���� ��,�
6���(����
�
����������#��,##�
�
������9��> ������ ���
> ��������2��1�%! �&%�)�������� � ��1%�� ���%�����0� �����%� ����� ����������0���&%���,�
*�1�������%�&%�)��9����3����)%������0��)�,�:��!�����%1������2��=�����3���0���)�����,�
6���(����
6���(����
�
��������#����,���
�������������,� �
����������#��,���
� ���02%%��(�����)������*����<%%�3����&�3�
������1�����$�����> �����<�������*�����;�&'��0����%������� ���,�
�����0�!����%1������,��� ���!%��'���'������%,�
6���(����
�
������ �����,���
�
&�����&%!!��)���%���
��������)��)��1����1%������%���������-�%��3����1�)�������"�1%�� ���%����������%��������
@ �����0�'����2��'�&�����4����)���%����%�)%������2��'���0�����%����!��%1���)��)�,�:��!����%1�������,�����)��������������,�
�
Logan City /Council Executive Financial Performance Report For the Month of September 2011
Doc #7258238 14
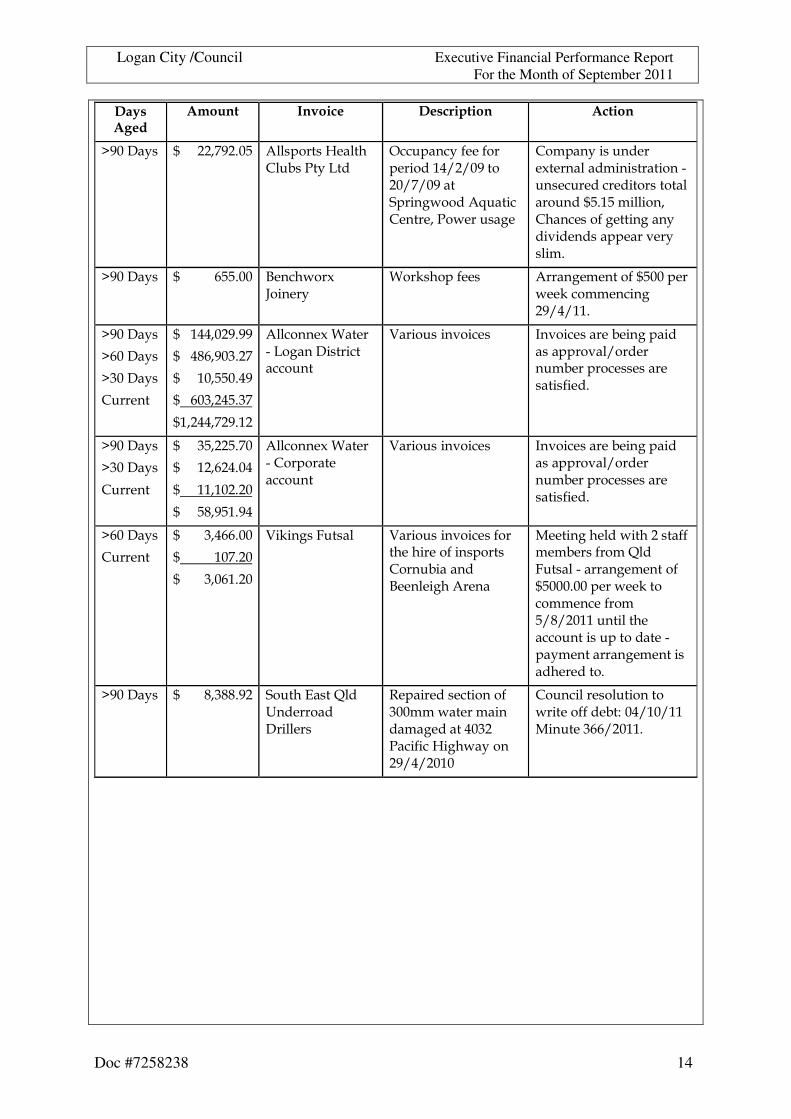
;�)���%"$�
���#� � ��5���"� ;"����� ���� �� ����
6���(���� ������ ��� ,�#� ���� %����A����'�&�3��:�������
/)) ��)��1���1%�� ���%����� �����%� ����������� ���02%%���?���)�&�������:%2�����0��
&%! �������������B���������!���������%��4����)����)�����%����%������%����#,�#�!����%����&'��)���%1�0�����0���������������� ������������!,��
6���(����
�
������������##,���
�
-��)'2%�B�%������
> %�=�'% �1���� �����0�!����%1��#��� ���2��=�)%!!��)��0� ������,���
6���(����
6���(����
6���(����
&������
��������� �,���
�����������, ��
���������##�,���
�������� �#,���
��� ���� �,� �
���)%���B�> �����4��%0���(�����)���))%���
8���%�����%�)���� 7��%�)�������3���0� �������� �%����%������!3��� �%)���������������1���,� � �
6���(����
6���(����
&������
�������#� #,���
������� �� �,���
����������� , ��
������#���#�,���
���)%���B�> �����4�&%� %������))%���
8���%�����%�)��� 7��%�)�������3���0� �������� �%����%������!3��� �%)���������������1���,� � �
6���(����
&������
�������������,���
��������������, ��
�������������, ��
8�=��0��<����� 8���%�����%�)���1%���'��'����%1���� %����&%��3�������-������0'�������
@�����0�'����2��'� ����11�!�!3����1�%!�C���<�����4������0�!����%1��#���,��� ���2��=��%�)%!!��)��1�%! �#��� ����������'���))%������ ��%������4� ��!���������0�!���������'������%,�
6���(���� �������������,� � �%�'�D����C���E�����%���(��������
*� ��������)��%��%1����!!�2�����!������!�0��������� �:�)�1�)�A�0'2���%�� ���� ����
&%�)������%���%���%�2�����%11���3������������@ ��������� ���,�
�
Logan City /Council Executive Financial Performance Report For the Month of September 2011
Doc #7258238 15
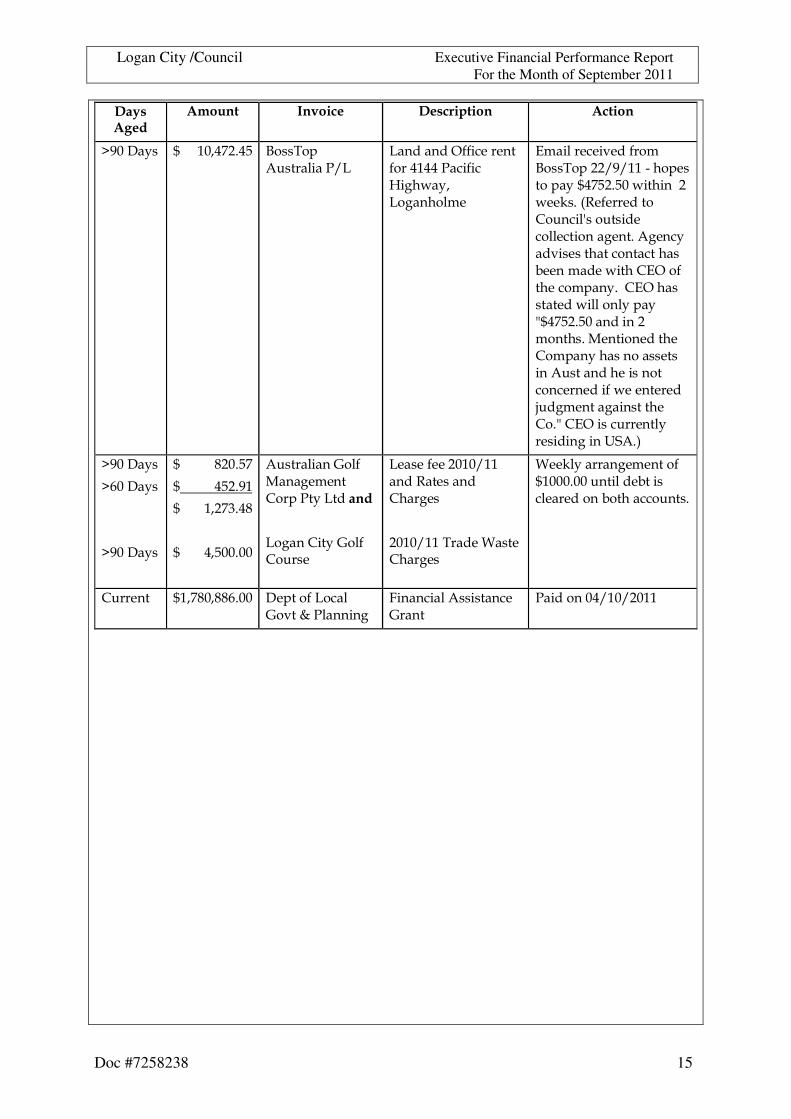
;�)���%"$�
���#� � ��5���"� ;"����� ���� �� ����
6���(����
�
����������� ,�#� -%��$% ����������:���
���������/11�)�������1%�������:�)�1�)�A�0'2�����%0��'%�!���
D!������)������1�%! �-%��$% � ������4�'% ����%� ������# ,#��2��'���� �2��=�,��*�1�������%�&%�)��9��%������)%���)��%���0���,��0��)�����������'���)%���)��'���3����!����2��'�&D/�%1��'��)%! ���,��&D/�'����������2����%���� ���F���# ,#��������� �!%��'�,�@ ����%�����'��&%! ����'����%�������������������'������%��)%�)�������1�2����������+�0!�����0�������'��&%,F�&D/����)���������������0����E��,"�
6���(����
6���(����
�
�
6���(����
������������ �,#��
������������# ,���
���������� ��,���
�
����������#��,���
�
����������G%�1�@ ���0�!����&%� �:���������$�
�
�%0���&����G%�1�&%����
������1��� �����������*���������&'��0���
�
�������$�����> �����&'��0���
> ��=��������0�!����%1������,����������3�����)�������%��3%�'��))%���,�
�
&������ ����������,��� (� ��%1��%)���G%���;�:������0�
<����)������������)��G������
:����%�������� ����
�
Logan City /Council Executive Financial Performance Report For the Month of September 2011
Doc #7258238 16
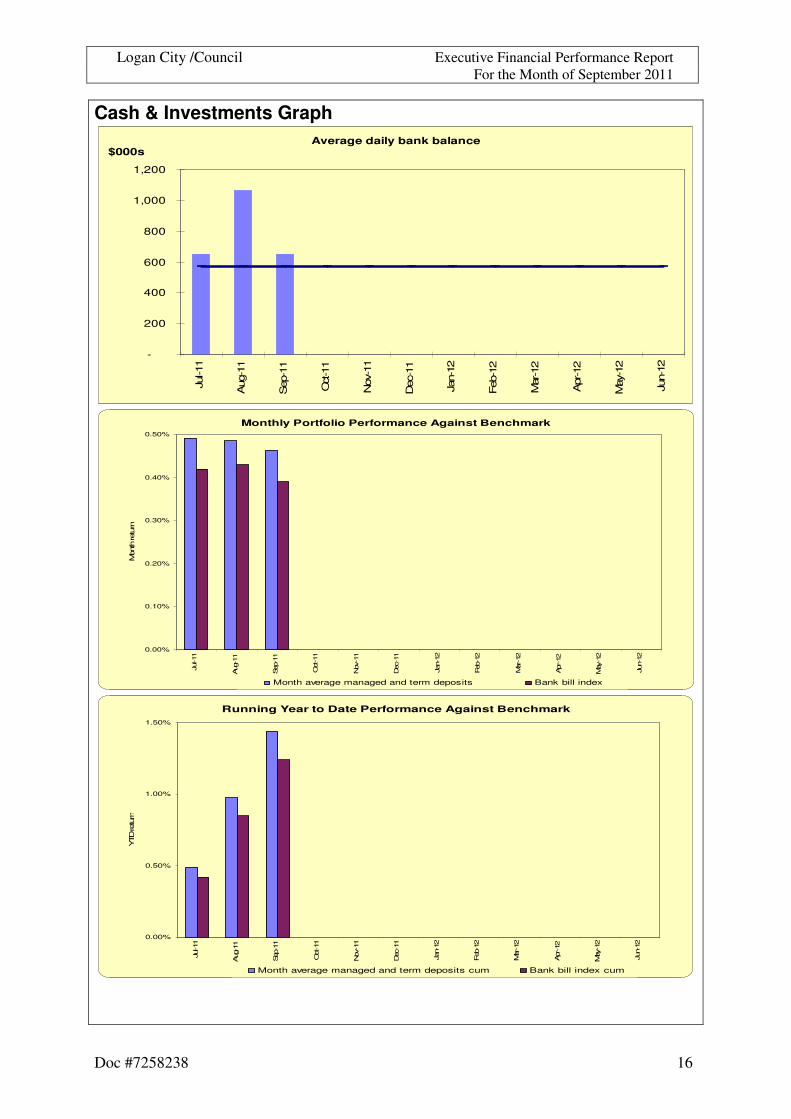
Cash & Investments Graph
Average daily bank balance
-
200
400
600
800
1,000
1,200
Jul-1
1
Aug
-11
Sep
-11
Oct
-11
Nov
-11
Dec
-11
Jan-
12
Feb
-12
Mar
-12
Apr
-12
May
-12
Jun-
12
$000s
Monthly Portfolio Performance Against Benchmark
0.00%
0.10%
0.20%
0.30%
0.40%
0.50%
Jul-1
1
Aug
-11
Sep
-11
Oct
-11
Nov
-11
Dec
-11
Jan-
12
Feb
-12
Mar
-12
Apr
-12
May
-12
Jun-
12
Mon
th re
turn
Month average managed and term deposits Bank bill index
Running Year to Date Performance Against Benchmark
0.00%
0.50%
1.00%
1.50%
Jul-1
1
Aug
-11
Sep
-11
Oct
-11
Nov
-11
Dec
-11
Jan-
12
Feb
-12
Mar
-12
Apr
-12
May
-12
Jun-
12
YTD
retu
rn
Month average managed and term deposits cum Bank bill index cum
Logan City /Council Executive Financial Performance Report For the Month of September 2011
Doc #7258238 17
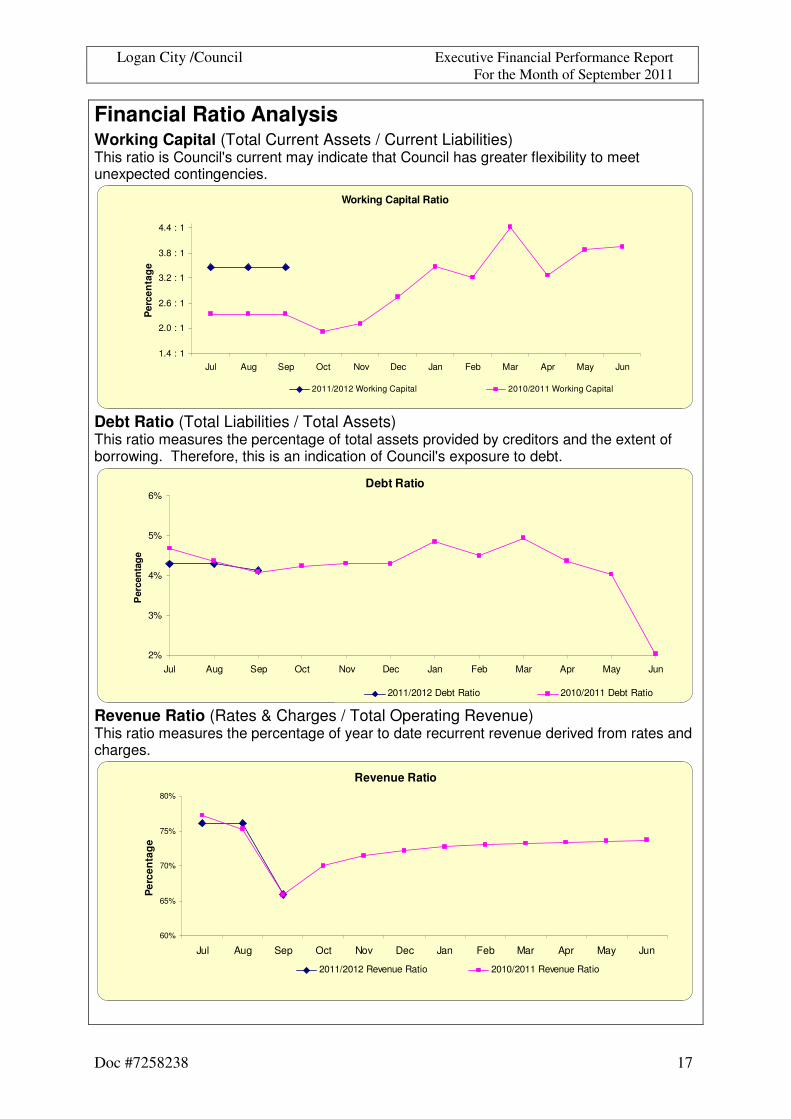
Financial Ratio Analysis Working Capital (Total Current Assets / Current Liabilities) This ratio is Council's current may indicate that Council has greater flexibility to meet unexpected contingencies.
Working Capital Ratio
1.4 : 1
2.0 : 1
2.6 : 1
3.2 : 1
3.8 : 1
4.4 : 1
Jul Aug Sep Oct Nov Dec Jan Feb Mar Apr May Jun
Per
cen
tag
e
2011/2012 Working Capital 2010/2011 Working Capital
Debt Ratio (Total Liabilities / Total Assets) This ratio measures the percentage of total assets provided by creditors and the extent of borrowing. Therefore, this is an indication of Council's exposure to debt.
Debt Ratio
2%
3%
4%
5%
6%
Jul Aug Sep Oct Nov Dec Jan Feb Mar Apr May Jun
Per
cent
age
2011/2012 Debt Ratio 2010/2011 Debt Ratio
Revenue Ratio (Rates & Charges / Total Operating Revenue) This ratio measures the percentage of year to date recurrent revenue derived from rates and charges.
Revenue Ratio
60%
65%
70%
75%
80%
Jul Aug Sep Oct Nov Dec Jan Feb Mar Apr May Jun
Per
cen
tag
e
2011/2012 Revenue Ratio 2010/2011 Revenue Ratio
Logan City Council Executive Financial Performance Report For the Month of September 2011
18
12GLACT3
YTD Original Budget $000's Period 0
Period 1 - 12
YTD Actuals
$000'sVar
$Var
%
Full Year Original Budget $000's
Full Year Amended
Budget $000's
% of YTD Actual to Full
Year Amended
Budget
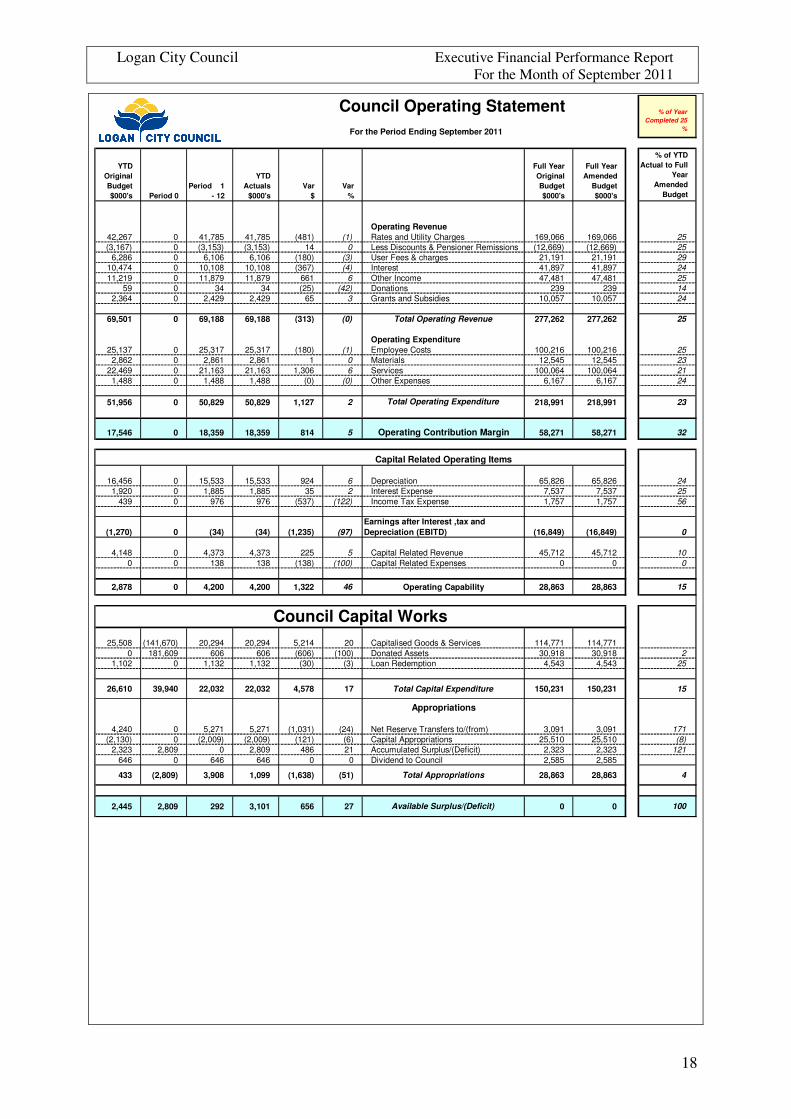
Operating Revenue42,267 0 41,785 41,785 (481) (1) Rates and Utility Charges 169,066 169,066 25(3,167) 0 (3,153) (3,153) 14 0 Less Discounts & Pensioner Remissions (12,669) (12,669) 25
6,286 0 6,106 6,106 (180) (3) User Fees & charges 21,191 21,191 2910,474 0 10,108 10,108 (367) (4) Interest 41,897 41,897 2411,219 0 11,879 11,879 661 6 Other Income 47,481 47,481 25
59 0 34 34 (25) (42) Donations 239 239 142,364 0 2,429 2,429 65 3 Grants and Subsidies 10,057 10,057 24
69,501 0 69,188 69,188 (313) (0) Total Operating Revenue 277,262 277,262 25
Operating Expenditure25,137 0 25,317 25,317 (180) (1) Employee Costs 100,216 100,216 25
2,862 0 2,861 2,861 1 0 Materials 12,545 12,545 2322,469 0 21,163 21,163 1,306 6 Services 100,064 100,064 21
1,488 0 1,488 1,488 (0) (0) Other Expenses 6,167 6,167 24
51,956 0 50,829 50,829 1,127 2 Total Operating Expenditure 218,991 218,991 23
17,546 0 18,359 18,359 814 5 Operating Contribution Margin 58,271 58,271 32
Capital Related Operating Items
16,456 0 15,533 15,533 924 6 Depreciation 65,826 65,826 241,920 0 1,885 1,885 35 2 Interest Expense 7,537 7,537 25
439 0 976 976 (537) (122) Income Tax Expense 1,757 1,757 56
(1,270) 0 (34) (34) (1,235) (97)Earnings after Interest ,tax and Depreciation (EBITD) (16,849) (16,849) 0
4,148 0 4,373 4,373 225 5 Capital Related Revenue 45,712 45,712 100 0 138 138 (138) (100) Capital Related Expenses 0 0 0
2,878 0 4,200 4,200 1,322 46 Operating Capability 28,863 28,863 15
25,508 (141,670) 20,294 20,294 5,214 20 Capitalised Goods & Services 114,771 114,7710 181,609 606 606 (606) (100) Donated Assets 30,918 30,918 2
1,102 0 1,132 1,132 (30) (3) Loan Redemption 4,543 4,543 25
26,610 39,940 22,032 22,032 4,578 17 Total Capital Expenditure 150,231 150,231 15
Appropriations
4,240 0 5,271 5,271 (1,031) (24) Net Reserve Transfers to/(from) 3,091 3,091 171(2,130) 0 (2,009) (2,009) (121) (6) Capital Appropriations 25,510 25,510 (8)
2,323 2,809 0 2,809 486 21 Accumulated Surplus/(Deficit) 2,323 2,323 121646 0 646 646 0 0 Dividend to Council 2,585 2,585
433 (2,809) 3,908 1,099 (1,638) (51) Total Appropriations 28,863 28,863 4
2,445 2,809 292 3,101 656 27 Available Surplus/(Deficit) 0 0 100
Council Operating Statement % of Year Completed 25
%For the Period Ending September 2011
Council Capital Works
Logan City Council Executive Financial Performance Report For the Month of September 2011
Doc #7258238 19
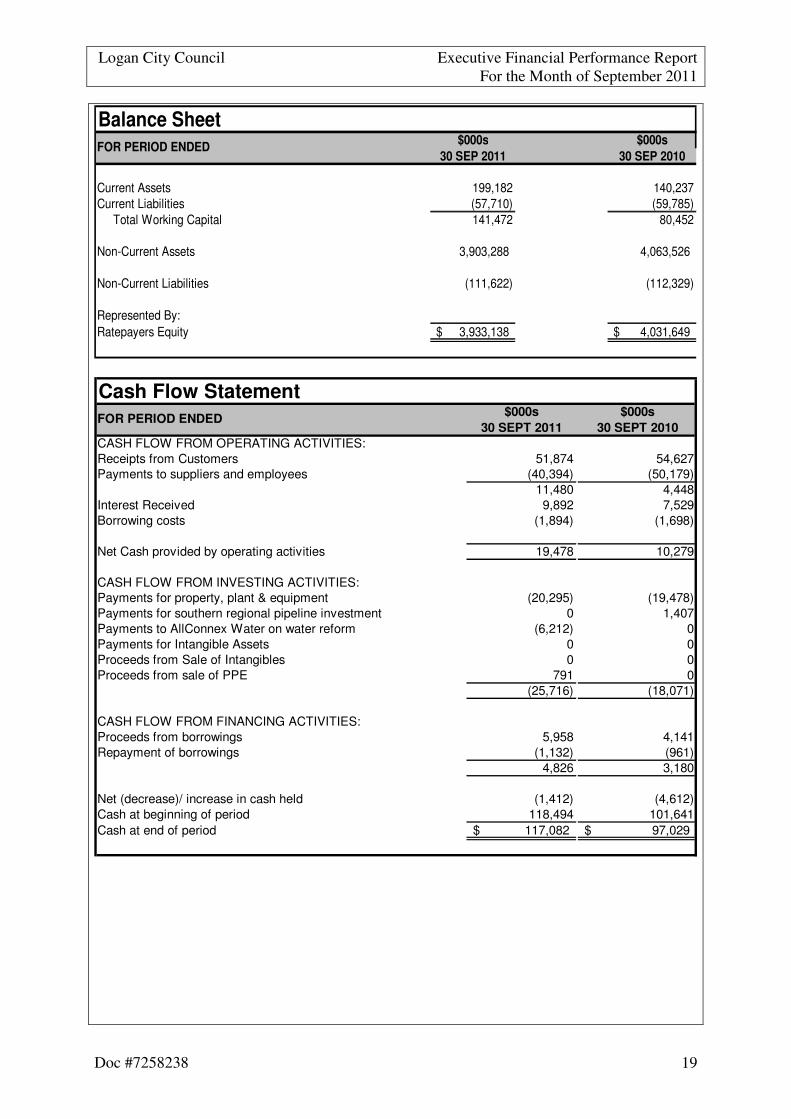
Balance Sheet$000s $000s
30 SEP 2011 30 SEP 2010
Current Assets 199,182 140,237Current Liabilities (57,710) (59,785) Total Working Capital 141,472 80,452
Non-Current Assets 3,903,288 4,063,526
Non-Current Liabilities (111,622) (112,329)
Represented By:Ratepayers Equity 3,933,138$ 4,031,649$
FOR PERIOD ENDED
Cash Flow Statement$000s $000s
30 SEPT 2011 30 SEPT 2010CASH FLOW FROM OPERATING ACTIVITIES:Receipts from Customers 51,874 54,627Payments to suppliers and employees (40,394) (50,179)
11,480 4,448Interest Received 9,892 7,529Borrowing costs (1,894) (1,698)
Net Cash provided by operating activities 19,478 10,279
CASH FLOW FROM INVESTING ACTIVITIES:Payments for property, plant & equipment (20,295) (19,478)Payments for southern regional pipeline investment 0 1,407Payments to AllConnex Water on water reform (6,212) 0Payments for Intangible Assets 0 0Proceeds from Sale of Intangibles 0 0Proceeds from sale of PPE 791 0
(25,716) (18,071)
CASH FLOW FROM FINANCING ACTIVITIES:Proceeds from borrowings 5,958 4,141Repayment of borrowings (1,132) (961)
4,826 3,180
Net (decrease)/ increase in cash held (1,412) (4,612)Cash at beginning of period 118,494 101,641Cash at end of period 117,082$ 97,029$
FOR PERIOD ENDED