Embed Size (px)
Citation preview

Nagios Enterprises 2017 Logs: A Source of Value // 1
Log Data:A Source of Value
Nagios Enterprises LLC 2017

Log Data:A Source of Value
Nagios Enterprises LLC 2017

Introduction
Part 1 : What’s in a Log?
Part 2: Users
Part 3: Websites
Part 4: Network Security
Part 5: Archive, Visualize, Alert
Conclusion

Nagios Enterprises 2017 Logs: A Source of Value // 4
Introduction
Monitoring the general health of the hardware and applications that your business relies on is critical to success, and has gone beyond simply being a best practice to being a requirement.
By keeping track of the availability and resource utilization of your servers, applications, and network devices, you’re able to get ahead of problems and ideally resolve minor issues before they gain steam and have a major impact.
But what’s missing? Is uptime and health monitoring enough, or are there other data points you could be leveraging?
In this ebook, we will discuss a key resource that is sure to add depth and value to your monitoring deployment, and help keep things running smoothly and securely: machine generated log data.
Nagios Enterprises 2017 Logs: A Source of Value // 5
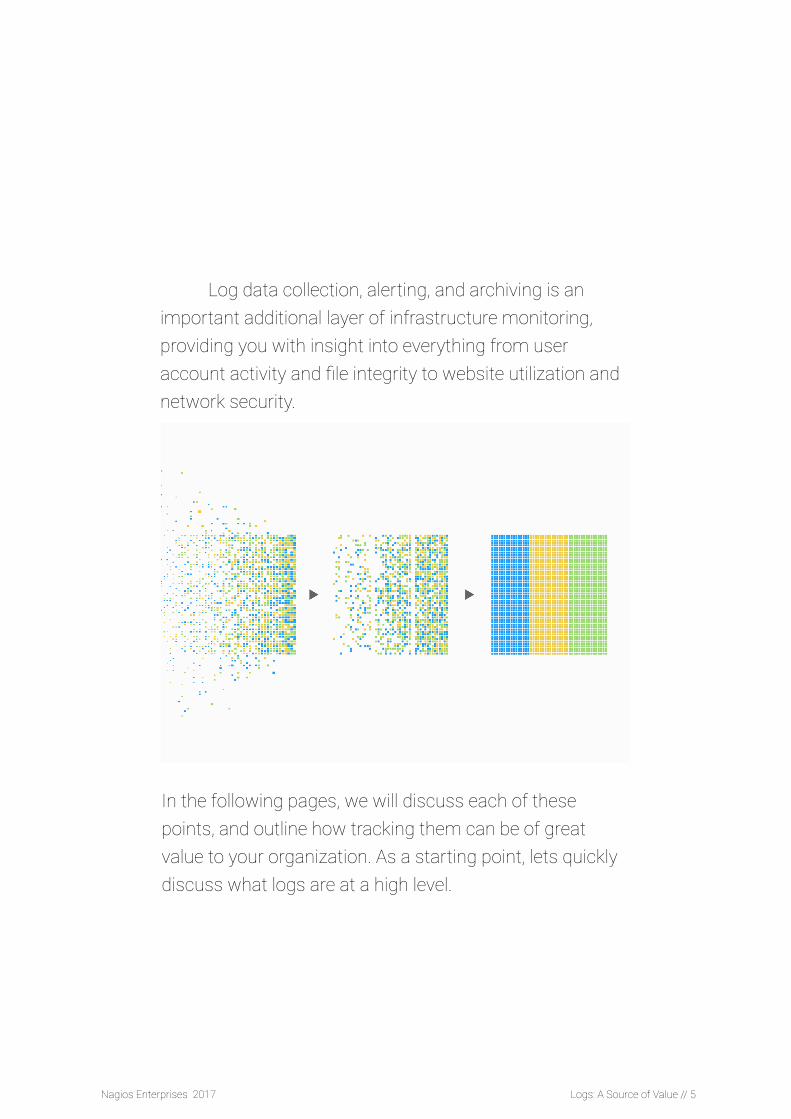
Log data collection, alerting, and archiving is an important additional layer of infrastructure monitoring, providing you with insight into everything from user account activity and file integrity to website utilization and network security.
In the following pages, we will discuss each of these points, and outline how tracking them can be of great value to your organization. As a starting point, lets quickly discuss what logs are at a high level.
Nagios Enterprises 2017 Logs: A Source of Value // 6
What’s in a Log?
Servers, applications, and network devices across your infrastructure all generate realtime log events. These log events are blocks of text that contain information such as the time the event occurred, severity levels, user identities, event ID’s, website visitor IP addresses, and related programs.
Log data definitely contains a wealth of useful information, and a wide array of uses for your network monitoring and administration teams, but making constructive use of the data can be challenging without the right toolset.
One common challenge is finding a way to sift through the massive quantity of log events generated, and another is storing all of the logs centrally, so they can be analyzed for recent and historical events as a consolidated whole.

Nagios Enterprises 2017 Logs: A Source of Value // 7
Employing a log analysis tool like Nagios Log Server empowers you to not only securely consolidate all of your log data in one place and archive it for later reference, but also to quickly analyze it. Custom queries allow you to narrow down the available data to specific subsets that meet your unique use-case, and then to visualize the data in custom dashboards, and alert on certain events and thresholds.
Now that we’ve discussed logs and log management in a general sense, let’s move ahead to details on more specific use-cases: users, websites, and network security.
Nagios Enterprises 2017 Logs: A Source of Value // 8
UsersLogs contain valuable information to help you verify user activity, including data on logons and logoffs, and file access.
Windows eventlog and Linux syslog data can be used to determine both failed and successful logins. The use-case for failed logins is clear: if a user fails a couple of logins, they may just be having a bad day; if they fail to authenticate repeatedly, this could be a sign that something malicious is occurring, and should be investigated. I could mean anything from a user attempting to login to someone else’s machine or account, to an external threat attempting to brute-force the credentials.
Log data can also be used for file integrity monitoring on shared storage resources, such as Windows, NFS, or Samba shares. Details such as when users accessed the drives, and which folders
Nagios Enterprises 2017 Logs: A Source of Value // 9
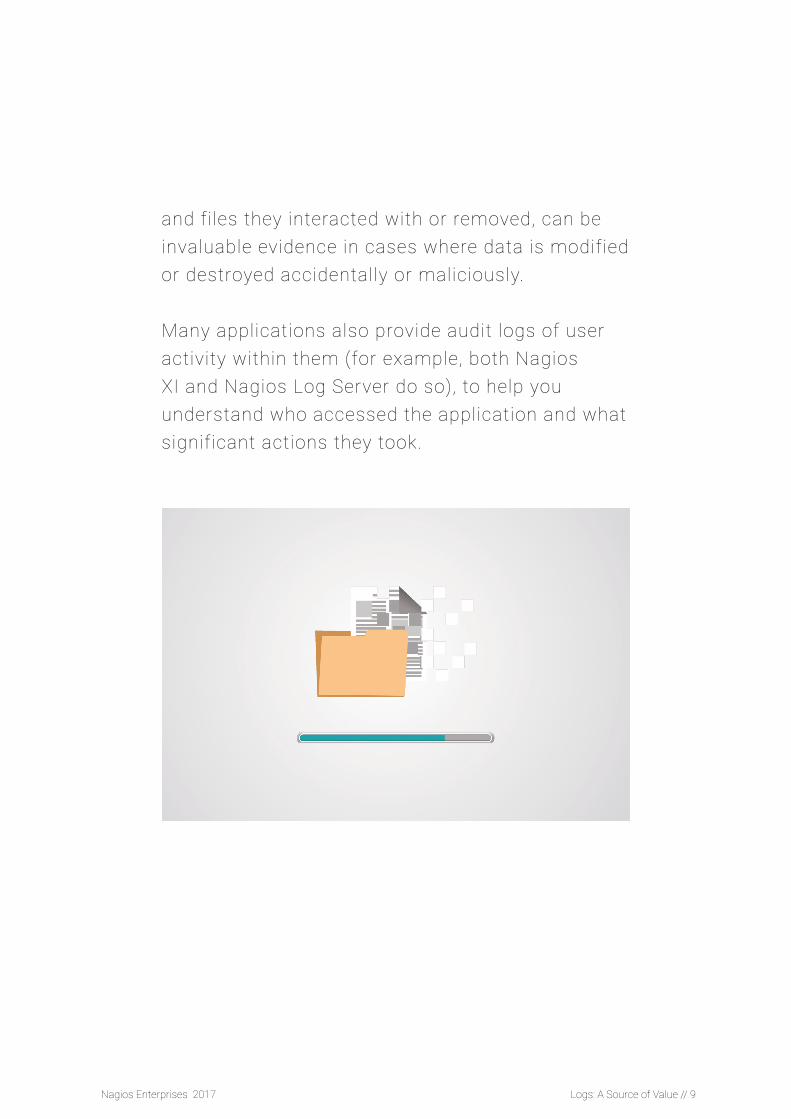
and files they interacted with or removed, can be invaluable evidence in cases where data is modified or destroyed accidentally or maliciously.
Many applications also provide audit logs of user activity within them (for example, both Nagios XI and Nagios Log Server do so), to help you understand who accessed the application and what significant actions they took.
Nagios Enterprises 2017 Logs: A Source of Value // 10
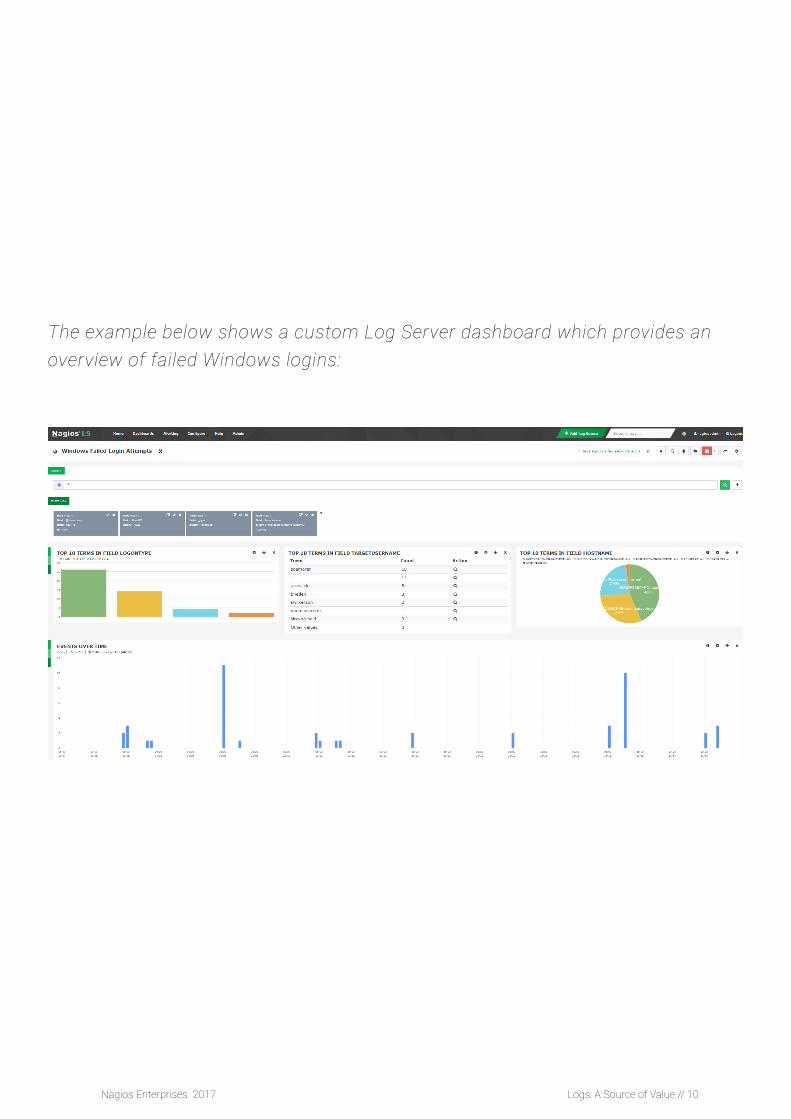
The example below shows a custom Log Server dashboard which provides an overview of failed Windows logins:
Nagios Enterprises 2017 Logs: A Source of Value // 11
Websites
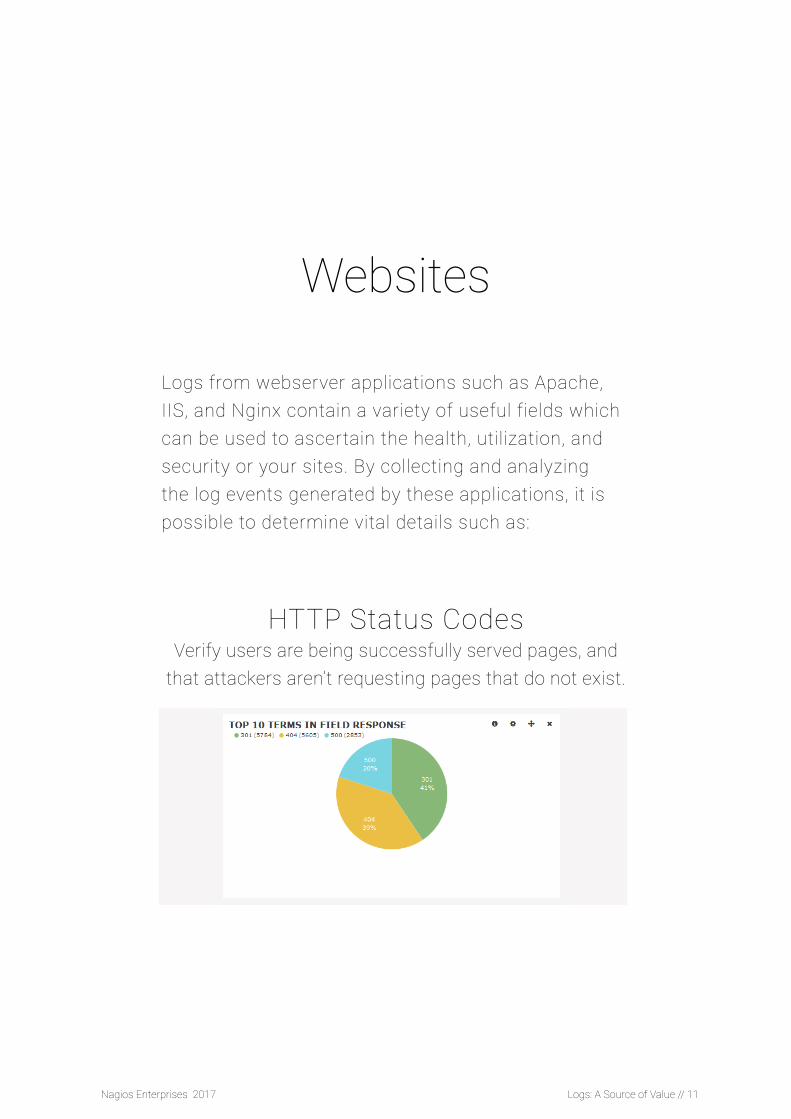
Logs from webserver applications such as Apache, IIS, and Nginx contain a variety of useful fields which can be used to ascertain the health, utilization, and security or your sites. By collecting and analyzing the log events generated by these applications, it is possible to determine vital details such as:
HTTP Status CodesVerify users are being successfully served pages, and
that attackers aren’t requesting pages that do not exist.
Nagios Enterprises 2017 Logs: A Source of Value // 12
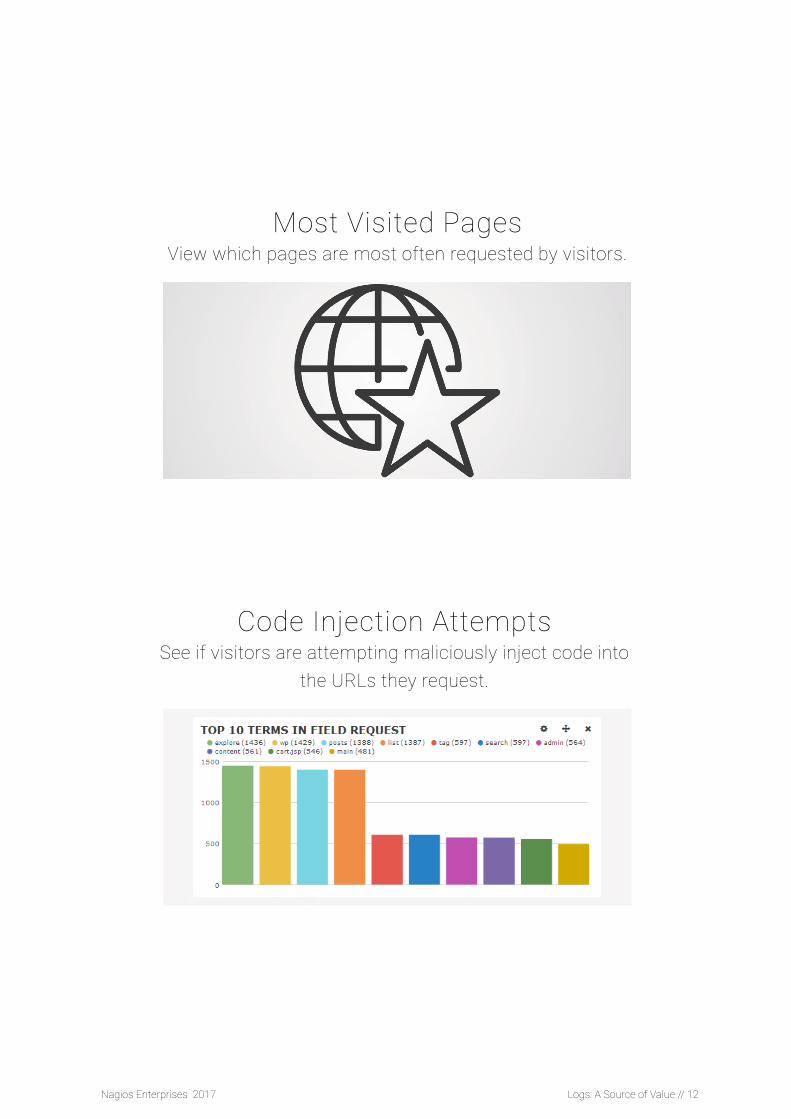
Most Visited PagesView which pages are most often requested by visitors.
Code Injection AttemptsSee if visitors are attempting maliciously inject code into
the URLs they request.

Nagios Enterprises 2017 Logs: A Source of Value // 13
Request TimeSee how long it takes for your webserver to respond to requests
Visitor LocationSee what countries you get the most visitors from
Nagios Enterprises 2017 Logs: A Source of Value // 14
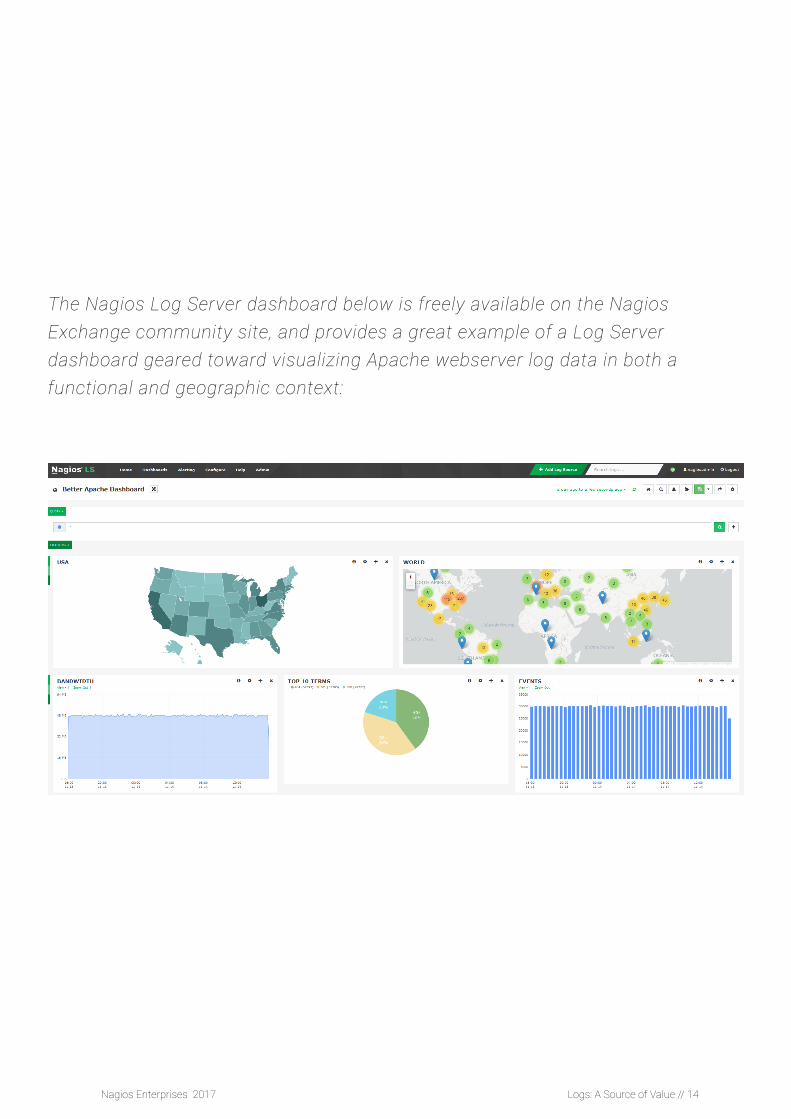
The Nagios Log Server dashboard below is freely available on the Nagios Exchange community site, and provides a great example of a Log Server dashboard geared toward visualizing Apache webserver log data in both a functional and geographic context:
Nagios Enterprises 2017 Logs: A Source of Value // 15
Network SecurityCollecting and analyzing log data from your switches, routers, firewalls, and other network devices provides invaluable insight into the security of your environment. By utilizing network device log data, it is possible to identify and halt events such as:
IP Address SpoofingModifying IP datagrams so that they contain incorrect information on the senders source
address. For example, in a Land Attack the source and destination IP are identical.
Nagios Enterprises 2017 Logs: A Source of Value // 16
Unauthorized ProtocolsAttempting to leverage ports dedicated to protocols not
authorized in your deployment.
Teardrop Fragments AttackSending fragmented packets to a network device which it cannot reassemble, potentially crashing the device.
Nagios Enterprises 2017 Logs: A Source of Value // 17
Windows eventlog data can also be leveraged to keep your network secure. Windows Security log audit events include data on successful and failed logins, group policy changes, and user account modifications.
Linux systems generate valuable security related logs as well, enabling you to identify things like commands run using sudo, failed SSH logins, FTP access, account changes and new users being added, and applications being installed.
Nagios Enterprises 2017 Logs: A Source of Value // 18
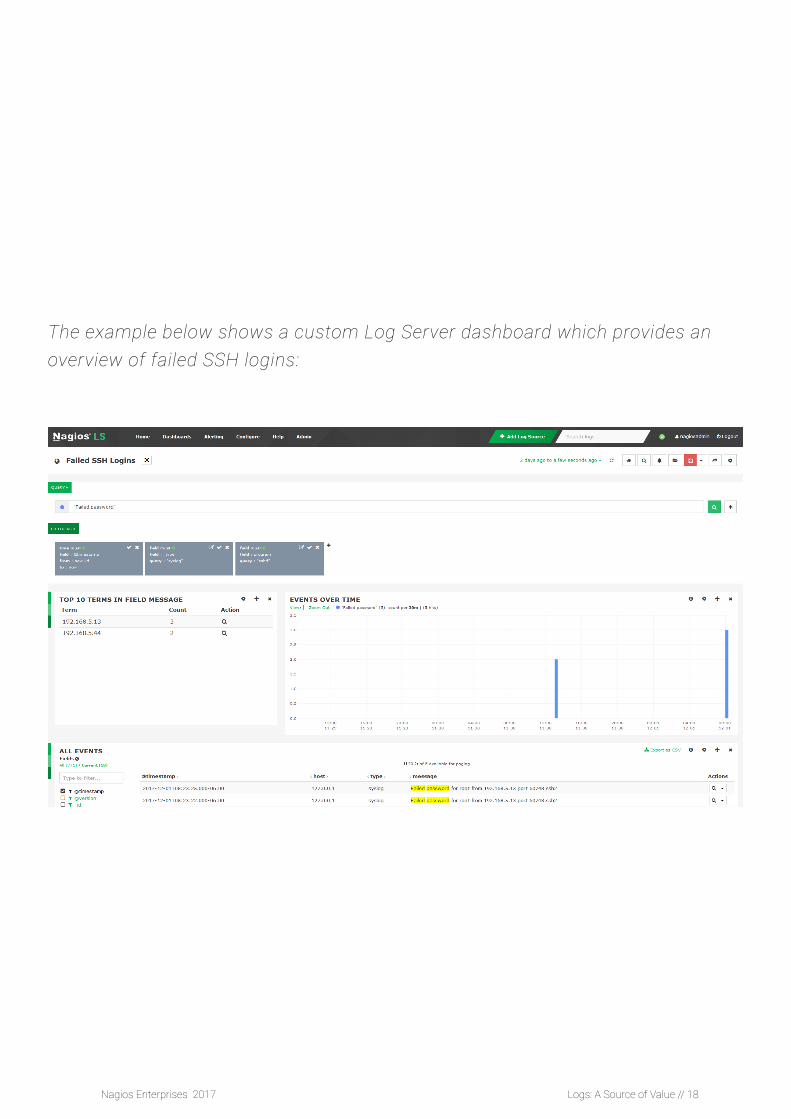
The example below shows a custom Log Server dashboard which provides an overview of failed SSH logins:
Nagios Enterprises 2017 Logs: A Source of Value // 19
Archive, Visualize, AlertNagios Log Server acts as a centralized collector for log data from sources across your network. How long the data is retained is fully customizable, and it can also be sent to a separate repository for longer-term storage.
Since the data is quickly sent to Log Server when log events are generated, using Log Server makes it much more difficult for malicious users to manually delete log entries on the sending sources to cover their tracks. Log Server also adds a “version” field to each log event, and if the event is manually manipulated the version number will change.
In addition to centrally archiving all of the data, Nagios Log Server provides an intuitive platform which can be used to create custom dashboards for a quick visual reference (such as the Windows Failed Logins and Apache dashboards highlighted above).
Nagios Enterprises 2017 Logs: A Source of Value // 20
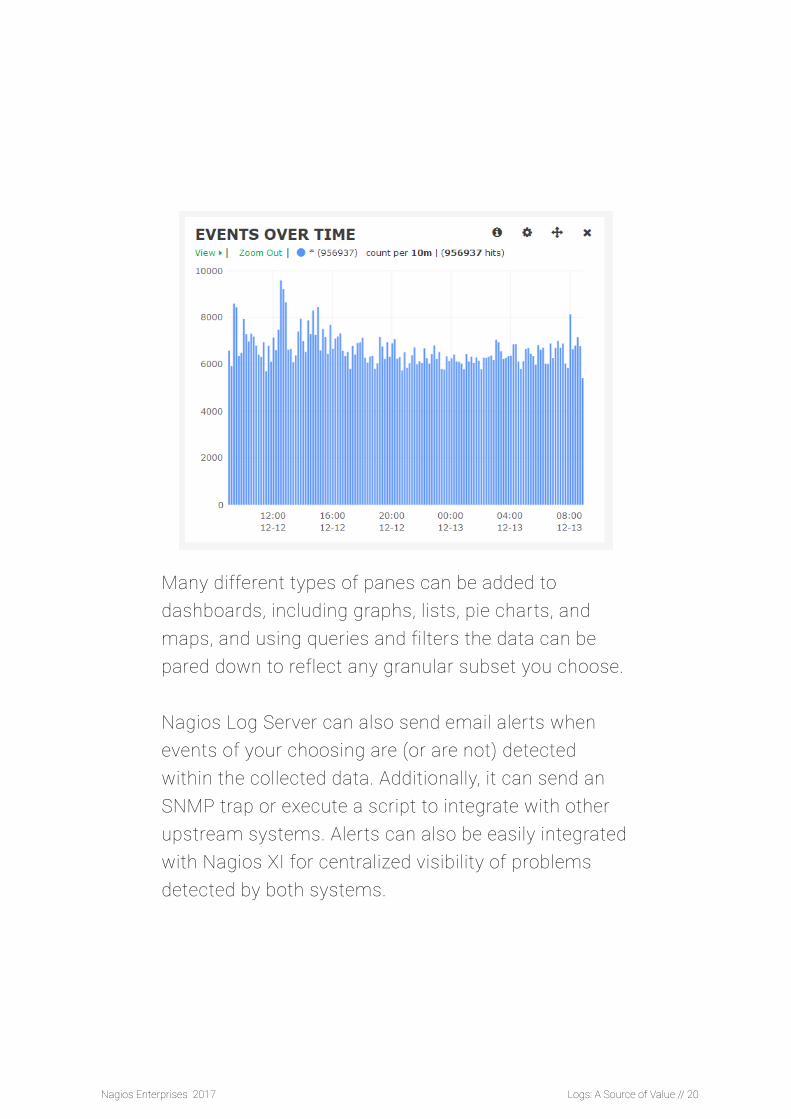
Many different types of panes can be added to dashboards, including graphs, lists, pie charts, and maps, and using queries and filters the data can be pared down to reflect any granular subset you choose.
Nagios Log Server can also send email alerts when events of your choosing are (or are not) detected within the collected data. Additionally, it can send an SNMP trap or execute a script to integrate with other upstream systems. Alerts can also be easily integrated with Nagios XI for centralized visibility of problems detected by both systems.

Nagios Enterprises 2017 Logs: A Source of Value // 21
ConclusionAs you can see, log data is a valuable source of information about your infrastructure. By combining log collection, analysis, archiving, and alerting with standard uptime and health monitoring you are able to detect and remediate even more complex issues before they negatively impact your business.
Hopefully this ebook has served as a helpful introduction to log data, its common use-cases, and how Nagios Log Server can help you capitalize on this valuable source of information. If you’d like to learn more about Nagios Log Server, the free 60 day trial, weekly webinars, and online demo are three great resources to help you get started:
Download Log Server
Watch a Webinar
Try the Online Demo