Embed Size (px)
Citation preview
LODWheel
– JavaScript-based Visualization of RDF Data –
Magnus Stuhr1, Dumitru Roman2, and David Norheim3
1University of Bergen, Bergen, Norway
[email protected] 2 SINTEF, Oslo, Norway
[email protected] 3 Computas AS, Lysaker, Norway
Abstract. Visualizing Resource Description Framework (RDF) data to support
decision-making processes is an important and challenging aspect of consuming
Linked Data. With the recent development of JavaScript libraries for data
visualization, new opportunities for Web-based visualization of Linked Data
arise. This paper presents an extensive evaluation of JavaScript-based libraries
for visualizing RDF data. A set of criteria has been devised for the evaluation
and 15 major JavaScript libraries have been analyzed against the criteria. The
two JavaScript libraries with the highest score in the evaluation acted as the
basis for developing LODWheel (Linked Open Data Wheel) – a prototype for
visualizing Linked Open Data in graphs and charts – introduced in this paper.
This way of visualizing RDF data leads to a great deal of challenges related to
data-categorization and connecting data resources together in new ways, which
are discussed in this paper.
Keywords: RDF visualization, LODWheel, Linked Open Data, JavaScript-
based RDF visualization, ontology-categorization.
1 Introduction
Visualization of Resource Description Framework (RDF) data [39] is an important aspect of the
Linked Open Data community. In order to make RDF data understandable for users with little
or no knowledge about the Semantic Web [8] and Linked Open Data [30], intuitive ways of
visualizing the data is fundamental. A great deal of research has been conducted related to
visualizing RDF data [6], [12], [16], [34], but these research projects are mainly directed
towards user groups with much knowledge within the domain, or are focusing on table-
interfaces for browsing RDF data. Research has also been conducted in the area of developing
RDF browsers [7], [15], [35], [41]. Some of these browsers visualize RDF data in maps,
timeline, tree-maps and tables, but none of them visualize RDF data as graphs and charts. This
paper argues that visualizing RDF data in graphs and charts will increase the understanding of
raw data available on the Web. This is strongly centered around the idea of categorizing data
based on what the data resources represent, and how data can relate to each other in new ways
to support optimal graph- and chart-visualizations. When these aspects are addressed, graphs
and charts support the foundation of visualizing RDF data in new intuitive ways. Further, most
2
of the state-of-the-art tools for visualizing RDF data are desktop-based applications, and are
mainly directed towards users with a great deal of knowledge about the Semantic Web. These
tools are useful for developing OWL ontologies and RDF data, but offer little or no value to
decision makers with low technical skills. In addition, developing Web-based applications that
are platform-independent and available to everyone supports the fundamental principles of
Linked Open Data, which is raw data available to everyone on the Web.
One of the most common ways of visualizing RDF data on the Web is simply by displaying
data in tables. The disadvantages with this approach of visualizing RDF data is the fact that
there are no obvious ways of getting an overview over what data resources are the subjects and
objects in the RDF graph, as well as what category the different data resources falls into. Also,
this visualization offers no ways of interacting with other data resources apart from the Unique
Resource Identifiers (URIs). This limits the visualization-potential of RDF data to a great
extent.
The aim and motivation behind the LODWheel (Linked Open Data Wheel) project was to
investigate new ways of visualizing Linked Open Data on the Web that would offer as much
value to users with little or no knowledge within the domain, as well as to experienced users
with much knowledge within the domain. RDF data visualization should be platform-
independent, thus making it available to everyone, regardless of operating systems and Web
browsers. This trait would further support the principles of Linked Open Data, making raw data
available to everyone. LODWheel is a prototype for visualizing RDF data in graphs and charts.
The prototype was developed based on an extensive evaluation of open-source JavaScript-
based libraries for visualizing data, where the libraries with the highest score in each
visualization-category (graph-visualizations and chart-visualizations), based on numerous
evaluation criteria presented later in this paper, was used as the main front-end libraries. It was
important for the visualization tool to be a JavaScript-only library, as JavaScript is compatible
with all operative systems and Web browsers, and is expected to be a part of HTML5 [23].
LODWheel is based on displaying RDF data from the Linked Open Data on the Web, but can
easily be extended to support additional local RDF data files.
The main contribution of this paper is an extensive evaluation of relevant JavaScript
libraries for visualizing RDF data. Further, the LODWheel prototype, which is built on the
JavaScript libraries with the highest overall score derived from the evaluation criteria, aims at
showing the possibilities and advantages of visualizing RDF data in graphs and charts. The
research conducted in this project highlights the importance of addressing new ways of
categorizing data resources based on what the data actually represent, and relating data
resources to each other in new ways. This will be explained more thoroughly throughout the
paper.
This paper is structured around six separate Sections, excluding Section 1 – the
introduction. Sections 2 and 3 give an insight into the state-of-the-art tools for visualizing RDF
data, mainly focusing on the evaluation of relevant JavaScript libraries and Section 4 introduces
LODWheel. Sections 5 and 6 present the results and discussions derived from this research, and
Section 7 presents conclusions and future work.
2 State of the Art Overview in RDF Data Visualization
There exist numerous tools for visualizing RDF data, both on the Web and as desktop
applications. Most of the desktop-based applications are built with the purpose of aiding
developers when constructing ontologies (RDFS, OWL) and RDF data, and do no not offer
much value to users with little or no technical skills. Some examples of such applications are
Protégé [37], RDF Gravity [40] and Welkin [42]. These tools provide complex tree- and graph-
visualizations of the data entities and the relationships between them, which is useful for
3
getting a better understanding of the data structure. However, they are built around the purpose
of supporting technical development of ontologies and RDF data only, thus not focusing on
visualizing Linked Open Data on the Web.
In addition to the tree- and graph-visualizations that dominate desktop-applications, the
most common way of visualizing RDF data on the Web is simply by using tables. Most existing
Linked Open Data sets currently use this way of visualizing RDF data, including DBpedia [5]
and Freebase [19]. Pubby [12] is a tool developed by the University of Berlin for visualizing
RDF data in a table format. This tool gives a good overview over the data, but offers no
intuitive ways of categorizing the data or applying additional semantics to them. For instance,
there may be several data resources that points to an image-URL, but there are no intuitive
ways of separating these data from the other data, apart from the predicate and the file
extension of the URL. Moreover, the common table-view of RDF data does not display
different colors, or clusters similar data together, nor does it provide intuitive ways of showing
what data resources are the subjects and objects in the different triples.
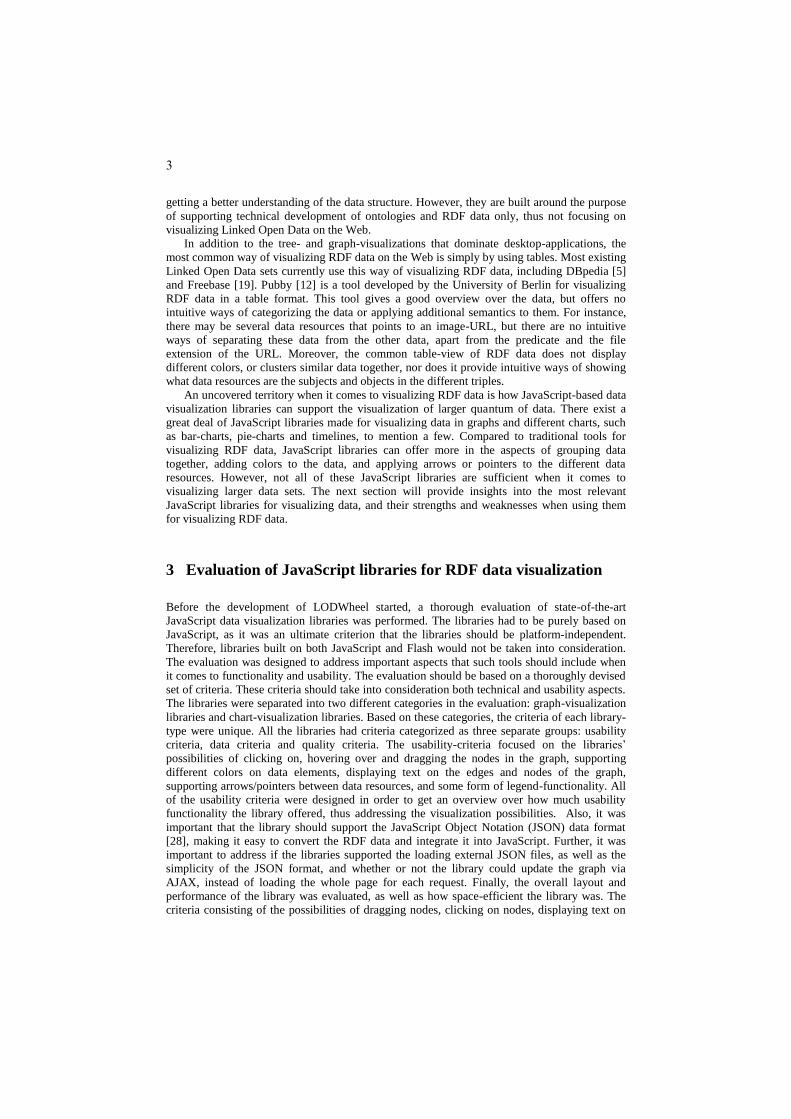
An uncovered territory when it comes to visualizing RDF data is how JavaScript-based data
visualization libraries can support the visualization of larger quantum of data. There exist a
great deal of JavaScript libraries made for visualizing data in graphs and different charts, such
as bar-charts, pie-charts and timelines, to mention a few. Compared to traditional tools for
visualizing RDF data, JavaScript libraries can offer more in the aspects of grouping data
together, adding colors to the data, and applying arrows or pointers to the different data
resources. However, not all of these JavaScript libraries are sufficient when it comes to
visualizing larger data sets. The next section will provide insights into the most relevant
JavaScript libraries for visualizing data, and their strengths and weaknesses when using them
for visualizing RDF data.
3 Evaluation of JavaScript libraries for RDF data visualization
Before the development of LODWheel started, a thorough evaluation of state-of-the-art
JavaScript data visualization libraries was performed. The libraries had to be purely based on
JavaScript, as it was an ultimate criterion that the libraries should be platform-independent.
Therefore, libraries built on both JavaScript and Flash would not be taken into consideration.
The evaluation was designed to address important aspects that such tools should include when
it comes to functionality and usability. The evaluation should be based on a thoroughly devised
set of criteria. These criteria should take into consideration both technical and usability aspects.
The libraries were separated into two different categories in the evaluation: graph-visualization
libraries and chart-visualization libraries. Based on these categories, the criteria of each library-
type were unique. All the libraries had criteria categorized as three separate groups: usability
criteria, data criteria and quality criteria. The usability-criteria focused on the libraries’
possibilities of clicking on, hovering over and dragging the nodes in the graph, supporting
different colors on data elements, displaying text on the edges and nodes of the graph,
supporting arrows/pointers between data resources, and some form of legend-functionality. All
of the usability criteria were designed in order to get an overview over how much usability
functionality the library offered, thus addressing the visualization possibilities. Also, it was
important that the library should support the JavaScript Object Notation (JSON) data format
[28], making it easy to convert the RDF data and integrate it into JavaScript. Further, it was
important to address if the libraries supported the loading external JSON files, as well as the
simplicity of the JSON format, and whether or not the library could update the graph via
AJAX, instead of loading the whole page for each request. Finally, the overall layout and
performance of the library was evaluated, as well as how space-efficient the library was. The
criteria consisting of the possibilities of dragging nodes, clicking on nodes, displaying text on
4
nodes and text on edges were exclusive to the evaluation of the graph-visualization libraries.
The criteria for evaluating JavaScript visualization libraries are summarized in Table 1.
Table 1: The evaluation criteria of the JavaScript data visualization libraries.
Usability Data Quality Click on elements JSON compatible Layout
Hover on elements JSON from file Space efficiency
Drag nodes * JSON simplicity Performance
Different colors Update via AJAX
Text on nodes *
Text on edges *
Pointers between data *
Legend
* = exclusive for the graph-visualization libraries.
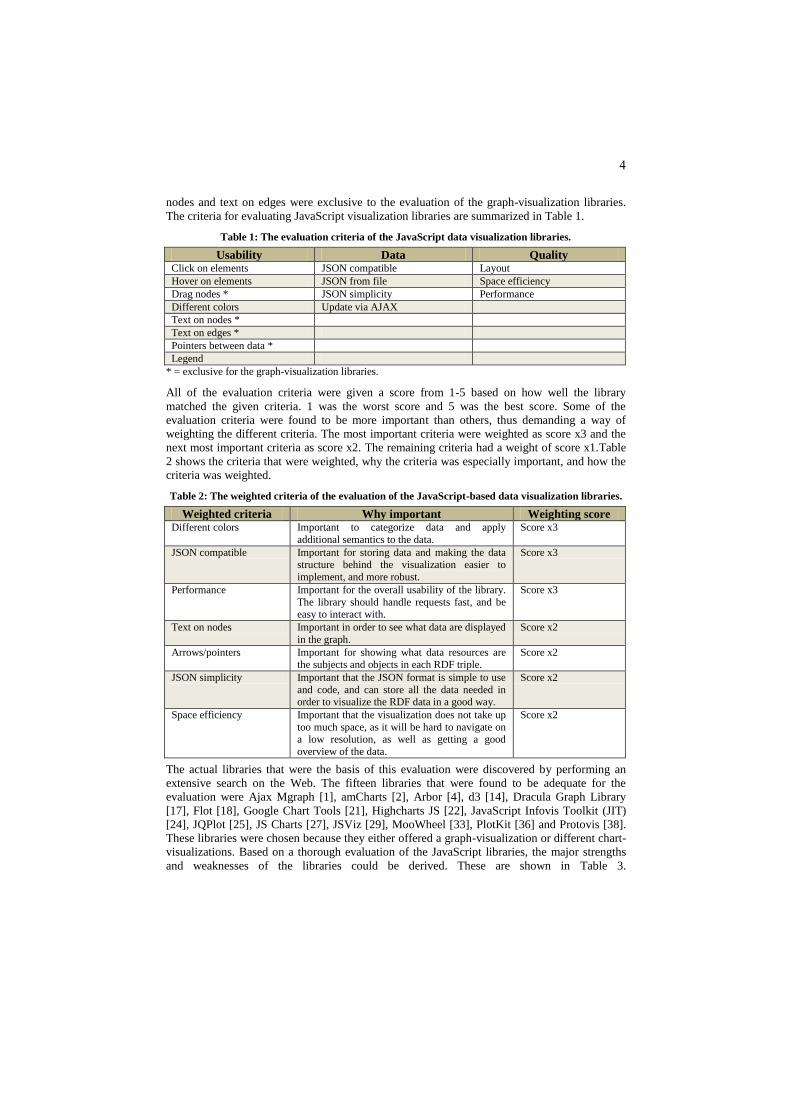
All of the evaluation criteria were given a score from 1-5 based on how well the library
matched the given criteria. 1 was the worst score and 5 was the best score. Some of the
evaluation criteria were found to be more important than others, thus demanding a way of
weighting the different criteria. The most important criteria were weighted as score x3 and the
next most important criteria as score x2. The remaining criteria had a weight of score x1.Table
2 shows the criteria that were weighted, why the criteria was especially important, and how the
criteria was weighted.
Table 2: The weighted criteria of the evaluation of the JavaScript-based data visualization libraries.
Weighted criteria Why important Weighting score Different colors Important to categorize data and apply
additional semantics to the data.
Score x3
JSON compatible Important for storing data and making the data structure behind the visualization easier to
implement, and more robust.
Score x3
Performance Important for the overall usability of the library.
The library should handle requests fast, and be easy to interact with.
Score x3
Text on nodes Important in order to see what data are displayed
in the graph.
Score x2
Arrows/pointers Important for showing what data resources are the subjects and objects in each RDF triple.
Score x2
JSON simplicity Important that the JSON format is simple to use
and code, and can store all the data needed in order to visualize the RDF data in a good way.
Score x2
Space efficiency Important that the visualization does not take up
too much space, as it will be hard to navigate on a low resolution, as well as getting a good
overview of the data.
Score x2
The actual libraries that were the basis of this evaluation were discovered by performing an
extensive search on the Web. The fifteen libraries that were found to be adequate for the
evaluation were Ajax Mgraph [1], amCharts [2], Arbor [4], d3 [14], Dracula Graph Library
[17], Flot [18], Google Chart Tools [21], Highcharts JS [22], JavaScript Infovis Toolkit (JIT)
[24], JQPlot [25], JS Charts [27], JSViz [29], MooWheel [33], PlotKit [36] and Protovis [38].
These libraries were chosen because they either offered a graph-visualization or different chart-
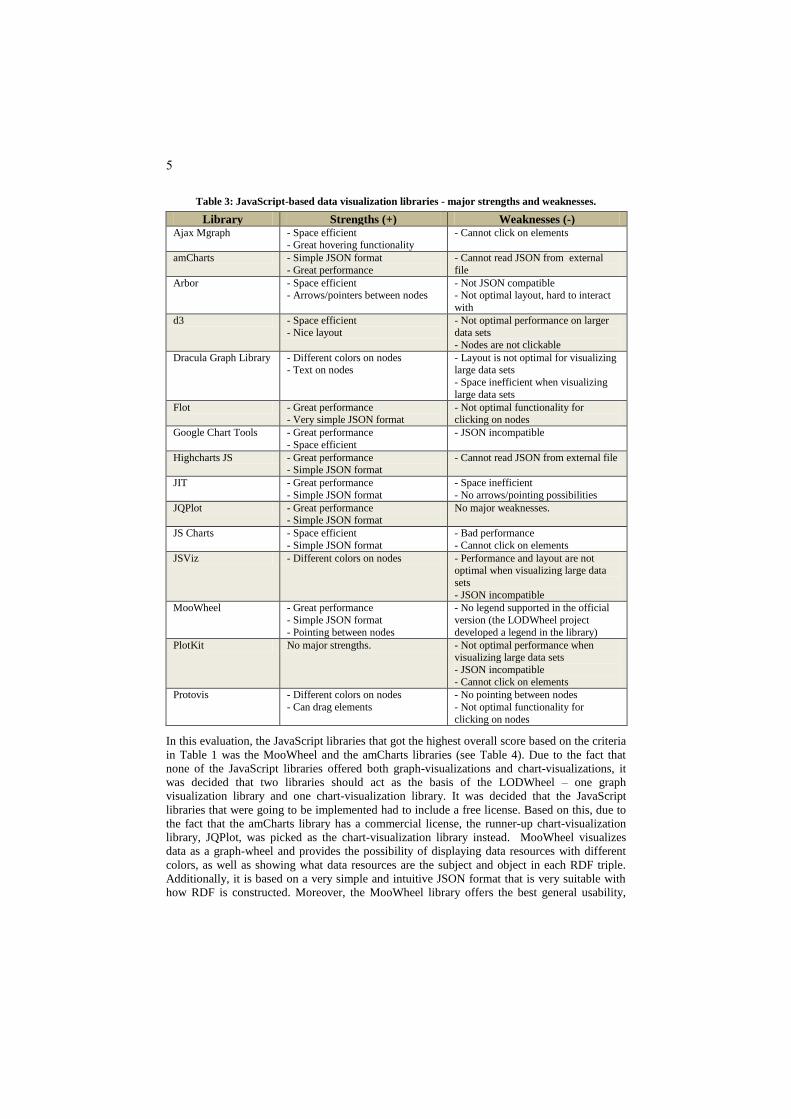
visualizations. Based on a thorough evaluation of the JavaScript libraries, the major strengths
and weaknesses of the libraries could be derived. These are shown in Table 3.
5
Table 3: JavaScript-based data visualization libraries - major strengths and weaknesses.
Library Strengths (+) Weaknesses (-) Ajax Mgraph - Space efficient
- Great hovering functionality - Cannot click on elements
amCharts - Simple JSON format
- Great performance
- Cannot read JSON from external
file
Arbor - Space efficient - Arrows/pointers between nodes
- Not JSON compatible - Not optimal layout, hard to interact
with
d3 - Space efficient - Nice layout
- Not optimal performance on larger data sets
- Nodes are not clickable
Dracula Graph Library - Different colors on nodes - Text on nodes
- Layout is not optimal for visualizing large data sets
- Space inefficient when visualizing
large data sets
Flot - Great performance - Very simple JSON format
- Not optimal functionality for clicking on nodes
Google Chart Tools - Great performance
- Space efficient
- JSON incompatible
Highcharts JS - Great performance - Simple JSON format
- Cannot read JSON from external file
JIT - Great performance
- Simple JSON format
- Space inefficient
- No arrows/pointing possibilities
JQPlot - Great performance - Simple JSON format
No major weaknesses.
JS Charts - Space efficient
- Simple JSON format
- Bad performance
- Cannot click on elements
JSViz - Different colors on nodes - Performance and layout are not optimal when visualizing large data
sets
- JSON incompatible
MooWheel - Great performance
- Simple JSON format
- Pointing between nodes
- No legend supported in the official
version (the LODWheel project
developed a legend in the library)
PlotKit No major strengths. - Not optimal performance when visualizing large data sets
- JSON incompatible
- Cannot click on elements
Protovis - Different colors on nodes
- Can drag elements
- No pointing between nodes
- Not optimal functionality for
clicking on nodes
In this evaluation, the JavaScript libraries that got the highest overall score based on the criteria
in Table 1 was the MooWheel and the amCharts libraries (see Table 4). Due to the fact that
none of the JavaScript libraries offered both graph-visualizations and chart-visualizations, it
was decided that two libraries should act as the basis of the LODWheel – one graph
visualization library and one chart-visualization library. It was decided that the JavaScript
libraries that were going to be implemented had to include a free license. Based on this, due to
the fact that the amCharts library has a commercial license, the runner-up chart-visualization
library, JQPlot, was picked as the chart-visualization library instead. MooWheel visualizes
data as a graph-wheel and provides the possibility of displaying data resources with different
colors, as well as showing what data resources are the subject and object in each RDF triple.
Additionally, it is based on a very simple and intuitive JSON format that is very suitable with
how RDF is constructed. Moreover, the MooWheel library offers the best general usability,
6
functionality and data operability. JQPlot visualizes data as different charts, such as bar-charts,
pie-charts and line-charts. The full evaluation can be viewed in an Excel file at this URL:
http://opendata.computas.com:7001/lodwheel/Evaluation_of_JavaScr
ipt_libraries.xsl
Table 4: The overall score of the JavaScript libraries.
Library Visualization Type License Overall Score Ajax Mgraph Chart Free 31
amCharts Chart Commercial 90
Arbor Graph Free, MIT [31] 72
d3 Chart and graph Free 57
Dracula Graph Library Graph Free, MIT 43
Flot Chart Free, MIT 72
Google Chart Tools Chart Free 56
Highcharts JS Chart Commercial 77
JIT Chart and graph Free 84
JQPlot Chart Free, MIT / GPL [20] 86
JS Charts Chart Commercial 53
JSViz Graph Free, Apache 2.0 [3] 15
MooWheel Graph Free, MIT 106
PlotKit Chart Free, BSD [11] 11
Protovis Chart and graph Free, BSD 62
4 LODWheel Overview
LODWheel is developed as a dynamic Web project based on Java Servlet Pages (JSP) with a
back-end programmed in the Java programming language, supported by the Jena framework. It
is an open-source project under the MIT license, and the prototype can be tested at this
location: http://opendata.computas.no:7001/lodwheel/. The architecture
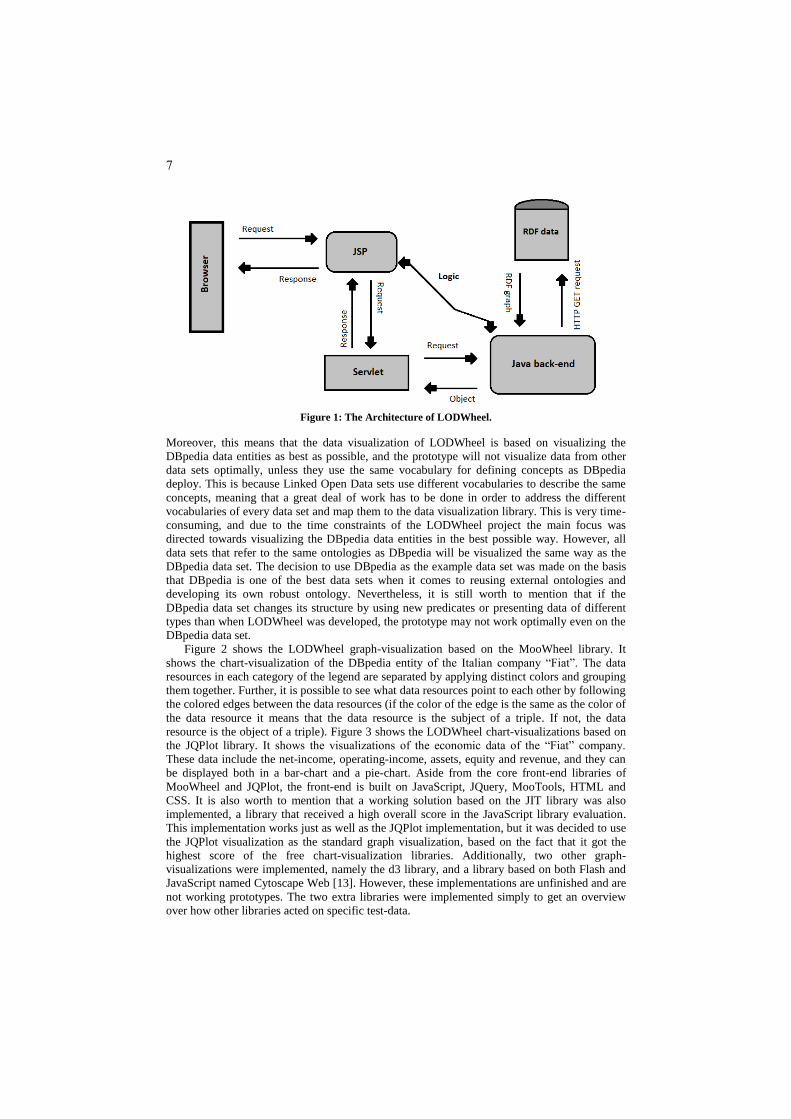
(see Figure 1) is based on a client/server architecture where the client sends a request through a
Web browser to the JSP servlet. The servlet then sends a request to the Java back-end that
executes an HTTP GET request based on a URI input from the user. If the URI is an RDF
resource the HTTP request will return the RDF graph of the URI. If not, the request will return
null. The back-end returns the RDF graph as an Object to the servlet, which then returns the
Object as a response to the JSP request. Based on the content of the Object, the JSP sends
several requests for logic operations to be performed by the back-end, in order to know what to
do with the Object. The front-end executes in the browser and is based on JavaScript, including
the JQuery [26] and MooTools framework [32], as well as CSS and HTML. The library used
for visualizing RDF data is called MooWheel and is purely based on JavaScript and the
MooTools framework. LODWheel also uses the JQPlot and JavaScript Infovis ToolKit (JIT)
libraries in order to visualize some of the data resources in charts. LODWheel is a fully
functional prototype for visualizing linked open RDF data as graphs and charts. From the
starting point, LODWheel is compatible with all open RDF data sets on the Web. However,
since so many of these data sets use different vocabulary to describe the same data resources, it
is time-consuming to develop a standardized system that is operable with all of these data sets.
Based on this, LODWheel has been developed with the purpose of working optimally on one of
the largest open RDF data set on the Web, namely DBpedia.
7
Figure 1: The Architecture of LODWheel.
Moreover, this means that the data visualization of LODWheel is based on visualizing the
DBpedia data entities as best as possible, and the prototype will not visualize data from other
data sets optimally, unless they use the same vocabulary for defining concepts as DBpedia
deploy. This is because Linked Open Data sets use different vocabularies to describe the same
concepts, meaning that a great deal of work has to be done in order to address the different
vocabularies of every data set and map them to the data visualization library. This is very time-
consuming, and due to the time constraints of the LODWheel project the main focus was
directed towards visualizing the DBpedia data entities in the best possible way. However, all
data sets that refer to the same ontologies as DBpedia will be visualized the same way as the
DBpedia data set. The decision to use DBpedia as the example data set was made on the basis
that DBpedia is one of the best data sets when it comes to reusing external ontologies and
developing its own robust ontology. Nevertheless, it is still worth to mention that if the
DBpedia data set changes its structure by using new predicates or presenting data of different
types than when LODWheel was developed, the prototype may not work optimally even on the
DBpedia data set.
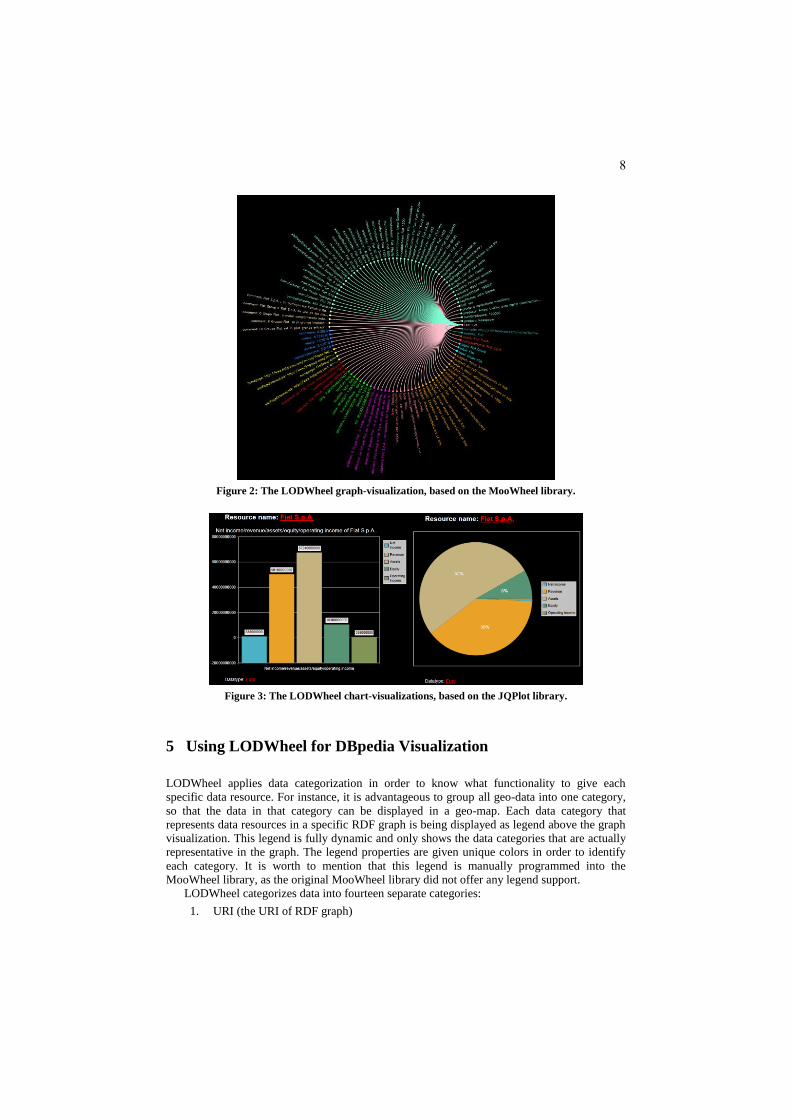
Figure 2 shows the LODWheel graph-visualization based on the MooWheel library. It
shows the chart-visualization of the DBpedia entity of the Italian company “Fiat”. The data
resources in each category of the legend are separated by applying distinct colors and grouping
them together. Further, it is possible to see what data resources point to each other by following
the colored edges between the data resources (if the color of the edge is the same as the color of
the data resource it means that the data resource is the subject of a triple. If not, the data
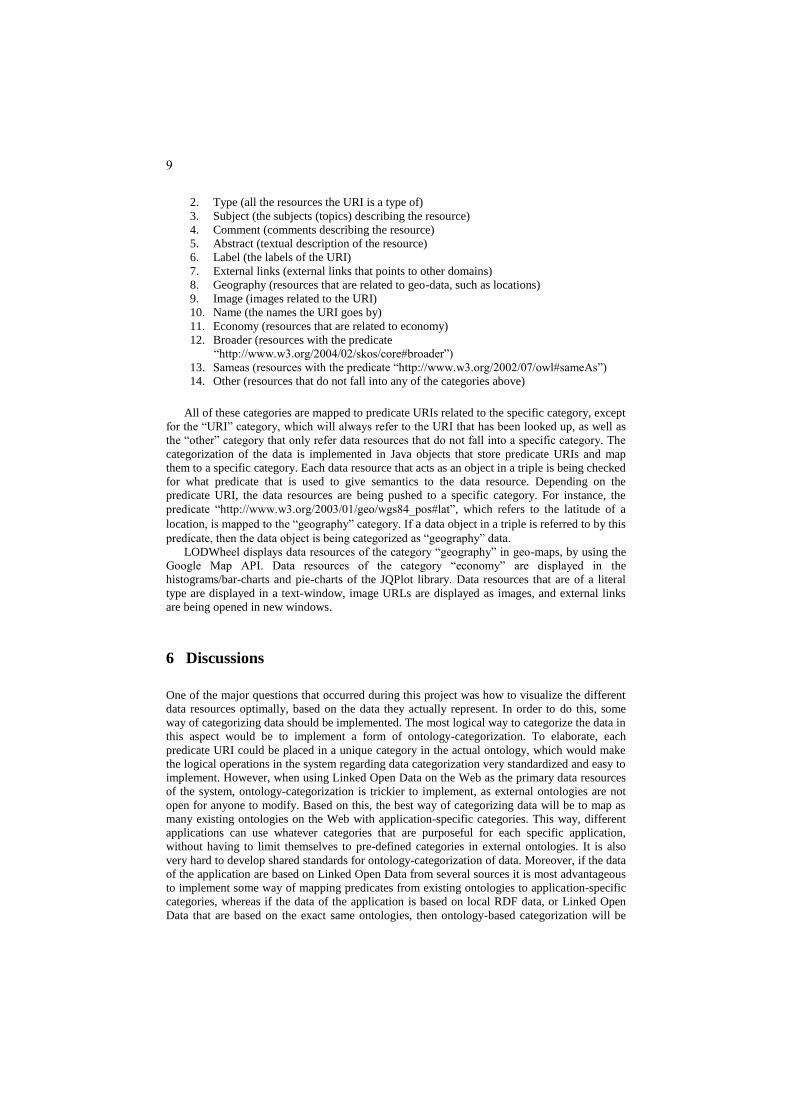
resource is the object of a triple). Figure 3 shows the LODWheel chart-visualizations based on
the JQPlot library. It shows the visualizations of the economic data of the “Fiat” company.
These data include the net-income, operating-income, assets, equity and revenue, and they can
be displayed both in a bar-chart and a pie-chart. Aside from the core front-end libraries of
MooWheel and JQPlot, the front-end is built on JavaScript, JQuery, MooTools, HTML and
CSS. It is also worth to mention that a working solution based on the JIT library was also
implemented, a library that received a high overall score in the JavaScript library evaluation.
This implementation works just as well as the JQPlot implementation, but it was decided to use
the JQPlot visualization as the standard graph visualization, based on the fact that it got the
highest score of the free chart-visualization libraries. Additionally, two other graph-
visualizations were implemented, namely the d3 library, and a library based on both Flash and
JavaScript named Cytoscape Web [13]. However, these implementations are unfinished and are
not working prototypes. The two extra libraries were implemented simply to get an overview
over how other libraries acted on specific test-data.
8
Figure 2: The LODWheel graph-visualization, based on the MooWheel library.
Figure 3: The LODWheel chart-visualizations, based on the JQPlot library.
5 Using LODWheel for DBpedia Visualization
LODWheel applies data categorization in order to know what functionality to give each
specific data resource. For instance, it is advantageous to group all geo-data into one category,
so that the data in that category can be displayed in a geo-map. Each data category that
represents data resources in a specific RDF graph is being displayed as legend above the graph
visualization. This legend is fully dynamic and only shows the data categories that are actually
representative in the graph. The legend properties are given unique colors in order to identify
each category. It is worth to mention that this legend is manually programmed into the
MooWheel library, as the original MooWheel library did not offer any legend support.
LODWheel categorizes data into fourteen separate categories:
1. URI (the URI of RDF graph)
9
2. Type (all the resources the URI is a type of)
3. Subject (the subjects (topics) describing the resource)
4. Comment (comments describing the resource)
5. Abstract (textual description of the resource)
6. Label (the labels of the URI)
7. External links (external links that points to other domains)
8. Geography (resources that are related to geo-data, such as locations)
9. Image (images related to the URI)
10. Name (the names the URI goes by)
11. Economy (resources that are related to economy)
12. Broader (resources with the predicate
“http://www.w3.org/2004/02/skos/core#broader”)
13. Sameas (resources with the predicate “http://www.w3.org/2002/07/owl#sameAs”)
14. Other (resources that do not fall into any of the categories above)
All of these categories are mapped to predicate URIs related to the specific category, except
for the “URI” category, which will always refer to the URI that has been looked up, as well as
the “other” category that only refer data resources that do not fall into a specific category. The
categorization of the data is implemented in Java objects that store predicate URIs and map
them to a specific category. Each data resource that acts as an object in a triple is being checked
for what predicate that is used to give semantics to the data resource. Depending on the
predicate URI, the data resources are being pushed to a specific category. For instance, the
predicate “http://www.w3.org/2003/01/geo/wgs84_pos#lat”, which refers to the latitude of a
location, is mapped to the “geography” category. If a data object in a triple is referred to by this
predicate, then the data object is being categorized as “geography” data.
LODWheel displays data resources of the category “geography” in geo-maps, by using the
Google Map API. Data resources of the category “economy” are displayed in the
histograms/bar-charts and pie-charts of the JQPlot library. Data resources that are of a literal
type are displayed in a text-window, image URLs are displayed as images, and external links
are being opened in new windows.
6 Discussions
One of the major questions that occurred during this project was how to visualize the different
data resources optimally, based on the data they actually represent. In order to do this, some
way of categorizing data should be implemented. The most logical way to categorize the data in
this aspect would be to implement a form of ontology-categorization. To elaborate, each
predicate URI could be placed in a unique category in the actual ontology, which would make
the logical operations in the system regarding data categorization very standardized and easy to
implement. However, when using Linked Open Data on the Web as the primary data resources
of the system, ontology-categorization is trickier to implement, as external ontologies are not
open for anyone to modify. Based on this, the best way of categorizing data will be to map as
many existing ontologies on the Web with application-specific categories. This way, different
applications can use whatever categories that are purposeful for each specific application,
without having to limit themselves to pre-defined categories in external ontologies. It is also
very hard to develop shared standards for ontology-categorization of data. Moreover, if the data
of the application are based on Linked Open Data from several sources it is most advantageous
to implement some way of mapping predicates from existing ontologies to application-specific
categories, whereas if the data of the application is based on local RDF data, or Linked Open
Data that are based on the exact same ontologies, then ontology-based categorization will be
10
the best way to go. However, one can argue that applying ontology-categorization to data that
are meant to be a part of the Linked Open Data cloud will put constraints on how the data
should be utilized, which may prevent the data from being used optimally by others.
Nonetheless, one can argue that ontology-categorization is the best way to go when it comes to
categorizing RDF data. There already exist useful frameworks related to ontology-
categorization, e.g. the FRESNEL vocabulary [9] and the R2R framework [10] for mapping
external data vocabularies to an internal vocabulary.
There are also several challenges when it comes to the actual visualization of RDF data in
graphs and charts. The main challenge is not related to the technical implementation of the data
visualization, but rather how the data should be visualized. For instance, it makes sense to show
the difference between the net income, operating income, revenue, assets and equity of a
company in a bar-chart, but when converting the same visualization to a pie-chart it does not
make as much sense anymore. Pie-charts are based on the fact that all resources in the chart
should altogether amount to 100% of a given variable. Displaying the economic resources of a
company mentioned above in a pie-chart shows the difference between each variable, but the
variables do not act as parts of a superior variable. To give an example, if there is a variable
representing the total net income of a company, it would make sense to display variables
showing what products constituted the total net income. Then the variable “net income” would
be the 100% of the pie-chart, and the income of each specific product would amount to the
100% of the total net income. Based on this, one could argue that RDF data should be carefully
constructed with the idea in mind that all data resources should relate to each other in a
semantic way. Moreover, RDF data could be constructed based on how the data could be
visualized in the most beneficial way, making it easy to know what to do with the actual data.
On the other hand, this is an ideological approach that is hard to apply in the real world.
Therefore, future research should rather go in the direction of how visualization tools can
utilize RDF data in the best possible way when it comes to applying semantic relations between
data resources.
Functionality that would enhance the usability of the application would include support for
interacting with the legend of the directed graph. Hovering over each legend category could
make a small window pop up, displaying all the resources related to that category, and
providing the possibilities of quickly interacting with them. Additionally, the pointing between
the nodes in the LODWheel graph could be even more intuitive, for instance by applying some
type of arrows to give a clearer indication of what data resources are pointing to each other.
Also, when hovering over elements it would be beneficial not to fade out the element that is
hovered. When the user hovers over elements that are not subjects in the graph it does not give
good feedback to the user that the element is actually possible to hover and click on. It would
also be beneficial to somehow emphasize the main URI that the graph is visualizing. It is
usually easy to spot the main URI based on several factors: the URI is identified in the graph by
having a “URI: “-description before the actual URI, it has a unique color, it usually points to a
great deal of resource objects, and it is located in the same place in the graph in every
visualization. However, the URI could be emphasized even more by applying identifiers such
as increasing the font-size and node-dot only for the URI. Finally, LODWheel is only tested in
the Mozilla Firefox v5.0, Google Chrome v12.0.742.122 and Internet Explorer v9.01 Web
browsers. Firefox and Chrome are compatible browsers, whereas the system does not run
properly in Internet Explorer. Optimizing the system to be compatible for all common Web
browsers is a challenge that should be addressed in future development.
Finally, customizing the LODWheel for being compatible with other data sets apart from
the DBpedia data set is not a major task. This would include mapping predicate URIs from
other data sets to the visualization library and the legend data stored as Java objects. Also, an
interesting aspect for future development is the idea of using several wheels for visualizing
data, instead of updating the same wheel every time a new URI should be visualized.
11
7 Conclusions and Future Work
The main purpose behind this project was to analyze the suitability of relevant JavaScript
libraries for visualizing RDF data. This was done by performing an extensive evaluation of 15
JavaScript-based data visualization libraries, based on a great deal of different evaluation
criteria. This evaluation acted as the foundation for choosing two JavaScript libraries that were
implemented as a prototype - one library for visualizing graphs, and one library for visualizing
charts. The MooWheel and JQPlot libraries acted as the foundation of the LODWheel
prototype, based on the fact that the libraries obtained the highest score in the evaluation and
were published under a free license. The LODWheel aims at providing insights into how RDF
data can be visualized as graphs and charts, and the underlying challenges concerning these
ways of visualizing RDF data. The challenges are mainly related to categorization of data
resources, and relating data resources to each other in new ways. An example of this was given
in Section 6, regarding the discussion of the “net income” variable of a company, and how this
variable could act as a total of several different net incomes from a variety of products the
company produces.
There are also big challenges related to external data issues. Since the system retrieves external
data from Linked Open Data sets on the Web, it is to a great extent dependent on these data sets
being well described. This is often not the case, which leads to numerous issues that need to be
addressed. The challenge in this aspect is the fact that most open data sets do not use the same
data terminology, meaning that the data sets describe the same data resources, but with
different vocabulary. Most of these data sets do not adopt one of the main Semantic Web
principles, which is the reuse of already existing ontologies. This makes it hard to develop a
standardized system that is interoperable with all RDF data sets. Additionally, there is a great
deal of uncovered territory when it comes to data-categorization of RDF data. Future research
should look at the advantages and disadvantages between ontology-categorization versus
application-specific categorization, and how each of these methods for categorizing RDF data
can support different types of applications. It is also important to address how visualization
tools can utilize RDF data for visualizing the data as intuitively and semantically as possible.
Acknowledgements. The work of Magnus Stuhr is partly funded by Computas AS, and the
work of David Norheim is fully funded by Computas AS. The work of Dumitru Roman is
partly funded by the Norwegian national project Semicolon 2, and the EU projects ENVISION
(FP7-249120) and ENVIROFI.
References
1. Ajax Mgraph: http://dragan.yourtree.org/blog/en/2007/03/31/ajax-mgraph/. Accessed
August, 2011.
2. amCharts: http://www.amcharts.com/. Accessed August, 2011.
3. Apache 2.0 License: http://www.opensource.org/licenses/Apache-2.0. Accessed August,
2011.
4. Arbor: http://arborjs.org/. Accessed August, 2011.
5. Auer, S., Bizer, C., Kobilarov, G., Lehmann, J., Cyganiak, R. (2007): DBpedia: A Nucleus
for a Web of Open Data. Lecture Notes in Computas Science: The Semantic Web. Springer:
Berlin, Germany.
6. Bastian M., Heymann, S., Jacomy, M. (2009): Gephi: an open source software for exploring
and manipulating networks. International AAAI Conference on Weblogs and Social Media.
12
7. Berners-Lee, T., Chen, Y., Chilton, L., Connolly, D., Dhjanaraj, R., Hollenbach, J., Lerer,
A. & Sheets, D., (2006): Tabulator: Exploring and Analyzing linked data on the Semantic
Web. In: Proceedings of the 3rd International Semantic Web User-Interaction Workshop.
8. Bernes-Lee, T., Hendler, J., Lassila, O. (2001): The Semantic Web. Scientific American:
284(5):34-43.
9. Bizer, C., Lee, R., Pietriga, E., (2006): Fresnel – A Browser-Independent Presentation
Vocabulary for RDF. Proceedings of the Second International Workshop on Interaction
Design and the Semantic Web. Springer: Berlin, Germany.
10. Bizer, C., Schultz, A. (2010): The R2R Framework: Publishing and Discovering Mappings
on the Web. 1st International Workshop on Consuming Linked Data (COLD 2010).
11. BSD license: http://www.opensource.org/licenses/bsd-license.php. Accessed August, 2011.
12. Cyganiak, R., Bizer, C. (2008): Pubby – A Linked Data Frontent for SPARQL Endpoints.
Available at: http://www4.wiwiss.fu-berlin.de/pubby/. Accessed August, 2011.
13. Cytoscape Web: http://cytoscapeweb.cytoscape.org/. Accessed August, 2011.
14. d3: http://mbostock.github.com/d3/. Accessed August, 2011.
15. Dean, M., Margerison, J., (2002): PalmDAML. http://www.daml.org/PalmDAML/.
16. Deligiannidis, L., Kochut, K. J., Sheth, A. P., (2007): RDF Data Exploration and
Visualization. CIMS '07 Proceedings of the ACM first workshop on CyberInfrastructure:
information management in eScience. ACM: New York, USA.
17. Dracula Graph Library: http://www.graphdracula.net/. Accessed August, 2011.
18. Flot: http://code.google.com/p/flot/. Accessed August, 2011.
19. Freebase: http://www.freebase.com/. Accessed August, 2011.
20. General Public License (GPL): http://www.opensource.org/licenses/gpl-license.php.
Accessed August, 2011.
21. Google Chart Tools: http://code.google.com/intl/no-NO/apis/chart/. Accessed August,
2011.
22. Highchart JS: http://www.highcharts.com/. Accessed August, 2011.
23. HTML5: http://www.w3.org/TR/html5/. Accessed August, 2011.
24. JavaScript Infovis Toolkit: http://thejit.org/. Accessed August, 2011.
25. JQPlot: http://www.jqplot.com/. Accessed August, 2011.
26. JQuery: http://jquery.com/. Accessed August, 2011.
27. JS Charts: http://www.jscharts.com/. Accessed August, 2011.
28. JSON: http://www.json.org/. Accessed August, 2011.
29. JSViz: http://code.google.com/p/jsviz/. Accessed August, 2011.
30. Linked Data: http://linkeddata.org/. Accessed August, 2011.
31. MIT license: http://www.opensource.org/licenses/mit-license.php. Accessed August, 2011.
32. MooTools: http://mootools.net/. Accessed August, 2011.
33. MooWheel: http://labs.unwieldy.net/moowheel/. Accessed August, 2011.
34. Oren, E., Delbru, R., Decker, S., (2006): Extended Faceted Navigation for RDF Data.
ISWC. Springer: Berlin, Germany.
35. Pietriga, E., (2006): IsaViz. http://www.w3.org/2001/11/IsaViz/.
36. PlotKit: http://www.liquidx.net/plotkit/. Accessed August, 2011.
37. Protégé: http://protege.stanford.edu/. Accessed August, 2011.
38. Protovis: http://mbostock.github.com/protovis/. Accessed August, 2011.
39. RDF: http://www.w3.org/RDF/. Accessed August, 2011.
40. RDF Gravity: http://semweb.salzburgresearch.at/apps/rdf-gravity/. Accessed August, 2011.
41. Steer, D., (2003): RDFAuthor. http://rdfweb.org/people/damian/RDFAuthor/.
42. Welkin: http://simile.mit.edu/welkin/. Accessed August, 2011.
![SANAPHOR: Ontology-Based Coreference Resolutioniswc2015.semanticweb.org/sites/iswc2015.semanticweb.org/files/93660417.pdf · 2.4 Coreference and Anaphora According to Ng [25], practically](https://img.pdfslide.us/doc/110x75/5e1ce397f236156b493987c4/sanaphor-ontology-based-coreference-24-coreference-and-anaphora-according-to-ng.jpg)