Embed Size (px)
Citation preview

Locations of Boundaries
of the Outer and Inner Radiation Belts
during the Recent Solar Minimum,
as Observed by Cluster and Double Star
Natalia Ganushkina (1,2) , Iannis Dandouras (3),
Yuri Shprits (4) , Jinbin Cao (5,6)
(1) Finnish Meteorological Institute, Helsinki, Finland
(2) University of Michigan, Ann Arbor, USA
(3) IRAP (ex-CESR), CNRS / University of Toulouse, Toulouse, France
(4) IGPP, University of California, Los Angeles, USA
(5) Beijing University of Aeronautics and Astronautics, Beijing, China
(6) State Key Laboratory of Space Weather, CSSAR, CAS, Beijing, China
ILWS - 11 Science Workshop, Beijing, China, Aug-Sep 2011

Outline
Introduction: The Terrestrial Radiation Belts
Methodology: Analysing the Terrestrial Radiation Belts with low-energy particle instruments : CIS onboard Cluster and HIA onboard Double Star
Radiation Belts boundaries locations: Results
Conclusion

Omnidirectional integrated proton fluxes (cm-2 s-1 ) trapped in the radiation belt.From NASA AP8 min model.
Energy > 10 MeV
Omnidirectional integrated electron fluxes (cm-2 s-1 ) trapped in the radiation belt.From NASA AE8 max model.
Energy > 1 MeV
Omnidirectional differential flux spectra for trapped electrons (AE8 max) and trapped protons (AP8 min)
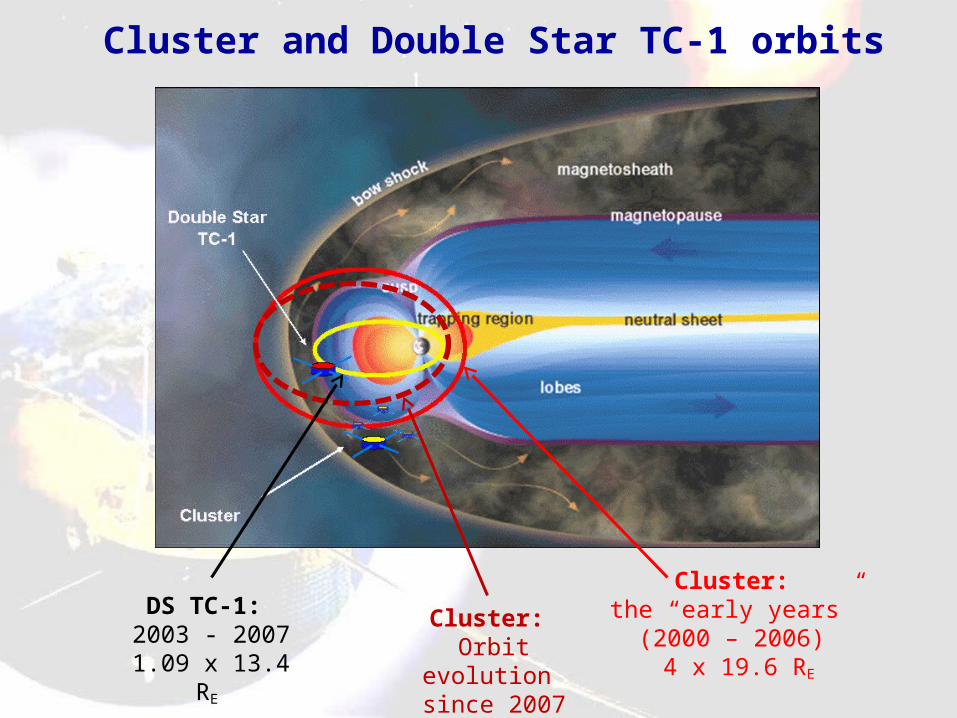
Cluster and Double Star TC-1 orbits
Cluster: the “early years” (2000 – 2006)
4 x 19.6 RE
Cluster: Orbit evolution
since 2007
DS TC-1: 2003 - 2007
1.09 x 13.4 RE
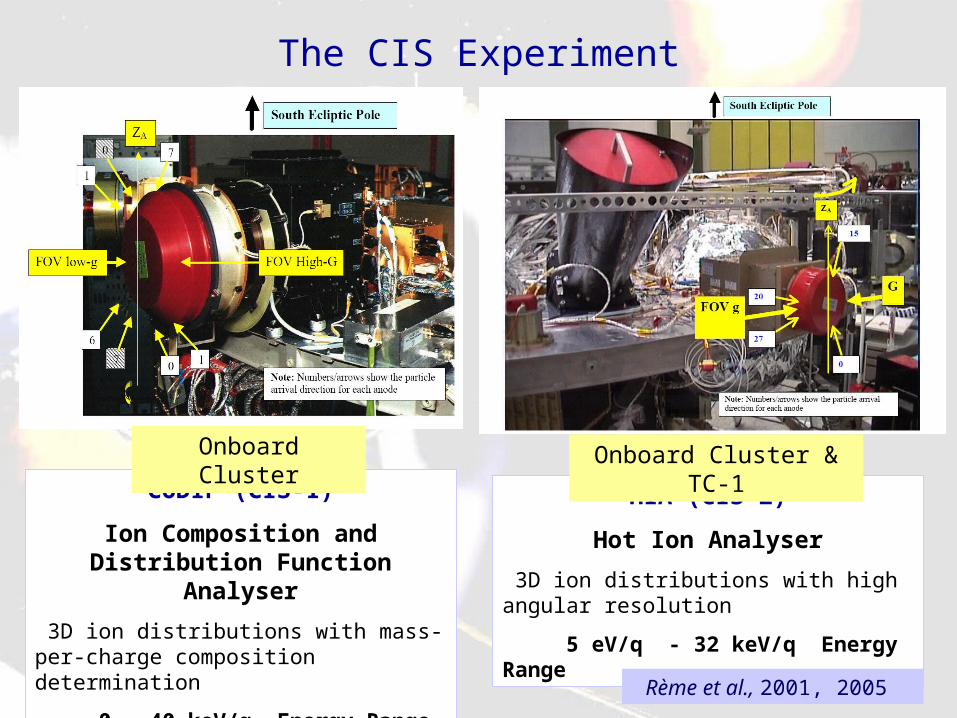
The CIS Experiment
CODIF (CIS-1)
Ion Composition and Distribution Function Analyser
3D ion distributions with mass-per-charge composition determination
~0 - 40 keV/q Energy Range
HIA (CIS-2)
Hot Ion Analyser
3D ion distributions with high angular resolution
5 eV/q - 32 keV/q Energy Range
Rème et al., 2001, 2005
Onboard Cluster Onboard Cluster & TC-1
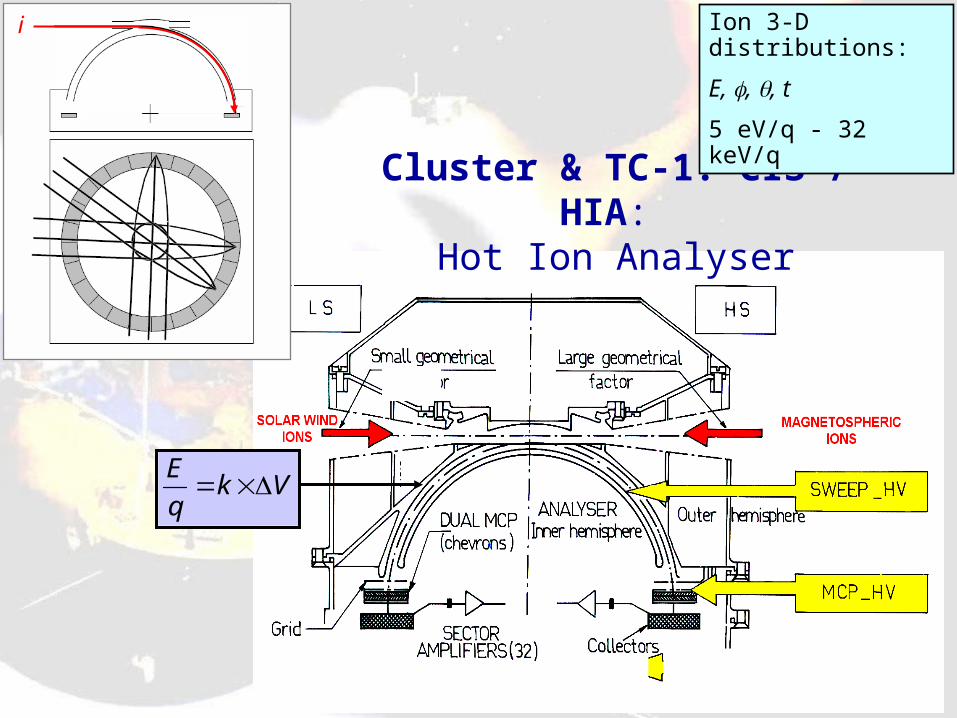
Cluster & TC-1: CIS / HIA: Hot Ion Analyser
Vkq
E
Ion 3-D distributions:
E, , , t
5 eV/q - 32 keV/q
i

How can we analyse
high-Energy (> MeV) particles
with a low-Energy (< 100 keV)
instrument ?

i+
Radiation Belt penetrating
particle
Accumulated wall thickness, for HIA onboard Cluster:
Typically 4 mm Al (2 mm minimum)
For HIA onboard Double Star: additional 4 mm Al

Energy of penetrating particles for HIA and CODIF
CLUSTER: Proton threshold: ~30 MeV Electron threshold: ~2 MeV
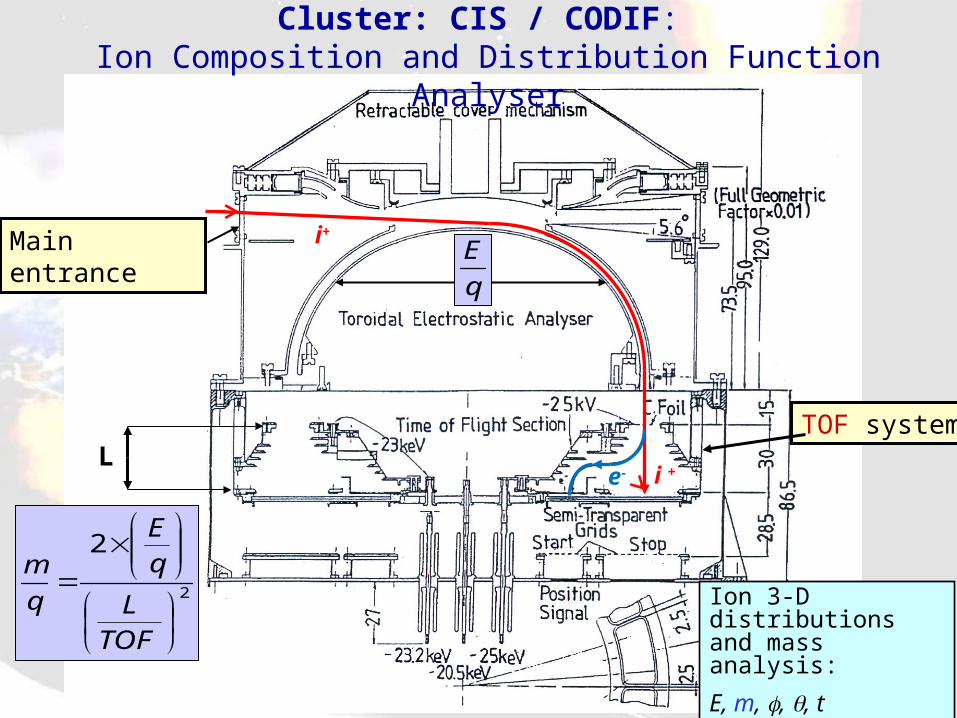
Cluster: CIS / CODIF: Ion Composition and Distribution Function Analyser
TOF system
2
2
TOFL
qE
q
m
L
q
EMain entrance
i +e-
i+
Ion 3-D distributionsand mass analysis:
E, m, , , t
0 eV/q - 40 keV/q

Outer RB
B1 B2 B3 B4 B5 B6
Outer RBInner RB
Boundaries of outer and inner radiation belts as observed by Cluster CIS:
Turning instrument background into science data
HIA
CO
DIF
Ring current ion drift bands
Reduced background due to TOF double coincidence
Background counts (penetrating high-energy particles)
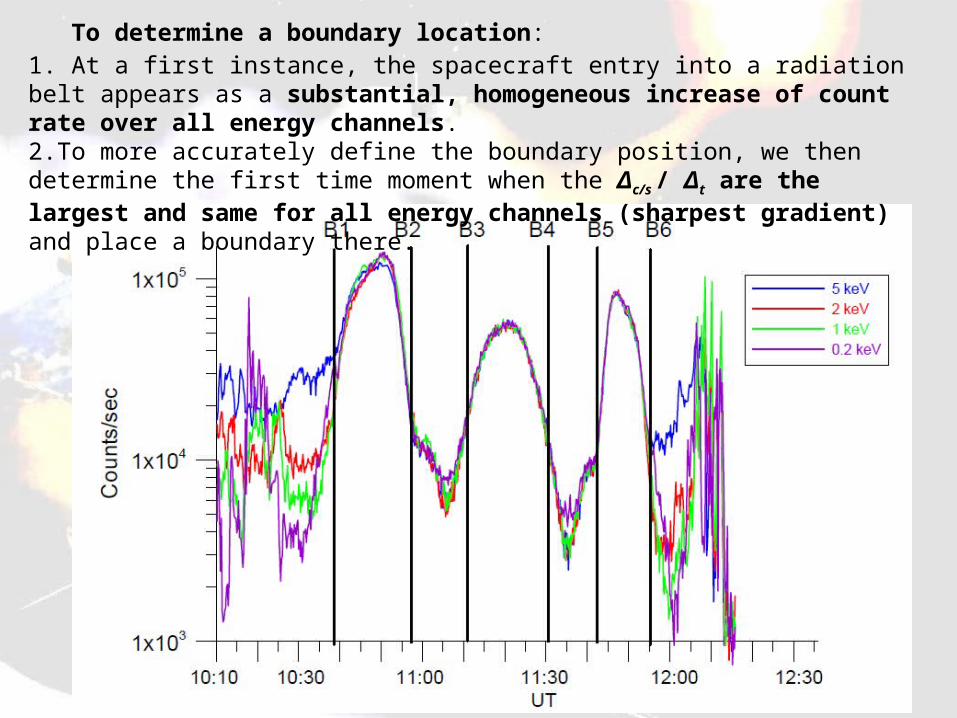
To determine a boundary location:1. At a first instance, the spacecraft entry into a radiation belt appears as a substantial, homogeneous increase of count rate over all energy channels. 2.To more accurately define the boundary position, we then determine the first time moment when the Δc/s / Δt are the largest and same for all energy channels (sharpest gradient) and place a boundary there.
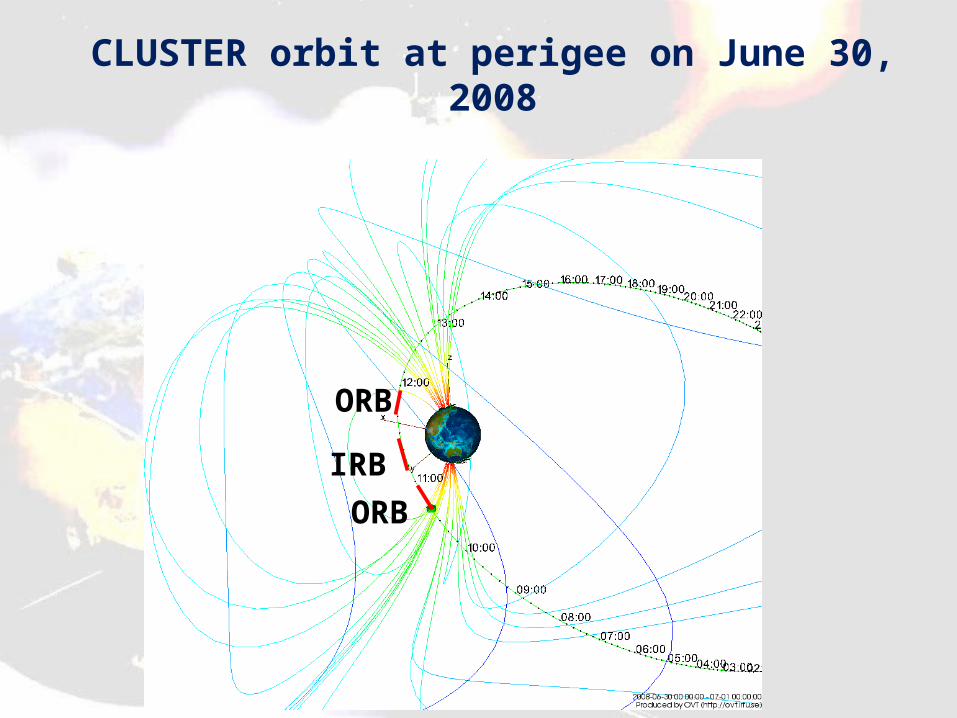
CLUSTER orbit at perigee on June 30, 2008
ORB
IRB
ORB

Boundaries of outer and inner radiation belts as observed by Cluster CIS at different orbits
B3 B4
Inner RBOuter RB Outer RB
B1 B2 B5 B6
ORB
ORB IRB

Example of boundaries’ locations at Double Star
B2 B3 B0 B4 B5
Outer RB Inner Outer RBInner

Locations of Rad-Belt boundaries for all events, MLT distribution (Cluster-CIS data): April 2007 - June 2009
B1 and B6:outer boundary of outer RB
B2 and B5:inner boundary of outer RB
B3 and B4:outer boundary of inner RB
Ganushkina, Dandouras, et al., JGR, in press, 2011
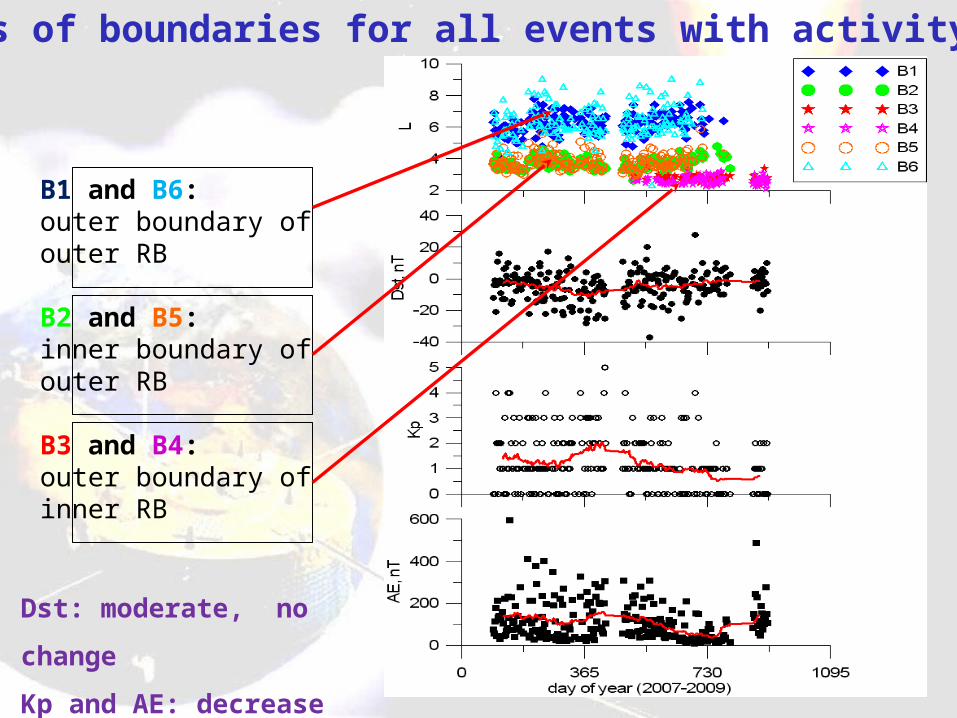
Locations of boundaries for all events with activity indices
B1 and B6:outer boundary of outer RB
B2 and B5:inner boundary of outer RB
B3 and B4:outer boundary of inner RB
Dst: moderate, no change
Kp and AE: decrease

Zoom
Locations of boundaries for all events with SW parameters
B1 and B6:outer boundary of outer RB
B2 and B5:inner boundary of outer RB
B3 and B4:outer boundary of inner RB
Running Average
Psw: no ave. change
Vsw: decrease
Dips of outer RB to lower L shells

Zoom on Outer RB boundary dip
Outer boundary of outer RB:- comes closer to Earth L=4- then moves tailward L=6
Time scale: 50 days
Before boundary dip:- Vsw from 430 to 540 km/sec- Kp to 5- Dst drop to -28 nT- AE to 700 nT- 2 peaks in Psw, 8 and 5 nPa
After boundary dip:- Vsw to 650 km/s- Kp to 5- Dst drop to -50 nT- AE to 800 nT- Psw at 3 nPa
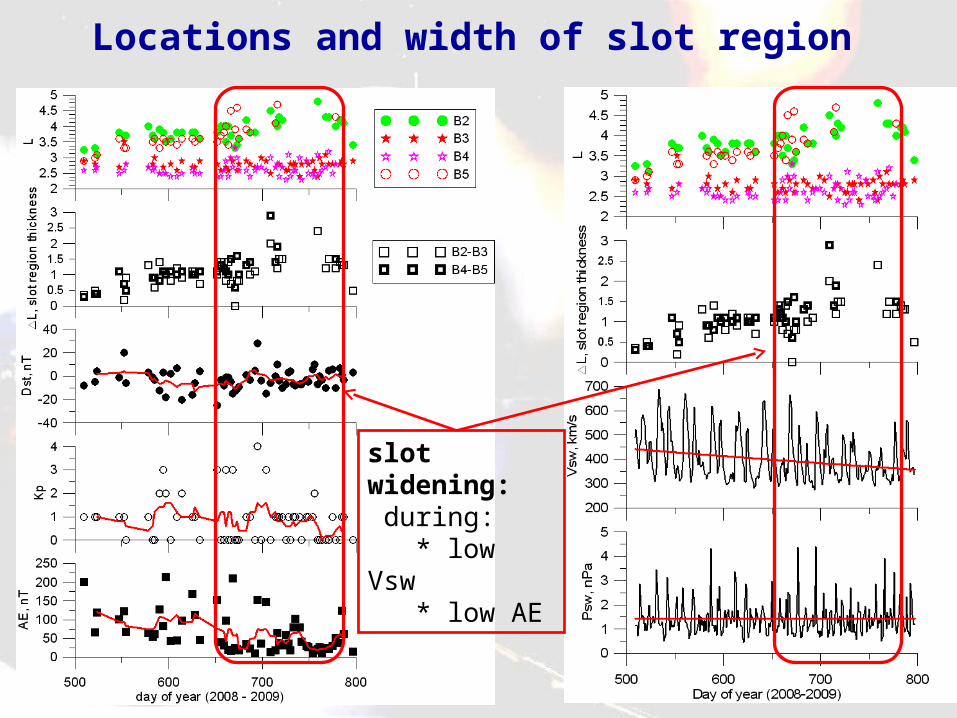
Locations and width of slot region
slot widening: during: * low Vsw * low AE

Locations of boundaries Observed at Double Star
B2 and B5:inner boundary of outer RB
B3 and B4:outer boundary of inner RB
B0:Inner boundary of inner RB
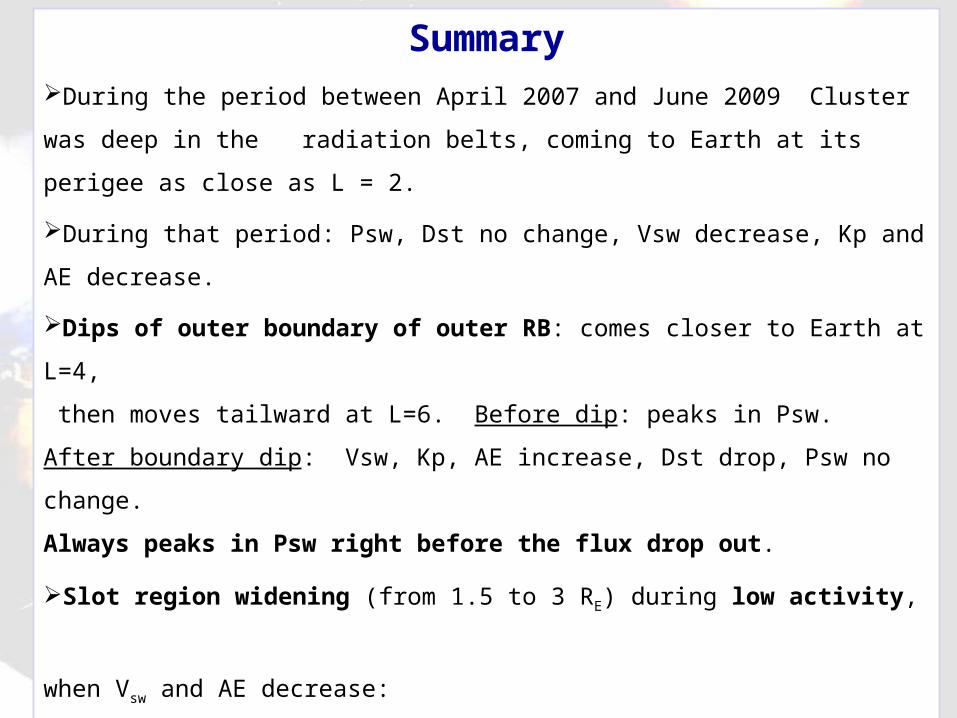
SummaryDuring the period between April 2007 and June 2009 Cluster was deep in the
radiation belts, coming to Earth at its perigee as close as L = 2.
During that period: Psw, Dst no change, Vsw decrease, Kp and AE decrease.
Dips of outer boundary of outer RB: comes closer to Earth at L=4,
then moves tailward at L=6. Before dip: peaks in Psw.
After boundary dip: Vsw, Kp, AE increase, Dst drop, Psw no change.
Always peaks in Psw right before the flux drop out.
Slot region widening (from 1.5 to 3 RE) during low activity,
when Vsw and AE decrease:
consistent with weaker inward radial diffusion,
and also consistent with weaker local acceleration.
Boundaries determined from background measurements provide additional
information on Radiation Belts, useful for
Radiation Belts model development and validation.

Thank you !