Embed Size (px)
Citation preview

Location Efficiency Location Efficiency
and the CDMand the CDMThe Potential for Reducing Transportation The Potential for Reducing Transportation Greenhouse Gas Emissions by Changing Greenhouse Gas Emissions by Changing
Patterns of Urban DevelopmentPatterns of Urban Development
Chris ZegrasChris Zegras25 August 200425 August 2004

2
OutlineOutline
1.1. The ConceptThe Concept2.2. The Demographic and Geographic ContextThe Demographic and Geographic Context3.3. The Transportation Planning ContextThe Transportation Planning Context4.4. Methodological and Implementation Methodological and Implementation
PrecedentsPrecedents5.5. Challenges for CDMChallenges for CDM6.6. Proposed Approach for Santiago Proposed Approach for Santiago
(U. de Chile/LABTUS)(U. de Chile/LABTUS)

3
TheThe ConceptConceptPremisePremise: :
Influencing urban land use patterns can produce Influencing urban land use patterns can produce fundamental changes in individual travel behavior (e.g., fundamental changes in individual travel behavior (e.g., modes used, distances traveled) and thereby influence modes used, distances traveled) and thereby influence transportation GHG emissions.transportation GHG emissions.
Not new idea Not new idea –– dating back at least to energy crises of 1970sdating back at least to energy crises of 1970s……
Influences are:Influences are:1. 1. IntraIntra--metropolitan metropolitan ((MesoMeso))
relative location of urban development within a metropolitan arerelative location of urban development within a metropolitan areaa
2. 2. Neighborhood Neighborhood (Micro)(Micro)form that the development takes (such as the density and diversiform that the development takes (such as the density and diversity ty of land uses)of land uses)

4
UnderstandingUnderstanding thethe ConceptConceptEm
i ssi
ons
=
Activities (pkm = trips x
distance)
Determinants:
• Population
• Demographics
• IncomeUrban
Structure
• ….
x
Sources: Based on Pargal & Heil, 2000; Schipper et al, 2001.
Mode Share(% pkm)
Determinants:
• Income
• Motorization rate
• Infrastructure Conditions
• Service Provision
Urban Structure
•….
x
Fuel Intensity
(liters per pkm)
Determinants:
• Fuel Efficiency
• Engine Type
• Vehicle Load
• Vehicle Age
• Congestion Levels
• Capacity Mix
Urban Structure
• …
x
Fuel Choice
(emission per liter)
Determinants:
• Fuel type
• Fuel Quality
• Engine Type
• Vehicle Technology
• Vehicle Age
• Temperature
• Altitude
•….
BehavioralBehavioral, , notnot ““technologicaltechnological””

5
TheThe ConceptConceptExamples of Possible EffectsExamples of Possible Effects
MesoMeso scalescale: : 6%6%--60% reduction in 60% reduction in GHGsGHGsMicro Micro scale: 4%scale: 4%--50% reduction in 50% reduction in GHGsGHGsCritical role of Critical role of modeling techniquemodeling technique in resultsin results……
Technical ChallengesTechnical ChallengesModeling complex behaviorModeling complex behavior
Travel decisions, land use decisions, joint land useTravel decisions, land use decisions, joint land use--travel decisionstravel decisionsBaselines: What would have happened otherwise?Baselines: What would have happened otherwise?
Implementation ChallengesImplementation ChallengesPotential long timePotential long time--frame to realize resultsframe to realize resultsMultiple government layers, plus private sector actors Multiple government layers, plus private sector actors Fighting more fundamental consumer desires/lifestyle choices?Fighting more fundamental consumer desires/lifestyle choices?
Housing preferences, auto ownershipHousing preferences, auto ownershipFew truly effective, relevant policy precedentsFew truly effective, relevant policy precedents……

6
The Concept in SantiagoThe Concept in Santiago’’s Contexts Context
A 1.25% annual A 1.25% annual population growth ratepopulation growth rate for next 30 years for next 30 years would add nearly would add nearly 1 1 million new million new householdshouseholds
What form will this What form will this growth take?growth take?Since 1980s, urban Since 1980s, urban area expanding at 70% area expanding at 70% > than population> than population
7
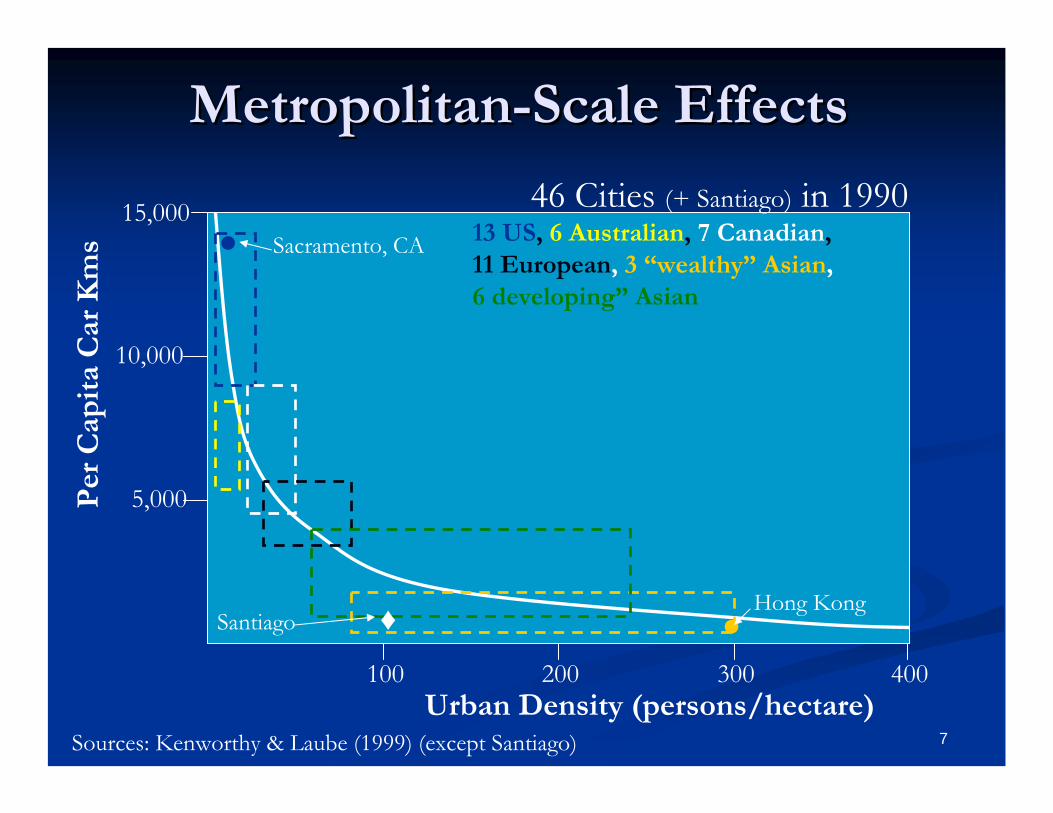
MetropolitanMetropolitan--Scale EffectsScale Effects
Sources: Kenworthy & Laube (1999) (except Santiago)Urban Density (persons/hectare)
15,000
10,000
5,000
100 200 300 400
Per
Cap
ita
Car
Km
s 13 US, 6 Australian, 7 Canadian,11 European, 3 “wealthy” Asian, 6 developing” Asian
Hong Kong
Sacramento, CA
●
●
♦Santiago
46 Cities (+ Santiago) in 1990

8
Land Use Effects:Land Use Effects:
CBD
MesoMesoMicroMicro
&&

9
Typical Travel Forecasting ProcessTypical Travel Forecasting ProcessData Inputs
Inventories/forecasts of population, land uses, travel behavior, etc.
I. Trip GenerationEstimate the total trip productions and attractions for each TAZ
II. Trip DistributionPredict the distribution of trips b/w origin & destination (O-D) TAZs
III. Modal ChoicePredicts share of trips by available modes b/w each O-D TAZ pair
IV. Trip AssignmentProject the specific route the trips will follow between TAZs
System OutputsProduces data such as traffic volumes, speeds, vehicle mix
Evaluation (incl., e.g., emissions, energy use, etc.)
Land uses projected by TAZ
Land uses in TAZ influence trip production/attraction
Size of TAZ influences “intrazonal” trips (often NMT)
Presence of public transport stops, parking can influence mode choice
No effects considered
& Land Use Effects& Land Use Effects

10
Land Use and the Typical Travel Land Use and the Typical Travel Forecasting Process: ShortcomingsForecasting Process: ShortcomingsRegional (Regional (mesomeso) focus reduces sensitivity to ) focus reduces sensitivity to micro micro effects, effects, particularly where particularly where TAZsTAZs are large (e.g. suburbs)are large (e.g. suburbs)Short trips (intraShort trips (intra--zonal; adjoining zones) difficult to zonal; adjoining zones) difficult to effectively model (and often neglected in surveyseffectively model (and often neglected in surveys……))Potentially influential Potentially influential micro micro factors such as local street factors such as local street connectivity and pedestrian design amenities are not connectivity and pedestrian design amenities are not reflectedreflectedHave been some Have been some advancesadvances to address theseto address these
LUTRAQ (Portland, OR, US), incorporate land use variables in LUTRAQ (Portland, OR, US), incorporate land use variables in several subseveral sub--models to reflect, e.g., models to reflect, e.g., ““walkabilitywalkability””Modeled a Land Use Alternative (65% future residential units & 78% percent of jobs located in transit oriented developments): estimated a 6% reduction in GHGs Relative to “No Build”
11
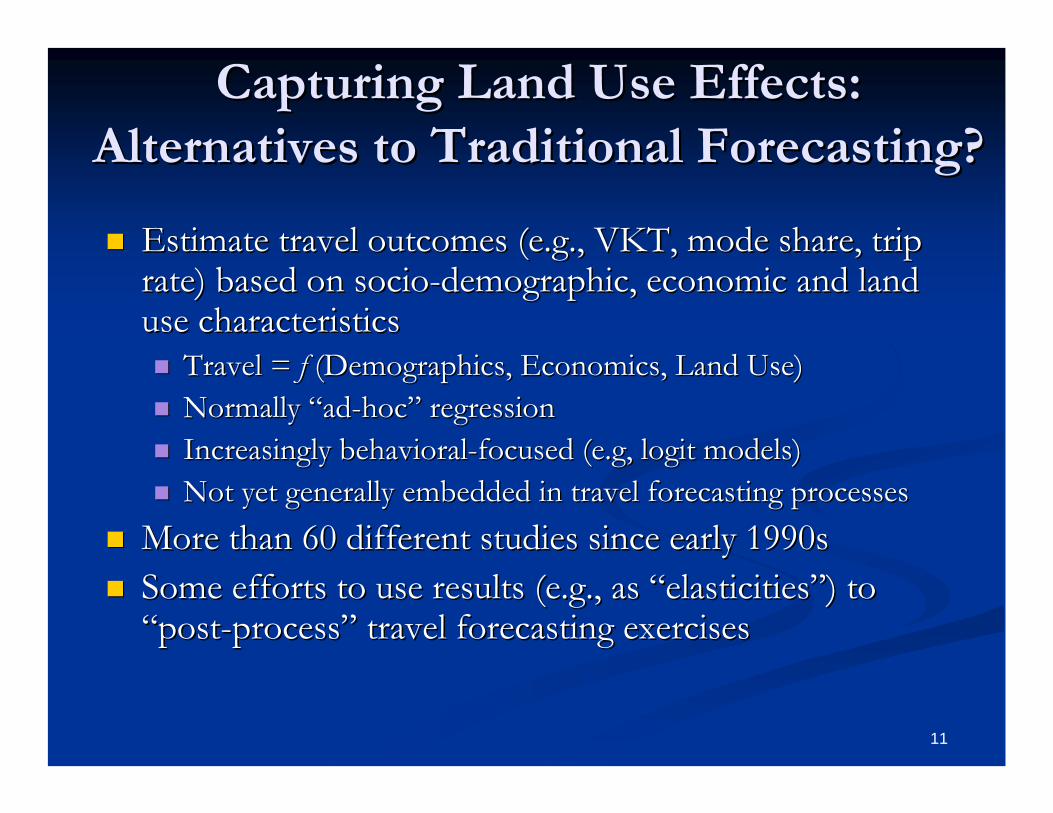
Capturing Land Use Effects: Capturing Land Use Effects: Alternatives to Traditional Forecasting?Alternatives to Traditional Forecasting?
Estimate travel outcomes (e.g., VKT, mode share, trip Estimate travel outcomes (e.g., VKT, mode share, trip rate) based on sociorate) based on socio--demographic, economic and land demographic, economic and land use characteristicsuse characteristics
Travel =Travel = f f (Demographics, Economics, Land Use)(Demographics, Economics, Land Use)Normally Normally ““adad--hochoc”” regressionregressionIncreasingly behavioralIncreasingly behavioral--focused (focused (e.ge.g, , logitlogit models)models)Not yet generally embedded in travel forecasting processesNot yet generally embedded in travel forecasting processes
More than 60 different studies since early 1990sMore than 60 different studies since early 1990sSome efforts to use results (e.g., as Some efforts to use results (e.g., as ““elasticitieselasticities””) to ) to ““postpost--processprocess”” travel forecasting exercisestravel forecasting exercises

12
Precedents: Canadian Mortgage and Precedents: Canadian Mortgage and Housing Corporation (CMHC)Housing Corporation (CMHC)
GHGs and Urban Travel Evaluation Tool
Source: IBI Group, 2000.
An econometric (An econometric (““snapshotsnapshot--inin--timetime””) tool.) tool.Ad hoc estimationAd hoc estimation
Estimated with data from 1996 Travel SurveyEstimated with data from 1996 Travel Survey
Predict VKT/Household via 2Predict VKT/Household via 2--stage model:stage model:1.1. Auto ownership = Auto ownership = f f (Income, Demographics, (Income, Demographics, Urban ContextUrban Context, ,
Local Land UseLocal Land Use))2.2. Auto VKT = Auto VKT = ff (Auto (Auto OwnershipOwnershippredictedpredicted, Income, , Income,
Demographics, Demographics, Urban ContextUrban Context, , Local Land UseLocal Land Use))2.2. Public Transport (PKT) = Public Transport (PKT) = f f (Auto (Auto OwnershipOwnershippredictedpredicted, ,
Demographics, Demographics, Urban ContextUrban Context, , Local Land UseLocal Land Use, Transit Service , Transit Service Levels)Levels)
13
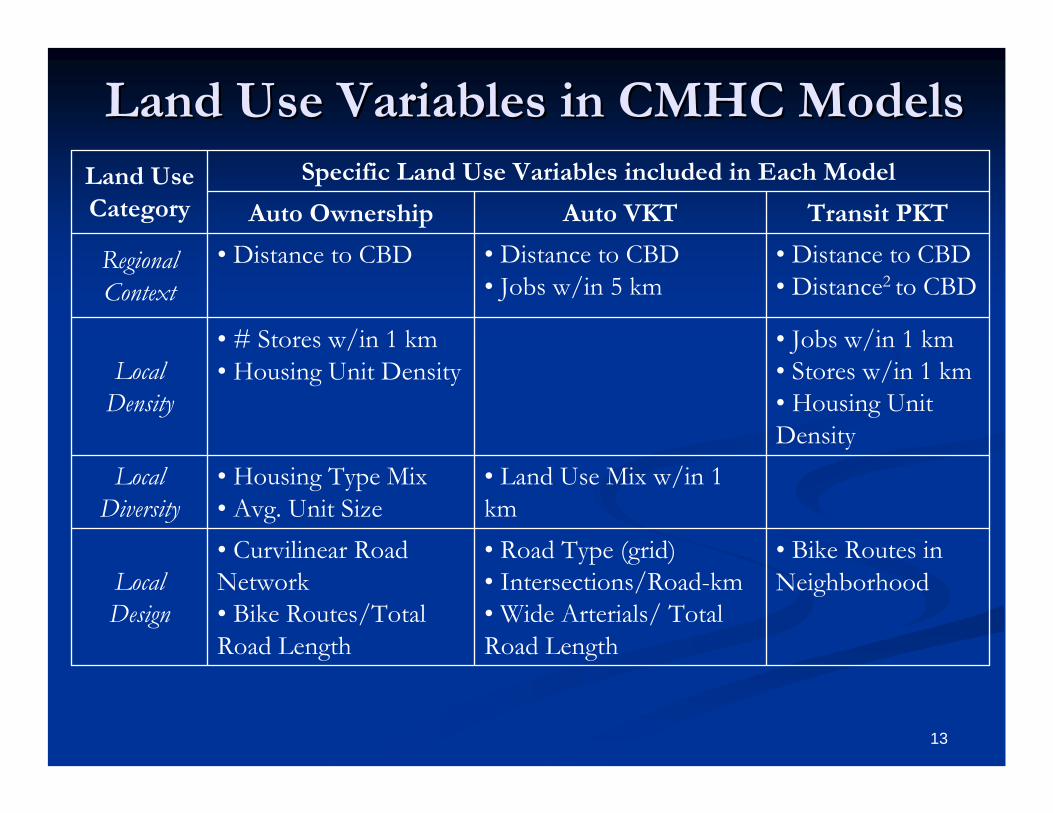
Land Use Variables in CMHC ModelsLand Use Variables in CMHC Models
• Bike Routes in Neighborhood
• Road Type (grid)• Intersections/Road-km• Wide Arterials/ Total Road Length
• Curvilinear Road Network• Bike Routes/Total Road Length
Local Design
• Land Use Mix w/in 1 km
• Housing Type Mix• Avg. Unit Size
LocalDiversity
• Jobs w/in 1 km• Stores w/in 1 km• Housing Unit Density
• # Stores w/in 1 km• Housing Unit DensityLocal
Density
• Distance to CBD• Distance2 to CBD
• Distance to CBD• Jobs w/in 5 km
• Distance to CBDRegional Context
Transit PKTAuto VKTAuto Ownership
Specific Land Use Variables included in Each ModelLand Use Category
14
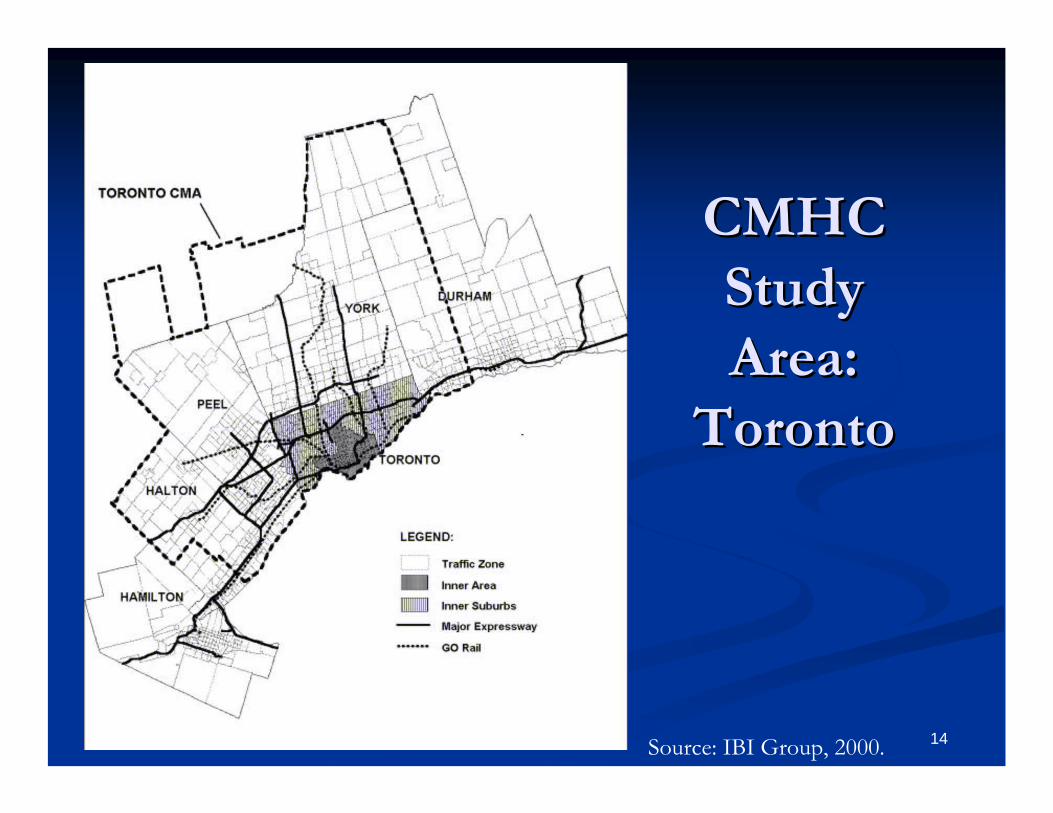
CMHC CMHC Study Study Area: Area:
TorontoToronto
Source: IBI Group, 2000.
15
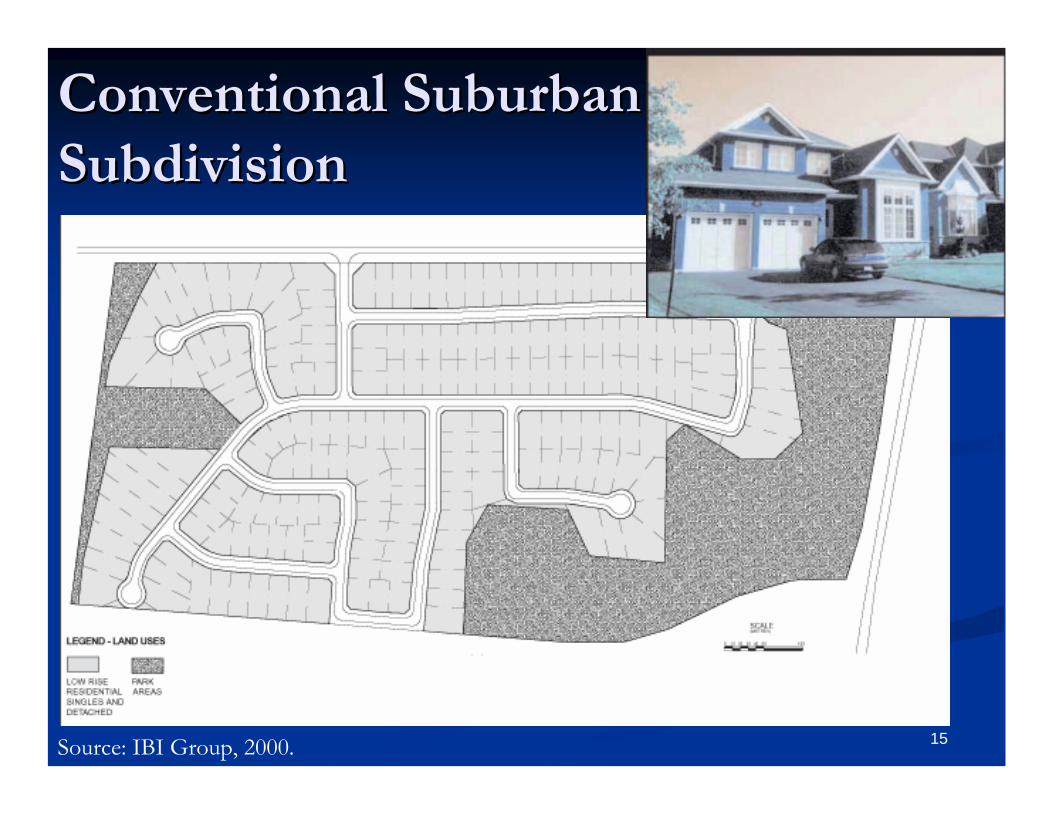
Conventional Suburban Conventional Suburban SubdivisionSubdivision
Source: IBI Group, 2000.

16
Medium Density Medium Density DevelopmentDevelopment
Source: IBI Group, 2000.

17
““NeoNeo--TraditionalTraditional””DevelopmentDevelopment
Source: IBI Group, 2000.
18
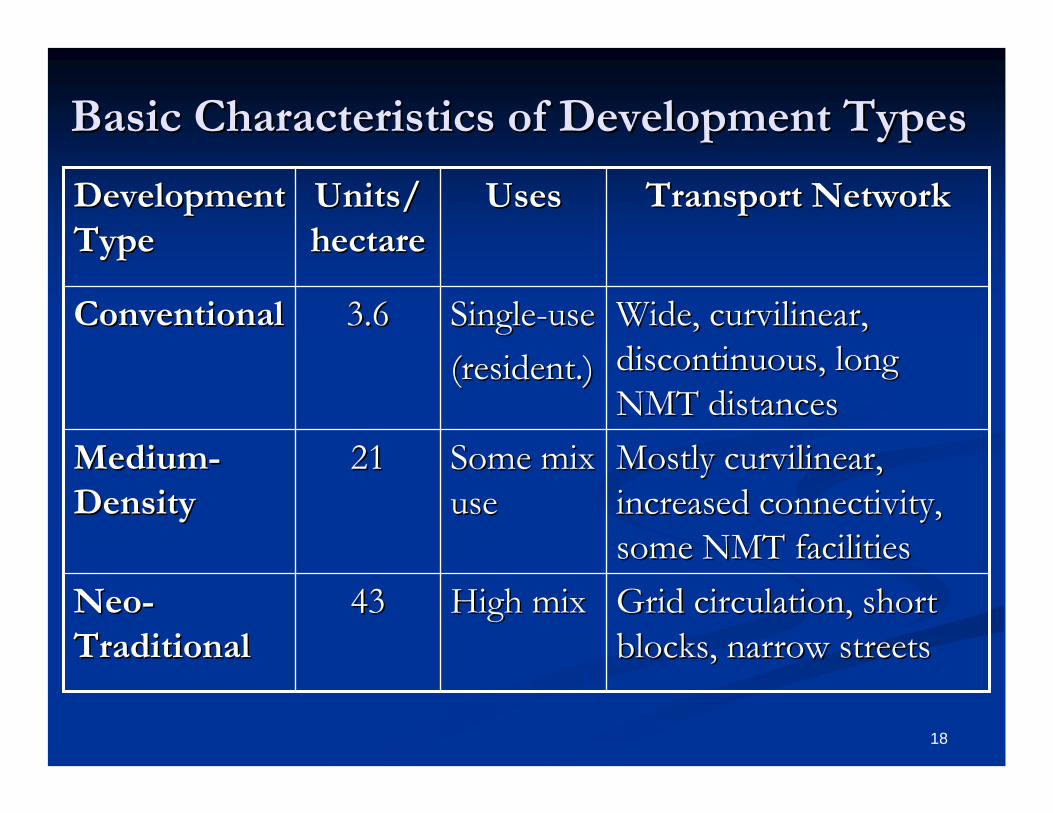
Basic Characteristics of Development TypesBasic Characteristics of Development Types
Grid circulation, short Grid circulation, short blocks, narrow streetsblocks, narrow streets
High mixHigh mix4343NeoNeo--TraditionalTraditional
Mostly curvilinear, Mostly curvilinear, increased connectivity, increased connectivity, some NMT facilitiessome NMT facilities
Some mix Some mix useuse
2121MediumMedium--DensityDensity
Wide, curvilinear, Wide, curvilinear, discontinuous, long discontinuous, long NMT distances NMT distances
SingleSingle--useuse(resident.)(resident.)
3.63.6ConventionalConventional
Transport NetworkTransport NetworkUsesUsesUnits/Units/hectarehectare
Development Development TypeType
19
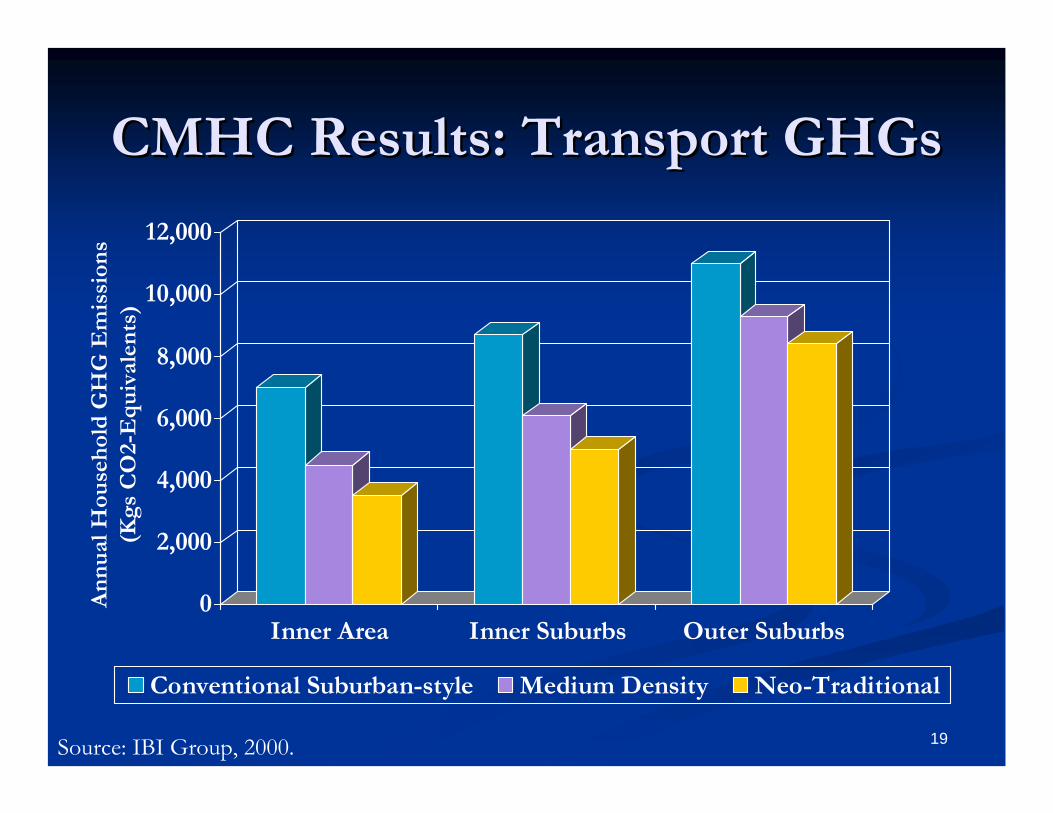
CMHC Results: Transport CMHC Results: Transport GHGsGHGs
0
2,000
4,000
6,000
8,000
10,000
12,000
Inner Area Inner Suburbs Outer Suburbs
Conventional Suburban-style Medium Density Neo-Traditional
Source: IBI Group, 2000.
An
nu
al H
ouse
hol
d G
HG
Em
issi
ons
(Kgs
CO
2-E
qu
ival
ents
)
20
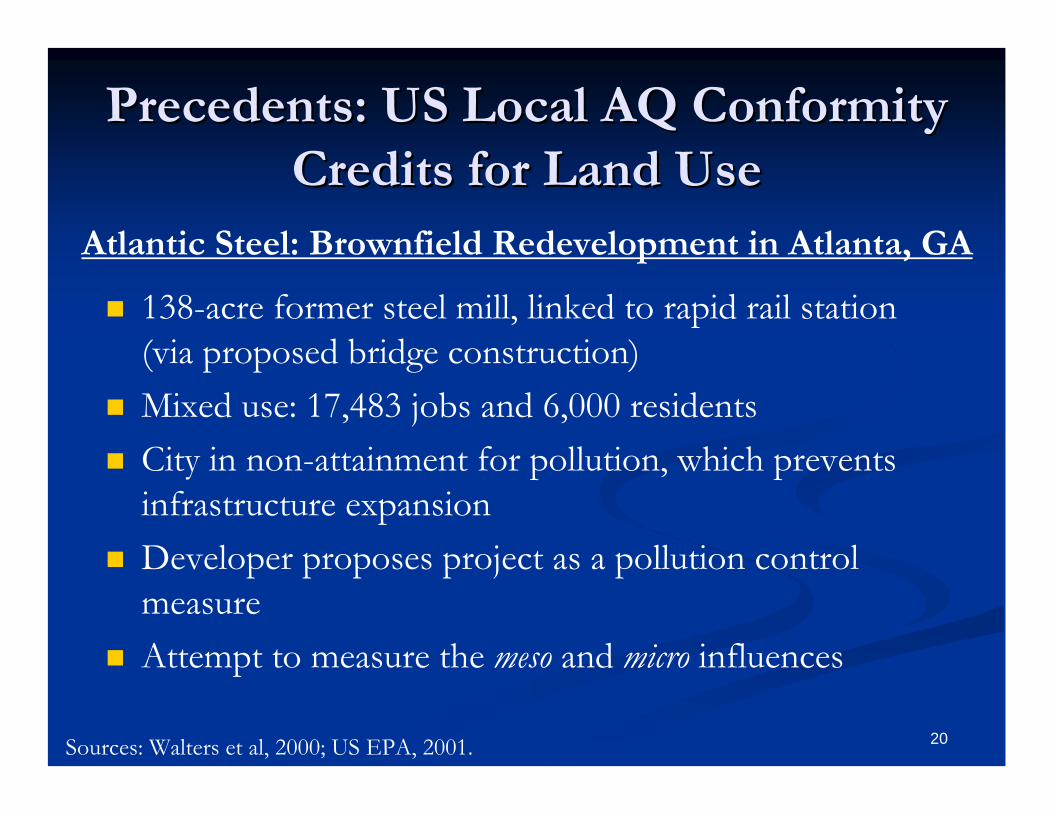
Precedents: US Local AQ Conformity Precedents: US Local AQ Conformity Credits for Land UseCredits for Land Use
138-acre former steel mill, linked to rapid rail station (via proposed bridge construction)Mixed use: 17,483 jobs and 6,000 residentsCity in non-attainment for pollution, which prevents infrastructure expansionDeveloper proposes project as a pollution control measureAttempt to measure the meso and micro influences
Sources: Walters et al, 2000; US EPA, 2001.
Atlantic Steel: Brownfield Redevelopment in Atlanta, GA
21
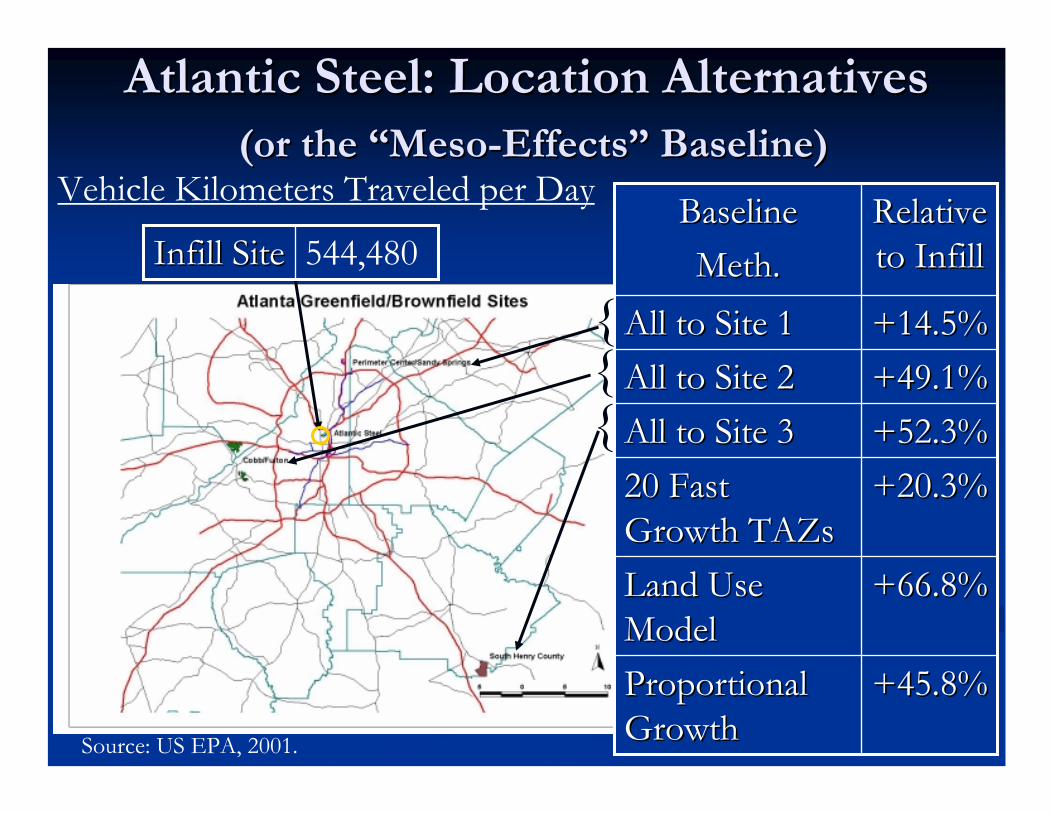
Atlantic Steel: Location AlternativesAtlantic Steel: Location Alternatives(or the (or the ““MesoMeso--EffectsEffects”” Baseline)Baseline)
+49.1%+49.1%All to Site 2All to Site 2+52.3%+52.3%All to Site 3All to Site 3
+14.5%+14.5%All to Site 1All to Site 1
Relative Relative to Infillto Infill
BaselineBaselineMethMeth..
+45.8%+45.8%Proportional Proportional GrowthGrowth
+66.8%+66.8%Land Use Land Use ModelModel
+20.3%+20.3%20 Fast 20 Fast Growth Growth TAZsTAZs
{{{
Vehicle Kilometers Traveled per Day
544,480Infill SiteInfill Site
Source: US EPA, 2001.

22
Atlantic Steel: Design Alternatives Atlantic Steel: Design Alternatives (or the (or the ““MicroMicro--EffectsEffects”” Baseline)Baseline)
Source: Walters et al, 2000.
1 2
3 Relative to Relative to ““GenericGeneric”” DesignDesign
VKT per VKT per DayDay
--5.1%5.1%516,464516,46433--5.8%5.8%512,704512,70422--3.8%3.8%523,822523,82211

23
Atlantic Steel: Monitoring and Atlantic Steel: Monitoring and VerificationVerification
Developer commits to annual data collectionDeveloper commits to annual data collection1)1) Average daily VKT per residentAverage daily VKT per resident2)2) Average daily VKT per employee at the siteAverage daily VKT per employee at the site3)3) Mode choice by residents/employeesMode choice by residents/employees4)4) Origin & destination data for trips made to, from, and on Origin & destination data for trips made to, from, and on
site by residents and employeessite by residents and employeesPerformance Goals, at twoPerformance Goals, at two--thirds build out:thirds build out:
1) Average daily VKT per resident will be less than 43 kms2) Average daily VKT per employee of the development will
be less than 17.6 kms3) Average daily total vehicle (non public transport) trips to
and from the site will be less than or equal to 72,000
24
Atlantic Steel: A Lesson in Atlantic Steel: A Lesson in ChallengesChallenges
US Economy since 2001US Economy since 2001……Atlanta commercial real estate market has Atlanta commercial real estate market has souredsouredRail station opening delayedRail station opening delayedSeveral major tenants renegedSeveral major tenants renegedBut, development But, development is is underwayunderway
July 2003: first 600 units of apartments begin to lease July 2003: first 600 units of apartments begin to lease up and receive certificates of occupancy. up and receive certificates of occupancy. May, 2004: first office building opensMay, 2004: first office building opens……