Embed Size (px)
Citation preview

Local TV News Coverage of the 2002 General Election
Most Americans say they get most of their news from local television. We analyzed the local news programs watched by most Americans to find out what news they got about the 2002 political campaigns. We recorded and studied more than 10,000 top-rated half-hour evening news broadcasts on 122 stations in the top 50 U.S. media markets in the seven weeks leading up to Election Day. We found that only 44 percent of those broadcasts contained any campaign coverage at all. Most of those stories aired in the last two weeks of the campaign, and most of those were about strategy and polls. The average campaign story was less than 90 seconds. Less than 30 percent of campaign stories included candidates speaking, and when they did, the average candidate sound bite was 12 seconds long. Less than 15 percent of the campaign stories on local television were about local campaigns, including U.S. House races. While viewers watching top-rated half-hours of local news had a less-than-even chance of seeing any campaign coverage at all, about half those broadcasts contained three or more paid political ads, and more than 80 percent of them aired at least one ad.
www.localnewsarchive.org

2 Local TV Coverage of the 2002 General Election
Local TV News Coverage of the 2002 General Election
Lear Center Local News Archive Wisconsin News LabThe Norman Lear Center
Most Americans receive their information on elections from local news programs, which broadcast on airwaves belonging to the public. How effective are these programs at providing the public with what they need to cast informed, responsible votes on Election Day? The Lear Center Local News Archive responds to this question by providing an unprecedented nationwide look at the media Americans experience during campaigns. Funded by the Pew Charitable Trusts and conducted in collaboration with the University of Wisconsin, Madison Department of Political Science, this project allows access to campaign stories aired during the height of an election, and hopes to be the impetus for better local political coverage. Visit the archive at www.localnewsarchive.org.
The Norman Lear Center is a multidisciplinary research and public policy center exploring implications of the convergence of entertainment, commerce and society. On campus, from its base in the USC Annenberg School for Communication, the Lear Center builds bridges between schools and disciplines whose faculty study aspects of entertainment, media and culture. Beyond campus, it bridges the gap between the entertainment industry and academia, and between them and the public. Through scholarship and research; through its fellows, conferences, public events and publications; and in its attempts to illuminate and repair the world, the Lear Center works to be at the forefront of discussion and practice in the field. The Lear Center is directed by USC Annenberg associate dean Martin Kaplan. For more information, please visit www.learcenter.org.
Located at the Department of Political Science at the University of Wisconsin, Madison, the Wisconsin NewsLab (www.polisci.sic.edu/localnews) coordinated the capture, coding and analysis of over 20,000 broadcasts during September and October of 2002. The broadcasts came from a group of 142 randomly selected stations in the country's top fifty markets and provide a comprehensive, systematic and generalizeable sample of local news coverage in over 65 percent of the country. The NewsLab is staffed by a team of post-doctoral, graduate and undergraduate students and directed by Professor Kenneth Goldstein, who also runs the Wisconsin Advertising Project, which has been monitoring political advertising across the United States since 2000. Funded by the Pew Charitable Trusts, the project documents the content, volume and targeting of political advertising in the country’s top 100 markets. More details on the project and its methodology are available at www.polisci.wisc.edu/tvadvertising.
3 Local TV Coverage of the 2002 General Election
Executive Summary
Project Overview
Research Methodolog
Findings
How Much Ca
What Type of
Campaign Ne
Station Perfor
Individual Sta
Future Research
Appendix I: Station Pe
Key to Appendix II
Appendix II: Station Ra
Aggregate Coverage –
Amount of Coverage o
Story Focus
Story Focus during the
Issues Mentioned Duri
Type of Race
Story Tone
Campaigning by Natio
Campaign News Storie
Campaign News Storie
Station Performance R
Station Rankings
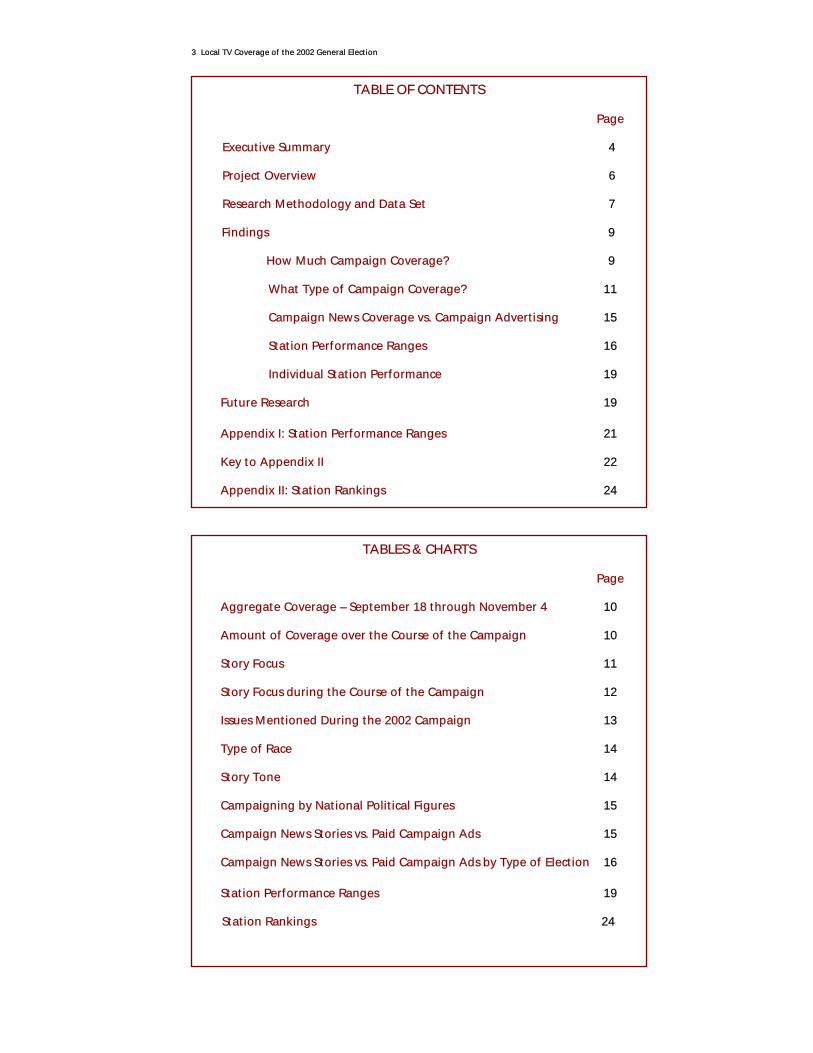
TABLE OF CONTENTS
Page
4
6
y and Data Set 7
9
mpaign Coverage? 9
Campaign Coverage? 11
ws Coverage vs. Campaign Advertising 15
mance Ranges 16
tion Performance 19
19
rformance Ranges 21
22
nkings 24
TABLES & CHARTS
Page
September 18 through November 4 10
ver the Course of the Campaign 10
11
Course of the Campaign 12
ng the 2002 Campaign 13
14
14
nal Political Figures 15
s vs. Paid Campaign Ads 15
s vs. Paid Campaign Ads by Type of Election 16
anges 19
24

4 Local TV Coverage of the 2002 General Election
Local TV News Coverage of the 2002 General Election
Executive Summary This report is released by the Lear Center Local News Archive—a collaboration between the USC
Annenberg School’s Norman Lear Center and the Department of Political Science at the University
of Wisconsin-Madison. The findings are based on an analysis of the highest-rated half-hour news
program aired during the early evening (4:00 to 7:30 p.m.) and the highest-rated half-hour of late
local news (9:00 to 11:30 p.m.) every night of the week on 122 randomly selected local television
stations in the top 50 media markets in the United States. The broadcasts analyzed in this report
aired from September 18 through November 4, 2002.
This report focuses on the following four questions:
Over the seven-week period reported on here, over half (56 percent) of the top-rated half-hour
news broadcasts did not contain a single campaign story. In the 44 percent of broadcasts that did
contain campaign coverage, the average election story was 89 seconds long. When campaign
stories aired, only 28 percent contained candidates saying anything at all. In those stories
showing candidates speaking, the average sound bite was 12 seconds long.
How much campaign coverage did local television stations’ most-watched regular news programs provide during the 2002 general election campaign, and when during the campaign did it occur?
How much of the coverage focused on strategy, and how much focused on issues?
How did the amount of local news coverage of the campaign compare to the amount of paid political advertising?
Did different stations provide distinct types and amounts of campaign coverage?
The findings of this study demonstrate that while some local news stations consistently provided
informative, in-depth campaign coverage, most stations largely ignored the campaign during their
top-rated news programming. When the stations covered races, they usually did so late in the
campaign and in a superficial manner. Although some stations may be providing more extensive
and in-depth election coverage during other time periods, the results of this study indicate that
they are not doing it during their most watched news programs.
How much coverage?
What type of coverage?
In general, the coverage focused primarily on the strategic and horserace aspects of the
campaign. Overall, 48 percent of the stories in our sample were about either campaign strategy

5 Local TV Coverage of the 2002 General Election
or the campaign horserace. This compares to 27 percent of the stories that focused on campaign
issues or analyzed political advertising.
Most of this coverage occurred at the end of the campaign. Nationwide, 68 percent of all the
election stories aired in the final three weeks of the campaign, and 54 percent aired in the final
two weeks of the campaign. Moreover, the proportion of stories about strategy increased in the
final two weeks of the campaign, and the proportion of stories about issues decreased. As a
consequence, when voters were exposed to the greatest amount of campaign coverage of the
season, they were more likely to get coverage about the game of politics and less likely to get
information about substantive campaign issues.
Nationwide, 38 percent of all campaign stories focused on a gubernatorial race. By contrast, 20
percent of the campaign stories focused on U.S. Senate races, and seven percent centered on
campaigns for the U.S. House of Representatives. Overall, seven percent of the stories in our
sample focused on races for the state senate, state assembly, mayor or vice mayors, local law
enforcement and all other regional, county and city offices. Even when counting stories about
U.S. House races as a type of local election, only 14 percent of all the stories in our sample
focused on local races.
The top ten issues mentioned in campaign news stories were all domestic issues, such as
education and taxes. However, three foreign policy/national security issues fell within the top
twenty issues mentioned: Iraq, defense/military and terrorism.
Story tone is an assessment of the narrative of a piece. A narrative that included both positive
and negative elements was coded as balanced. Stories that focused on the positive or negative
elements were coded accordingly. 42 percent of the stories in our sample were coded as having a
balanced tone, and 19 percent were coded as having a positive tone.
Campaign news stories vs. campaign advertising The ratio of political ads to campaign news stories was 3.6 to 1. Slightly more than four out of
ten of the broadcasts analyzed contained at least one campaign news story, while eight out of ten
of these same broadcasts contained at least one paid campaign ad. Just seven percent of the
broadcasts analyzed contained three or more campaign news stories, while almost half (49
percent) of these same broadcasts contained three or more paid campaign ads.
Do stations differ in the coverage they provide?
There is a great deal of difference in the quantity and quality of coverage provided by stations
around the country. In terms of the number of stories, nationwide, an average station aired 61
campaign stories over the seven-week period. The top ten percent of stations aired at least 107
stories—almost double the national average. In terms of total coverage, the top ten percent of
stations in the country aired at least three hours and two minutes of coverage over the seven-

6 Local TV Coverage of the 2002 General Election
week period. By contrast, 38 percent of the stations in our sample aired a total of less than one
hour of campaign coverage on their top-rated news programs. Nationwide, 27 percent of all
stories focused either on issues or adwatches. In contrast, the top ten percent of stations in the
country dedicated at least 42 percent of their campaign coverage to issues and adwatches.
Project Overview
The research presented in this report is the most comprehensive and systematic analysis of
campaign news coverage on local television stations ever conducted. It is a collaboration
between the USC Annenberg School’s Norman Lear Center and the Department of Political
Science at the University of Wisconsin-Madison.
The Norman Lear Center (www.learcenter.org) is a multidisciplinary research and public policy
center exploring implications of the convergence of entertainment, commerce and society. The
Lear Center began research on local news coverage of campaigns with the 1998 gubernatorial
election in California and continued with a study of the 2000 primary and general elections.
These research reports are available at www.localnewsarchive.org. The director of the Norman
Lear Center is USC Annenberg School associate dean Martin Kaplan; he is a principal investigator
on this project.
The Wisconsin NewsLab (www.polisci.wisc.edu/localnews) coordinated the capture, coding and
analysis of data for this report. Located on the campus of the University of Wisconsin-Madison,
the NewsLab is staffed by a team of post-doctoral, graduate and undergraduate students who are
responsible for acquiring, evaluating and storing local news broadcasts from all over the country.
Designed and developed in coordination with CommIT Technology Solutions
(www.commitonline.com), the NewsLab is run on its own multi-server system with over thirty
multimedia workstations. The director of the Wisconsin NewsLab is associate professor of political
science Ken Goldstein; he is a principal investigator on this project.
The Wisconsin Advertising Project, based at the University of Wisconsin-Madison, has been
monitoring political advertising across the United States since 2000. Funded by the Pew Charitable
Trusts, the project uses information provided by the Campaign Media Analysis Group to
document the content, volume and targeting of political advertising in the country’s top 100
markets, comprising 86 percent of the nation’s population. In the last three years alone, the
Wisconsin Advertising Project has collected, categorized and analyzed over 13,000 unique
political spots, and monitored each of the almost 3.5 million times that these spots aired. The
project has continually released real-time analyses and reports on the sponsors, content and
targeting of political advertising to the press and policymakers. In addition, scholars and students
at the University of Wisconsin as well as other institutions have used these data in scholarly studies
on the strategic use of political advertising and its impact on various sorts of mass behaviors and attitudes. More details on the project and its methodology are available at
www.polisci.wisc.edu/tvadvertising.

7 Local TV Coverage of the 2002 General Election
The Lear Center Local News Archive is funded by a grant from the Pew Charitable Trusts
(www.pewtrusts.com). The Pew Charitable Trusts support nonprofit activities in the areas of
culture, education, the environment, health and human services, public policy and religion. Based
in Philadelphia, the Trusts make strategic investments that encourage and support citizen
participation in addressing critical issues and effecting social change.
In addition to this report, the project is making the campaign stories that comprise it accessible to
registered users on the first searchable online video archive of campaign news stories aired on
regular local television news broadcasts. The archive can be found at www.localnewsarchive.org.
The archive allows users to define either broad or narrow search criteria, and then watch the
stories that meet their selections.
Research Methodology and Data Set
The 122 stations in this study were randomly selected from the population of the four top-rated
news stations in each of the 50 largest media markets in the country. A complete list of all
stations in the sample is available online at www.localnewsarchive.org. Beyond these 122 stations,
we selected an additional 20 stations and included four additional markets to ensure that the
archive included adequate coverage of markets with competitive races for governor, U.S. Senator
or U.S. House of Representatives, and to permit comparisons based on other attributes.1
The news broadcasts reported on here aired from September 18, 2002 through November 4,
2002.2 On most stations, we monitored the highest-rated half-hour of early evening and the
highest-rated half-hour of late night news. In cases where a station did not have an early evening
news broadcast, only the late night news was analyzed.3
Field staff “stringers” in 54 markets (about 65 percent of the nation’s households) captured local
news broadcasts on Philips DVDR985 recorders. The DVD recordings were sent every two days to
the NewsLab, where project staff logged close to 150 hours a day of this high-resolution digital
video. Coders went through every news broadcast and made video clips of all campaign-related
stories, which were then coded on over 50 attributes.
1 These attributes include membership in a voluntary consortium of stations, organized by the Pew Charitable Trusts, committed to journalistic best practices such as in-depth reporting on issues. Future reports will include analyses of these 20 additional stations and four additional markets. 2 While nationwide monitoring began on September 2, the period analyzed in this report starts on September 18. This time period starts the day after the two final primaries in Massachusetts and Washington, as the focus of this report is general election coverage. Election Day (November 5) is not included in this monitoring period. 3 Fourteen stations in the sample did not air an early news program. One station only aired an early news program on Sundays, and another aired an early evening news program during the week, but did not air an early evening news program on weekends.

8 Local TV Coverage of the 2002 General Election
The coding instrument is available online at www.localnewsarchive.org. The instrument was designed to capture a wide variety of information about campaign news stories, such as:
Total story length Date story aired Total number of candidate sound bites Length of candidate sound bites Issues discussed How often candidates are shown speaking Story tone (e.g. positive, negative, neutral) Station ownership Network affiliation Type of election (e.g., gubernatorial, U.S. Senate/ House) Story frame (e.g., strategy, horserace coverage, issue-based coverage)
Overall, the study examined 10,066 news broadcasts, or 5033 hours of local news programming,
over a seven-week (48-day) period. A total of 7,460 campaign news stories aired during these
broadcasts. Out of a total of 11,571 scheduled news broadcasts, 1,505 broadcasts were not
initially captured due to technical errors with the DVD recorders or human error among field staff,
or they were pre-empted for other programming. We therefore had a video capture rate of 88
percent of all broadcasts. Even though a capture rate of 88 percent is extraordinary for a project
of this size, we were able to reduce the number of missing broadcasts by analyzing broadcast
summaries provided by a professional video monitoring service. Wisconsin project staff examined
each broadcast summary to determine if a campaign story appeared during the broadcast.
Through this painstaking process, we were able to determine that 1,068 of the 1,505 missing
broadcasts contained no campaign stories. As a result we believe that we only missed 437
broadcasts that actually contained a campaign story, meaning a true capture rate of broadcasts
with campaign stories of 96 percent.
There is no reason to suspect that there are systematic differences between the data reported
here and the small amount of missing data. Even so, the data contained in this report are based
only on the broadcasts and campaign news stories actually watched and analyzed by project staff.
The majority of the report contains nationwide percentages and averages which, given the high
capture rate, are unlikely to be significantly affected by missing data.
It is important to reiterate that this report focuses on the highest-rated half-hour news broadcasts
on each station. The data set does not include, for example, the lengthy issue-based segments
aired by WNBC in New York during the final week of the campaign, because they did not air
during the station’s top-rated half-hour of early-evening news.
In addition, most of the stations in the sample aired more than a half-hour of local news in the early
evening. In fact, many stations air news coverage throughout the day and devote early Saturday and Sunday
morning programming to local news shows. Therefore, the findings of this study provide a snapshot of the

9 Local TV Coverage of the 2002 General Election
campaign coverage aired when most Americans are actually watching the news; it is not a study of all news
or all special event programming aired by stations in our sample.4
Television news broadcasts are often pre-empted or replaced by late-running sporting events, particularly on
weekends. As a result, the number of broadcasts for each station is based on broadcasts where the regular
news programs actually aired, not on the number of broadcasts a station would have aired without being
pre-empted or replaced.
Findings
How much campaign coverage?
The results show that less than half (44 percent) of the 10,066 broadcasts analyzed contained at least one
campaign news story. The percentage of broadcasts containing at least one campaign story varied
significantly by station, from 13 percent of broadcasts to 79 percent of broadcasts. On those broadcasts
that included campaign stories, the average length of a campaign story was 100 seconds during the early
evening broadcasts (4:00 to 7:30 p.m.), and 80 seconds during late night broadcasts (9:00 to 11:30 p.m.).
The overall average story length was 89 seconds. On average, the stations aired less than one campaign
story per broadcast. The total number of campaign stories aired per station during the period analyzed
ranged from just 12 stories to 158 stories.
Of the 7,460 campaign stories analyzed for this report, only 28 percent (2,079) showed a
candidate speaking. The length of a candidate sound bite, on a regular news story, ranged from a
low of one second to nearly five minutes long.5 The average length of a candidate sound bite
was 12 seconds.
4 Over the course the monitoring period, two stations aired special extended campaign programs during their highest-rated news programs. KATU in Portland, Oregon aired one such program, and WCMH in Columbus, Ohio aired two. Including these programs increases the length of an average candidate sound bite, since candidates were shown speaking for almost the entire length of a broadcast. We report averages both with and without these special programs. Also, we have omitted from the analyses the stories that were shown in Minnesota on the day of Senator Paul Wellstone’s death. The Minnesota newscasts were almost entirely made up of stories about the career and life of Senator Wellstone; they are clearly anomalies and are excluded from the analyses. 5 As noted above, the three extended campaign segments that aired in Portland and Columbus contained virtually non-stop sound bites. The stories contained 27, 25 and 11 minutes of sound bites. These are included in the overall calculations for sound bites, but to characterize one of them as the longest sound bite would be misleading, as these are not typical news stories.

1 0 Local TV Coverage of the 2002 General Election
Aggregate Amount of Coverage: September 18 – November 4, 2002 (Combined totals for top-rated early and late half-hours of news) Number of randomly selected stations 122
Dates of analysis September 18 through November 4
Total hours of news programming 5033
Total number of local news broadcasts 10,066
Total number of campaign stories 7,460
Percentage of broadcasts with at least one campaign story
44%
Average length of a campaign story 89 seconds
Average number of campaign stories per half-hour of news
0.74
Percentage of campaign stories with at least one candidate sound bite
28%
Average length of a candidate sound bite 12 seconds
Coverage during the course of the campaign
The amount of coverage over the course of the campaign varied significantly. The total number of stories
increased dramatically in the final weeks of the campaign. More stories aired in the final week of the campaign
than in the first four weeks of the study. The majority of stories aired in the last two weeks of the campaign, and
more than two-thirds (68 percent) of all stories aired in the last three weeks of the campaign.
Amount of Coverage During the Course of the Campaign
7% 9% 8% 8%
14%18%
36%
0%5%
10%15%20%25%30%35%40%45%50%
9/18 to9/23
9/24 to9/30
10/1to10/7
10/8 to10/14
10/15 to10/21
10/22 to10/28
10/29 to11/4
% of all campaign stories

1 1 Local TV Coverage of the 2002 General Election
What type of campaign coverage? The coders were asked to indicate which of the following was the primary focus of the story.
Strategy: The story focuses on the tactics of a candidate, party or interest group. A strategy story tells you more about the “game” or “style” of politics and elections and less about the substance or issues.
Horserace: The story is primarily concerned with which candidate is ahead or behind in a race. Poll results are usually a part of these stories.
Personal characteristics: The story focuses on aspects of a candidate such as his or her childhood, family history, past substance abuse, personality traits.
Issue-focused: The story concentrates on an issue such as terrorism, taxes or education, sometimes discussing candidates’ positions on issues.
Adwatch: The story analyzes a candidate or interest group ad for claims it makes or use of imagery. If a story is about the strategy behind a series of ads or how one candidate attacks his or her opponent with ads, but does not assess the claims made in the ads, it would not be considered an adwatch. It would most likely be coded as strategy.
Other: The story does not fit into one of the categories above. These stories often focus on the process of the election. For example, stories about where and how to register to vote were most likely counted as “other.”
Personal Character- istics
Story Focus, Sept. 18-Nov. 4, 2002
3%6%
9%
19%
24%
38%
0%
5%
10%
15%
20%
25%
30%
35%
40%
45%
50%
% of all campaign stories
Issues
The results show that almost half of the cover
the campaign and not on the substantive issue
study, 38 percent focused on campaign strate
horserace (i.e., who is winning and losing). In
and three percent were characterized as adwa
Horse-race
Ad- watch
age focused on the st
s of the campaign. O
gy, and nine percent
contrast, 24 percent
tch stories. Six perce
Strategy
Otherrategic or horserace aspects of
f the 7,460 stories in the
focused on the campaign
focused on campaign issues,
nt of stories focused on the

1 2 Local TV Coverage of the 2002 General Election
personal characteristics of the candidate. The remaining 19 percent of the stories focused on
other aspects of the campaign, such as stories about the voting or registration process.
Story focus during the course of the campaign The type of coverage also changed during the course of the campaign. In the final two weeks of
the campaign, the stories increasingly focused on the strategic aspects of the campaign. As noted
above, over the course of the entire monitoring period, 38 percent of the stories focused on
campaign strategy, and 24 percent focused on campaign issues, but in the final week of the
campaign, 46 percent of the stories focused on campaign strategy, and only 19 percent focused
on the issues of the campaign.
Story Focus During the Course of the Campaign (Percentage of total stories)
Week Strategy
Horserace Personal Characteristics
Issue Adwatch Other
Entire Time Period (9/18 to 11/4)
09/18-11/04 38% 9% 6% 24% 3% 19%
Week by Week Breakdown
09/18-09/23 37% 9% 4% 32% 1% 17%
09/24-09/30 31% 8% 7% 29% 4% 22%
10/01-10/07 33% 9% 5% 24% 2% 27%
10/08-10/14 33% 10% 4% 32% 4% 18%
10/15-10/21 30% 10% 7% 28% 4% 21%
10/22-10/28 37% 7% 9% 24% 3% 19%
10/29-11/04 46% 11% 5% 19% 2% 17%
All percentages are rounded. Note: The first post-primary week from 9/18 to 9/23 only contains six days; all other weeks contain seven days.
Issues mentioned during the 2002 campaign
The project tracked the number of times 58 different issues were mentioned in the campaign
news stories.6 A story was coded as mentioning these issues even if they were not discussed in
detail.7 These 58 issues were mentioned a total of 10,670 times.8
Education was the most frequently mentioned issue, appearing in a total of 1,156 stories. Taxes
followed and were raised in 962 stories. Local issues (729 stories), government ethics (668 stories)
and President Bush (610 stories) round out the top five most frequently mentioned issues.
6 “Issues mentioned” is not a subset of issue-focused stories. Rather, issues mentioned data were derived from all campaign news stories, regardless of story focus. For a complete list of the issues coded, see the project codebook at www.localnewsarchive.org. 7 For example, if the reporter said, “Candidate Smith spoke today on taxes and Iraq,” but did not go into any detail about what candidate Smith said on these issues, it was still counted as mentioning taxes and Iraq. 8 Multiple mentions of the same issue within a single story are only counted once. Therefore, for each individual issue category, the number of issue mentions equals the number of stories in which it was mentioned.

1 3 Local TV Coverage of the 2002 General Election
As the table below shows, the top ten issues mentioned were domestic issues. These top ten
issues accounted for 59 percent of all issue mentions. However, three foreign policy/national
security issues fell within the top twenty issues mentioned: Iraq (304), defense/military (252) and
terrorism (184). It is interesting to note that other aspects of the war on terrorism were raised
somewhat less frequently in campaign stories than might have been expected. For example, only
65 campaign stories mentioned the events of September 11, and only ten stories mentioned
Afghanistan.9 Other notable issue findings: the number of stories that mentioned business (333
stories) was far greater than the number of stories that mentioned labor unions (75 stories).
Prescription drugs appeared in 258 stories, the environment in 225 stories, civil rights/race
relations in 185 stories and Social Security in 168 stories. Campaign finance reform was only
mentioned in 80 stories, and 80 stories mentioned business scandals, such as Enron or
WorldCom.
Issues Mentioned in the 2002 Campaign (N=10,670 total issue mentions) Most Frequently Mentioned Least Frequently Mentioned
1) Education (1156) 1) Creationism (1)
2) Taxes (962) 2) China (2)
3) Local issues (729) 3) Assisted suicide (3)
4) Government ethics* (668) 4) Competence of George Bush (4)
5) George Bush (610) 5) Missile defense/Star Wars (9)
6) Employment/Jobs (514) 6) Afghanistan (10)
7) Deficit (474) 7) Affirmative Action (13)
8) Government spending (447) 8) Foreign aid (14)
9) Crime (373) 9) Sexual harassment (16); Karl Rove/Bush staff (16) (tie)
10) Health care (367)
10) Women’s health (19)
*This category includes stories about government officials involved in business scandals.
Type of Race
Nationwide, 38 percent of all campaign stories focused on a gubernatorial race. By contrast, 20
percent of the campaign stories focused on U.S. Senate races, and seven percent centered on
campaigns for the U.S. House of Representatives. Races for the state senate or assembly only
accounted for three percent of the stories, and potentially high profile statewide races, such as
secretary of state or attorney general, were the focus of just two percent of the stories. Four-
percent of all the stories focused on regional, county or city offices,10 and six percent were stories
about ballot initiatives or referenda. The remaining stories focused on voting issues (11 percent),
9 It is possible that stories about September 11 and Afghanistan appeared elsewhere in the news broadcasts. However, these issues appeared very infrequently within the campaign stories. 10 This category includes all educational and law enforcement offices.

1 4 Local TV Coverage of the 2002 General Election
such as voter registration and the location of polling places, multiple races (six percent),11 the
courts (one percent), and other aspects of the election process (one percent).
Type of Race (% of all stories)
3%6% 6% 7%
11%
20%
38%
0%
10%
20%
30%
40%
50%
Multiple RacesState Senate/ Assembly
Initiatives or Referenda
U.S. House Voting Issues U.S. Senate Governor
Story Tone
Story tone is an assessment of the narrative of a piece. A narrative that included both positive
and negative elements was coded as balanced. Stories that focused on the positive or negative
elements were coded accordingly. The results of this research suggest that by and large the
stations presented stories with a balanced or positive tone. Only 16 percent of the stories were
coded as having a negative tone. By contrast, 42 percent were coded as balanced, and 19
percent were coded as having a positive tone. The remaining 23 percent of the stories were
coded as having no clear tone.
Story Tone (% of all stories )
0%5%
10%15%20%25%30%35%40%45%50%
16%19%
23%
42%
Negative Tone No Clear Tone Positive Tone Balanced
Campaigning by National Political Figures
11 Multiple race stories featured several candidates appearing together at a single event, often to receive an endorsement from a national politician.

1 5 Local TV Coverage of the 2002 General Election
There has been much speculation about the impact of President Bush’s campaigning. The results show
that President Bush appeared campaigning in more than twice as many stories as did the second most
frequent campaigner, Bill Clinton. In fact, President Bush appeared campaigning in more stories than Bill
Clinton, Al Gore, Hillary Clinton, Joe Lieberman, Tom Daschle, Ted Kennedy, Richard Gephardt, Bill
Bradley and Jesse Jackson combined.
Campaigning by National Political Figures (# of appearances)
27 33 4777 90
160
351
0
50
100
150
200
250
300
350
400
Al Gore Hillary Clinton
John McCain
Dick Cheney
Rudy Giuliani
Bill Clinton George W. Bush
Note: Ten other national politicians appeared at least once, but not more than 25 times.
Campaign News Coverage vs. Campaign Advertising
Of the 10,066 broadcasts in the study, 44 percent contained at least one political story. Nineteen percent
contained at least two political stories, and seven percent contained three or more political stories. By
contrast, 82 percent of these same broadcasts contained at least one paid political advertisement. In fact,
66 percent of the broadcasts contained two or more political ads, and 49 percent contained three or more
political ads.
Campaign News Stories vs. Paid Campaign Ads (Based on 10,066 broadcasts) Campaign News Stories Paid Campaign Ads
Total number 7,460 26, 860
Percentage of broadcasts with at least one…
44% 82%
Percentage of broadcasts with at least two…
19% 66%
Percentage of broadcasts with three or more…
7% 49%
Ratio of campaign ads to campaign news stories (number)
3.6:1
Ratio of campaign ads to campaign news stories (time)
1.2:1

1 6 Local TV Coverage of the 2002 General Election
Campaign news stories vs. paid campaign ads by type of election
An interesting contrast appears between news stories and ads for major elections (governor, U.S.
Senate and U.S. House). When looking only at these races, the results show that news coverage
of gubernatorial races was the most prevalent (64 percent), followed by coverage of Senate races
(24 percent) and then the House (12 percent).12
The distribution of ads for major elections was quite different. Thirty-six percent of the major
election ads focused on House races, and 36 percent of the ads focused on gubernatorial races.
The percentages of campaign news stories and political ads were quite similar for Senate
candidates.
Type of Election: News vs. Ads
Type of election Campaign news (% of all stories) Paid political advertising (% of all ads aired during same broadcasts)
Governor 64% 36%
U.S. Senate 24% 28%
U.S. House of Representatives 12% 36%
Station Performance Ranges
The measures described below each capture a different component of campaign coverage quality.
We present station performance ranges on seven measures of quality: Total number of campaign
stories aired; percentage of captured broadcast time devoted to campaign coverage; percentage
of captured news broadcasts containing at least one campaign story; percentage of campaign
stories focusing on either issues or adwatch; average length of candidate sound bites; average
campaign story length; and percentage of campaign stories focused on local elections. For each
measure, we present the national average, the highest and lowest values and the threshold values
for the bottom ten percent and the top ten percent of stations in the sample. It is important to
note that the averages reported here are station averages, not nationwide averages. As a result,
there are some slight differences between the data reported below and the previously reported
data. For example, the average length of a story nationwide was 89 seconds, but when the
length of stories is aggregated to the station level the average station has an average story length
of 86 seconds. In general these differences are quite small.
There are 16 stations in the sample that did not have regularly scheduled early evening news
broadcasts each day; however, the exclusion of those stations would not significantly alter the
results presented below. The results excluding these 16 stations are presented in Appendix I.
12As noted above, the results for all election stories shows that news coverage of gubernatorial races was the most prevalent (38 percent of all stories), followed by coverage of Senate races (20 percent of all stories) and House races (7 percent of all stories). The remaining stories focused on other state or local races and ballot initiatives.

1 7 Local TV Coverage of the 2002 General Election
Total number of campaign stories aired
A simple aggregate measure of station quality is the total number of campaign stories aired
during the entire study. This measure penalizes stations that aired fewer news broadcasts. The
average station aired 61 stories over the 48-day period. The lowest number of stories aired on an
individual station was 12, and the highest was 158. The top ten percent of stations aired at least
107 stories. The bottom ten percent aired 27 or fewer stories.
Percentage of broadcast time devoted to campaign coverage
A second aggregate measure of station quality is the percentage of broadcast time devoted to
campaign coverage. This measure is based only on the news broadcasts captured according to
the sampling procedures and methodology described above. In order to calculate total time, we
multiplied the number of broadcasts per station by 30 minutes.13 We then calculated the
percentage of time spent on campaign coverage. The percentage of time a station dedicated to
campaign coverage ranged from one percent to nine percent. The average station dedicated 3.6
percent of captured broadcast time to campaign coverage. The top ten percent of stations
dedicated 6.9 percent or more of their captured broadcast time to campaign coverage. The
bottom ten percent of stations dedicated 1.5 percent or less of that time to campaign coverage.
Percentage of news broadcasts containing at least one campaign story
A third method of measuring station quality is the percentage of news broadcasts that contain at
least one campaign story. Unlike total number of stories aired, this measure does not penalize
stations with fewer news broadcasts. The station range was from a low of 13 percent of news
broadcasts with at least one campaign story, to a high of 79 percent of broadcasts with at least
one campaign story. The station average was 44 percent. The top ten percent of stations aired at
least one campaign story on 68 percent or more of their news broadcasts. The bottom ten
percent aired at least one campaign story on 23 percent or fewer of their news broadcasts.
Percentage of campaign stories focusing on either issues or adwatch
Many advocates for better campaign coverage argue that the type of story aired is more important
than the total number of stories. These advocates contend that campaign coverage should focus on
issues so that viewers will be more informed. They also contend that seriously critiquing paid
advertising helps viewers sort through claims and counterclaims made by politicians. Therefore, a
fourth measure of station quality is the percentage of stories about either issues or adwatches on each
station.
The percentage of campaign stories that focused on issues or adwatches on each station ranged from
zero percent of campaign stories to a high of 75 percent of campaign stories. The average station
focused 27 percent of their campaign stories on issues or adwatches. The top ten percent of stations
13 We did not exclude advertising time within a news broadcast since the amount of advertising time is a station decision.

1 8 Local TV Coverage of the 2002 General Election
focused at least 42 percent of their campaign stories on issues or adwatches. The bottom ten percent
of stations focused 13 percent or fewer of their campaign stores on issues or adwatches.
Average length of candidate sound bites
A fifth measure of station quality is the average length of a candidate sound bite. This measure
simply captures the average amount of time candidates are shown and heard speaking during
news stories. The substance of what candidates say is not a part of this measurement.
The average sound bite length on the average station was 12 seconds. The station range was
from four seconds to 96 seconds.14 The average sound bite length aired on the top ten percent
of stations was at least 19 seconds. The average sound bite length for the bottom ten percent of
stations was 7 seconds or shorter.
Average campaign story length
A sixth measure of quality campaign coverage is the average length of a campaign story. The
contention is that longer stories allow for more depth and provide viewers with more information.
The average station aired stories with an average length of 86 seconds. The station range was
from 38 seconds to 162 seconds. The top ten percent of stations had an average story length of
at least 119 seconds. The bottom ten percent of stations had an average story length of 61
seconds or shorter.
Percentage of campaign stories focusing on local elections
A seventh and final measure of quality campaign coverage is the percentage of stories that
focused on a local election. One of the traditional roles of local television stations is to provide
truly local coverage of news and events. It is highly unlikely that national news broadcasts will
cover a local House or city council election. Local stations are in many ways the only venue for
television coverage of these “down ticket” elections. In local elections, we include races for the
U.S. House of Representatives and all non-statewide elections. The average station devoted 15
percent of its coverage to local elections. On individual stations, the percentage of stories focused
on local elections ranged from zero percent to 64 percent. The top ten percent of the stations
focused at least 31 percent of their stories on local elections. The bottom ten percent devoted
two percent or fewer of their stories to local elections.
14 These figures are calculated including two stations that aired three town hall meetings during their most popular time slots. Since these programs were essentially back-to-back candidate sound bites for at least ten minutes, their inclusion increases the stations’ average sound bite length and significantly extends the station range for average sound bite length. Excluding the stations that aired town hall meetings, the average sound bite length is 11 seconds, and the station range for average sound bite length is between four and 36 seconds.

1 9 Local TV Coverage of the 2002 General Election
Station Performance Ranges (Entire Sample) Measure Low
Station Station Bottom 10%
Station Average
Station Top 10%
High Station
# of Campaign Stories 12 ≤ 27 61 ≥ 107 158
% of Time Devoted to Campaign Coverage
1% ≤ 1.5% 3.6% ≥ 6.9% 9%
% of News Broadcasts with ≥ 1 Campaign Story
13% ≤ 23% 44% ≥ 68% 79%
% Issue/Adwatch Stories 0% ≤ 13% 27% ≥ 42% 75%
Average Sound Bite Length* 4 sec ≤ 7 sec 12 sec ≥ 19 sec 96 sec
Average Campaign Story Length 38 sec ≤ 61 sec 86 sec ≥ 119 sec 162 sec
% of stories focused on local elections
0% < 2% 15% > 31% 64%
* These figures are calculated including two stations that aired three town hall meeting programs during their most popular news programs. Excluding these two stations lowers the average station sound bite length to 11 seconds, reduces the average for the top ten percent of stations to 16 seconds or greater and decreases the high station average to 36 seconds.
Individual Station Performance
The chart contained in Appendix II provides information on individual station performance. We
ranked the stations (one, two or three) on each of the seven performance criteria described
above. A score of one indicates that the station is in the top third of all stations in the country on
the particular performance criteria. A score of two indicates that the station falls in the middle
third, and a score of three indicates that the station is in the bottom third of all stations. Each
station in our sample is listed alphabetically by media market.
Future Research
The electromagnetic spectrum belongs to the American people, and it is licensed to television
stations for free; in return, those broadcasters pledge to fulfill a public interest obligation to their
audience.
What kind of job are they doing? Evaluating the news coverage of political campaigns that local
stations provide is a reasonable approach to answering that question. The answer that this study
offers is grim. While there are some encouraging exceptions, most local television stations
ignored the 2002 campaign on most of their top-rated broadcasts. At the same time, those
stations took in record-breaking amounts of political advertising revenue.
Current controversies about FCC regulations suggest an important avenue for future research:
What is the relationship between station ownership and campaign coverage?
Our study did not set out to examine the relationship between station ownership and station
performance. Even so, our 122-station sample contains 45 stations owned by large owners (with

2 0 Local TV Coverage of the 2002 General Election
nationwide audience reach of more than 20 percent), 50 by mid-sized owners, and 23 by small
owners, so we can use our findings to speculate about what a future ownership study might
show.
For example, how much coverage was given to local races by local news? The stations in our
sample with small- and mid-sized owners offered more coverage than the national average, while
stations with large owners provided less. The same pattern appears in individual media markets:
in 16 of the 22 markets in our sample where we can make the comparison, stations owned by
small- or mid-sized owners aired more local campaign coverage. If a full-scale national study
designed to correlate ownership with localism and diversity came up with similar numbers, it
would have inescapable implications for the regulations now in play.
Another study could investigate what factors led individual stations to excel. Some stations, even
in the absence of contested political races, nevertheless did a top-tier job of offering campaign
coverage to their viewers. One can speculate about some of the reasons: ownership-group
leadership; committed news directors; the ability to commit particular producers or reporters to
political coverage; partnerships with other stations, including public television; associations with
non-profit groups advocating best practices. Testing hypotheses like these would provide valuable
insight for those attempting to improve American journalism.
Even without additional data, the campaign stories collected in this archive can be analyzed in
numerous additional ways. “Issue mention” can be analyzed to determine which stories provided
in-depth coverage of a particular issue. The somewhat broad headings of “strategy” and “issue”
can be broken into subcategories. Stories labeled “other” can be further subdivided and
measured. Regional differences can be investigated, as well as possible differences in the political
culture of different cities. Sophisticated studies can be done of the impact of the number and
kind of competitive races in a market on coverage. Analysis of the 20 non-sample stations can be
used to supplement the data from the representative national sample.
Finally, it should be noted that the digital assets collected by this project include not only
campaign stories. More than 10,000 complete half-hours of television news have been assembled
and stored. The possibilities for analyzing stories about the environment, health, crime, foreign
policy, etc.; for comparing hard news to soft news and the “entertainmentization” of journalism;
for studying duopolies, cross-ownership with newspapers and editorial independence: the
research opportunities are limitless. The investigators on this project are eager to hear from
scholars and other interested parties about potential efforts to take advantage of them.

2 1 Local TV Coverage of the 2002 General Election
Appendix I
Page 19 of this report presented station performance ranges for our entire sample of stations.
However, there are 16 stations in the sample that did not have regularly scheduled early evening
news broadcasts each day. As the chart below shows, excluding these 16 stations does not have
a dramatic effect on the overall findings, with the possible and logical exception of the number of
campaign stories aired.
Station Performance Ranges (Excluding 16 stations without a regularly scheduled early evening news broadcast each day)
Measure Low Station
Station Bottom 10%
Station Average
Station Top 10%
High Station
# of Campaign Stories 15 ≤ 35 66 ≥ 111 158
% of Time Devoted to Campaign Coverage
1% ≤ 1.5% 3.8% ≥ 7.0% 9%
% of Broadcasts with ≥ 1 Campaign Story
13% ≤ 25% 45% ≥ 69% 79%
% Issue/Adwatch Stories 5% ≤ 14% 27% ≥ 43% 75%
Average Sound Bite Length* 5 sec ≤ 8 sec 13 sec ≥ 20 sec 96 sec
Average Campaign Story Length 51 sec ≤ 61 sec 87 sec ≥ 118 sec 162 sec
% of stories focused on local elections
0% < 2% 14% > 29% 64%
* These calculations include the two stations that aired special programs as described above.

2 2 Local TV Coverage of the 2002 General Election
Key to Appendix II (Individual Station Rankings)
We ranked the stations 1, 2 or 3 on each of the seven performance criteria described above. A score of 1 indicates that the station is in the top third of all stations in the country on the particular performance criterion. A score of 2 indicates that the station falls in the middle third and a score of 3 indicates that the station is in the bottom third of all stations. Each station in our sample is listed alphabetically by media market. The following explains the various notations contained in Appendix II.
(a) Two stations in our sample, KATU in Portland, Oregon and WCMH in Columbus, Ohio, aired special campaign programming during their highest-rated broadcast. The data and rankings for these two stations include this special programming.
(b) A total of 16 stations in our sample did not always air an early news program. Fourteen
stations in the sample never aired an early news program. One station only aired an early news program on Sundays, and another aired an early evening news program during the week, but did not air an early evening news program on weekends.
(c) We had an overall video capture rate of 88 percent of the broadcasts and a capture rate
of 96 percent when we include broadcast summaries. The rankings in this table are based on the video capture rate for each station. The list below reports the capture rates including broadcast summaries for those stations with a video capture rate below 80 percent.
Milwaukee, Fox, WITI: According to the broadcast summaries, 42 of the 53 broadcasts missed contained no election stories. Including broadcast summaries raises the capture rate to 87 percent. San Antonio, CBS, KENS: According to the broadcast summaries, 46 of the 60 broadcasts missed contained no election stories. Including broadcast summaries raises the capture rate to 89 percent. New York, CBS, WCBS: According to the broadcast summaries, 18 of the 39 broadcasts missed contained no election stories. Including broadcast summaries raises the capture rate to 79 percent. Louisville, NBC, WAVE: According to the broadcast summaries, 34 of the 41 broadcasts missed contained no election stories. Including broadcast summaries raises the capture rate to 94 percent. Milwaukee, ABC, WISN: According to the broadcast summaries, 25 of the 33 broadcasts missed contained no election stories. Including broadcast summaries raises the capture rate to 92 percent.
Columbus, NBC, WCMH: According to the broadcast summaries, 30 of the 32 broadcasts missed contained no election stories. Including broadcast summaries raises the capture rate to 98 percent.
New Orleans, NBC, WDSU: According to the broadcast summaries, 27 of the 33 broadcasts missed contained no election stories. Including broadcast summaries raises the capture rate to 94 percent. Washington, DC, ABC, WJLA: According to the broadcast summaries, 28 of the 36 broadcasts missed contained no election stories. Including broadcast summaries raises the capture rate to 94 percent. Buffalo, ABC, WKBW: According to the broadcast summaries, 27 of 27 the broadcasts missed contained no election stories. Including broadcast summaries raises the capture rate to 100 percent.

2 3 Local TV Coverage of the 2002 General Election
Los Angeles, CBS, KCBS: According to the broadcast summaries, 22 of the 24 broadcasts missed contained no election stories. Including broadcast summaries raises the capture rate to 98 percent. Denver, Fox, KDVR: According to the broadcast summaries, five of the 15 broadcasts missed contained no election stories according to the broadcast summaries. No broadcast summaries were available for the remaining ten missing broadcasts. This indicates a capture rate of 83 percent. Milwaukee, CBS, WDJT: According to the broadcast summaries, 27 of the 27 broadcasts missed contained no election stories. Including broadcast summaries raises the capture rate to 100 percent. New York, Fox, WNYW: According to the broadcast summaries, 33 of the 34 broadcasts missed contained no election stories. A broadcast summary was not available for the one missing broadcast. This indicates a capture rate of 99 percent. New Orleans, CBS, WWL: According to the broadcast summaries, 20 of the 26 broadcasts missed contained no election stories. Including broadcast summaries raises the capture rate to 94 percent. Greensboro, CBS, WFMY: Broadcast summaries were not available for the 22 broadcasts missed; therefore, the capture rate remains at 76 percent. Sacramento, ABC, KXTV: According to the broadcast summaries, 19 or the 22 broadcasts missed contained no election stories. Including broadcast summaries raises the capture rate to 97 percent.
Philadelphia, CBS, KYW: According to the broadcast summaries, 21 of the 25 broadcasts missed contained no election stories. Including broadcast summaries raises the capture rate to 96 percent. Washington, DC, NBC, WRC: According to the broadcast summaries, 12 of the 24 broadcasts missed contained no election stories. Including broadcast summaries raises the capture rate to 88 percent. Salt Lake City, CBS, KUTV: Broadcast summaries were not available for the 21 broadcasts missed; therefore, the capture rate remains at 78 percent.
New York, ABC, WABC: According to the broadcast summaries, eight of the 20 broadcasts missed contained no election stories. Including broadcast summaries raises the capture rate to 88 percent.
Memphis, CBS, WREG: According to the broadcast summaries, 15 of the 22 broadcasts missed contained no election stories. No broadcast summaries were available for two of the remaining seven broadcasts. This indicates a capture rate of 93 percent. Greensboro, NBC, WXII: Broadcast summaries were not available for the 20 broadcasts missed; therefore the capture rate remains at 79 percent.

2 4 Local TV Coverage of the 2002 General Election
Appendix II: Station Rankings
Market (DMA)
Station
Owner
Network
Video Capture
Rate R A
N K I N G
Total # of Campaign Stories
% of News Time Devoted to Campaign Coverage
% of News Broadcasts with a Campaign Story
% of Campaign Stories about Issues or Adwatch
Average Length of Sound Bite
Average Campaign Story Length
% Locally Focused Campaign Stories
Albuquerque (48) KOAT Hearst-Argyle ABC 81% 1 1 1 1 1 2 1
Albuquerque (48) KRQE Emmis CBS 84% 2 3 2 3 2 3 1
Atlanta (9) WGCL Meredith CBS 88% 2 3 3 3 1 3 2
Atlanta (9) WSB Cox ABC 88% 2 3 3 2 3 3 2
Baltimore (24) WMAR Scripps ABC 85% 1 1 1 1 1 1 1
Baltimore (24) WJZ Viacom CBS 92% 1 1 1 2 2 1 2
Birmingham (39) WVTM NBC NBC 82% 1 2 1 2 1 2 1
Birmingham (39) WCFT/WBMA Albittron ABC 84% 2 3 2 2 3 3 1
Birmingham (39) WBRC Fox Fox 91% 2 3 2 3 1 3 1
Birmingham (39) WIAT (b) Media General CBS 92% 2 3 2 2 3 3 1
Boston (6) WHDH Sunbeam NBC 92% 2 1 1 2 3 1 3
Boston (6) WCVB Hearst-Argyle ABC 95% 1 1 1 1 1 1 3
Boston (6) WBZ Viacom CBS 97% 1 1 1 1 3 1 3
Buffalo (47) WKBW (c) Granite ABC 73% 3 3 3 2 1 2 2
Buffalo (47) WIVB LIN TV CBS 84% 3 3 3 2 1 3 2
Buffalo (47) WGRZ Gannett NBC 90% 3 3 3 1 2 3 2
Charlotte (27) WBTV Jefferson-Pilot CBS 87% 2 2 2 1 1 2 2
Chicago (3) WBBM Viacom CBS 91% 1 1 1 3 3 1 2
Chicago (3) WMAQ NBC NBC 94% 1 1 1 2 1 2 2
Chicago (3) WLS ABC ABC 95% 1 1 1 2 2 1 2
Chicago (3) WFLD (b) Fox Fox 96% 3 1 2 2 1 1 2
Cincinnati (32) WLWT Hearst-Argyle NBC 85% 2 2 2 1 1 1 1
Cincinnati (32) WCPO Scripps ABC 94% 3 2 3 1 1 1 1
Cleveland (17) WKYC Gannett NBC 95% 3 3 3 1 3 3 2
Cleveland (17) WJW Fox Fox 96% 3 3 3 1 2 2 2
Cleveland (17) WOIO Raycom CBS 98% 3 3 3 1 2 3 2
Cleveland (17) WEWS Scripps ABC 99% 3 3 3 1 3 2 1
Columbus (34) WCMH (a), (c) NBC NBC 68% 2 1 1 1 1 2 2
Columbus (34) WSYX Sinclair ABC 100% 2 3 3 1 1 3 2
Dallas (7) KDFW Fox Fox 91% 1 2 2 3 2 2 3
Dallas (7) KXAS NBC NBC 100% 1 1 1 3 3 2 3
Denver (18) KDVR (b), (c) Fox Fox 74% 3 2 2 3 2 3 2
Denver (18) KMGH McGraw-Hill ABC 88% 2 2 2 2 3 3 1
Denver (18) KCNC Viacom CBS 94% 1 1 1 1 1 2 1
Detroit (10) WJBK Fox Fox 81% 3 3 3 1 2 2 3
Detroit (10) WDIV Post-Newsweek NBC 88% 2 3 2 2 2 3 3
Grand Rapids (38) WWMT Freedom CBS 97% 2 2 2 1 3 1 2
Grand Rapids (38) WXMI (b) Tribune Fox 98% 3 3 3 1 1 3 3
Greensboro (44) WFMY (c) Gannett CBS 76% 2 2 2 1 1 2 2

2 5 Local TV Coverage of the 2002 General Election
Market (DMA) Station Owner Network Video Capture
Rate
R A N K I N G
Total # of Campaign Stories
% of News Time Devoted to Campaign Coverage
% of News Broadcasts with a Campaign Story
% of Campaign Stories about Issues or Adwatch
Average Length of Sound Bite
Average Campaign Story Length
% Locally Focused Campaign Stories
Greensboro (44) WXII (c) Hearst-Argyle NBC 79% 1 1 1 1 1 1 1
Greensboro (44) WGHP Fox Fox 92% 3 3 3 2 2 2 2
Greenville (36) WLOS Sinclair ABC 89% 3 3 3 3 3 3 1
Greenville (36) WSPA Media General CBS 94% 1 1 1 1 1 3 2
Harrisburg (46) WPMT (b) Tribune Fox 92% 3 3 3 3 3 2 1
Harrisburg (46) WHTM Albrittron ABC 98% 3 3 3 3 3 2 1
Hartford (28) WTNH LIN TV ABC 82% 2 2 2 2 2 2 1
Houston (11) KPRC Post-Newsweek NBC 98% 1 2 1 3 3 2 2
Houston (11) KTRK ABC ABC 99% 1 2 2 2 2 2 2
Houston (11) KRIV (b) Fox Fox 100% 3 2 3 3 3 2 3
Indianapolis (25) WTHR Dispatch NBC 87% 1 2 2 3 1 3 1
Indianapolis (25) WXIN (b) Tribune Fox 88% 3 2 3 2 3 3 1
Indianapolis (25) WISH LIN TV CBS 88% 2 2 2 1 2 2 1
Kansas City (31) WDAF Fox Fox 88% 2 3 3 1 3 3 1
Los Angeles (2) KCBS (c) Viacom CBS 74% 2 2 2 2 3 1 2
Los Angeles (2) KABC ABC ABC 92% 3 3 3 3 2 2 3
Los Angeles (2) KTTV (b) Fox Fox 98% 3 2 2 2 3 2 3
Louisville (50) WAVE (c) Liberty NBC 66% 2 2 2 3 1 2 1
Memphis (41) WREG (c) NY Times CBS 79% 1 1 1 2 2 1 3
Memphis (41) WMC Raycom NBC 81% 2 2 2 2 3 2 3
Miami (15) WTVJ NBC NBC 93% 1 1 1 2 3 1 3
Miami (15) WPLG Post-Newsweek ABC 94% 1 1 1 2 1 1 3
Miami (15) WSVN Sunbeam Fox 99% 2 2 2 3 1 1 3
Milwaukee (33) WITI (c) Fox Fox 43% 3 1 2 3 2 2 3
Milwaukee (33) WISN (c) Hearst-Argyle ABC 67% 1 1 1 1 1 1 2
Milwaukee (33) WDJT (c) Weigel CBS 74% 2 2 2 3 1 1 2
Minneapolis (13) KARE Gannett NBC 87% 1 1 1 2 2 1 3
Minneapolis (13) WCCO Viacom CBS 96% 1 1 1 1 2 1 3
Nashville (30) WSMV Meredith NBC 85% 1 1 1 3 2 3 3
Nashville (30) WTVF Landmark CBS 90% 1 1 1 3 2 2 2
Nashville (30) WZTV (b) Sinclair Fox 94% 2 1 2 1 2 2 3
Nashville (30) WKRN Young ABC 94% 2 3 2 1 2 3 3
New Orleans (43) WDSU (c) Hearst-Argyle NBC 68% 1 1 1 1 1 1 1
New Orleans (43) WWL (c) Belo CBS 75% 3 2 3 3 1 1 3
New York (1) WCBS (c) Viacom CBS 61% 1 1 1 2 3 2 3
New York (1) WNYW (c) Fox Fox 74% 3 3 3 3 3 3 3
New York (1) WABC (c) ABC ABC 79% 2 1 1 3 3 1 3
New York (1) WNBC NBC NBC 84% 1 1 1 3 2 1 3
Norfolk (42) WAVY LIN TV NBC 90% 3 3 3 1 3 3 3
Norfolk (42) WTKR NY Times CBS 90% 3 3 3 1 1 3 3
Oklahoma City (45) KFOR NY Times NBC 92% 2 3 2 2 1 3 2
Oklahoma City (45) KOCO Hearst-Argyle ABC 92% 2 2 2 1 1 2 1
Oklahoma City (45) KWTV Griffin TV CBS 92% 2 2 3 1 2 2 1
Oklahoma City (45) KOKH (b) Sinclair Fox 98% 3 2 3 3 3 2 1
Orlando (20) WOFL (b) Fox Fox 87% 3 2 3 2 3 2 3
Orlando (20) WESH Hearst-Argyle NBC 91% 1 1 1 2 3 1 1

2 6 Local TV Coverage of the 2002 General Election
Market (DMA) Station Owner Network Video Capture
Rate
R A N K I N G
Total # of Campaign
Stories
% of News Time
Devoted to Campaign Coverage
% of News Broadcasts
with a Campaign
Story
% of Campaign
Stories about Issues or Adwatch
Average Sound Bite
Length
Average Campaign
Story Length
% Locally focused
Campaign Stories
Philadelphia (4) KYW (c) Viacom CBS 77% 2 1 2 3 2 1 1
Phoenix (16) KNXV Scripps ABC 91% 2 2 2 2 1 1 2
Pittsburgh (21) WPXI Cox NBC 89% 3 3 3 3 2 3 3
Pittsburgh (21) WTAE Hearst-Argyle ABC 96% 2 2 1 1 1 1 2
Portland, OR (23) KATU (a) Fisher ABC 82% 2 2 2 2 1 1 2
Portland, OR (23) KGW Belo NBC 87% 1 2 1 2 2 3 3
Portland, OR (23) KOIN Emmis CBS 92% 2 2 3 1 3 2 3
Providence (49) WNAC (b) LIN TV Fox 88% 3 2 3 2 3 3 1
Providence (49) WJAR NBC NBC 99% 1 1 1 1 1 3 1 Raleigh-Durham (29) WTVD ABC ABC 97% 2 2 2 3 2 2 2 Raleigh-Durham (29) WRAZ (b) Capitol Fox 100% 3 3 3 3 3 3 1
Sacramento (19) KXTV (c) Gannett ABC 77% 1 1 1 2 3 2 2
Sacramento (19) KOVR Sinclair CBS 93% 2 3 2 2 2 3 2
Salt Lake City (35) KUTV (c) Viacom CBS 78% 3 3 3 2 2 3 1
Salt Lake City (35) KSTU (b) Fox Fox 86% 3 3 3 1 1 1 1
Salt Lake City (35) KSL Bonneville NBC 100% 2 3 3 2 2 3 1
San Antonio (37) KENS (c) Belo CBS 53% 3 2 2 3 3 1 3
San Antonio (37) KMOL (c) Clear Channel NBC 77% 2 3 2 3 3 3 3
San Diego (26) KFMB Midwest CBS 81% 3 3 3 3 2 3 3
San Diego (26) KNSD NBC NBC 89% 2 3 2 3 3 3 2
San Diego (26) KGTV McGraw-Hill ABC 92% 2 2 3 3 3 2 2
San Francisco (5) KGO ABC ABC 87% 3 2 2 2 2 1 2
San Francisco (5) KTVU Cox Fox 90% 2 1 2 2 2 1 2
San Francisco (5) KPIX Viacom CBS 92% 1 2 1 3 3 2 3
Seattle (12) KCPQ (b) Tribune Fox 84% 3 2 2 3 3 3 2
Seattle (12) KING Belo NBC 86% 3 3 3 2 2 3 1
St. Louis (22) KMOV Belo CBS 92% 2 3 3 3 3 2 3
Tampa (14) WTSP Gannett CBS 96% 1 1 1 3 3 1 3
Tampa (14) WFLA Media General NBC 97% 1 1 1 2 1 1 3
Tampa (14) WFTS Scripps ABC 97% 1 1 1 2 1 1 2
Tampa (14) WTVT Fox Fox 98% 1 1 2 2 1 2 3
Washington, DC (8) WJLA (c) Albrittron ABC 72% 3 3 3 2 2 3 1
Washington, DC (8) WRC (c) NBC NBC 77% 2 2 2 1 2 2 1
Washington, DC (8) WTTG (b) Fox Fox 88% 3 3 3 1 1 1 1 West Palm Beach (40) WPBF Hearst-Argyle ABC 86% 1 1 1 1 2 1 1 West Palm Beach (40) WPEC Freedom CBS 87% 1 2 1 1 2 3 1 West Palm Beach (40) WPTV Scripps NBC 87% 1 1 1 3 2 1 2