Embed Size (px)
DESCRIPTION
Local Public Health in Action: The physical, economic and health benefits of polices and planning. American Public Health Association Annual meeting San Francisco 2012. Support for Local Environmental Health: Increasing physical activity options in San Antonio. - PowerPoint PPT Presentation
Citation preview
Local Public Health in Action: The physical, economic and health
benefits of polices and planning
American Public Health Association Annual meeting
San Francisco 2012 1
Support for Local Environmental Health: Increasing physical
activity options in San Antonio
MARY THOMAS M.B.& B.S., M.P.H.Communities Putting Prevention to Work
San Antonio Metropolitan Health DistrictSan Antonio Texas 2

Presenter Disclosures
The following personal financial relationships with commercial interests relevant to this presentation existed during the past 12 months:
Mary Thomas
“No relationships to disclose”
4
VISION
Increase active living options in San Antonio by supporting
local built environment to reduce obesity
5
• Describe the changes in built environment to increase physical activity options at parks, libraries, and public housing
• Discuss increasing active transportation through installation of bike kiosks
• Describe the benefits of the Complete Streets Policy
LEARNING OBJECTIVES
6
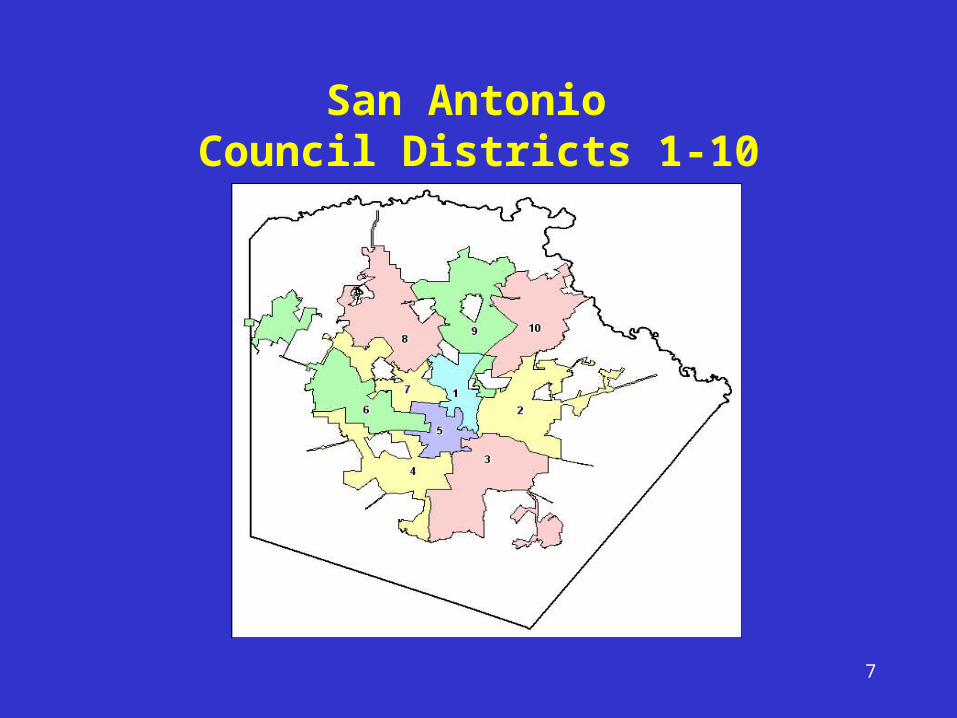
San Antonio Council Districts 1-10
7
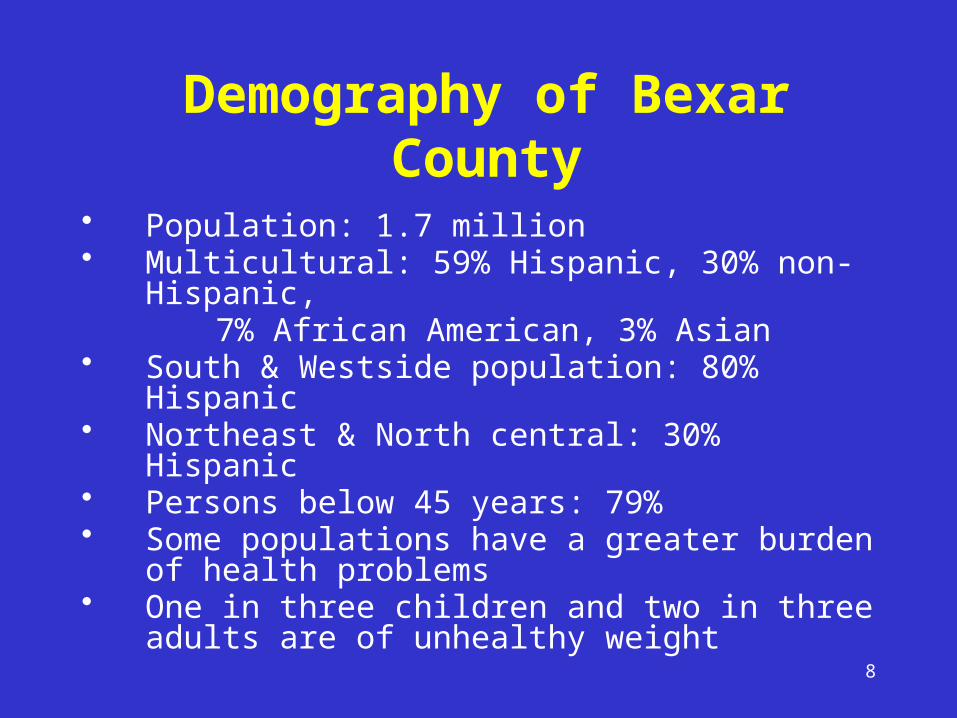
Demography of Bexar County• Population: 1.7 million• Multicultural: 59% Hispanic, 30% non-Hispanic, 7% African American, 3% Asian• South & Westside population: 80% Hispanic • Northeast & North central: 30% Hispanic • Persons below 45 years: 79%• Some populations have a greater burden of health
problems• One in three children and two in three adults are of
unhealthy weight
8
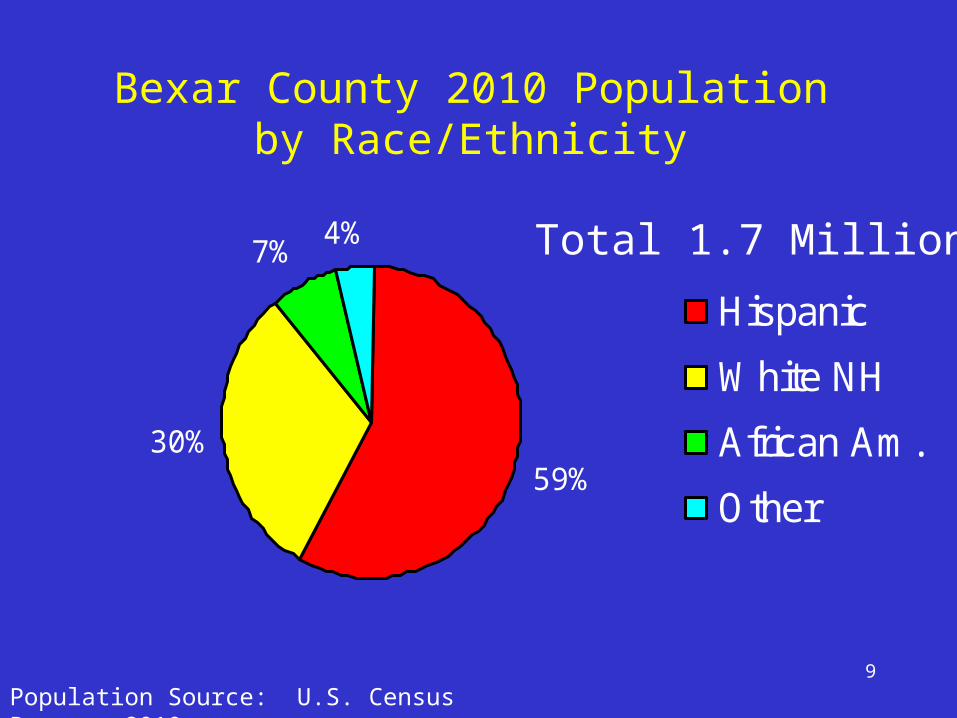
Bexar County 2010 Populationby Race/Ethnicity
Population Source: U.S. Census Bureau, 2010
59%30%
7% 4%
Hispanic
White NH
African Am.
Other
Total 1.7 Million
9
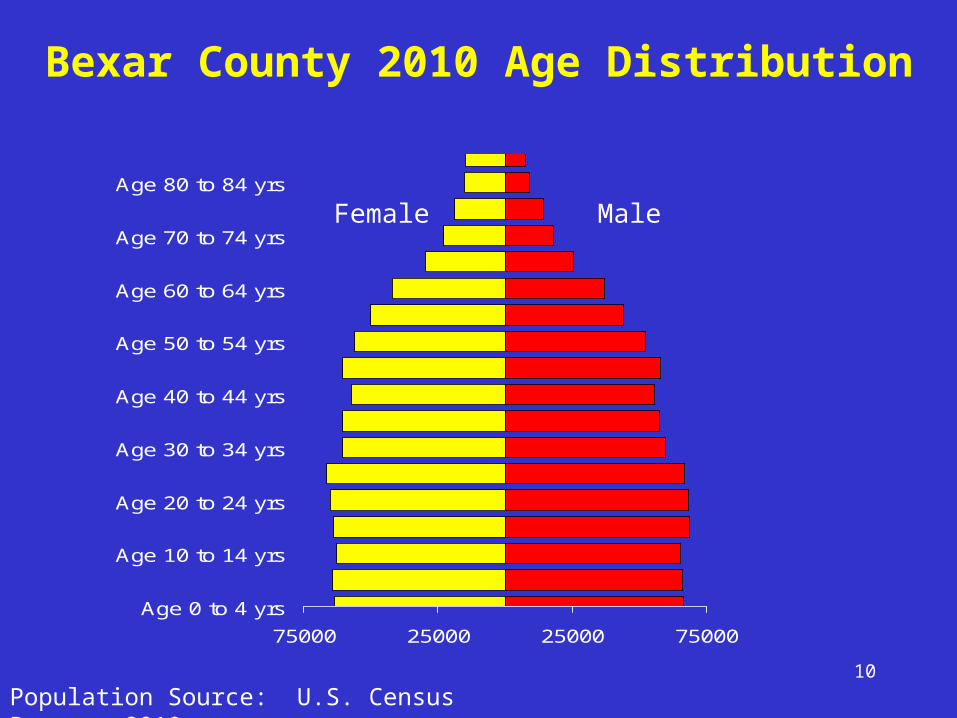
75000 25000 25000 75000Age 0 to 4 yrs
Age 10 to 14 yrs
Age 20 to 24 yrs
Age 30 to 34 yrs
Age 40 to 44 yrs
Age 50 to 54 yrs
Age 60 to 64 yrs
Age 70 to 74 yrs
Age 80 to 84 yrs
Bexar County 2010 Age Distribution
Population Source: U.S. Census Bureau, 2010
MaleFemale
10
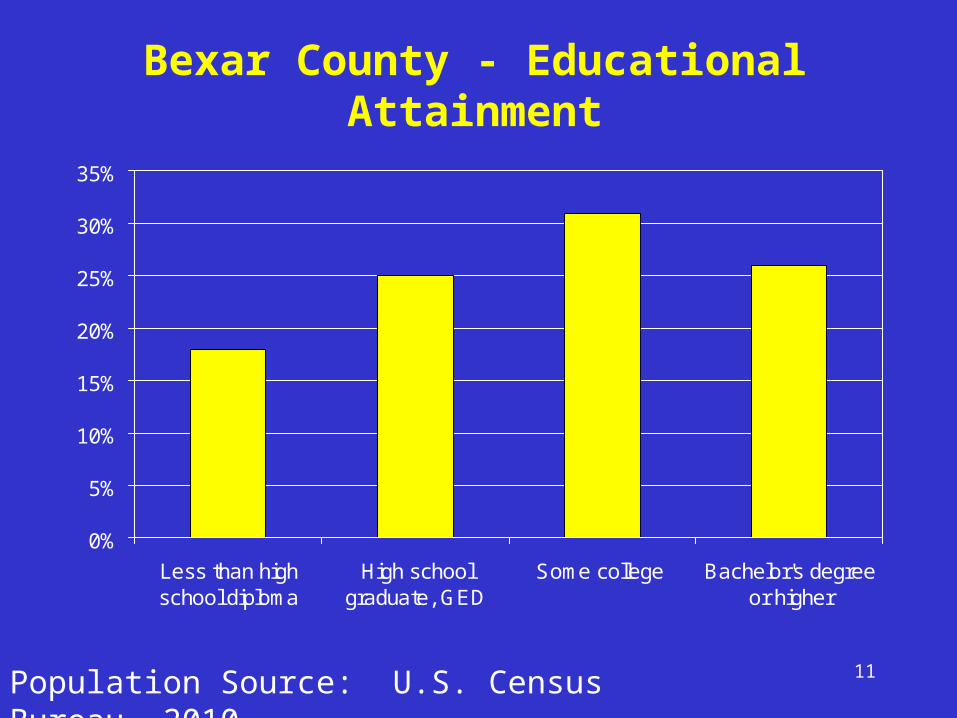
Bexar County - Educational Attainment
0%
5%
10%
15%
20%
25%
30%
35%
Less than highschool diploma
High schoolgraduate, GED
Some college Bachelor's degreeor higher
Population Source: U.S. Census Bureau, 2010 11
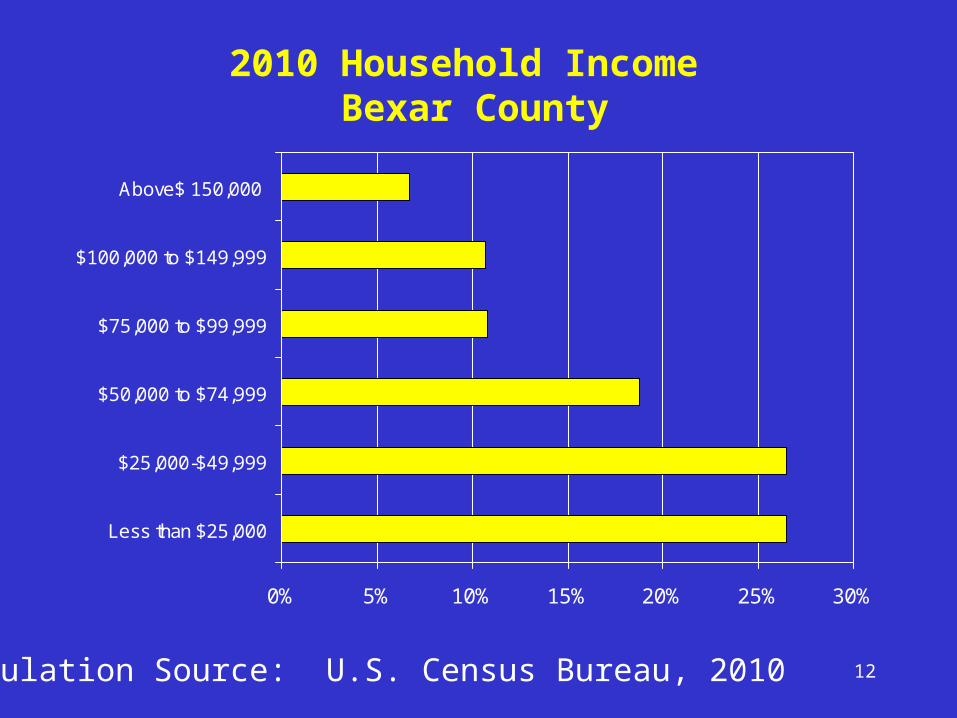
2010 Household Income Bexar County
0% 5% 10% 15% 20% 25% 30%
Less than $25,000
$25,000-$49,999
$50,000 to $74,999
$75,000 to $99,999
$100,000 to $149,999
Above$ 150,000
Population Source: U.S. Census Bureau, 2010 12
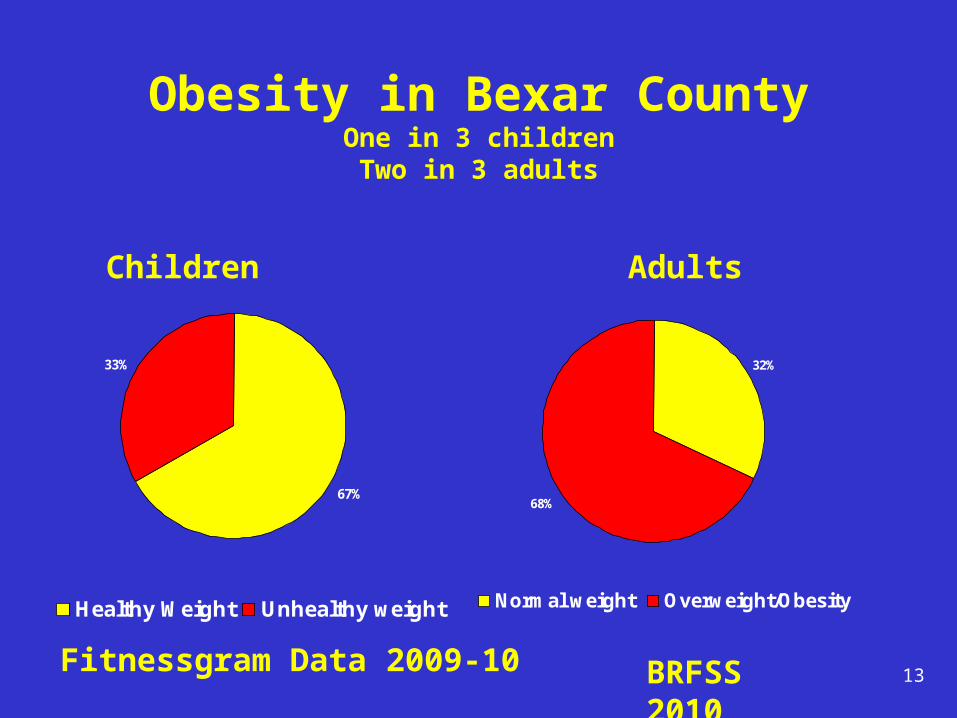
Obesity in Bexar CountyOne in 3 childrenTwo in 3 adults
67%
33%
Healthy Weight Unhealthy weight
Children
32%
68%
Normal weight Overweight/Obesity
Adults
Fitnessgram Data 2009-10 BRFSS 2010 13
Built Environmental Changes
• Safe roads, improved sidewalks & intersections by Public Works
• Walking trails, fitness stations at San Antonio Housing Authority locations
• Walking trails & fitness stations at libraries• Fitness stations in parks• Bike kiosks in downtown San Antonio
14
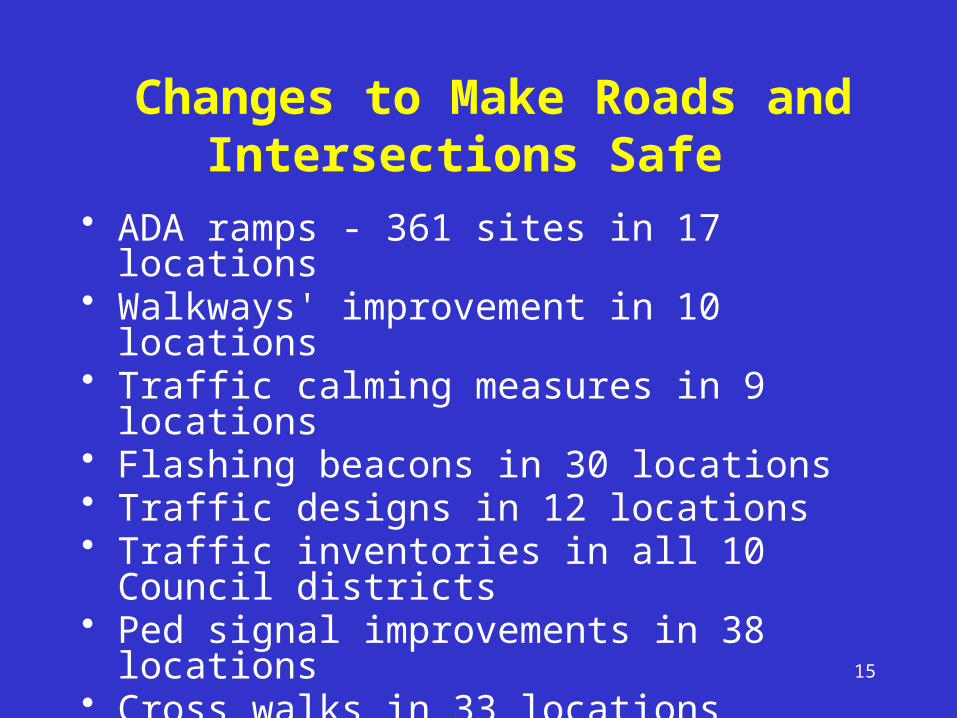
Changes to Make Roads and Intersections Safe
• ADA ramps - 361 sites in 17 locations• Walkways' improvement in 10 locations• Traffic calming measures in 9 locations• Flashing beacons in 30 locations• Traffic designs in 12 locations• Traffic inventories in all 10 Council districts• Ped signal improvements in 38 locations• Cross walks in 33 locations• Dynamic signs in 8 locations
15
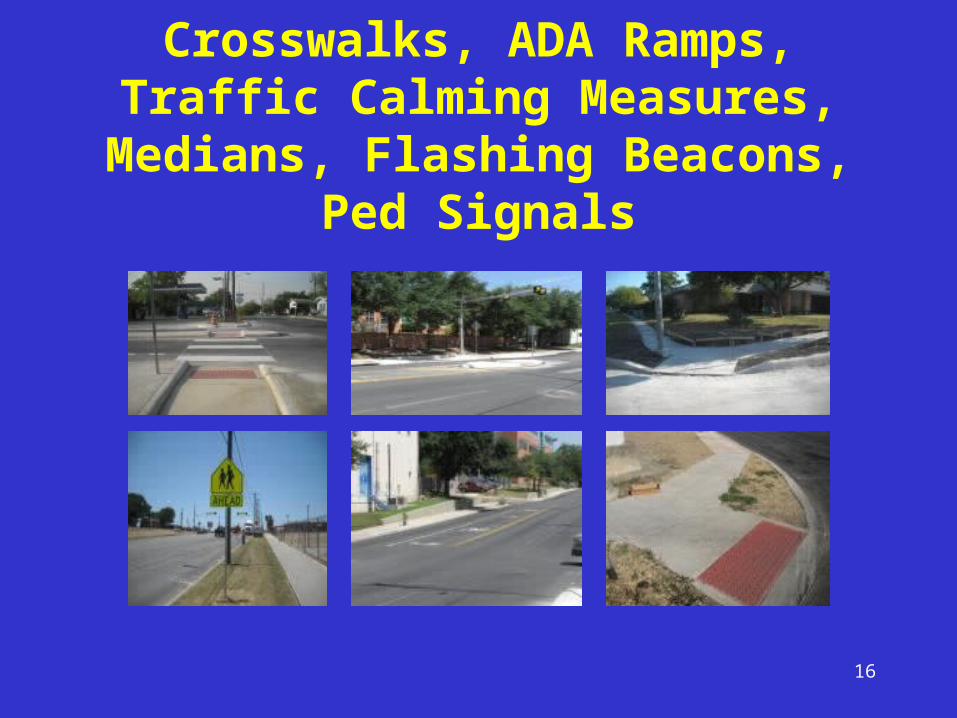
Crosswalks, ADA Ramps, Traffic Calming Measures, Medians,
Flashing Beacons, Ped Signals
16
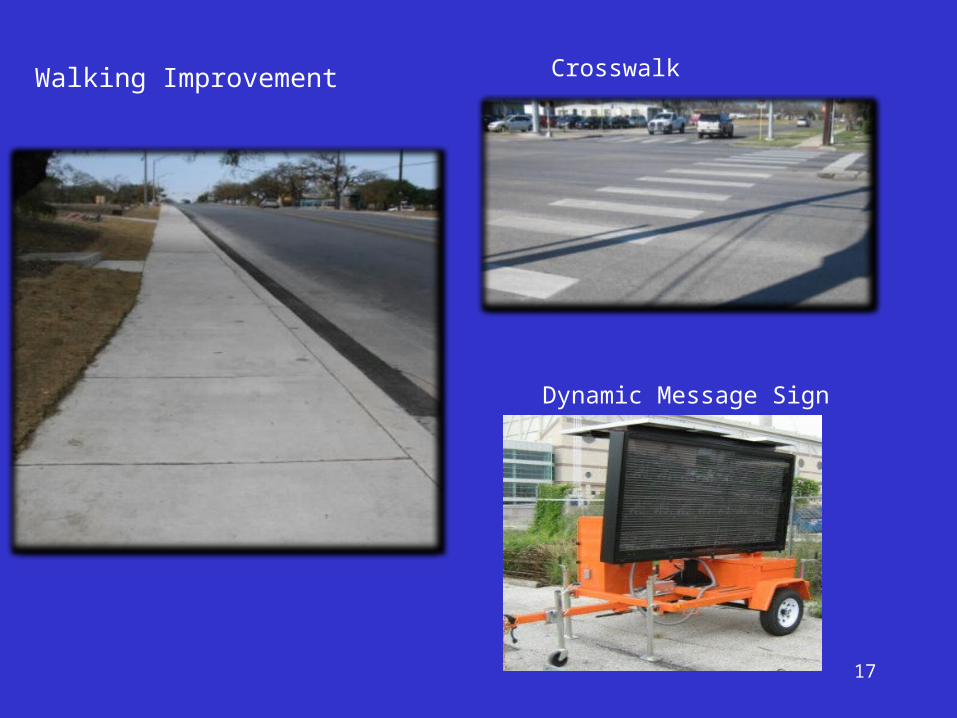
Walking Improvement
Dynamic Message Sign
Crosswalk
17
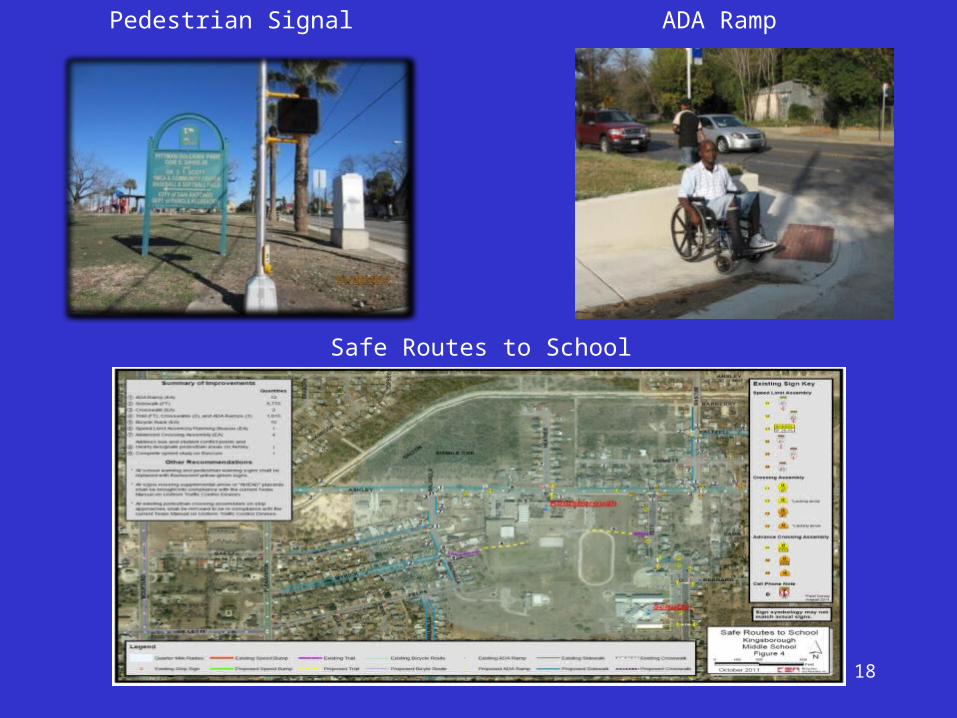
Pedestrian Signal ADA Ramp
Safe Routes to School
18
San Antonio Housing Authority Locations
• Walking trails and fitness stations in four locations
• Alazan Courts• Lincoln Heights• SpringView • Cassiano
19
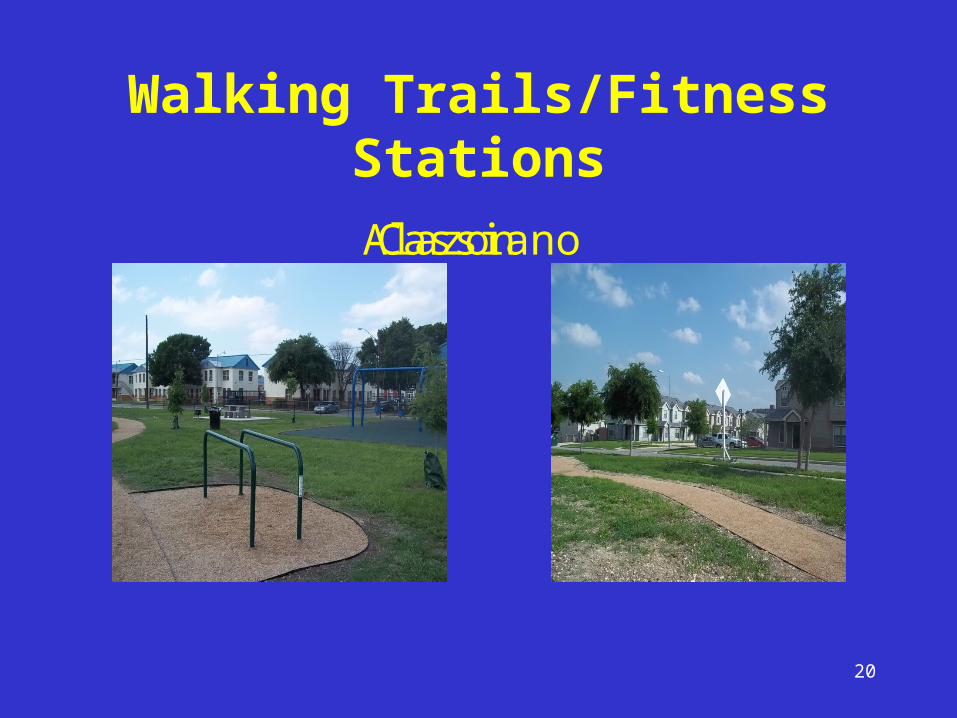
Walking Trails/Fitness Stations
Alazon Cassiano
20
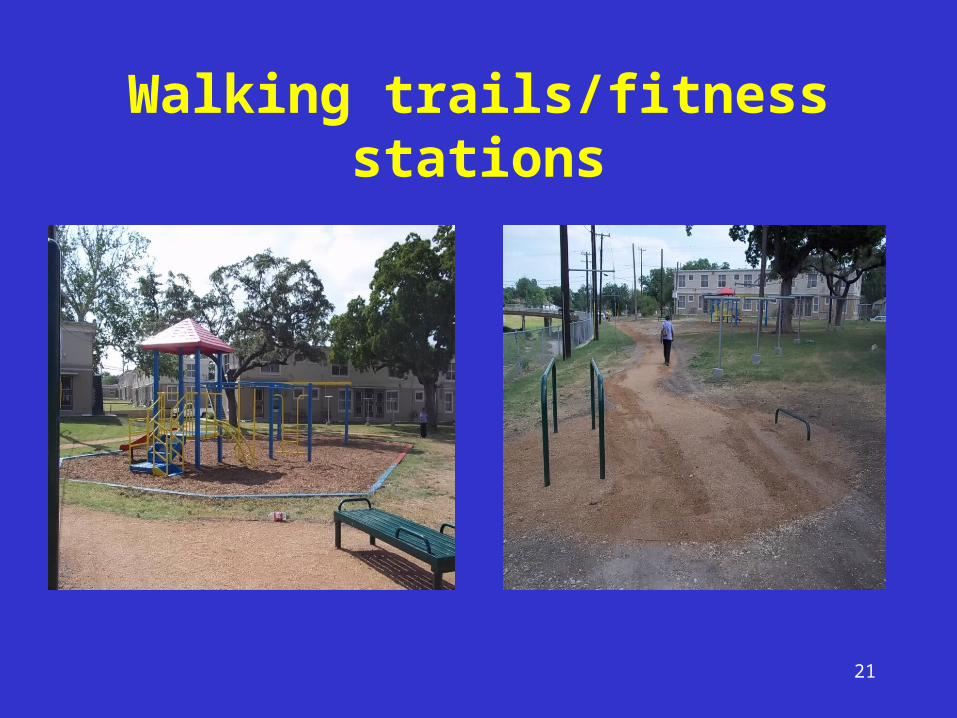
Walking trails/fitness stations
21
Fitness Stations & Walking Trails in Libraries
• Mission Library (both)• Parman Library (both)• Johnston Library (trail)• Memorial Library (stations• Oakwell Library (stations)
22
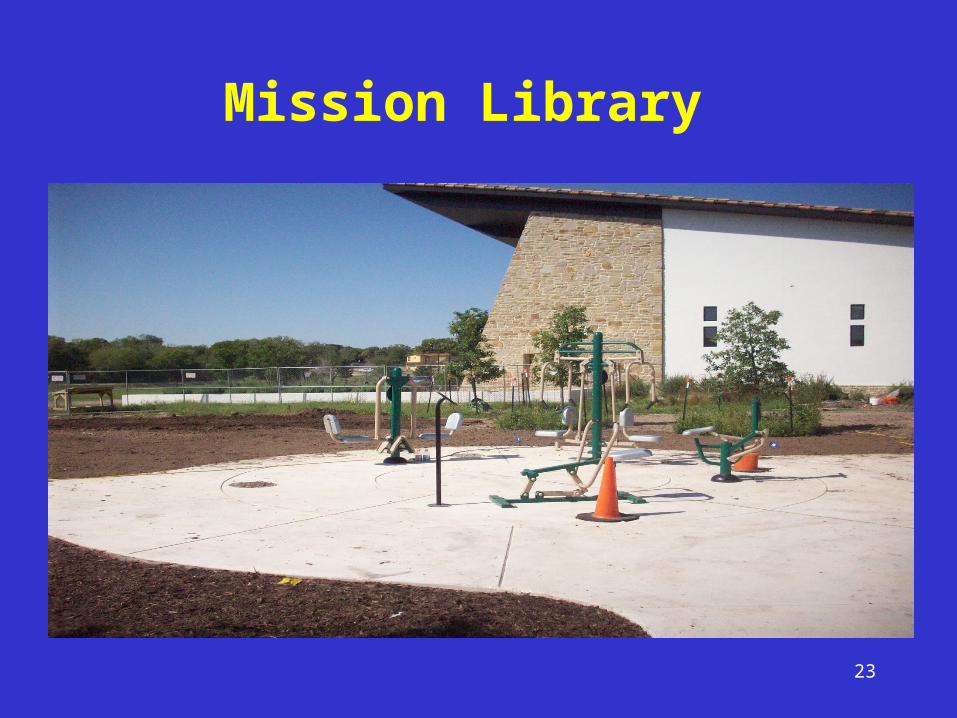
Mission Library
23
Changes in Parks
• Fitness equipment installed in 28 parks
• Trail Accessibility Information (TAI) posts -133 were installed in 31 parks
24
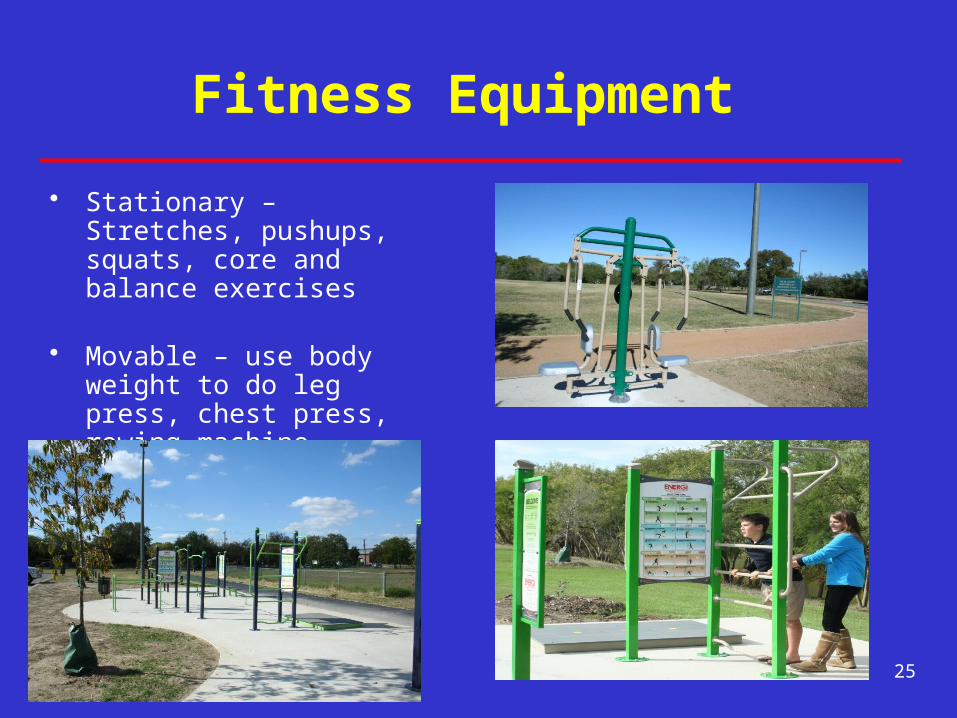
Fitness Equipment
• Stationary –Stretches, pushups, squats, core and balance exercises
• Movable – use body weight to do leg press, chest press, rowing machine, cardio walker.
25
Trail Assessment
• High Efficiency Trail Assessment Process (HETAP) used to assess trail characteristics
• Purpose: provide park users information regarding length, width, elevation, running slopes, surface type
• 101 miles assessed in 31 parks
26
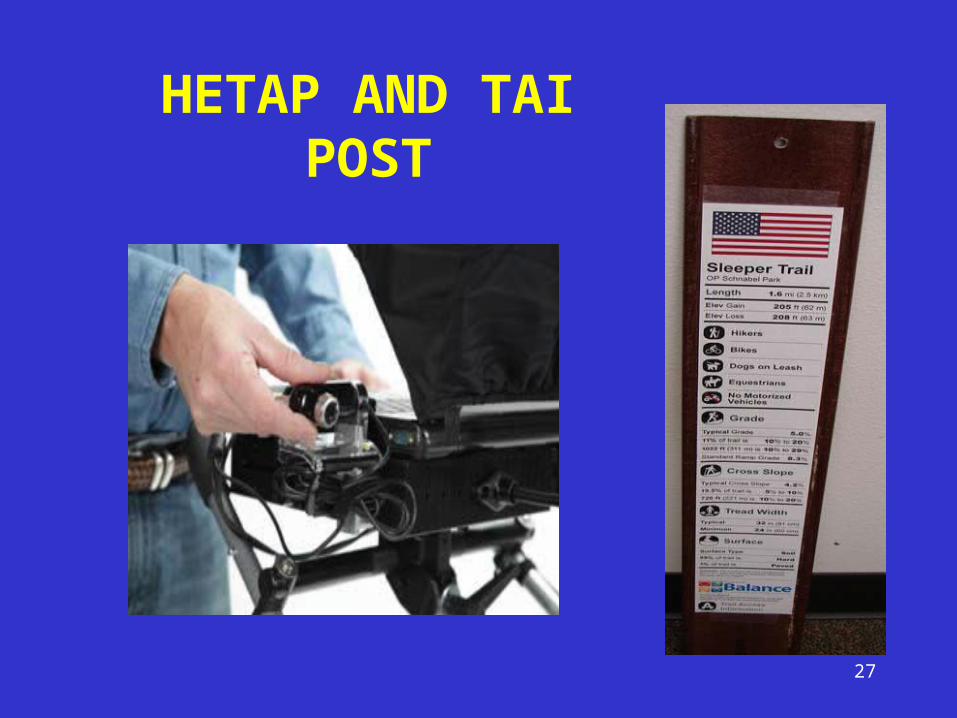
HETAP AND TAI POST
27
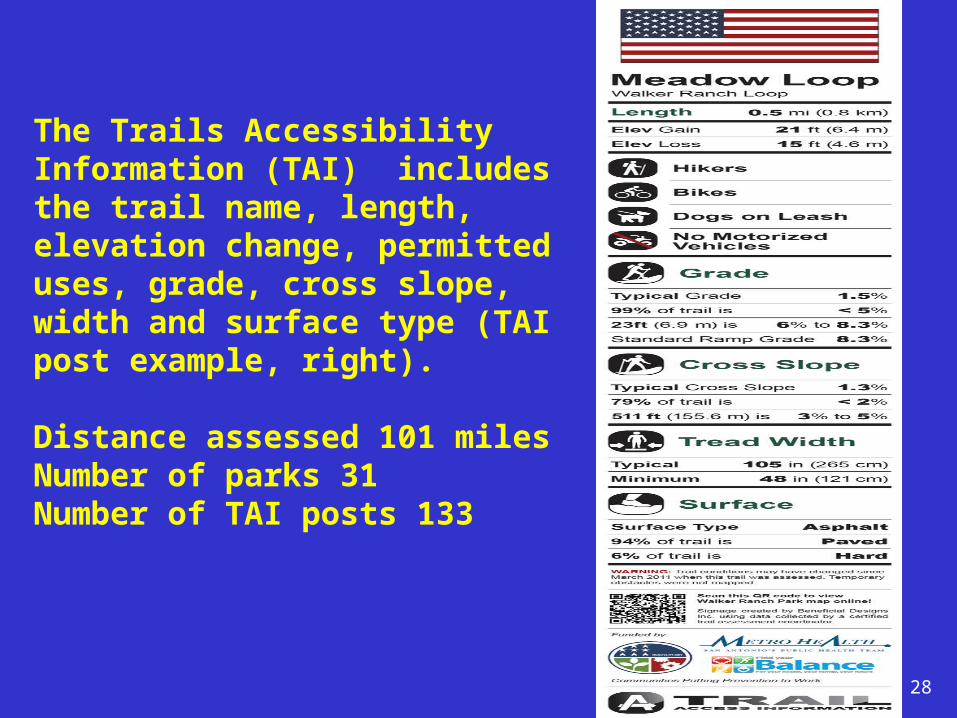
The Trails Accessibility Information (TAI) includes the trail name, length, elevation change, permitted uses, grade, cross slope, width and surface type (TAI post example, right).
Distance assessed 101 milesNumber of parks 31Number of TAI posts 133
28
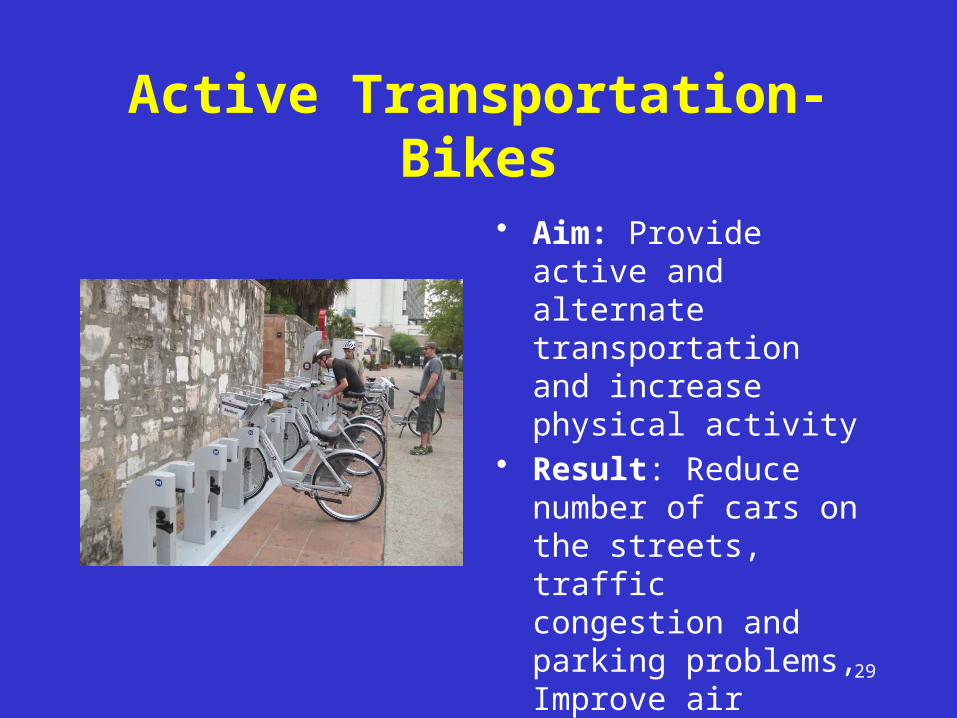
Active Transportation-Bikes
• Aim: Provide active and alternate transportation and increase physical activity
• Result: Reduce number of cars on the streets, traffic congestion and parking problems, Improve air quality
29
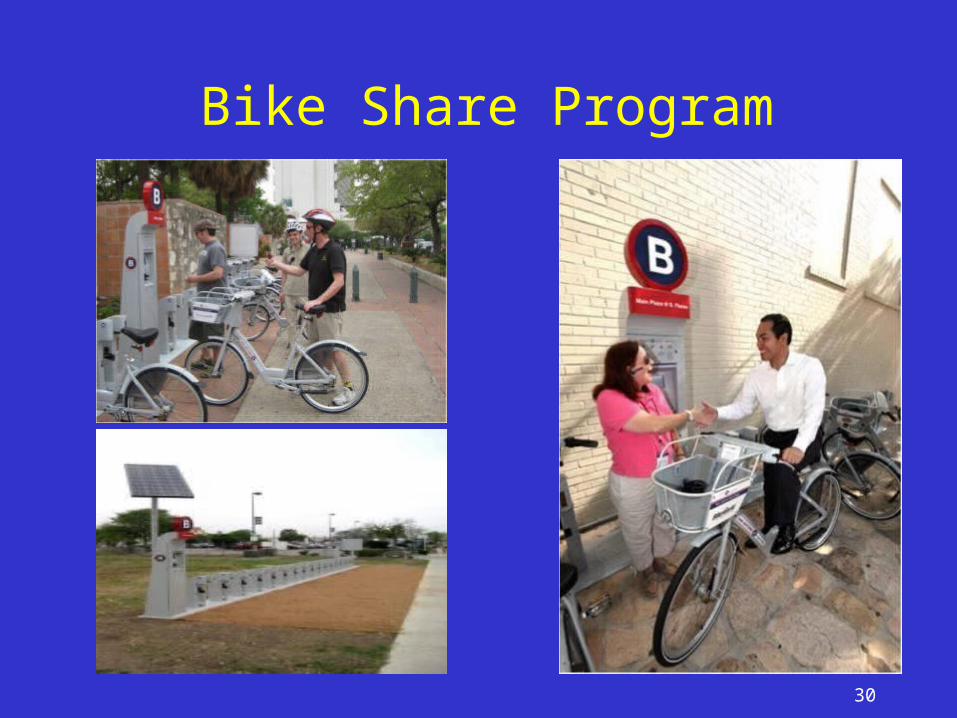
Bike Share Program
30
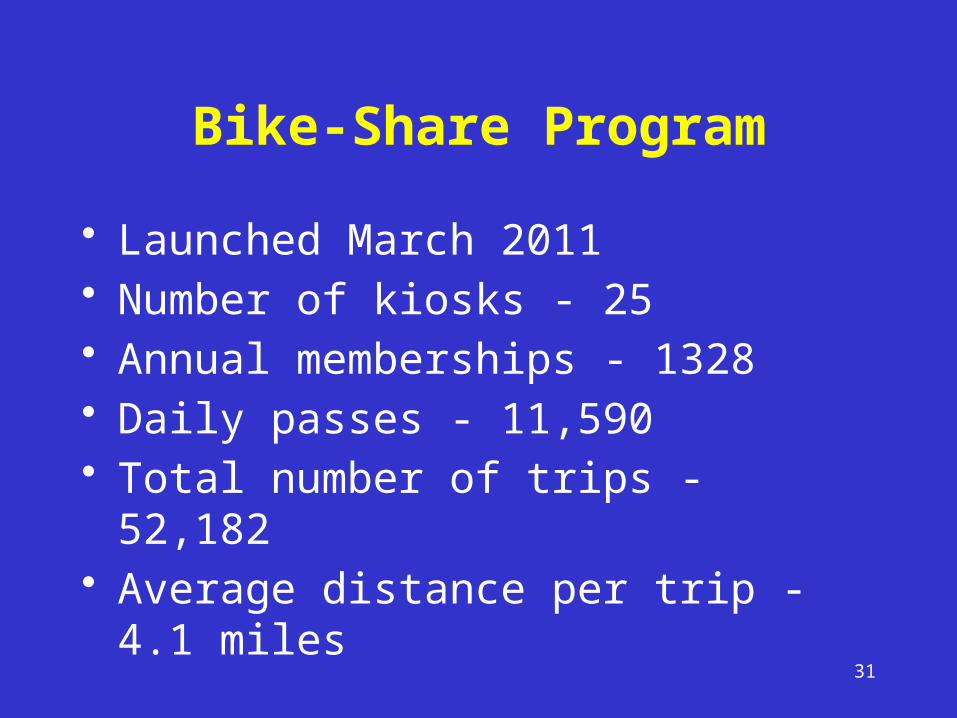
• Launched March 2011• Number of kiosks - 25• Annual memberships - 1328• Daily passes - 11,590• Total number of trips - 52,182• Average distance per trip - 4.1 miles
Bike-Share Program
31
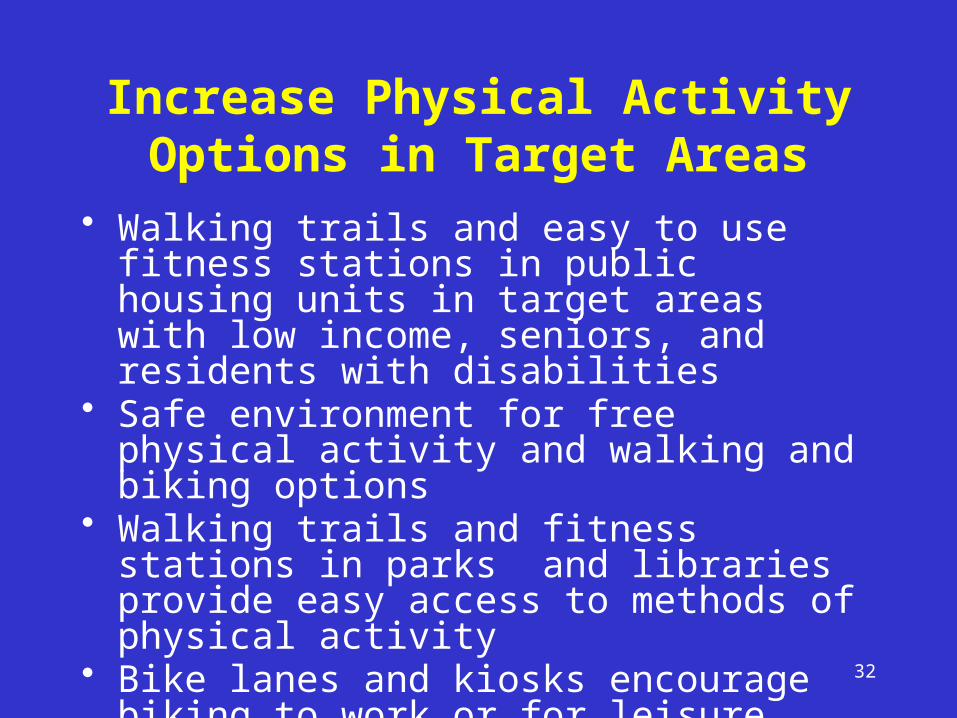
Increase Physical Activity Options in Target Areas
• Walking trails and easy to use fitness stations in public housing units in target areas with low income, seniors, and residents with disabilities
• Safe environment for free physical activity and walking and biking options
• Walking trails and fitness stations in parks and libraries provide easy access to methods of physical activity
• Bike lanes and kiosks encourage biking to work or for leisure.
32
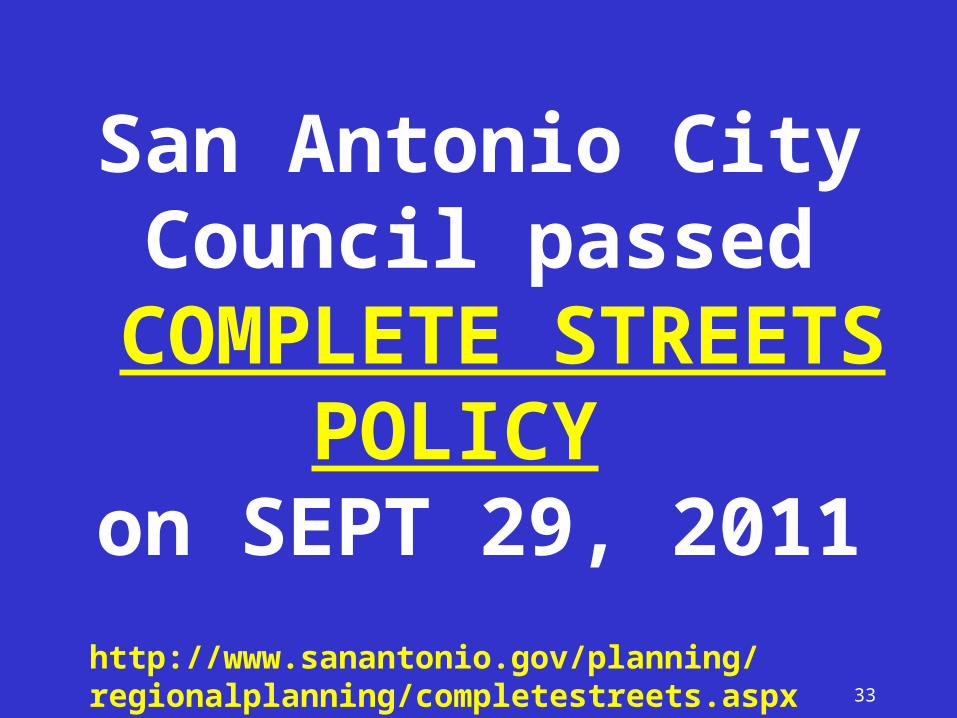
San Antonio City Council passed
COMPLETE STREETS POLICY
on SEPT 29, 2011http://www.sanantonio.gov/planning/regionalplanning/completestreets.aspx 33
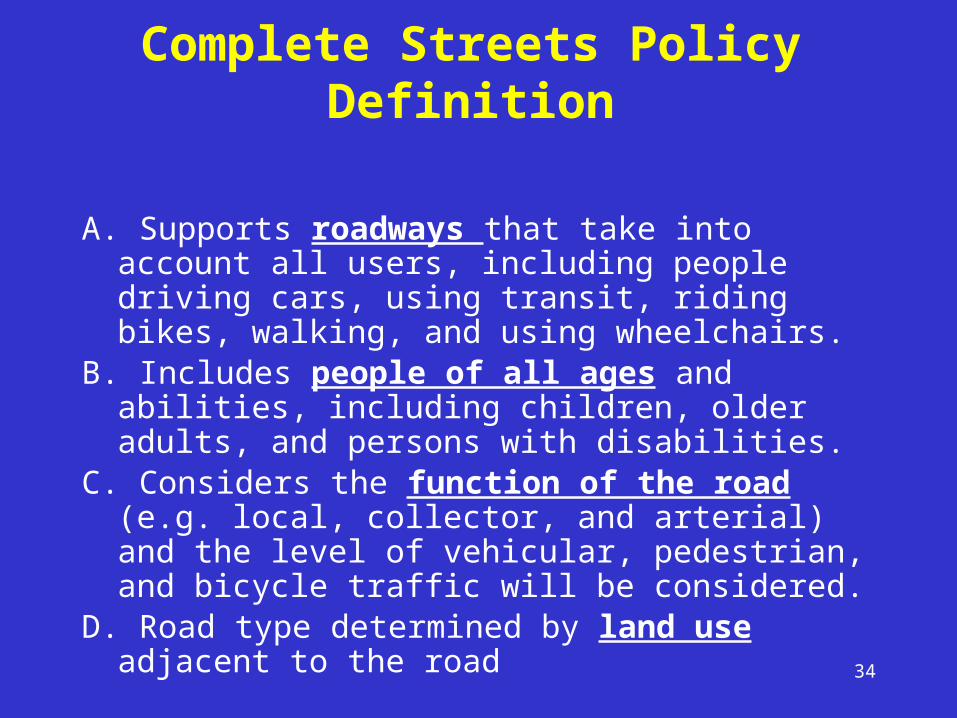
Complete Streets Policy Definition
A. Supports roadways that take into account all users, including people driving cars, using transit, riding bikes, walking, and using wheelchairs.
B. Includes people of all ages and abilities, including children, older adults, and persons with disabilities.
C. Considers the function of the road (e.g. local, collector, and arterial) and the level of vehicular, pedestrian, and bicycle traffic will be considered.
D. Road type determined by land use adjacent to the road
34
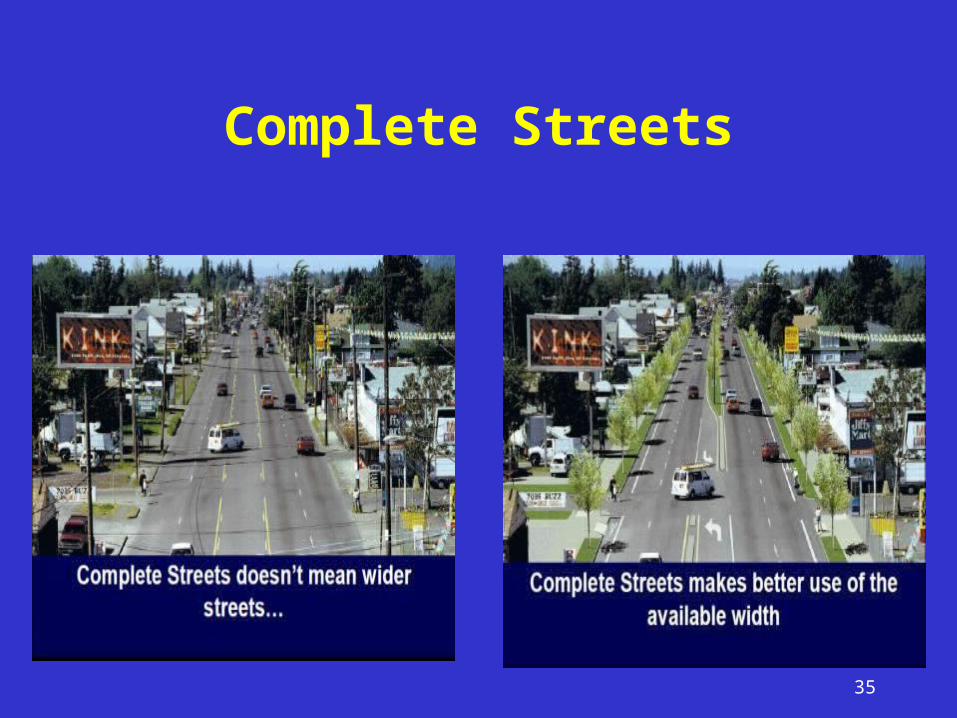
Complete Streets
35
Benefits to the Residents and Neighborhoods
• Enhance choice of mobility–all modes of travel–bike, walk, car, bus
• Facilitate physical activity for daily needs–pedestrians, Bike Master Plan
• Improve quality of life, health and safety• Neighborhood connectivity to benefit all
members of the city
36
Acknowledgement With Thanks to
• John Berlanga, Senior Management Analyst, Metro Health
• Dr. Anil Mangla, Epidemiologist, Metro Health
• Jeremy Beer, Health Program Specialist, CPPW
• Dr. Isabela Lucas, Technical Consultant ICF Macro
37

For more information
Mary Thomas, Senior Management Analyst,
San Antonio Metropolitan Health District,San Antonio TX
[email protected] 207 5371

Any Questions ?
39


![Citrus Health Benefits Health Benefits of Citrus Fruits CSIRO Full Report[1]](https://img.pdfslide.us/doc/110x75/544f1ee6af7959e11e8b4ed9/citrus-health-benefits-health-benefits-of-citrus-fruits-csiro-full-report1.jpg)