Embed Size (px)
Citation preview
P A G E 6 5
L O C A L G O V E R N M E N T S P A T I A L
I N F O R M A T I O N M A N A G E M E N T
> T O O L K I T V E R S I O N 2.0
Building capacity for integrated spatial
information management solutions
J U L Y 2 0 0 7
A U S T R A L I A N L O C A L
G O V E R N M E N T A S S O C I A T I O N
A joint initiative of the Australian Local Government Association
and ANZLIC—the Spatial Information Council
M O D U L E 2
L O C A L G O V E R N M E N T S P AT I A L
I N F O R M AT I O N M A N A G E M E N T
> T O O L K I T V 2.0
M O D U L E 2
An introduction to spatial information systems
2
Users are directed to the
prelims of the Toolkit for
essential information,
including that addressing
copyright and liability
matters, and the ISBN.
> This is Module 2
to the L O C A L
G O V E R N M E N T
S PAT I A L
I N F O R M AT I O N
M A N A G E M E N T
T O O L K I T .
Ten detailed modules and
essential preliminary
matter to the Toolkit
are available via:
www.alga.asn.au and
www.anzlic.org.au.
> Please note in particular
the information detailed
in the prelims regarding
the use, resale and
reproduction of the
Toolkit.
> M O D U L E 2
An Introduction to spatial information systems
Guide for managers. . . . . . . . . . . . . . . . . . . . . . . . . . . . . . . . . . . . . . . . . . . . . . . . . . . . . . . . . . . . . . 67
2.1 Introduction . . . . . . . . . . . . . . . . . . . . . . . . . . . . . . . . . . . . . . . . . . . . . . . . . . . . . . . . . . . . . . . 68
2.1.1 What is a spatial information system? . . . . . . . . . . . . . . . . . . . . . . . . . . . . . . . . . . . 68
2.2 How does a spatial information system work? . . . . . . . . . . . . . . . . . . . . . . . . . . . . . . . . . . . 73
2.2.1 Relating information from different sources . . . . . . . . . . . . . . . . . . . . . . . . . . . . . . 73
2.2.2 Web data sources . . . . . . . . . . . . . . . . . . . . . . . . . . . . . . . . . . . . . . . . . . . . . . . . . . . . 79
2.2.3 Data capture . . . . . . . . . . . . . . . . . . . . . . . . . . . . . . . . . . . . . . . . . . . . . . . . . . . . . . . . 79
2.2.4 Data integration . . . . . . . . . . . . . . . . . . . . . . . . . . . . . . . . . . . . . . . . . . . . . . . . . . . . . 80
2.2.5 Registration and projection . . . . . . . . . . . . . . . . . . . . . . . . . . . . . . . . . . . . . . . . . . . . 81
2.2.6 Data structures. . . . . . . . . . . . . . . . . . . . . . . . . . . . . . . . . . . . . . . . . . . . . . . . . . . . . . 83
2.2.7 Data interpolation and modelling . . . . . . . . . . . . . . . . . . . . . . . . . . . . . . . . . . . . . . . 85
2.3 What is special about a spatial information system?. . . . . . . . . . . . . . . . . . . . . . . . . . . . . . 85
2.3.1 Information retrieval. . . . . . . . . . . . . . . . . . . . . . . . . . . . . . . . . . . . . . . . . . . . . . . . . . 85
2.3.2 Topological modelling . . . . . . . . . . . . . . . . . . . . . . . . . . . . . . . . . . . . . . . . . . . . . . . . 85
2.3.3 Networks . . . . . . . . . . . . . . . . . . . . . . . . . . . . . . . . . . . . . . . . . . . . . . . . . . . . . . . . . . . 86
2.3.4 Overlay. . . . . . . . . . . . . . . . . . . . . . . . . . . . . . . . . . . . . . . . . . . . . . . . . . . . . . . . . . . . . 86
2.3.5 Data output . . . . . . . . . . . . . . . . . . . . . . . . . . . . . . . . . . . . . . . . . . . . . . . . . . . . . . . . . 89
2.4 Additional support . . . . . . . . . . . . . . . . . . . . . . . . . . . . . . . . . . . . . . . . . . . . . . . . . . . . . . . . . . 90
2.4.1 Spatial information systems . . . . . . . . . . . . . . . . . . . . . . . . . . . . . . . . . . . . . . . . . . . 90
2.4.2 Global positioning systems . . . . . . . . . . . . . . . . . . . . . . . . . . . . . . . . . . . . . . . . . . . . 91
Acronyms . . . . . . . . . . . . . . . . . . . . . . . . . . . . . . . . . . . . . . . . . . . . . . . . . . . . . . . . . . . . . . . . . . . . . . 91
Module 3: Data management principles . . . . . . . . . . . . . . . . . . . . . . . . . . . . . . . . . . . . . . . . . . . . . . . 93
Module 4: Spatial data priorities, standards and compliance . . . . . . . . . . . . . . . . . . . . . . . . . . . . . 117
Module 5: Finding and getting hold of data . . . . . . . . . . . . . . . . . . . . . . . . . . . . . . . . . . . . . . . . . . . . 137
Module 6: Project management and justification . . . . . . . . . . . . . . . . . . . . . . . . . . . . . . . . . . . . . . . 153
Module 7: Guidelines for selecting spatial information system software and hardware . . . . . . . . 173
Module 8: Raising capability for using spatial information . . . . . . . . . . . . . . . . . . . . . . . . . . . . . . . 197
Module 9: Map production guidelines . . . . . . . . . . . . . . . . . . . . . . . . . . . . . . . . . . . . . . . . . . . . . . . . 211
Module 10: Working together . . . . . . . . . . . . . . . . . . . . . . . . . . . . . . . . . . . . . . . . . . . . . . . . . . . . . . . 225
Contents
Concise guide for technical managers. . . . . . . . . . . . . . . . . . . . . . . . . . . . . . . . . . . . . . . . . . . . . . . . . . 1
Module 1: Spatial information management in local government. . . . . . . . . . . . . . . . . . . . . . . . . . . 41
Module 2: An Introduction to spatial information systems. . . . . . . . . . . . . . . . . . . . . . . . . . . . . . . . 65
P A G E 6 6
L O C A L G O V E R N M E N T S P AT I A L
I N F O R M AT I O N M A N A G E M E N T
> T O O L K I T V 2.0 M O D U L E 2
Guide for managers
Context
Local government can benefit greatly from reliable and up-to-date spatial information
in planning and management. Spatial data can contribute to the analysis of situations
and issues by increasing efficiency and effectiveness and reducing uncertainty.
The value of the information and the effectiveness of the decision-making/planning
processes are very closely related to the quality and completeness of the information
and the manner in which it is made available. Key components of this are data access,
management, integration, analysis, standards and communication.
Councils may need to purchase and/or upgrade spatial information software and
associated hardware. A spatial information system is a computer system for capture
(input) and storage (management), analysis and display of geographic data (that is, data
that can be referenced according to location). Although a spatial information system is
often thought of as a single piece of software, it should really be considered in broader
terms as part of an information management system including procedures, operating
personnel, data and hardware. In this context, a spatial information system is a
computer system that facilitates the phases of data entry, data management, data
manipulation and analysis, and data presentation.
Module 2: An introduction to spatial information systems provides background material
and guidelines to assist councils to understand spatial information systems and the
visualisation of spatial data.
Actions
This module will explain the basic operations of spatial information systems and how
they can support the management of local government functions. An understanding of
the basic functions of spatial information systems will enable managers to more fully
appreciate the benefits that can be realised from a fully integrated information solution
incorporating spatial information systems and spatial visualisation tools.
In addition, managers should be aware that a complete range of software is now
available, from free viewing applications (with limited functionality) through to high-end
professional systems and web-based applications. It is now possible to have access to
spatial data on desktop computers using standard internet browsers.
The community can capitalise on and leverage the benefits obtained from access to
local government spatial data and the enrichment that geospatial data can bring to
local government service provision. Numerous services are available to support this
process, including the various state- and territory-based clearing houses or data
portals that enable access to spatial datasets.
Acknowledgments
This module includes mapping produced by the City of Swan, Western Australia, the
Department of Water, Western Australia and the Department of Land Information,
Western Australia. These sources are duly acknowledged.
P A G E 6 7
M O D U L E 2
L O C A L G O V E R N M E N T S P AT I A L
I N F O R M AT I O N M A N A G E M E N T
> T O O L K I T V 2.0
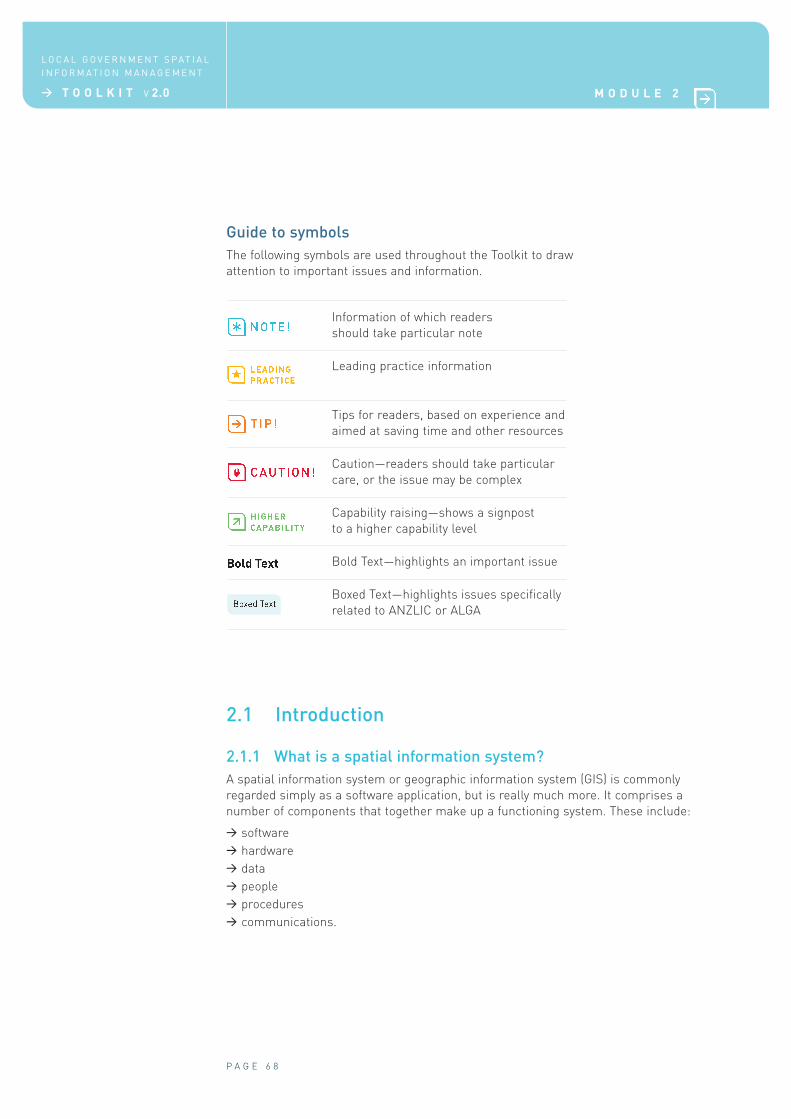
Guide to symbols
The following symbols are used throughout the Toolkit to draw
attention to important issues and information.
Information of which readers
should take particular note
Leading practice information
Tips for readers, based on experience and
aimed at saving time and other resources
Caution—readers should take particular
care, or the issue may be complex
Capability raising—shows a signpost
to a higher capability level
Bold Text—highlights an important issue
Boxed Text—highlights issues specifically
related to ANZLIC or ALGA
2.1 Introduction
2.1.1 What is a spatial information system?
A spatial information system or geographic information system (GIS) is commonly
regarded simply as a software application, but is really much more. It comprises a
number of components that together make up a functioning system. These include:
> software
> hardware
> data
> people
> procedures
> communications.
P A G E 6 8
L O C A L G O V E R N M E N T S P AT I A L
I N F O R M AT I O N M A N A G E M E N T
> T O O L K I T V 2.0 M O D U L E 2
Software
The software components of the system represent the interface with which users
interact. The software includes the user interfaces, algorithms and data management
structures that allow for the capture, management, output and presentation of the data.
Hardware
The hardware components of the system are the computers (PCs, workstations, servers
and mainframes) on which the software and data reside, as well as peripherals such as
scanners, global positioning system (GPS) devices, mobile mapping devices, printers,
etc.
Data
The data may include the spatial features (the spatial representations of real-world
elements in point, line or polygon form) and attribute information (qualitative and
quantitative information) that is linked to the spatial features. For example, a housing
lot will have a number of attributes attached to it, including lot number, address, area,
street address, owner, etc. Data linked to the spatial features may be contained within
the system, or linked to it using database connections.
People
The system is not stand-alone. Spatial information managers and operators must run
the system, and it will be used by people within the organisation (such as engineers and
planners) or outside the organisation (such as ratepayers).
For example, the City of Swan in Perth in Western Australia allows customers to query
its spatial information system through a web mapping portal called Intermaps.
Property, zoning, health and electoral data layers can be explored (see
http://maps.cityofswan.com/intermaps50/).
Procedures
Spatial information systems are complex, with many interacting components. Their
effectiveness and utility will be maximised by using leading practice procedures that
allow them to integrate well with organisational systems.
Communications
Data and information need to flow seamlessly between the spatial information system
and other organisational systems. Communications networks, and accepted data and
transmission standards, are necessary to facilitate this. With the increasing uptake of
internet technologies, spatial data and services can be readily accessed using the
internet.
A spatial information system containing these components will allow for data capture,
manipulation, management, analysis and output. This is illustrated in Figure 2.1.
P A G E 6 9
M O D U L E 2
L O C A L G O V E R N M E N T S P AT I A L
I N F O R M AT I O N M A N A G E M E N T
> T O O L K I T V 2.0
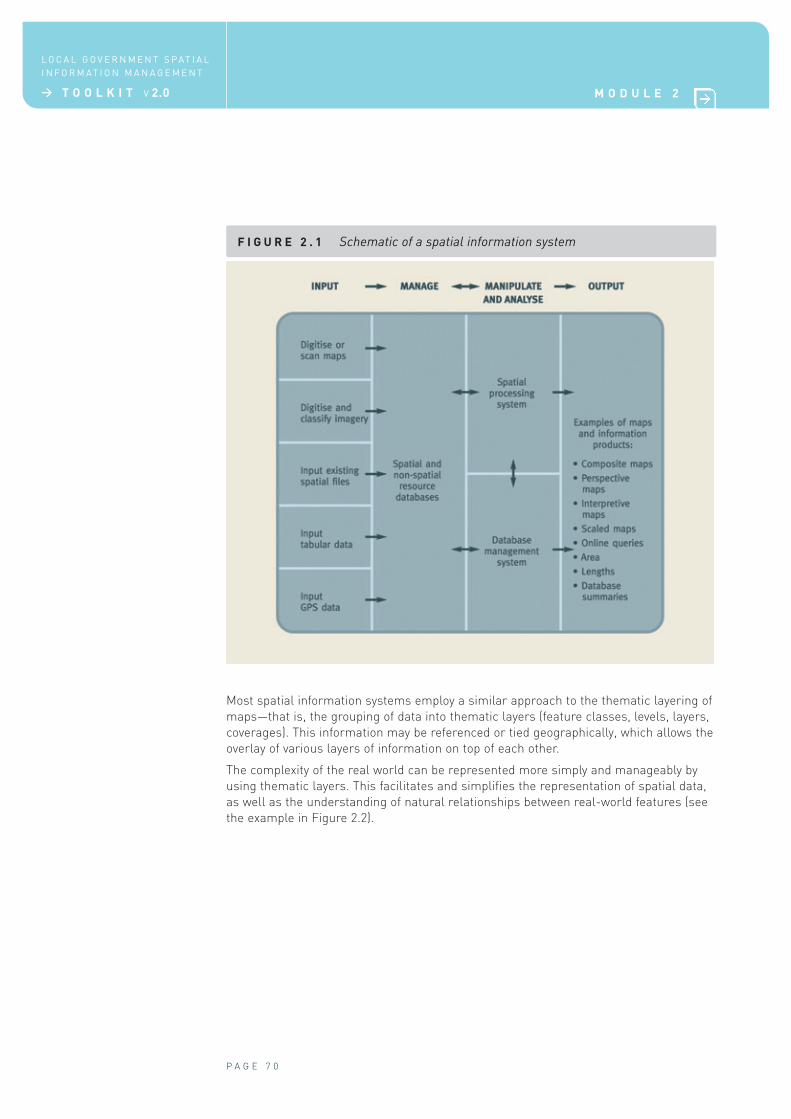
F I G U R E 2 . 1 Schematic of a spatial information system
P A G E 7 0
L O C A L G O V E R N M E N T S P AT I A L
I N F O R M AT I O N M A N A G E M E N T
> T O O L K I T V 2.0 M O D U L E 2
Most spatial information systems employ a similar approach to the thematic layering of
maps—that is, the grouping of data into thematic layers (feature classes, levels, layers,
coverages). This information may be referenced or tied geographically, which allows the
overlay of various layers of information on top of each other.
The complexity of the real world can be represented more simply and manageably by
using thematic layers. This facilitates and simplifies the representation of spatial data,
as well as the understanding of natural relationships between real-world features (see
the example in Figure 2.2).
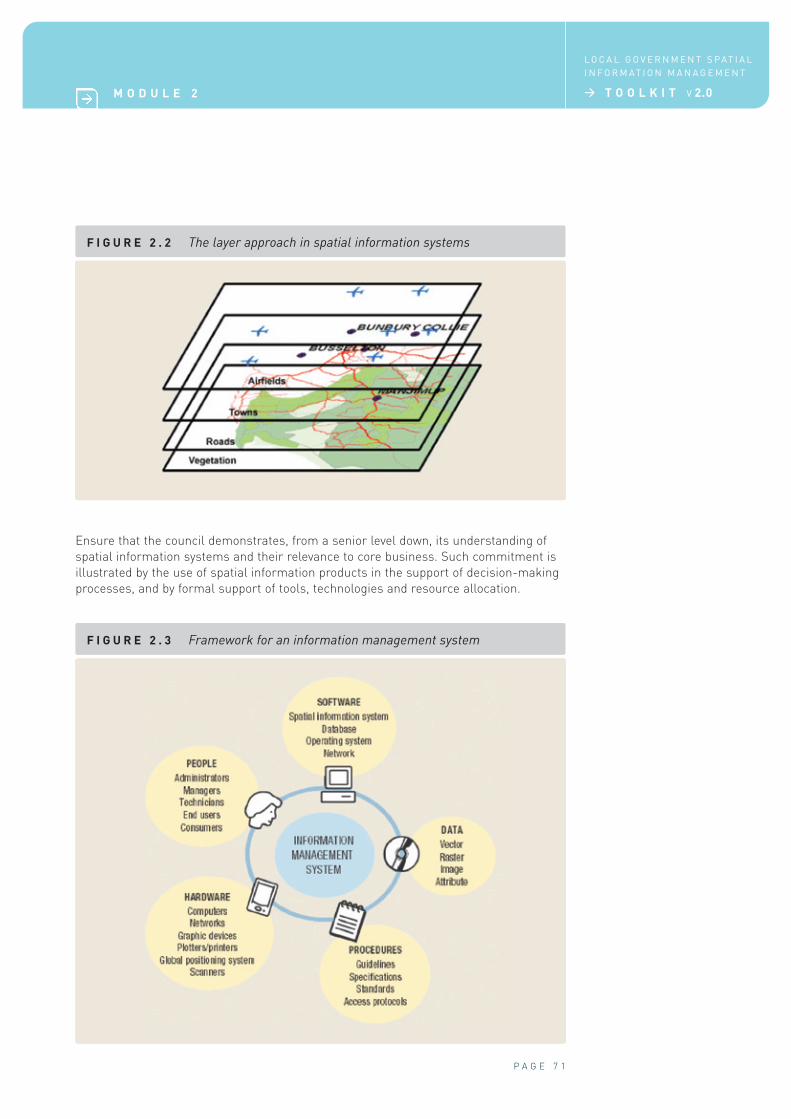
F I G U R E 2 . 2 The layer approach in spatial information systems
P A G E 7 1
M O D U L E 2
L O C A L G O V E R N M E N T S P AT I A L
I N F O R M AT I O N M A N A G E M E N T
> T O O L K I T V 2.0
Ensure that the council demonstrates, from a senior level down, its understanding of
spatial information systems and their relevance to core business. Such commitment is
illustrated by the use of spatial information products in the support of decision-making
processes, and by formal support of tools, technologies and resource allocation.
F I G U R E 2 . 3 Framework for an information management system
One of the major strengths of a spatial information system is its ability to link
numerous databases that may be dispersed in the organisation, and perhaps outside
the organisation. These data can be accessed through open database connectivity
standards, which are being increasingly adopted.
This spatial and non-spatial information can be visualised and analysed within a spatial
information system, in a spatial context. Many datasets, ranging from simple text files
and spreadsheets to large relational databases, that were previously only used within
one part of an organisation (siloed), can be integrated into a spatial information system
to generate additional levels of information and analyses not previously possible. Once
the data have been accessed using a spatial information system, it is then possible to
produce mapped outputs, in association with tabulated, graphed, animated and other
types of outputs, that can assist managers in their decision-making processes.
Spatial information systems that are well integrated with other systems in an
organisation can provide information quickly and in the desired form to managers and
key professionals. This provides efficient and effective decision support.
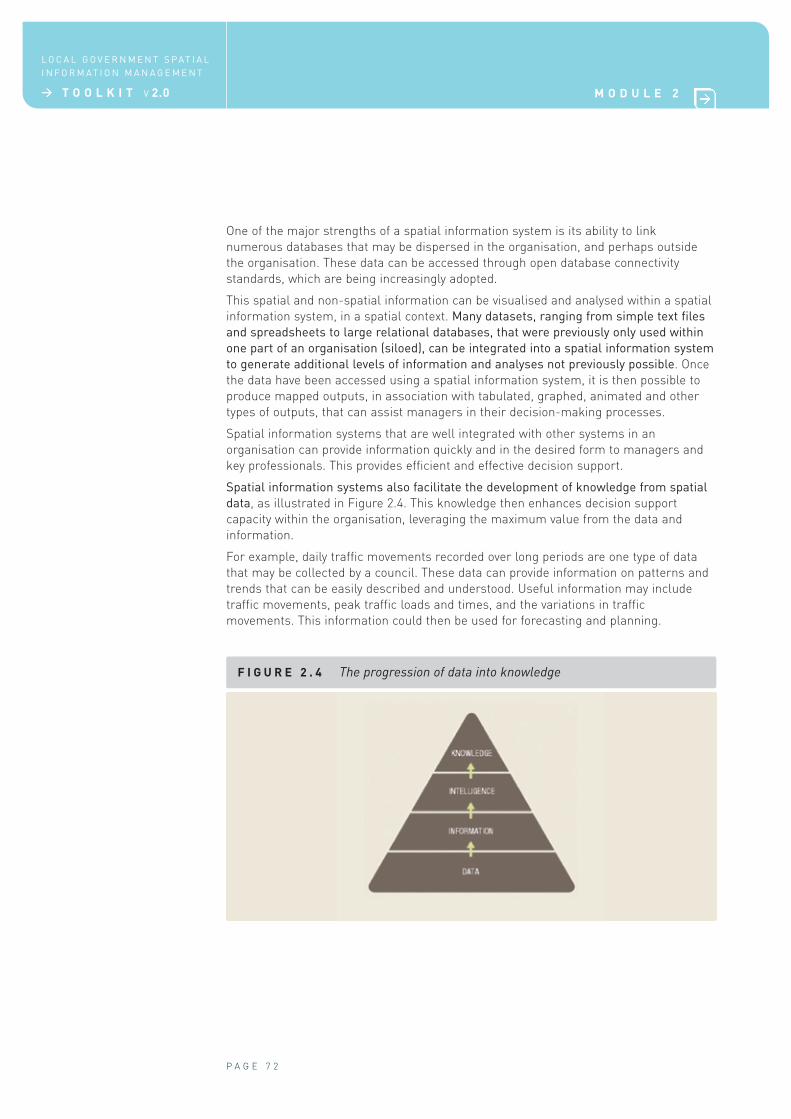
Spatial information systems also facilitate the development of knowledge from spatial
data, as illustrated in Figure 2.4. This knowledge then enhances decision support
capacity within the organisation, leveraging the maximum value from the data and
information.
For example, daily traffic movements recorded over long periods are one type of data
that may be collected by a council. These data can provide information on patterns and
trends that can be easily described and understood. Useful information may include
traffic movements, peak traffic loads and times, and the variations in traffic
movements. This information could then be used for forecasting and planning.
F I G U R E 2 . 4 The progression of data into knowledge
P A G E 7 2
L O C A L G O V E R N M E N T S P AT I A L
I N F O R M AT I O N M A N A G E M E N T
> T O O L K I T V 2.0 M O D U L E 2
2.2 How does a spatial information system work?
2.2.1 Relating information from different sources
The power of spatial information systems lies in their ability to align different layers of
information from the same location, and then to derive conclusions about spatial
relationships within and between the layers.
Many data have some form of geographic component, and can therefore be referenced
to geographical locations such as points, lines or areas. A location can be defined by
various methods, including longitude and latitude, grid coordinates (easting and
northing), lot boundaries with a unique identifier, or the intersection of streets.
For example, when traffic movement data are collected, the collection location can be
identified. Comparison of traffic information with other thematic data such as zoning
densities, or the location of major traffic routes, car parks, public transport routes,
schools, shopping centres and other major infrastructure, may reveal that traffic flows
are strongly dependent on factors that are otherwise not obvious. This knowledge can
support decisions on how to manage traffic flows and parking facilities.
Many datasets available in spreadsheet or database format can be directly linked into a
spatial information system as new data layers or joined to existing data layers.
Examples of thematic layers are shown in Figures 2.5 to 2.11.
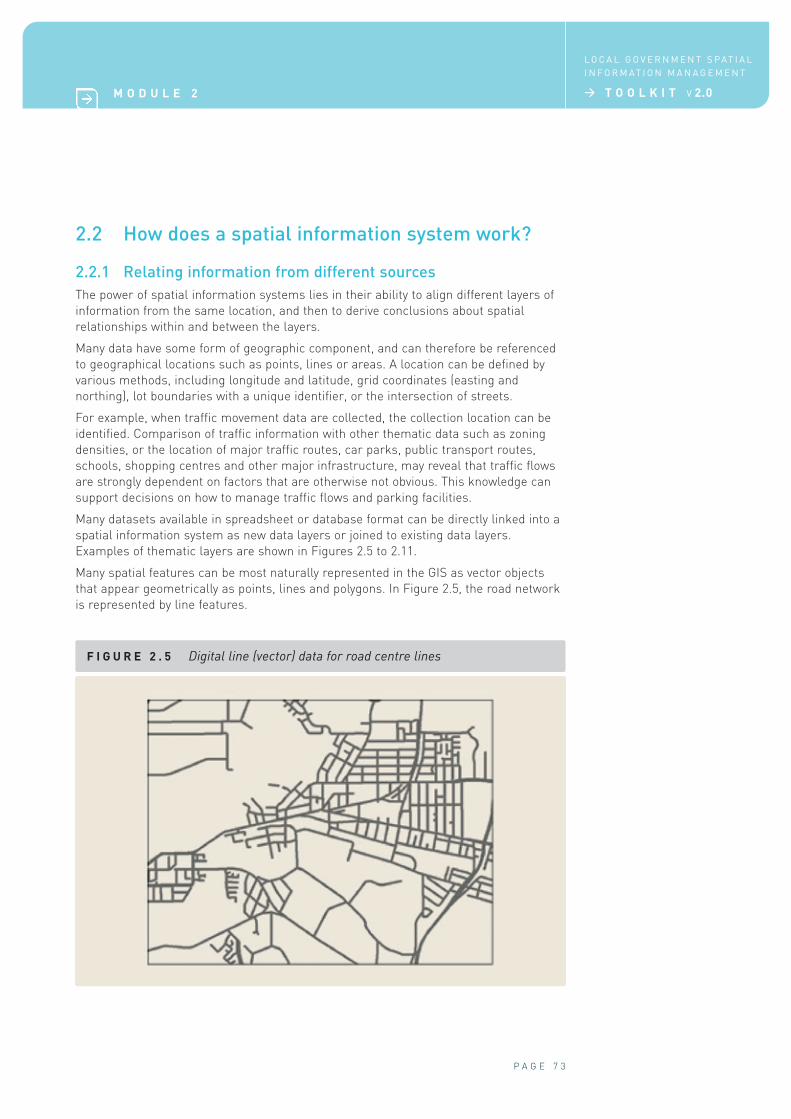
Many spatial features can be most naturally represented in the GIS as vector objects
that appear geometrically as points, lines and polygons. In Figure 2.5, the road network
is represented by line features.
F I G U R E 2 . 5 Digital line (vector) data for road centre lines
P A G E 7 3
M O D U L E 2
L O C A L G O V E R N M E N T S P AT I A L
I N F O R M AT I O N M A N A G E M E N T
> T O O L K I T V 2.0
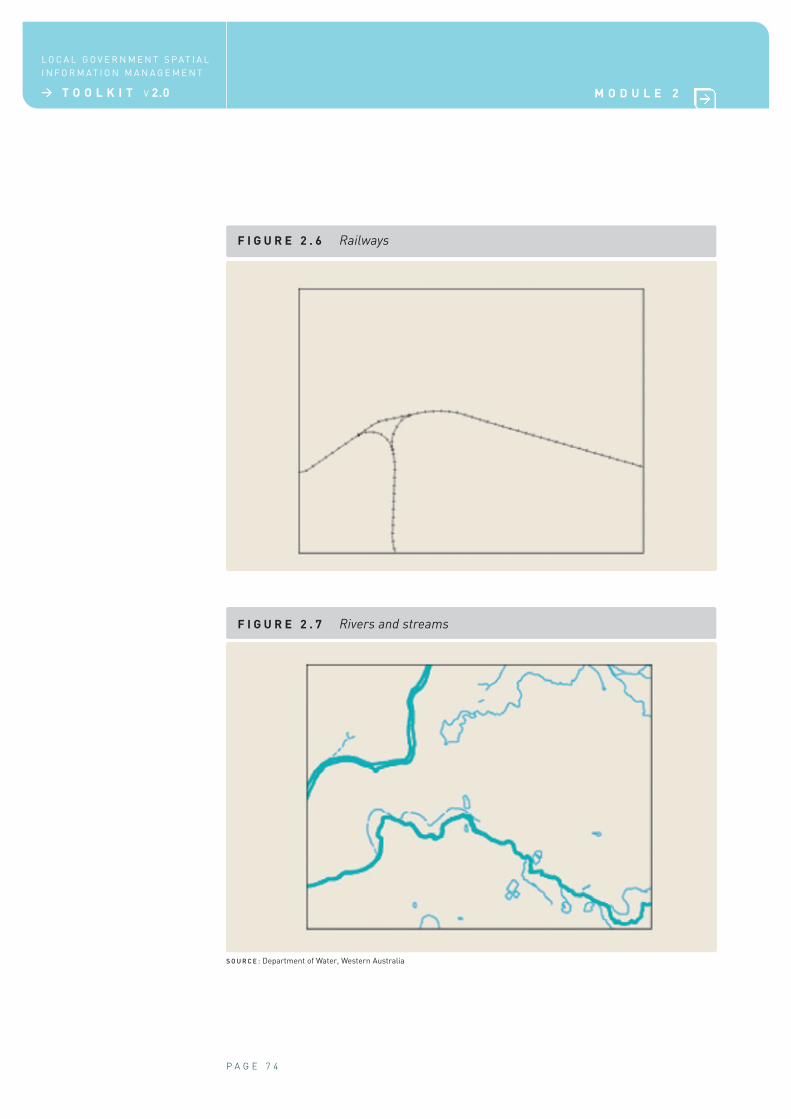
F I G U R E 2 . 6 Railways
P A G E 7 4
L O C A L G O V E R N M E N T S P AT I A L
I N F O R M AT I O N M A N A G E M E N T
> T O O L K I T V 2.0 M O D U L E 2
F I G U R E 2 . 7 Rivers and streams
S O U R C E : Department of Water, Western Australia
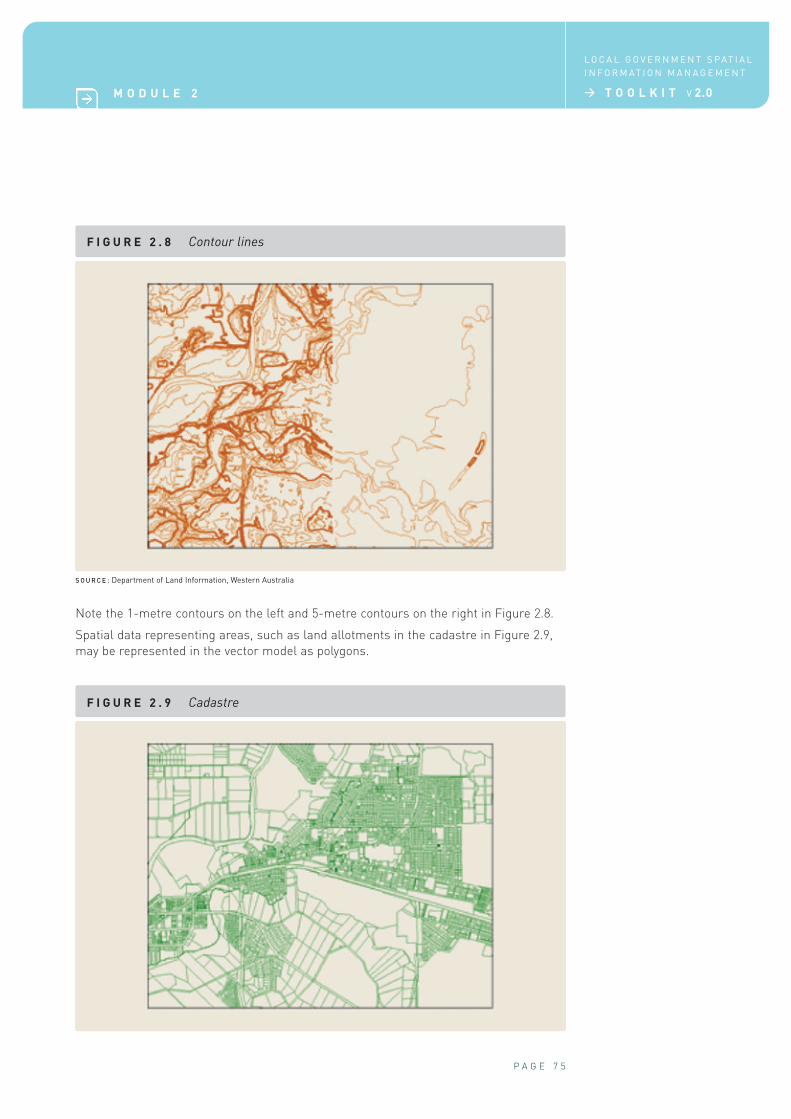
F I G U R E 2 . 8 Contour lines
S O U R C E : Department of Land Information, Western Australia
Note the 1-metre contours on the left and 5-metre contours on the right in Figure 2.8.
Spatial data representing areas, such as land allotments in the cadastre in Figure 2.9,
may be represented in the vector model as polygons.
F I G U R E 2 . 9 Cadastre
P A G E 7 5
M O D U L E 2
L O C A L G O V E R N M E N T S P AT I A L
I N F O R M AT I O N M A N A G E M E N T
> T O O L K I T V 2.0
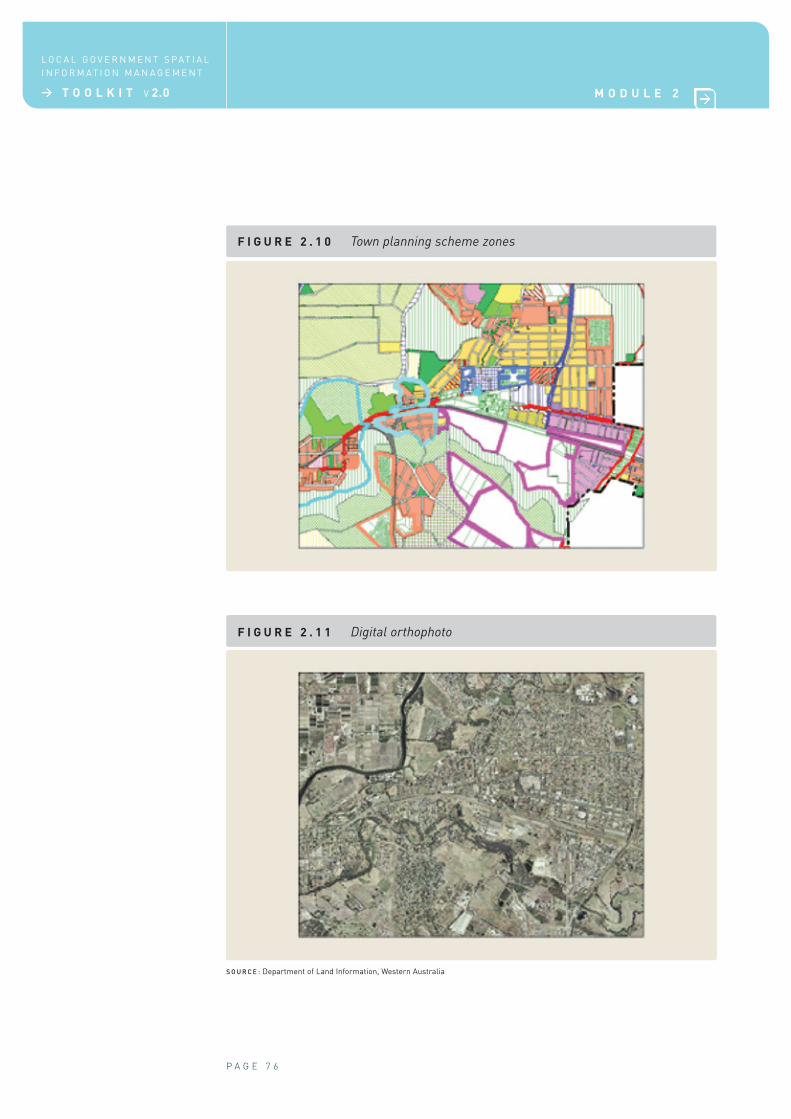
F I G U R E 2 . 1 0 Town planning scheme zones
P A G E 7 6
L O C A L G O V E R N M E N T S P AT I A L
I N F O R M AT I O N M A N A G E M E N T
> T O O L K I T V 2.0 M O D U L E 2
F I G U R E 2 . 1 1 Digital orthophoto
S O U R C E : Department of Land Information, Western Australia
Some data may be represented by a grid-based representation known as a raster. This
data model is analogous to a matrix of regular cells or pixels. Much aerial and remotely
sensed imagery is rasterised, and many spatial information systems can incorporate
and analyse raster imagery.
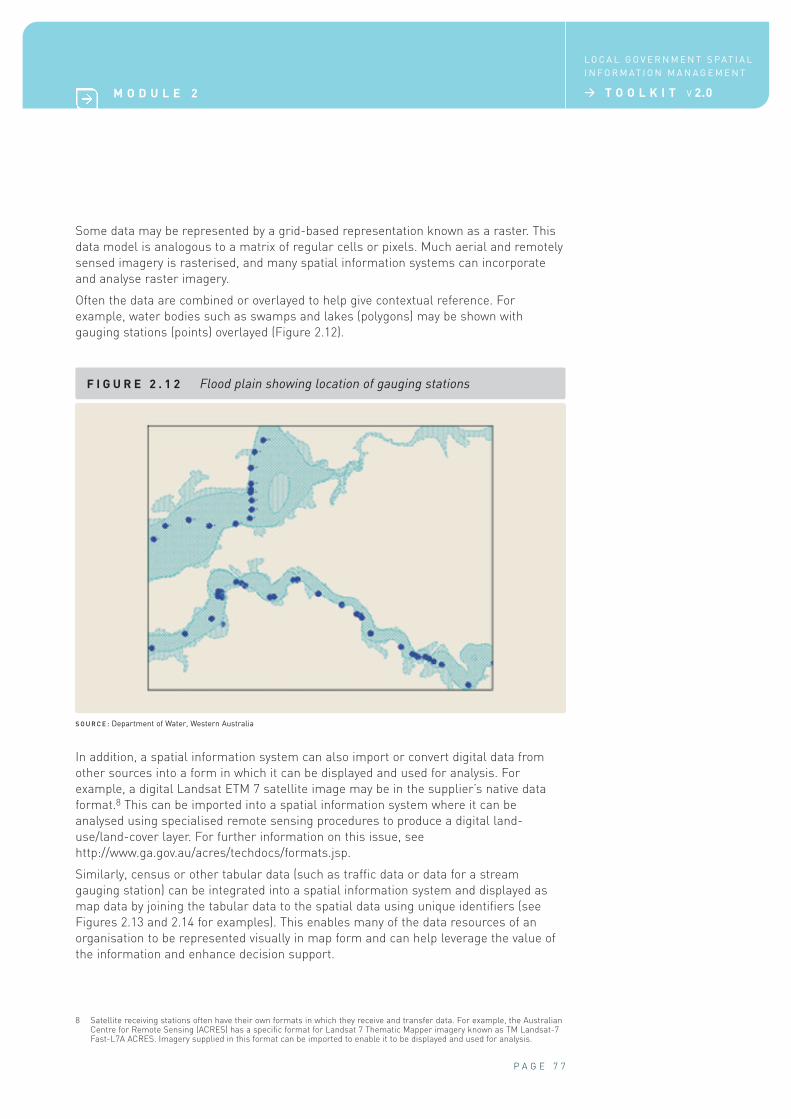
Often the data are combined or overlayed to help give contextual reference. For
example, water bodies such as swamps and lakes (polygons) may be shown with
gauging stations (points) overlayed (Figure 2.12).
F I G U R E 2 . 1 2 Flood plain showing location of gauging stations
P A G E 7 7
M O D U L E 2
L O C A L G O V E R N M E N T S P AT I A L
I N F O R M AT I O N M A N A G E M E N T
> T O O L K I T V 2.0
S O U R C E : Department of Water, Western Australia
In addition, a spatial information system can also import or convert digital data from
other sources into a form in which it can be displayed and used for analysis. For
example, a digital Landsat ETM 7 satellite image may be in the supplier’s native data
format.8 This can be imported into a spatial information system where it can be
analysed using specialised remote sensing procedures to produce a digital land-
use/land-cover layer. For further information on this issue, see
http://www.ga.gov.au/acres/techdocs/formats.jsp.
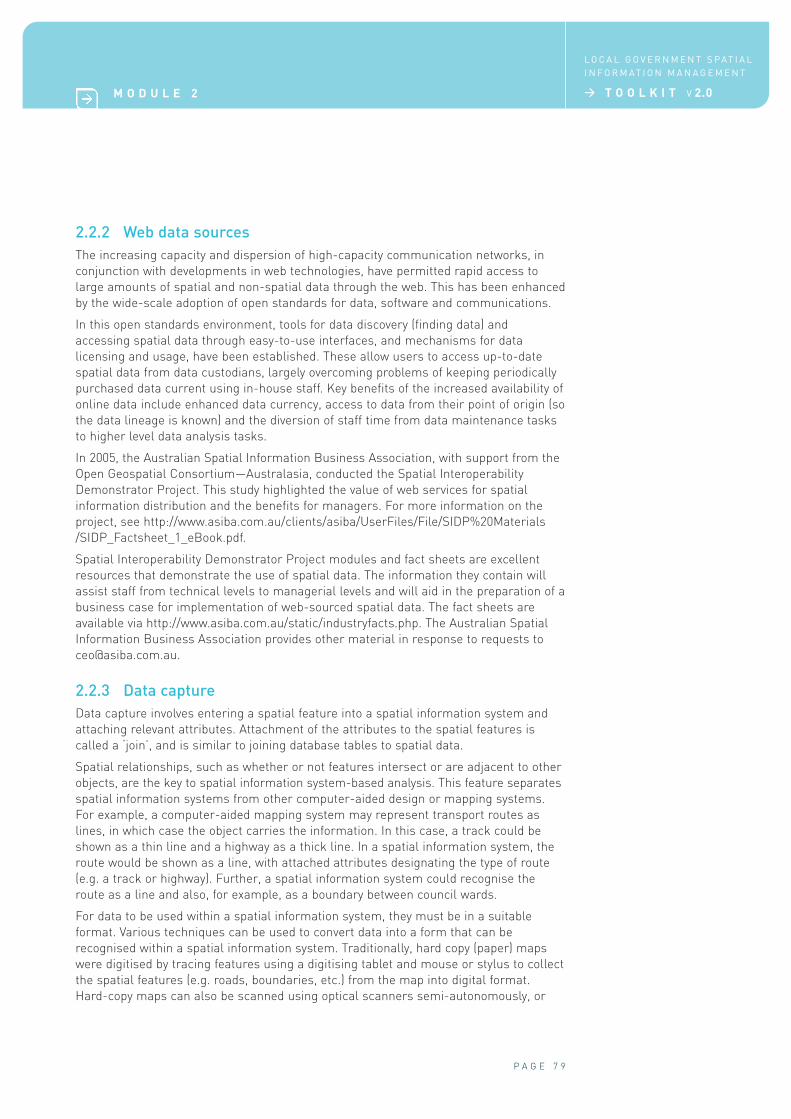
Similarly, census or other tabular data (such as traffic data or data for a stream
gauging station) can be integrated into a spatial information system and displayed as
map data by joining the tabular data to the spatial data using unique identifiers (see
Figures 2.13 and 2.14 for examples). This enables many of the data resources of an
organisation to be represented visually in map form and can help leverage the value of
the information and enhance decision support.
8 Satellite receiving stations often have their own formats in which they receive and transfer data. For example, the AustralianCentre for Remote Sensing (ACRES) has a specific format for Landsat 7 Thematic Mapper imagery known as TM Landsat-7Fast-L7A ACRES. Imagery supplied in this format can be imported to enable it to be displayed and used for analysis.
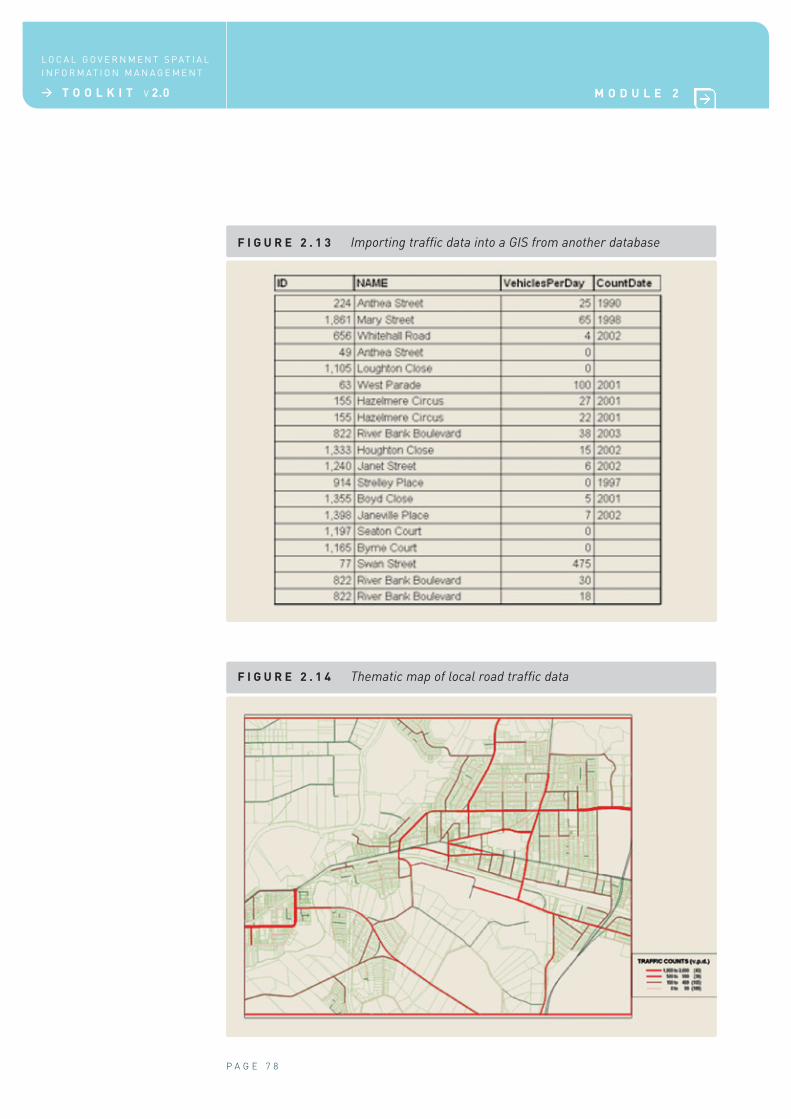
F I G U R E 2 . 1 3 Importing traffic data into a GIS from another database
P A G E 7 8
L O C A L G O V E R N M E N T S P AT I A L
I N F O R M AT I O N M A N A G E M E N T
> T O O L K I T V 2.0 M O D U L E 2
F I G U R E 2 . 1 4 Thematic map of local road traffic data
2.2.2 Web data sources
The increasing capacity and dispersion of high-capacity communication networks, in
conjunction with developments in web technologies, have permitted rapid access to
large amounts of spatial and non-spatial data through the web. This has been enhanced
by the wide-scale adoption of open standards for data, software and communications.
In this open standards environment, tools for data discovery (finding data) and
accessing spatial data through easy-to-use interfaces, and mechanisms for data
licensing and usage, have been established. These allow users to access up-to-date
spatial data from data custodians, largely overcoming problems of keeping periodically
purchased data current using in-house staff. Key benefits of the increased availability of
online data include enhanced data currency, access to data from their point of origin (so
the data lineage is known) and the diversion of staff time from data maintenance tasks
to higher level data analysis tasks.
In 2005, the Australian Spatial Information Business Association, with support from the
Open Geospatial Consortium—Australasia, conducted the Spatial Interoperability
Demonstrator Project. This study highlighted the value of web services for spatial
information distribution and the benefits for managers. For more information on the
project, see http://www.asiba.com.au/clients/asiba/UserFiles/File/SIDP%20Materials
/SIDP_Factsheet_1_eBook.pdf.
Spatial Interoperability Demonstrator Project modules and fact sheets are excellent
resources that demonstrate the use of spatial data. The information they contain will
assist staff from technical levels to managerial levels and will aid in the preparation of a
business case for implementation of web-sourced spatial data. The fact sheets are
available via http://www.asiba.com.au/static/industryfacts.php. The Australian Spatial
Information Business Association provides other material in response to requests to
2.2.3 Data capture
Data capture involves entering a spatial feature into a spatial information system and
attaching relevant attributes. Attachment of the attributes to the spatial features is
called a ‘join’, and is similar to joining database tables to spatial data.
Spatial relationships, such as whether or not features intersect or are adjacent to other
objects, are the key to spatial information system-based analysis. This feature separates
spatial information systems from other computer-aided design or mapping systems.
For example, a computer-aided mapping system may represent transport routes as
lines, in which case the object carries the information. In this case, a track could be
shown as a thin line and a highway as a thick line. In a spatial information system, the
route would be shown as a line, with attached attributes designating the type of route
(e.g. a track or highway). Further, a spatial information system could recognise the
route as a line and also, for example, as a boundary between council wards.
For data to be used within a spatial information system, they must be in a suitable
format. Various techniques can be used to convert data into a form that can be
recognised within a spatial information system. Traditionally, hard copy (paper) maps
were digitised by tracing features using a digitising tablet and mouse or stylus to collect
the spatial features (e.g. roads, boundaries, etc.) from the map into digital format.
Hard-copy maps can also be scanned using optical scanners semi-autonomously, or
P A G E 7 9
M O D U L E 2
L O C A L G O V E R N M E N T S P AT I A L
I N F O R M AT I O N M A N A G E M E N T
> T O O L K I T V 2.0
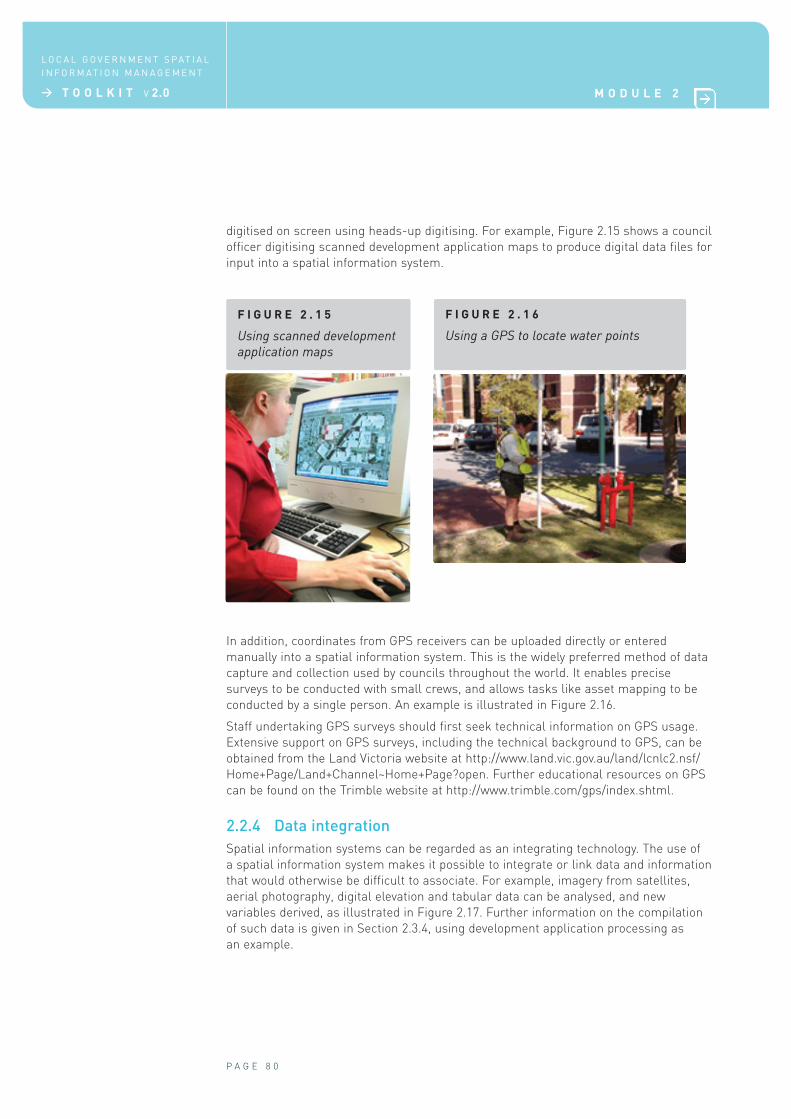
digitised on screen using heads-up digitising. For example, Figure 2.15 shows a council
officer digitising scanned development application maps to produce digital data files for
input into a spatial information system.
F I G U R E 2 . 1 5
Using scanned development
application maps
P A G E 8 0
L O C A L G O V E R N M E N T S P AT I A L
I N F O R M AT I O N M A N A G E M E N T
> T O O L K I T V 2.0 M O D U L E 2
In addition, coordinates from GPS receivers can be uploaded directly or entered
manually into a spatial information system. This is the widely preferred method of data
capture and collection used by councils throughout the world. It enables precise
surveys to be conducted with small crews, and allows tasks like asset mapping to be
conducted by a single person. An example is illustrated in Figure 2.16.
Staff undertaking GPS surveys should first seek technical information on GPS usage.
Extensive support on GPS surveys, including the technical background to GPS, can be
obtained from the Land Victoria website at http://www.land.vic.gov.au/land/lcnlc2.nsf/
Home+Page/Land+Channel~Home+Page?open. Further educational resources on GPS
can be found on the Trimble website at http://www.trimble.com/gps/index.shtml.
2.2.4 Data integration
Spatial information systems can be regarded as an integrating technology. The use of
a spatial information system makes it possible to integrate or link data and information
that would otherwise be difficult to associate. For example, imagery from satellites,
aerial photography, digital elevation and tabular data can be analysed, and new
variables derived, as illustrated in Figure 2.17. Further information on the compilation
of such data is given in Section 2.3.4, using development application processing as
an example.
F I G U R E 2 . 1 6
Using a GPS to locate water points
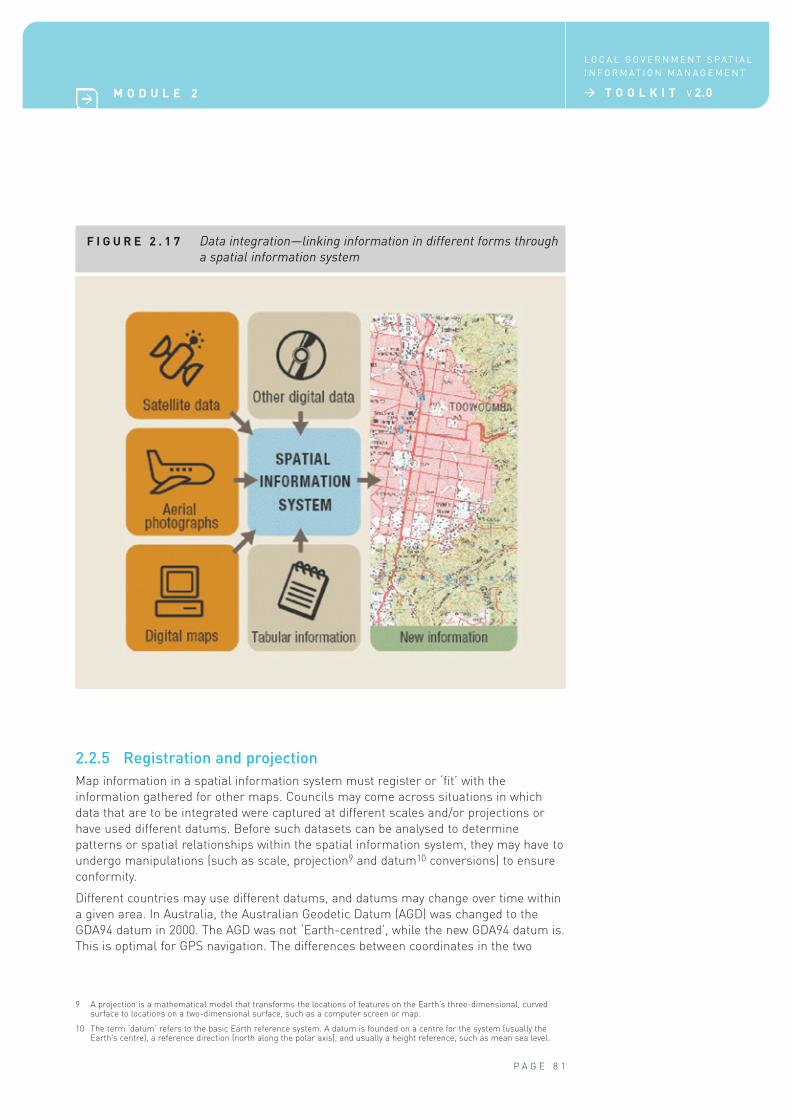
F I G U R E 2 . 1 7 Data integration—linking information in different forms through
a spatial information system
P A G E 8 1
M O D U L E 2
L O C A L G O V E R N M E N T S P AT I A L
I N F O R M AT I O N M A N A G E M E N T
> T O O L K I T V 2.0
2.2.5 Registration and projection
Map information in a spatial information system must register or ‘fit’ with the
information gathered for other maps. Councils may come across situations in which
data that are to be integrated were captured at different scales and/or projections or
have used different datums. Before such datasets can be analysed to determine
patterns or spatial relationships within the spatial information system, they may have to
undergo manipulations (such as scale, projection9 and datum10 conversions) to ensure
conformity.
Different countries may use different datums, and datums may change over time within
a given area. In Australia, the Australian Geodetic Datum (AGD) was changed to the
GDA94 datum in 2000. The AGD was not ‘Earth-centred’, while the new GDA94 datum is.
This is optimal for GPS navigation. The differences between coordinates in the two
9 A projection is a mathematical model that transforms the locations of features on the Earth’s three-dimensional, curvedsurface to locations on a two-dimensional surface, such as a computer screen or map.
10 The term ‘datum’ refers to the basic Earth reference system. A datum is founded on a centre for the system (usually theEarth’s centre), a reference direction (north along the polar axis), and usually a height reference, such as mean sea level.

datums vary across Australia, and can be up 200 metres in a north-easterly direction. It
is important to note that this is not an error, but that errors could result if data sourced
from the two datums are combined without the appropriate transformations. Important
information about the datums used in Australia can be found on the Geoscience
Australia website at http://www.ga.gov.au/geodesy/datums/.
Datum information and the lineage of the spatial data should be recorded in the
metadata document. Datum conflicts can cause errors.
Some cities and towns may use local grids and datums. For example, Perth in Western
Australia uses the Perth Coastal Grid (for more information, see
http://www.landgate.wa.gov.au/docvault.nsf/web/SPM_DLI_APPENDIX5/$FILE/SPM_DLI
_APPENDIX5.pdf).
Projections are an essential component when making maps and undertaking spatial
analysis. It should be noted that different projections are used for different purposes.
Some preserve shape (conformality); others preserve the area, distance or direction. A
map projection can preserve some of these characteristics, but not all. Datasets in
different projections can be transformed into a common projection.
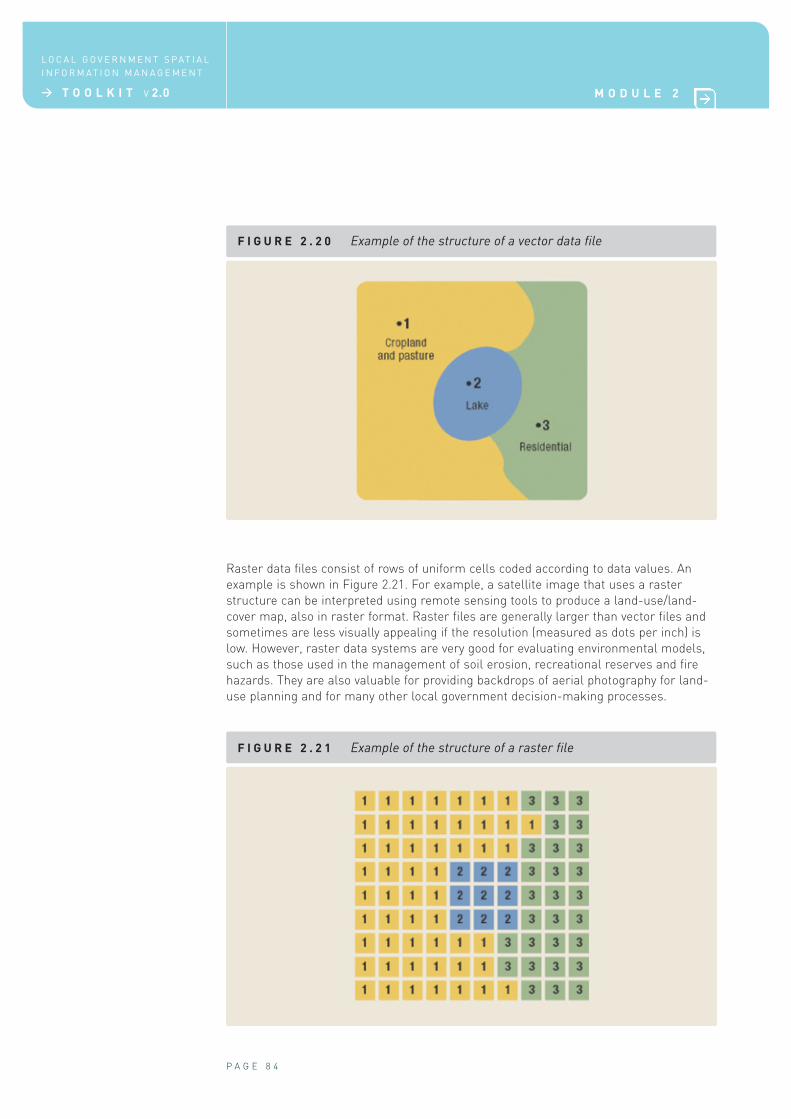
Figure 2.18 shows the results of importing an outline development plan file from a non-
geographically referenced computer-assisted design (CAD) package—the imported data
do not register with the cadastre. In Figure 2.19, the imported file is registered against
known geographical references and is now geographically correct.
A useful resource on map projections may be found on the Geoscience Australia
website at http://www.ga.gov.au/geodesy/datums/aboutdatums.jsp#Projections.
The most commonly applied projection in Australia is the Map Grid of Australia, which
is a transverse Mercator’s projection. This is a conformal projection that preserves
angular relationships between objects. It is useful for areas extending up to 6° (up to
~300 kilometres). For larger areas (e.g. a state or national map), a Lambert’s conic
conformal projection is often used. An azimuthal projection might be used for a very
small area, such as an airport or harbour.
Module 9: Map production guidelines discusses the options for using different projections
depending on the particular local government need.
Aside from ensuring conformity of datum and projection, corrections may be needed
when inputting data into a GIS system, due to surveying errors, poor copying of original
diagrams and other causes. These issues are often faced by local government GIS
specialists, who should establish procedures for ensuring correct registration with
cadastre and other GIS data.
P A G E 8 2
L O C A L G O V E R N M E N T S P AT I A L
I N F O R M AT I O N M A N A G E M E N T
> T O O L K I T V 2.0 M O D U L E 2
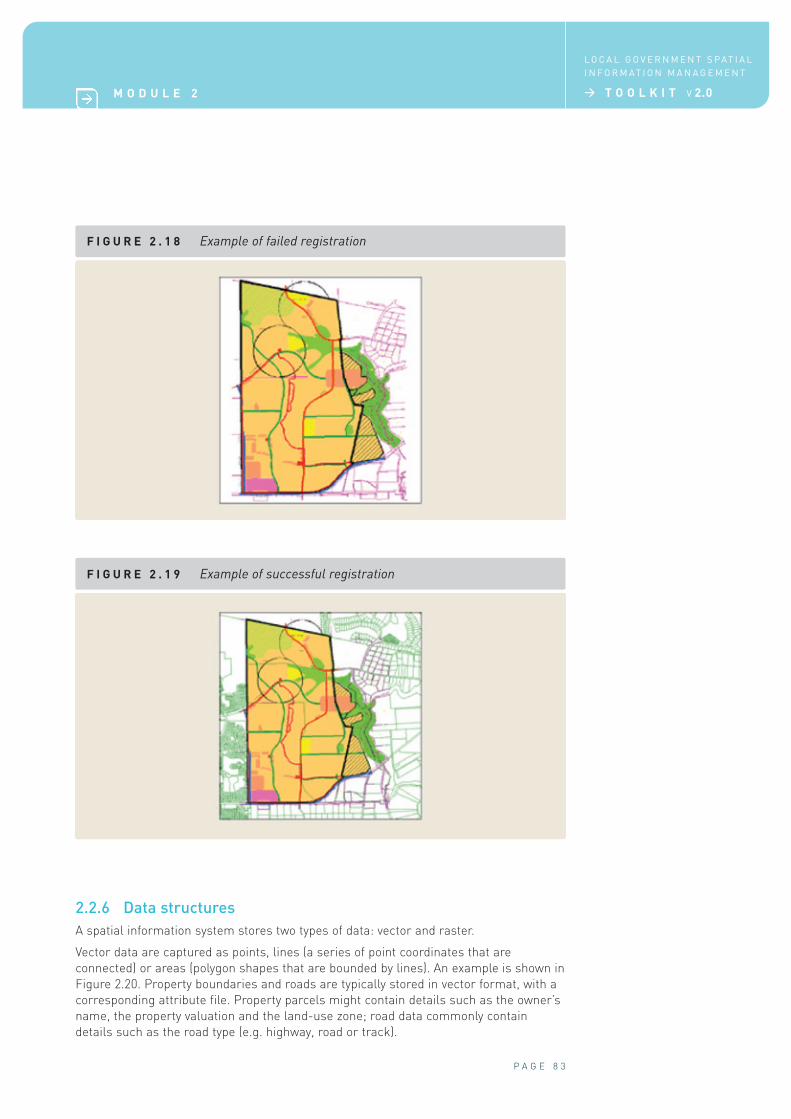
F I G U R E 2 . 1 8 Example of failed registration
P A G E 8 3
M O D U L E 2
L O C A L G O V E R N M E N T S P AT I A L
I N F O R M AT I O N M A N A G E M E N T
> T O O L K I T V 2.0
F I G U R E 2 . 1 9 Example of successful registration
2.2.6 Data structures
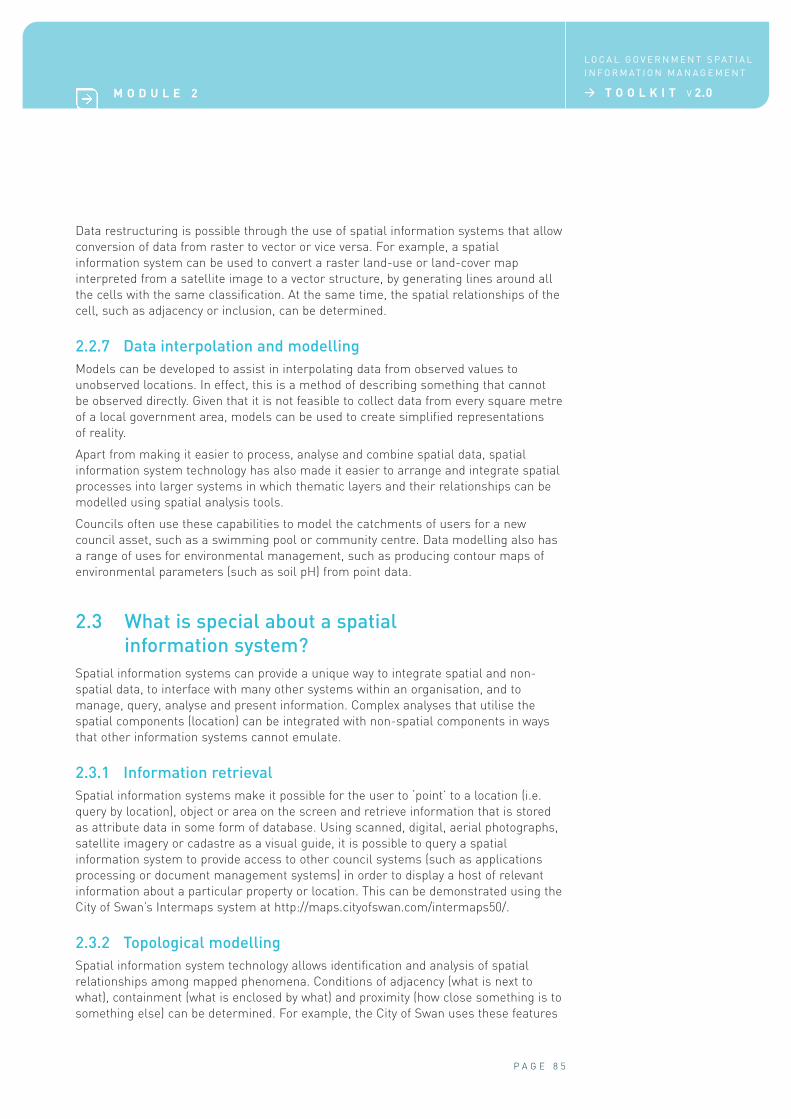
A spatial information system stores two types of data: vector and raster.
Vector data are captured as points, lines (a series of point coordinates that are
connected) or areas (polygon shapes that are bounded by lines). An example is shown in
Figure 2.20. Property boundaries and roads are typically stored in vector format, with a
corresponding attribute file. Property parcels might contain details such as the owner’s
name, the property valuation and the land-use zone; road data commonly contain
details such as the road type (e.g. highway, road or track).
F I G U R E 2 . 2 0 Example of the structure of a vector data file
P A G E 8 4
L O C A L G O V E R N M E N T S P AT I A L
I N F O R M AT I O N M A N A G E M E N T
> T O O L K I T V 2.0 M O D U L E 2
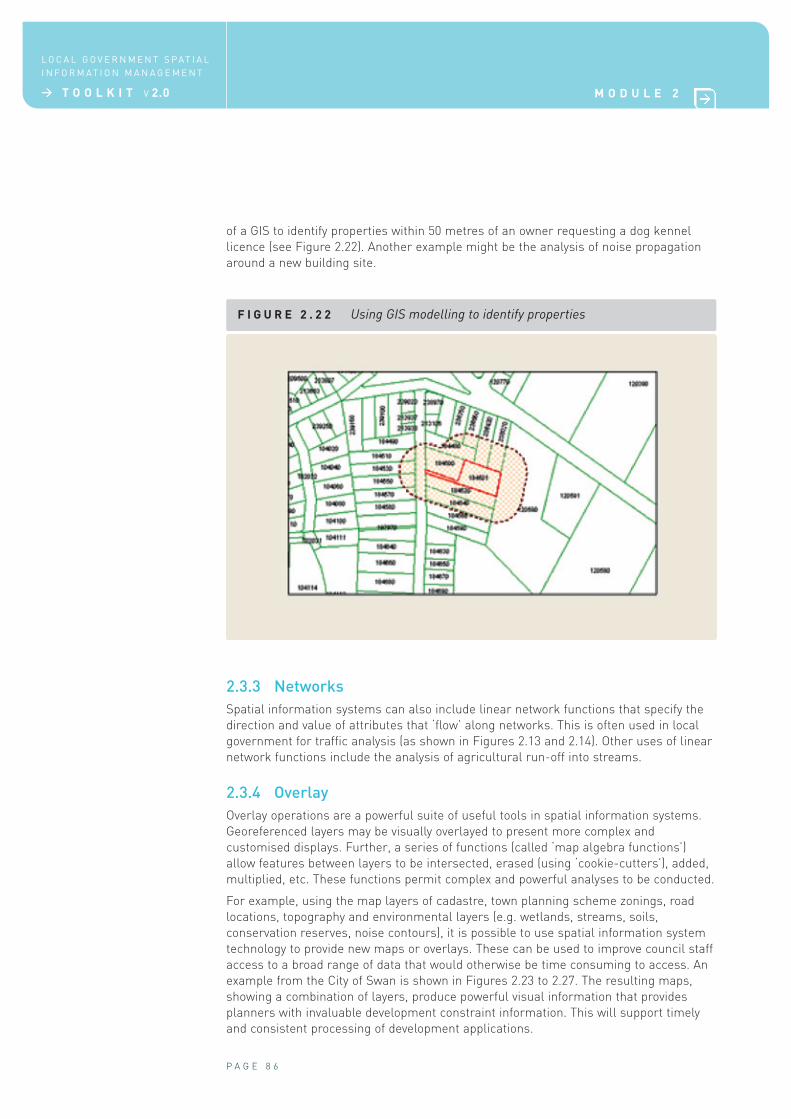
Raster data files consist of rows of uniform cells coded according to data values. An
example is shown in Figure 2.21. For example, a satellite image that uses a raster
structure can be interpreted using remote sensing tools to produce a land-use/land-
cover map, also in raster format. Raster files are generally larger than vector files and
sometimes are less visually appealing if the resolution (measured as dots per inch) is
low. However, raster data systems are very good for evaluating environmental models,
such as those used in the management of soil erosion, recreational reserves and fire
hazards. They are also valuable for providing backdrops of aerial photography for land-
use planning and for many other local government decision-making processes.
F I G U R E 2 . 2 1 Example of the structure of a raster file
Data restructuring is possible through the use of spatial information systems that allow
conversion of data from raster to vector or vice versa. For example, a spatial
information system can be used to convert a raster land-use or land-cover map
interpreted from a satellite image to a vector structure, by generating lines around all
the cells with the same classification. At the same time, the spatial relationships of the
cell, such as adjacency or inclusion, can be determined.
2.2.7 Data interpolation and modelling
Models can be developed to assist in interpolating data from observed values to
unobserved locations. In effect, this is a method of describing something that cannot
be observed directly. Given that it is not feasible to collect data from every square metre
of a local government area, models can be used to create simplified representations
of reality.
Apart from making it easier to process, analyse and combine spatial data, spatial
information system technology has also made it easier to arrange and integrate spatial
processes into larger systems in which thematic layers and their relationships can be
modelled using spatial analysis tools.
Councils often use these capabilities to model the catchments of users for a new
council asset, such as a swimming pool or community centre. Data modelling also has
a range of uses for environmental management, such as producing contour maps of
environmental parameters (such as soil pH) from point data.
2.3 What is special about a spatial
information system?
Spatial information systems can provide a unique way to integrate spatial and non-
spatial data, to interface with many other systems within an organisation, and to
manage, query, analyse and present information. Complex analyses that utilise the
spatial components (location) can be integrated with non-spatial components in ways
that other information systems cannot emulate.
2.3.1 Information retrieval
Spatial information systems make it possible for the user to ‘point’ to a location (i.e.
query by location), object or area on the screen and retrieve information that is stored
as attribute data in some form of database. Using scanned, digital, aerial photographs,
satellite imagery or cadastre as a visual guide, it is possible to query a spatial
information system to provide access to other council systems (such as applications
processing or document management systems) in order to display a host of relevant
information about a particular property or location. This can be demonstrated using the
City of Swan’s Intermaps system at http://maps.cityofswan.com/intermaps50/.
2.3.2 Topological modelling
Spatial information system technology allows identification and analysis of spatial
relationships among mapped phenomena. Conditions of adjacency (what is next to
what), containment (what is enclosed by what) and proximity (how close something is to
something else) can be determined. For example, the City of Swan uses these features
P A G E 8 5
M O D U L E 2
L O C A L G O V E R N M E N T S P AT I A L
I N F O R M AT I O N M A N A G E M E N T
> T O O L K I T V 2.0
of a GIS to identify properties within 50 metres of an owner requesting a dog kennel
licence (see Figure 2.22). Another example might be the analysis of noise propagation
around a new building site.
F I G U R E 2 . 2 2 Using GIS modelling to identify properties
P A G E 8 6
L O C A L G O V E R N M E N T S P AT I A L
I N F O R M AT I O N M A N A G E M E N T
> T O O L K I T V 2.0 M O D U L E 2
2.3.3 Networks
Spatial information systems can also include linear network functions that specify the
direction and value of attributes that ‘flow’ along networks. This is often used in local
government for traffic analysis (as shown in Figures 2.13 and 2.14). Other uses of linear
network functions include the analysis of agricultural run-off into streams.
2.3.4 Overlay
Overlay operations are a powerful suite of useful tools in spatial information systems.
Georeferenced layers may be visually overlayed to present more complex and
customised displays. Further, a series of functions (called ‘map algebra functions’)
allow features between layers to be intersected, erased (using ‘cookie-cutters’), added,
multiplied, etc. These functions permit complex and powerful analyses to be conducted.
For example, using the map layers of cadastre, town planning scheme zonings, road
locations, topography and environmental layers (e.g. wetlands, streams, soils,
conservation reserves, noise contours), it is possible to use spatial information system
technology to provide new maps or overlays. These can be used to improve council staff
access to a broad range of data that would otherwise be time consuming to access. An
example from the City of Swan is shown in Figures 2.23 to 2.27. The resulting maps,
showing a combination of layers, produce powerful visual information that provides
planners with invaluable development constraint information. This will support timely
and consistent processing of development applications.
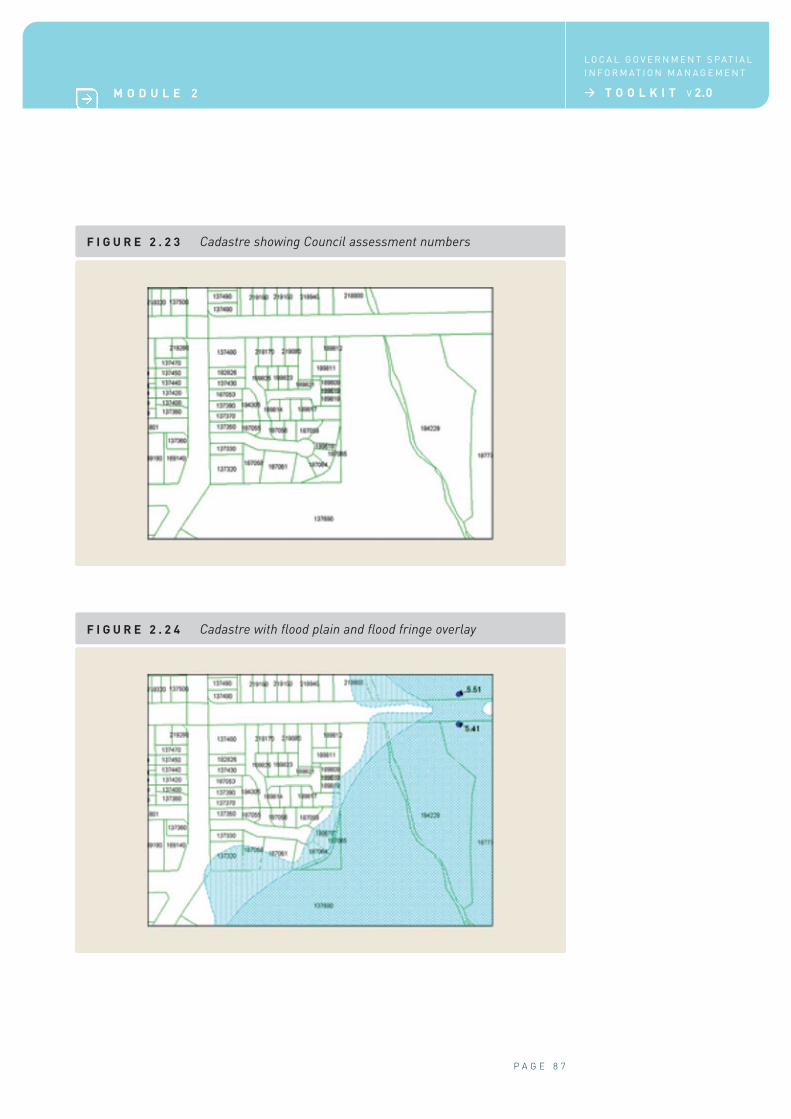
F I G U R E 2 . 2 3 Cadastre showing Council assessment numbers
P A G E 8 7
M O D U L E 2
L O C A L G O V E R N M E N T S P AT I A L
I N F O R M AT I O N M A N A G E M E N T
> T O O L K I T V 2.0
F I G U R E 2 . 2 4 Cadastre with flood plain and flood fringe overlay
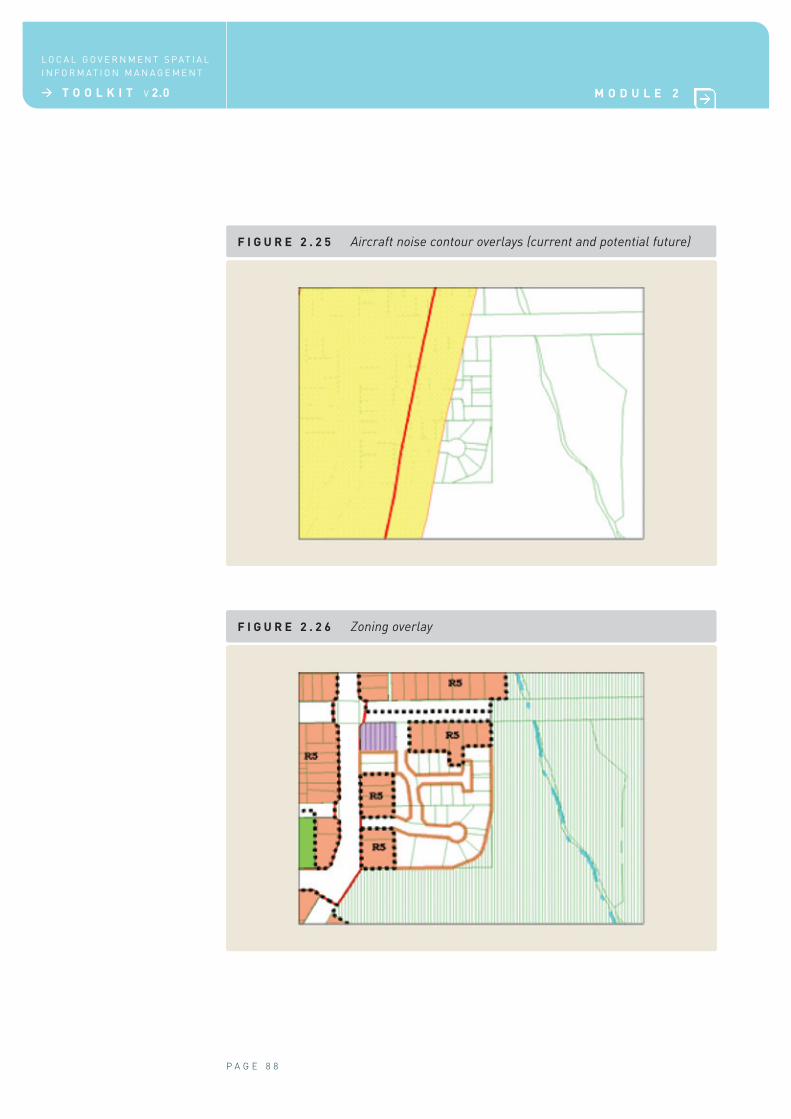
F I G U R E 2 . 2 5 Aircraft noise contour overlays (current and potential future)
P A G E 8 8
L O C A L G O V E R N M E N T S P AT I A L
I N F O R M AT I O N M A N A G E M E N T
> T O O L K I T V 2.0 M O D U L E 2
F I G U R E 2 . 2 6 Zoning overlay
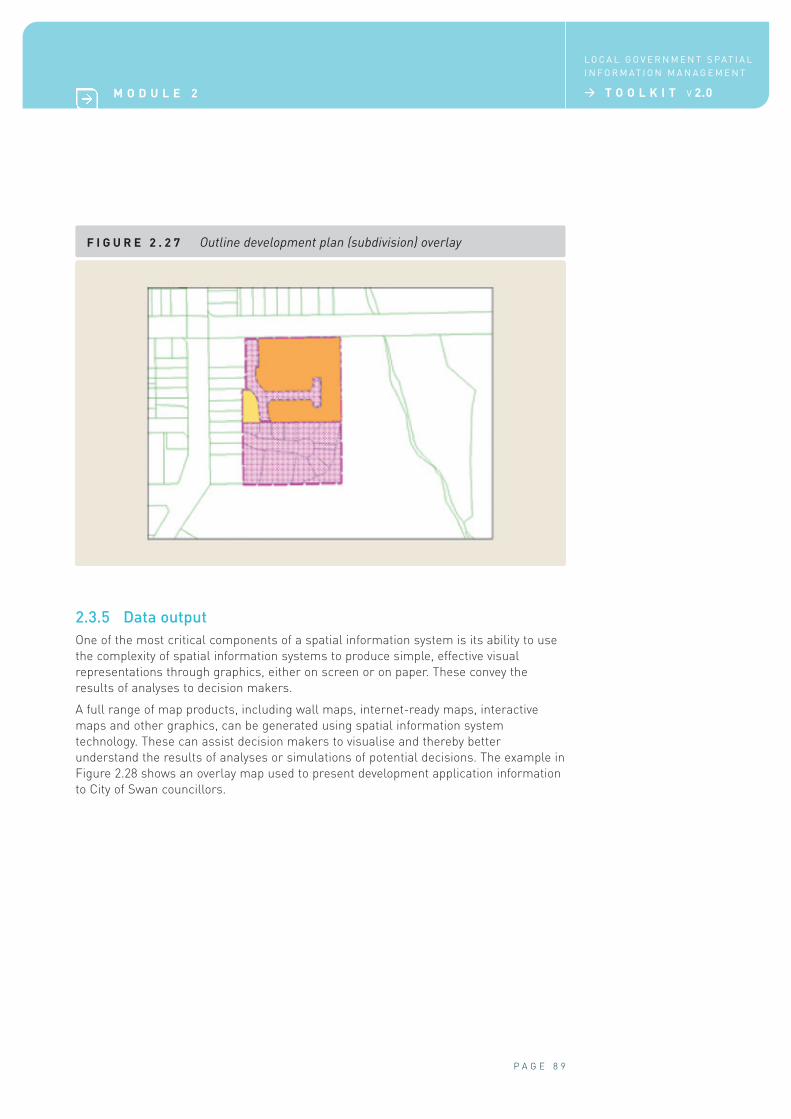
2.3.5 Data output
One of the most critical components of a spatial information system is its ability to use
the complexity of spatial information systems to produce simple, effective visual
representations through graphics, either on screen or on paper. These convey the
results of analyses to decision makers.
A full range of map products, including wall maps, internet-ready maps, interactive
maps and other graphics, can be generated using spatial information system
technology. These can assist decision makers to visualise and thereby better
understand the results of analyses or simulations of potential decisions. The example in
Figure 2.28 shows an overlay map used to present development application information
to City of Swan councillors.
P A G E 8 9
M O D U L E 2
L O C A L G O V E R N M E N T S P AT I A L
I N F O R M AT I O N M A N A G E M E N T
> T O O L K I T V 2.0
F I G U R E 2 . 2 7 Outline development plan (subdivision) overlay
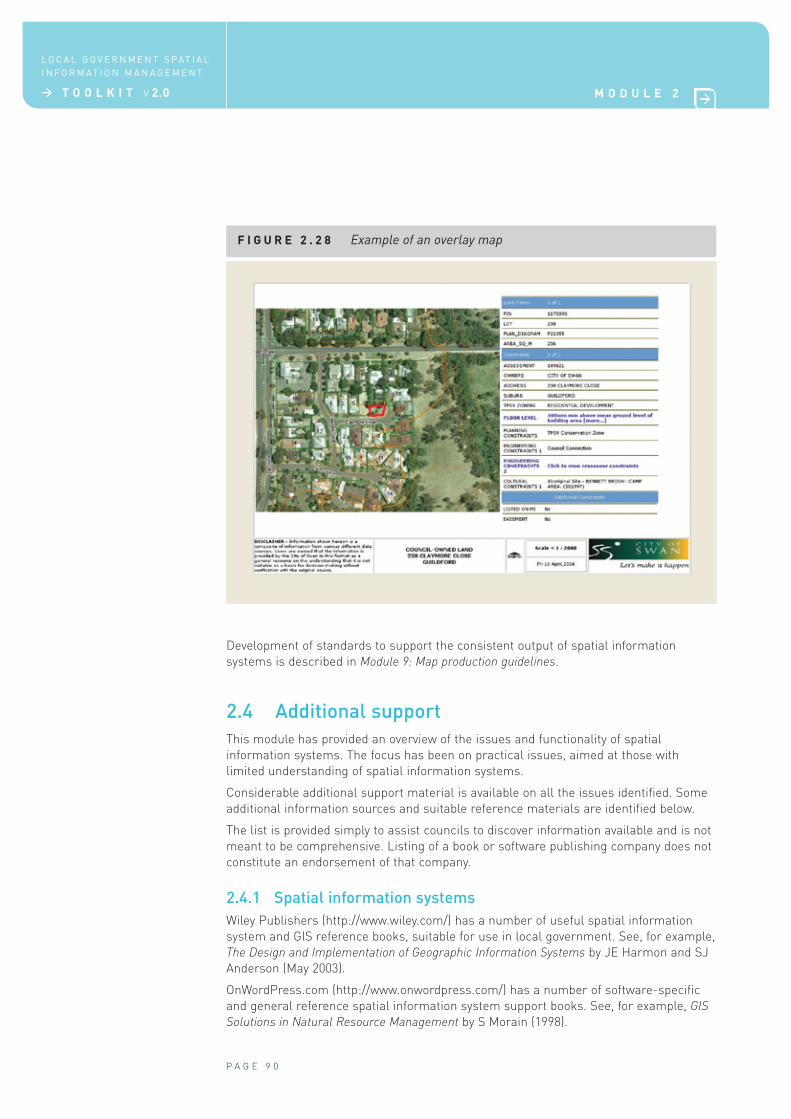
F I G U R E 2 . 2 8 Example of an overlay map
P A G E 9 0
L O C A L G O V E R N M E N T S P AT I A L
I N F O R M AT I O N M A N A G E M E N T
> T O O L K I T V 2.0 M O D U L E 2
Development of standards to support the consistent output of spatial information
systems is described in Module 9: Map production guidelines.
2.4 Additional support
This module has provided an overview of the issues and functionality of spatial
information systems. The focus has been on practical issues, aimed at those with
limited understanding of spatial information systems.
Considerable additional support material is available on all the issues identified. Some
additional information sources and suitable reference materials are identified below.
The list is provided simply to assist councils to discover information available and is not
meant to be comprehensive. Listing of a book or software publishing company does not
constitute an endorsement of that company.
2.4.1 Spatial information systems
Wiley Publishers (http://www.wiley.com/) has a number of useful spatial information
system and GIS reference books, suitable for use in local government. See, for example,
The Design and Implementation of Geographic Information Systems by JE Harmon and SJ
Anderson (May 2003).
OnWordPress.com (http://www.onwordpress.com/) has a number of software-specific
and general reference spatial information system support books. See, for example, GIS
Solutions in Natural Resource Management by S Morain (1998).
Other appropriate titles can be discovered by entering GIS in the product search pages
of many online publishers and booksellers.
There are also a number of online newsletter-type services specialising in spatial
information system (and GIS) activities, including:
> Geocommunity: http://spatialnews.geocomm.com
> GIS Café: http://www01.giscafe.com/
> Directions Magazine: http://www.directionsmag.com/.
Many software vendors also publish reference material and newsletters. Some online
bookstores maintained by software vendors can be found at:
> MapInfo: http://www.mapinfo.com.au/
> Intergraph: http://www.intergraph.com/au
> ESRI: http://www.esriau.com.au/products/pages/publications.
2.4.2 Global positioning systems
Comprehensive support on the managerial and technical aspects of using GPS is
available via the Land Victoria website at http://www.land.vic.gov.au/surveying. Some
useful documents available from the site include:
> Reliable and Repeatable Positioning using the Global Positioning System, at
http://www.land.vic.gov.au/land/lcnlc2.nsf/alltitle/professions-geodesy-
reference+library-Reliable+and+RepeatableTable+Positioning+using+the+GPS
> GPS—A Guide For Users http://www.land.vic.gov.au/land/lcnlc2.nsf/childdocs/-418EED
712A81C5AE4A256A0A0015CDC1-5DF1E2E5B878F6634A256A0A001DAC5C-0887F847
B6D2DA16CA256E5F0013CBB8-254DE472A3EA6625CA256F560019D1B5?open
> The Australian Global Positioning Systems Society Inc. also provides information on
GPS at http://www.gps-society.org/index.html.
Acronyms
ACRES Australian Centre for Remote Sensing
ADAC Asset Design and As Constructed
AGD Australian Geodetic Datum
ALGA Australian Local Government Association
ANZLIC ANZLIC—the Spatial Information Council for Australia and New Zealand
ASDD Australian Spatial Data Directory
ASDI Australian Spatial Data Infrastructure
AS/NZS Australian Standard/New Zealand Standard
CAD computer assisted design, computer-aided drafting
CPU central processing unit
DSDB detail survey database
GDA94 Geocentric Datum of Australia 1994
GIS geographic information systems
P A G E 9 1
M O D U L E 2
L O C A L G O V E R N M E N T S P AT I A L
I N F O R M AT I O N M A N A G E M E N T
> T O O L K I T V 2.0

GML Geography Markup Language, Generalised Markup Language
GPS global positioning system
GSDI Global Spatial Data Infrastructure
GUI graphical user interface
HTTP Hypertext Transfer Protocol
ICT information and communications technology
INCIS Integrated National Crime Information System (New Zealand)
ISO International Organization for Standardization
IT information technology
MGA Map Grid of Australia
OGC Open Geospatial Consortium
OGC-A Open Geospatial Consortium—Australasia
PRINCE Projects IN Controlled Environments
RCSC Regional Collaboration Steering Committee (Queensland)
RFP Request for Proposal
RIP raster image processor
ROC regional organisation of councils
SDE spatial database engine
SDI spatial data infrastructure
SEQ south east Queensland
SIDP Spatial Interoperability Demonstrator Project
SLIP Shared Land Information Platform (Western Australia)
SOAP Simple Object Access Protocol
URL Uniform Resource Locator (website address)
VROC voluntary regional organisation of councils
WALIS Western Australian Land Information System
W3C World Wide Web Consortium
XML Extensible Markup Language
N O T E : A list of several online spatial information system, GIS, cartographic, data and IT
glossaries and dictionaries is provided at http://www.gis.com/whatisgis/glossaries.html.
An additional online glossary for definitions of many current IT-related words is
available at http://whatis.techtarget.com/.
P A G E 9 2
L O C A L G O V E R N M E N T S P AT I A L
I N F O R M AT I O N M A N A G E M E N T
> T O O L K I T V 2.0 M O D U L E 2