Embed Size (px)
Citation preview
Local government entities: 2017–18 results of financial audits Report 18: 2018–19
15 May 2019
The Honourable C Pitt MP Speaker of the Legislative Assembly Parliament House BRISBANE QLD 4000 Dear Speaker
Report to parliament
This report is prepared under Part 3 Division 3 of the Auditor-General Act 2009, and is titled Local government entities: 2017–18 results of financial audits (Report 18: 2018–19).
In accordance with s.67 of the Act, would you please arrange for the report to be tabled in the Legislative Assembly.
Yours sincerely
Brendan Worrall Auditor-General
Local government entities: 2017–18 results of financial audits (Report 18: 2018–19)
Contents Summary 1
1. Sector overview 11
2. Results of our audits 12
3. Financial performance, position, and sustainability 25
4. Internal controls 43
Appendices 52
A. Full responses from entities 53 B. Queensland local governments by category 57 C. Legislative context 59 D. Our audit opinions 61 E. Entities exempt from audit by the Auditor-General 68 F. Local government entities for which we will not issue opinions 69 G. Audit opinions issued for prior financial years 71 H. Financial sustainability measures 72 I. Our assessment of councils’ financial governance 81 J. Glossary 92
Local government entities: 2017–18 results of financial audits (Report 18: 2018–19)
1
Summary
This report summarises the financial audit results of the 77 Queensland local governments (councils) for the financial year ending 30 June 2018. It also summarises the financial audit results of the 83 entities they control that produced financial statements.
Councils vary widely in their size and location and in the broad range of community services they provide. To enable like-for-like comparisons, we use the six segments identified by the Local Government Association of Queensland: Coastal, Indigenous, Resources, Rural/Regional, Rural/Remote, and South East Queensland (SEQ) councils.
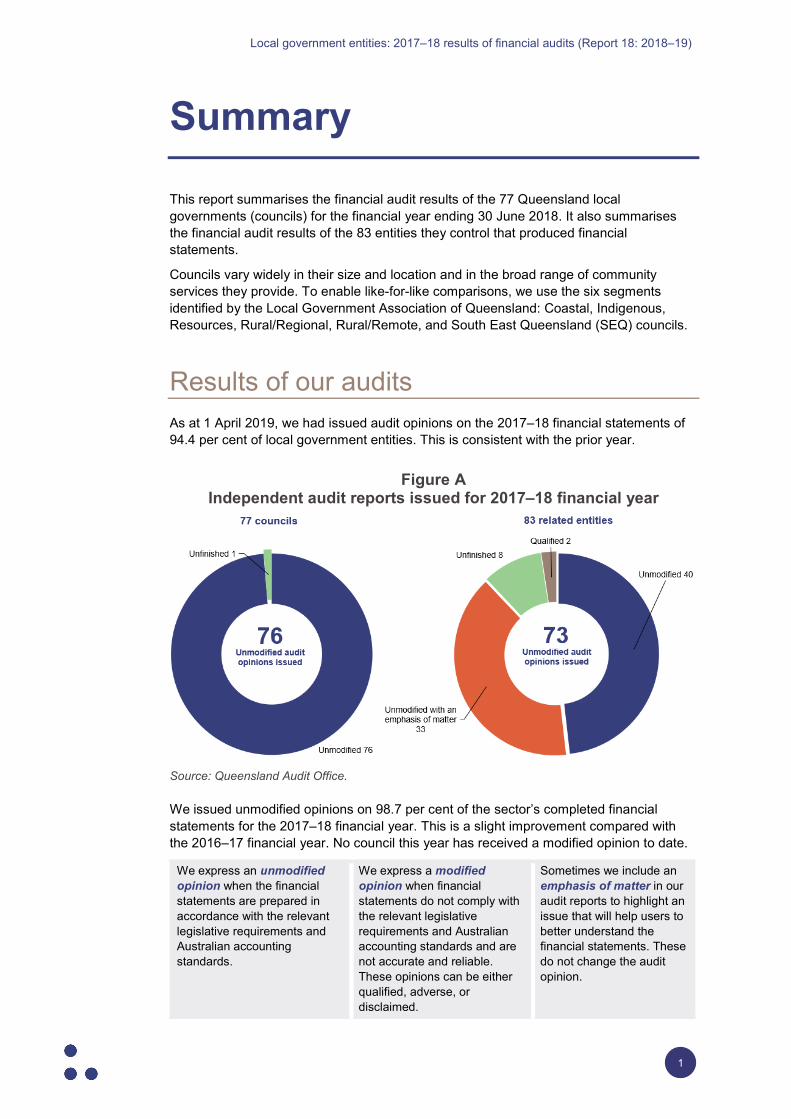
Results of our audits As at 1 April 2019, we had issued audit opinions on the 2017–18 financial statements of 94.4 per cent of local government entities. This is consistent with the prior year.
Figure A Independent audit reports issued for 2017–18 financial year
Source: Queensland Audit Office.
We issued unmodified opinions on 98.7 per cent of the sector’s completed financial statements for the 2017–18 financial year. This is a slight improvement compared with the 2016–17 financial year. No council this year has received a modified opinion to date.
We express an unmodified opinion when the financial statements are prepared in accordance with the relevant legislative requirements and Australian accounting standards.
We express a modified opinion when financial statements do not comply with the relevant legislative requirements and Australian accounting standards and are not accurate and reliable. These opinions can be either qualified, adverse, or disclaimed.
Sometimes we include an emphasis of matter in our audit reports to highlight an issue that will help users to better understand the financial statements. These do not change the audit opinion.
Local government entities: 2017–18 results of financial audits (Report 18: 2018–19)
2
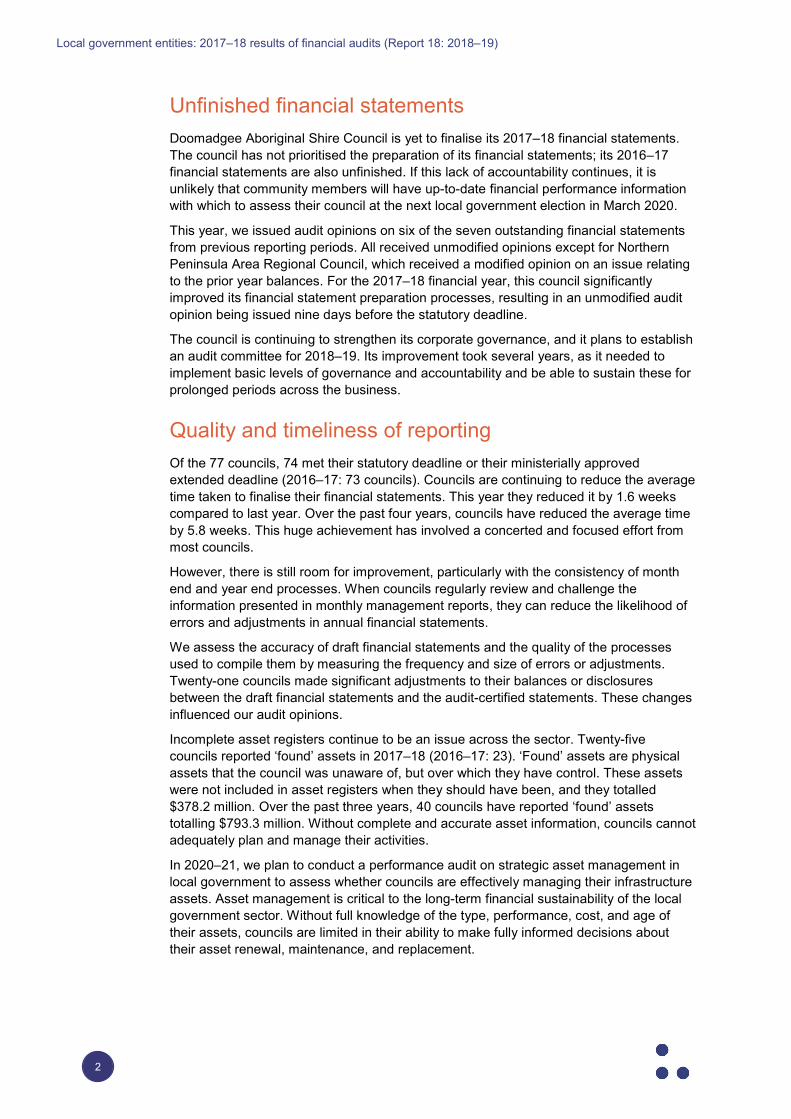
Unfinished financial statements Doomadgee Aboriginal Shire Council is yet to finalise its 2017–18 financial statements. The council has not prioritised the preparation of its financial statements; its 2016–17 financial statements are also unfinished. If this lack of accountability continues, it is unlikely that community members will have up-to-date financial performance information with which to assess their council at the next local government election in March 2020.
This year, we issued audit opinions on six of the seven outstanding financial statements from previous reporting periods. All received unmodified opinions except for Northern Peninsula Area Regional Council, which received a modified opinion on an issue relating to the prior year balances. For the 2017–18 financial year, this council significantly improved its financial statement preparation processes, resulting in an unmodified audit opinion being issued nine days before the statutory deadline.
The council is continuing to strengthen its corporate governance, and it plans to establish an audit committee for 2018–19. Its improvement took several years, as it needed to implement basic levels of governance and accountability and be able to sustain these for prolonged periods across the business.
Quality and timeliness of reporting Of the 77 councils, 74 met their statutory deadline or their ministerially approved extended deadline (2016–17: 73 councils). Councils are continuing to reduce the average time taken to finalise their financial statements. This year they reduced it by 1.6 weeks compared to last year. Over the past four years, councils have reduced the average time by 5.8 weeks. This huge achievement has involved a concerted and focused effort from most councils.
However, there is still room for improvement, particularly with the consistency of month end and year end processes. When councils regularly review and challenge the information presented in monthly management reports, they can reduce the likelihood of errors and adjustments in annual financial statements.
We assess the accuracy of draft financial statements and the quality of the processes used to compile them by measuring the frequency and size of errors or adjustments. Twenty-one councils made significant adjustments to their balances or disclosures between the draft financial statements and the audit-certified statements. These changes influenced our audit opinions.
Incomplete asset registers continue to be an issue across the sector. Twenty-five councils reported ‘found’ assets in 2017–18 (2016–17: 23). ‘Found’ assets are physical assets that the council was unaware of, but over which they have control. These assets were not included in asset registers when they should have been, and they totalled $378.2 million. Over the past three years, 40 councils have reported ‘found’ assets totalling $793.3 million. Without complete and accurate asset information, councils cannot adequately plan and manage their activities.
In 2020–21, we plan to conduct a performance audit on strategic asset management in local government to assess whether councils are effectively managing their infrastructure assets. Asset management is critical to the long-term financial sustainability of the local government sector. Without full knowledge of the type, performance, cost, and age of their assets, councils are limited in their ability to make fully informed decisions about their asset renewal, maintenance, and replacement.
Local government entities: 2017–18 results of financial audits (Report 18: 2018–19)
3
Financial performance, position, and sustainability
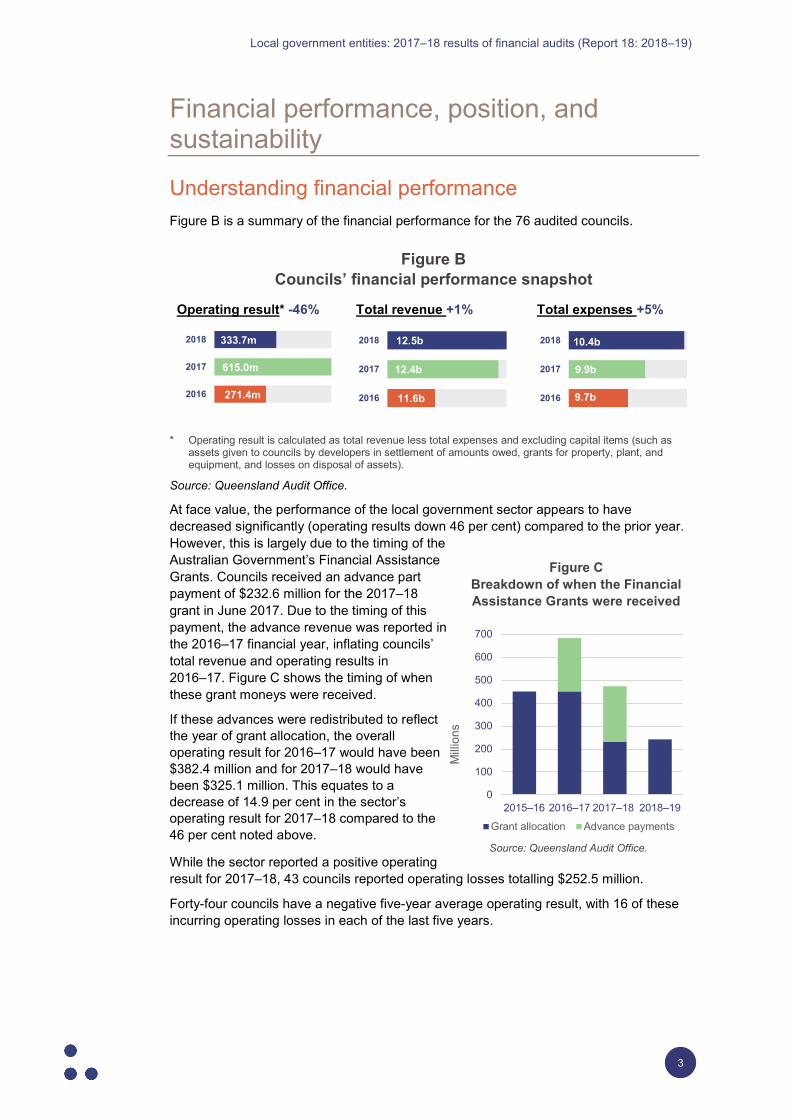
Understanding financial performance Figure B is a summary of the financial performance for the 76 audited councils.
Figure B Councils’ financial performance snapshot
Operating result* -46% Total revenue +1% Total expenses +5%
* Operating result is calculated as total revenue less total expenses and excluding capital items (such as assets given to councils by developers in settlement of amounts owed, grants for property, plant, and equipment, and losses on disposal of assets).
Source: Queensland Audit Office.
At face value, the performance of the local government sector appears to have decreased significantly (operating results down 46 per cent) compared to the prior year. However, this is largely due to the timing of the Australian Government’s Financial Assistance Grants. Councils received an advance part payment of $232.6 million for the 2017–18 grant in June 2017. Due to the timing of this payment, the advance revenue was reported in the 2016–17 financial year, inflating councils’ total revenue and operating results in 2016–17. Figure C shows the timing of when these grant moneys were received.
If these advances were redistributed to reflect the year of grant allocation, the overall operating result for 2016–17 would have been $382.4 million and for 2017–18 would have been $325.1 million. This equates to a decrease of 14.9 per cent in the sector’s operating result for 2017–18 compared to the 46 per cent noted above.
While the sector reported a positive operating result for 2017–18, 43 councils reported operating losses totalling $252.5 million.
Forty-four councils have a negative five-year average operating result, with 16 of these incurring operating losses in each of the last five years.
271.4m
615.0m
333.7m
2016
2017
2018
11.6b
12.4b
12.5b
2016
2017
2018
9.7b
9.9b
10.4b
2016
2017
2018
Milli
ons
Figure C Breakdown of when the Financial Assistance Grants were received
Source: Queensland Audit Office.
0
100
200
300
400
500
600
700
2015–16 2016–17 2017–18 2018–19
Grant allocation Advance payments
Local government entities: 2017–18 results of financial audits (Report 18: 2018–19)
4
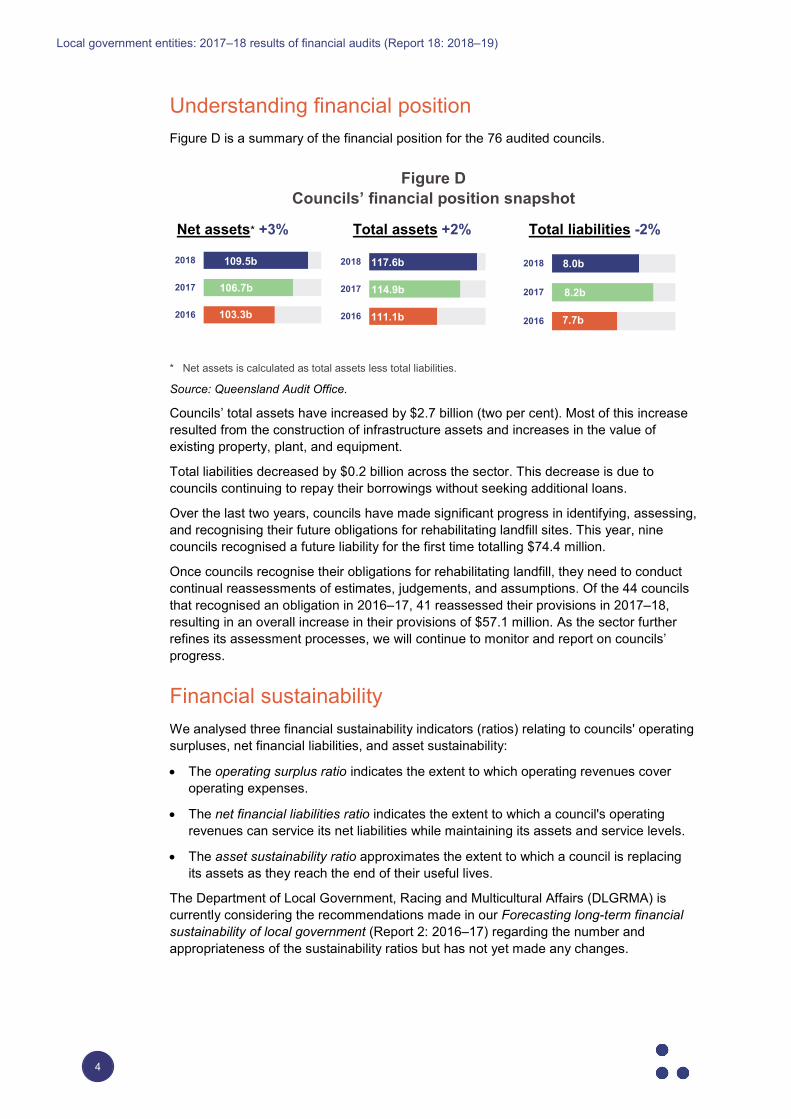
Understanding financial position Figure D is a summary of the financial position for the 76 audited councils.
Figure D Councils’ financial position snapshot
Net assets* +3% Total assets +2% Total liabilities -2%
* Net assets is calculated as total assets less total liabilities.
Source: Queensland Audit Office.
Councils’ total assets have increased by $2.7 billion (two per cent). Most of this increase resulted from the construction of infrastructure assets and increases in the value of existing property, plant, and equipment.
Total liabilities decreased by $0.2 billion across the sector. This decrease is due to councils continuing to repay their borrowings without seeking additional loans.
Over the last two years, councils have made significant progress in identifying, assessing, and recognising their future obligations for rehabilitating landfill sites. This year, nine councils recognised a future liability for the first time totalling $74.4 million.
Once councils recognise their obligations for rehabilitating landfill, they need to conduct continual reassessments of estimates, judgements, and assumptions. Of the 44 councils that recognised an obligation in 2016–17, 41 reassessed their provisions in 2017–18, resulting in an overall increase in their provisions of $57.1 million. As the sector further refines its assessment processes, we will continue to monitor and report on councils’ progress.
Financial sustainability We analysed three financial sustainability indicators (ratios) relating to councils' operating surpluses, net financial liabilities, and asset sustainability:
• The operating surplus ratio indicates the extent to which operating revenues cover operating expenses.
• The net financial liabilities ratio indicates the extent to which a council's operating revenues can service its net liabilities while maintaining its assets and service levels.
• The asset sustainability ratio approximates the extent to which a council is replacing its assets as they reach the end of their useful lives.
The Department of Local Government, Racing and Multicultural Affairs (DLGRMA) is currently considering the recommendations made in our Forecasting long-term financial sustainability of local government (Report 2: 2016–17) regarding the number and appropriateness of the sustainability ratios but has not yet made any changes.
111.1b
114.9b
117.6b
2016
2017
2018
7.7b
8.2b
8.0b
2016
2017
2018
103.3b
106.7b
109.5b
2016
2017
2018
Local government entities: 2017–18 results of financial audits (Report 18: 2018–19)
5
Com
bine
d lo
ss in
milli
ons
Figure E outlines the sector-wide average sustainability ratios for this year and last year and the target ranges set by DLGRMA.
Figure E Sector sustainability ratios
Note: * Set by DLGRMA.
Source: Queensland Audit Office.
Operating surplus ratio
Long-term financial sustainability remains a major risk for many councils. Our analysis shows that the five-year average operating surplus ratio continues to deteriorate, with the sector still spending more than it earns. Breaking even or making a small surplus over the long term is important for financial sustainability.
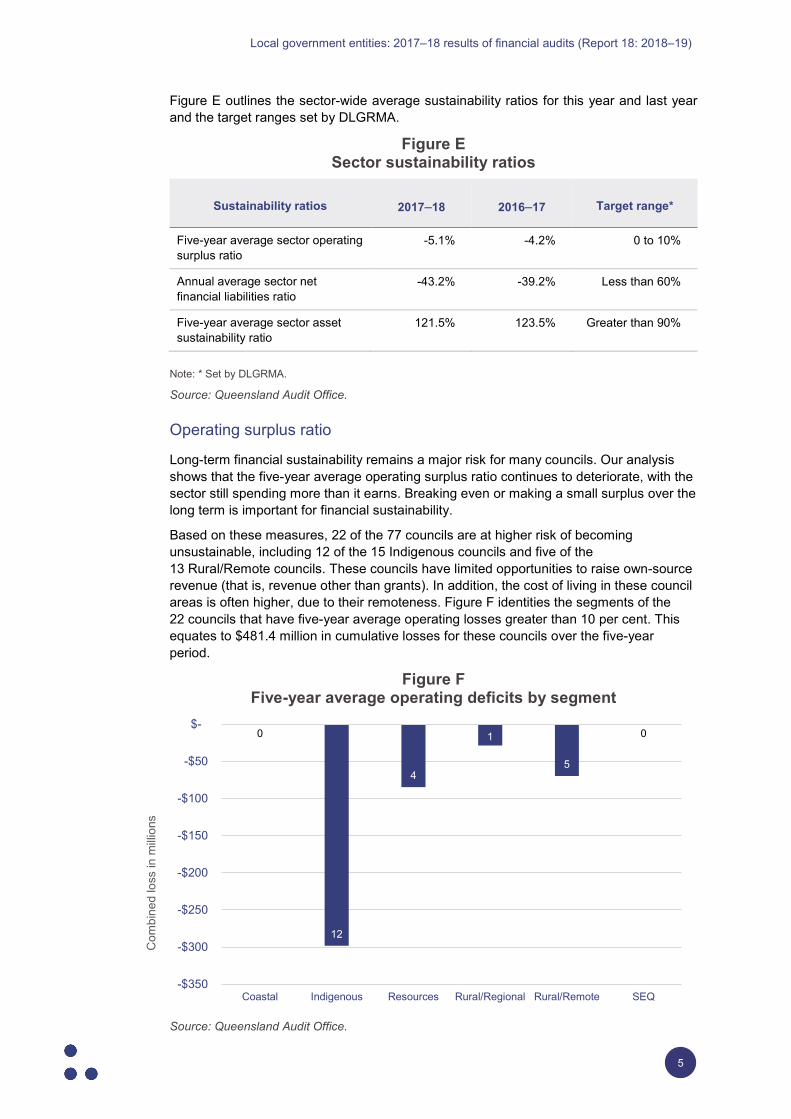
Based on these measures, 22 of the 77 councils are at higher risk of becoming unsustainable, including 12 of the 15 Indigenous councils and five of the 13 Rural/Remote councils. These councils have limited opportunities to raise own-source revenue (that is, revenue other than grants). In addition, the cost of living in these council areas is often higher, due to their remoteness. Figure F identities the segments of the 22 councils that have five-year average operating losses greater than 10 per cent. This equates to $481.4 million in cumulative losses for these councils over the five-year period.
Figure F Five-year average operating deficits by segment
Source: Queensland Audit Office.
Sustainability ratios 2017–18 2016–17 Target range*
Five-year average sector operating surplus ratio
-5.1% -4.2% 0 to 10%
Annual average sector net financial liabilities ratio
-43.2% -39.2% Less than 60%
Five-year average sector asset sustainability ratio
121.5% 123.5% Greater than 90%
0
12
4
1
5
0
-$350
-$300
-$250
-$200
-$150
-$100
-$50
$-
Coastal Indigenous Resources Rural/Regional Rural/Remote SEQ
Local government entities: 2017–18 results of financial audits (Report 18: 2018–19)
6
These councils remain dependent on grant funding to maintain service delivery to their communities. Councils need to continue their focus on long-term planning and managing the costs of delivering their services to reduce their operating losses as far as possible. We are currently conducting a performance audit on managing the cost of local government services, through which we aim to identify better practice examples and common areas for improvement to share across the sector.
Net financial liabilities ratio
The sector average for the net financial liabilities ratio is substantially below zero because councils favour cash over debt. At -43.2 per cent, this ratio remains well within DLGRMA’s recommended target range of less than 60 per cent. This year, there were 54 councils with cash balances greater than their total liabilities (2016–17: 53 councils). Consequently, this ratio is currently irrelevant for most councils.
Instead, we believe a fourth ratio—the cash expense cover ratio—can provide insight into councils’ financial sustainability when councils are not accessing debt. This ratio assesses the number of months a council could continue to operate, using only its unrestricted cash balance (that is, cash not tied to specific projects under funding agreements or legislation), based on its current monthly expenses. Based on benchmarks commonly reported in other Australian jurisdictions, we consider that a target of between three to six months is adequate. Large cash expense cover ratios should be supported by robust long-term capital budgeting.
Nine councils have a cash expense cover ratio of less than three months. Four of these councils have positive average operating surplus ratios and/or access to overdraft facilities at the Queensland Treasury Corporation to effectively manage their cash balances. However, two of these councils—Kowanyama Aboriginal Shire Council, and Wujal Wujal Aboriginal Shire Council—have average operating losses exceeding 20 per cent.
These councils, while improving recently, have a history of significant breakdowns in their internal controls (their systems and processes for ensuring the integrity of financial and accounting information, promoting accountability and preventing fraud) and failure to meet the statutory reporting deadline for their annual financial statements. Consequently, each of these councils continues to implement mitigation strategies to improve its financial sustainability. They must manage their cash balances to pay their debts on time without inappropriately using restricted cash and breaching their grant agreements.
Doomadgee Aboriginal Shire Council is likely to be in a similar, if not worse, position, but it is impossible to tell as the council has not finalised its financial statements for the last two financial years.
Based on their cash expense cover ratios, we assessed that 20 councils could continue to operate for more than 12 months, with three councils able to sustain themselves for more than two years. Councils with high cash expense cover ratios generally have small populations and low borrowings; 11 of these 20 councils have populations of less than 5 000.
Asset sustainability ratio
On average, the sector’s infrastructure assets have a remaining useful life of 48 years. While the sector’s overall five-year average asset sustainability ratio is above the target set by DLGRMA, the remaining useful lives of infrastructure assets in most council segments have decreased over the last five years. This indicates that many councils are not replacing or renewing their assets at the rate they are using them.
Local government entities: 2017–18 results of financial audits (Report 18: 2018–19)
7
Councils in the Rural/Remote and SEQ segments are the exception, as they have maintained or increased the remaining useful lives of their infrastructure assets. This increase is primarily through the renewal of assets following natural disasters and the construction of new assets in growth areas.
Internal controls Good governance and financial stewardship are still not a priority for many councils.
Good internal controls provide reasonable assurance that an entity is achieving its operational, reporting, and compliance objectives. They also serve to protect an entity from fraud or error. The inaction of many councils in addressing significant (high-risk), long-outstanding, internal control weaknesses indicates that internal controls are not valued across the sector.
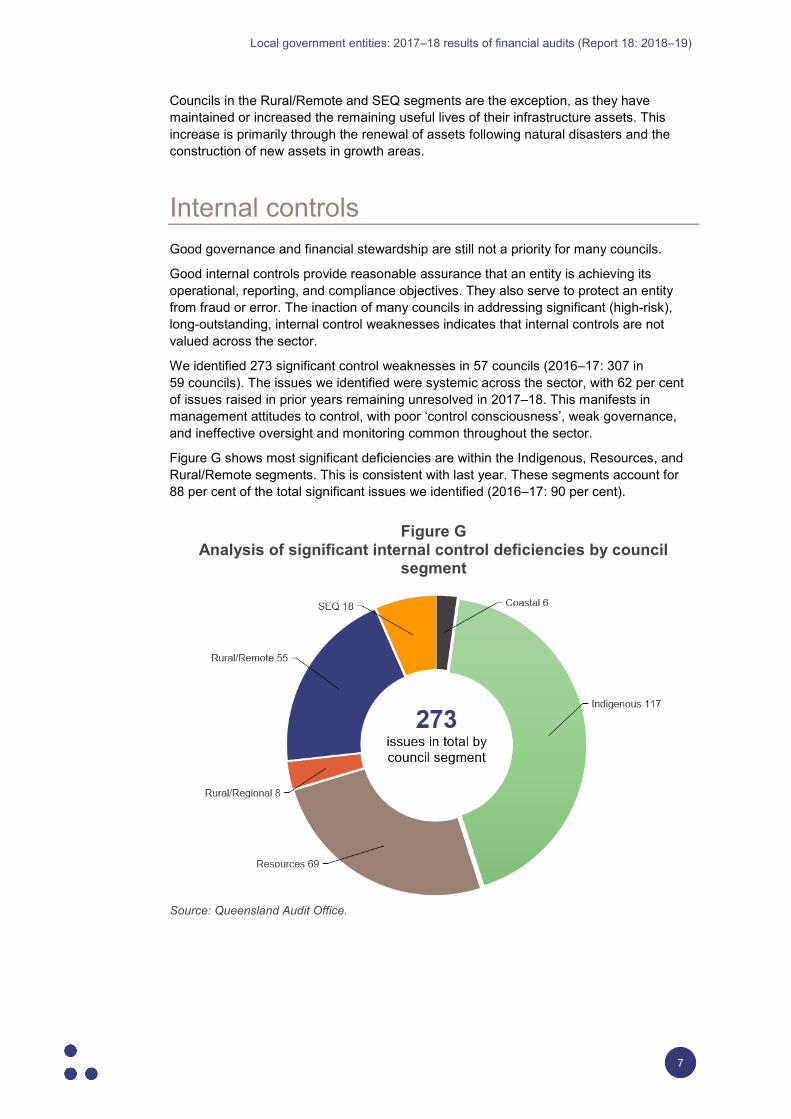
We identified 273 significant control weaknesses in 57 councils (2016–17: 307 in 59 councils). The issues we identified were systemic across the sector, with 62 per cent of issues raised in prior years remaining unresolved in 2017–18. This manifests in management attitudes to control, with poor ‘control consciousness’, weak governance, and ineffective oversight and monitoring common throughout the sector.
Figure G shows most significant deficiencies are within the Indigenous, Resources, and Rural/Remote segments. This is consistent with last year. These segments account for 88 per cent of the total significant issues we identified (2016–17: 90 per cent).
Figure G Analysis of significant internal control deficiencies by council
segment
Source: Queensland Audit Office.
Local government entities: 2017–18 results of financial audits (Report 18: 2018–19)
8
Some of the most common weaknesses we identified were:
• incomplete or non-existent asset management plans, risk registers, and business continuity and disaster recovery plans
• lack of identification or assessment of fraud risks, and lack of fraud control plans
• lack of review of journals and changes to masterfiles (which contain key data on unit rates, fees and charges, and employee and supplier details)
• poor management of user access to information technology systems.
Of the 273 significant deficiencies, 11 have been outstanding for more than five years (2016–17: 20). The Northern Peninsula Area Regional Council has five of these, and it resolved five issues from 2012–13 in the current year. The remaining six significant deficiencies are spread across five councils.
Not maintaining effective contract registers is another common control weakness. Eighteen councils did not have a contract register and a further 35 councils did not record all of the basic elements of a good contract register.
Councils must maintain contract registers to ensure they manage their contractual obligations effectively. The registers are also an important input for effective financial forecasting and budgeting.
Audit committees To be effective, an internal control framework requires skilled and ongoing oversight.
An audit committee can provide a council with added confidence in its organisation's financial reporting, internal controls, risk management, legislative compliance, and audit functions. However, audit committees, which provide an important part of that oversight, are no longer mandated for all councils.
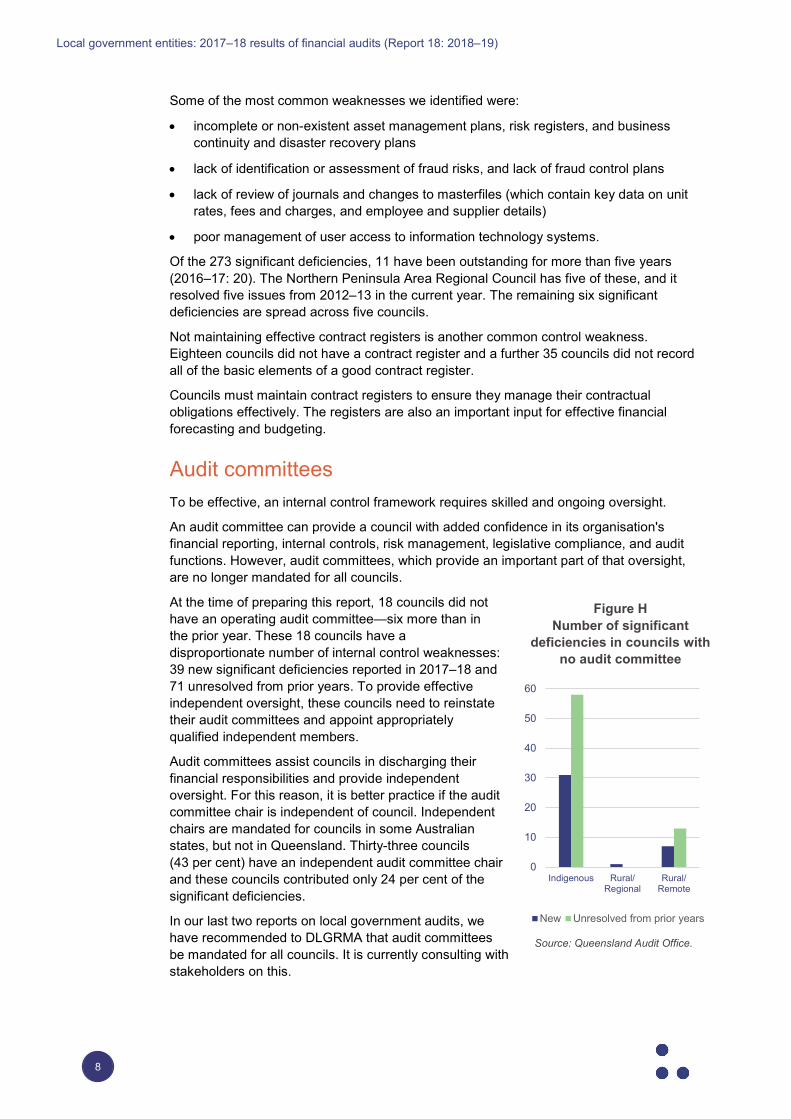
At the time of preparing this report, 18 councils did not have an operating audit committee—six more than in the prior year. These 18 councils have a disproportionate number of internal control weaknesses: 39 new significant deficiencies reported in 2017–18 and 71 unresolved from prior years. To provide effective independent oversight, these councils need to reinstate their audit committees and appoint appropriately qualified independent members.
Audit committees assist councils in discharging their financial responsibilities and provide independent oversight. For this reason, it is better practice if the audit committee chair is independent of council. Independent chairs are mandated for councils in some Australian states, but not in Queensland. Thirty-three councils (43 per cent) have an independent audit committee chair and these councils contributed only 24 per cent of the significant deficiencies.
In our last two reports on local government audits, we have recommended to DLGRMA that audit committees be mandated for all councils. It is currently consulting with stakeholders on this.
Figure H Number of significant
deficiencies in councils with no audit committee
Source: Queensland Audit Office.
0
10
20
30
40
50
60
Indigenous Rural/Regional
Rural/Remote
New Unresolved from prior years
Local government entities: 2017–18 results of financial audits (Report 18: 2018–19)
9
Controlled entities For the past four years, we have reported that councils do not adequately monitor the entities they control (their ‘controlled entities’). This year, 16 local government-related entities were created. Since 2013, councils have created 74 entities, and wound up or disposed of 38 entities. These entities are most often established for development and investment, community events, arts, and environmental activities.
The level of oversight that councils exercise varies significantly. Without appropriate monitoring of these entities, councils risk inappropriate transactions or other business decisions being made without their knowledge and input. They also risk councils’ objectives not being met through these entities’ activities and wasting public money.
Councils with existing controlled entities or plans to create them should have policies in place to ensure that:
• they prepare a business case before creating the entity
• they implement monitoring controls over the entity’s key processes
• the entity regularly reports to council governance committees.
For the last two years, we have recommended that the financial statements of controlled entities be made publicly available. While 32 of the 52 controlled entities and 14 of 28 jointly-controlled entities make their audited financial statements publicly available, there is no consistent location where these can be found. Three approaches are used:
• Some entities publish statements on their own, or their council’s, website. • Some entities table statements in council as part of meeting papers, which appear on
a separate section of the council website. • Registered charities publish their statements on the Australian Charities and
Not-for-profit Commission website.
Audited financial statements are not publicly available for 34 local government-related entities.
Local government entities: 2017–18 results of financial audits (Report 18: 2018–19)
10
Recommendations As part of each audit, we make recommendations to councils about how to improve their financial management.
We recommend that councils take prompt action to address individual recommendations and resolve internal control deficiencies, with a focus on those outstanding from prior years. This will help them to improve their financial stewardship and mitigate the risk of fraud or error.
We recommend that the Department of Local Government, Racing and Multicultural Affairs:
1. mandates that the chair of a council audit committee is an independent member
2. reviews the appropriateness of the net financial liabilities ratio, as most councils favour cash over debt.
We recommend, as we have in prior year reports, that the Department of Local Government, Racing and Multicultural Affairs mandates:
3. audit committees for all councils
4. that financial statements of controlled entities be made publicly available, preferably in a consistent location.
We recommend as we have in prior year reports, that councils:
5. continue to assess their processes for ensuring that asset registers are complete and remain current over time
6. review and update their month end close processes to include:
• monthly accrual statements of financial performance and position, and cash flow information
• variance analysis, key ratios, trends, and other non-financial information that will enable councillors and council executives to better understand their council’s financial performance and outlook
7. review their accounting for rehabilitation of landfills. This should include:
• assessing open and closed landfill sites and whether a liability has been recognised
• ensuring all future costs associated with their obligations under their environmental authority (licence) are included in the provision
8. review their monitoring controls and memberships of their controlled entities’ boards, and:
• appoint independent directors to provide specialist skills, experience, and diversity
• establish appropriate mechanisms for oversight and to manage conflicts of interest.
These recommendations should be addressed if councils and their entities are to improve their financial stewardship.
Local government entities: 2017–18 results of financial audits (Report 18: 2018–19)
11
1. Sector overview
This chapter provides a sector overview to help readers to understand the audit findings and conclusions.
The local government sector is made up of 200 entities: 77 councils and 123 related entities that councils control, either individually or jointly with other entities. In 2017–18, 40 of the related entities were classified as dormant, non-reporting, or wound up; therefore, only 160 entities prepared financial statements.
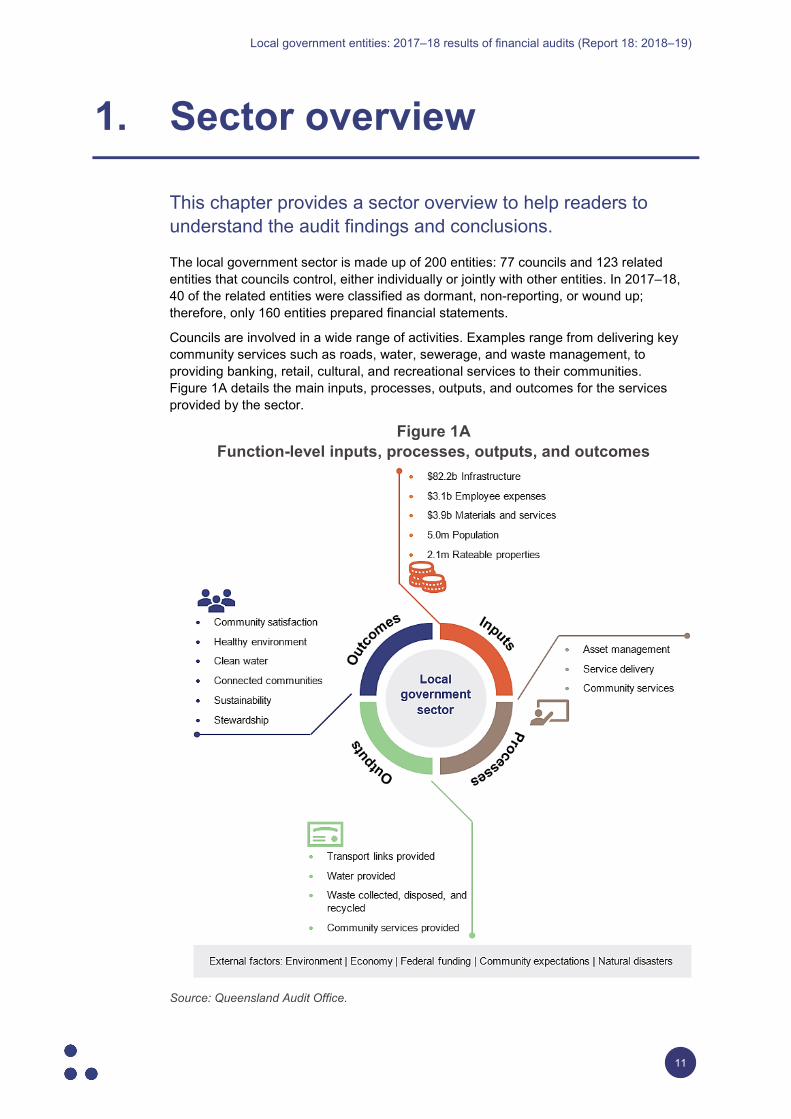
Councils are involved in a wide range of activities. Examples range from delivering key community services such as roads, water, sewerage, and waste management, to providing banking, retail, cultural, and recreational services to their communities. Figure 1A details the main inputs, processes, outputs, and outcomes for the services provided by the sector.
Figure 1A Function-level inputs, processes, outputs, and outcomes
Source: Queensland Audit Office.
Local government entities: 2017–18 results of financial audits (Report 18: 2018–19)
12
2. Results of our audits
This chapter delivers the audit opinion results for councils and related entities and evaluates the timeliness (relevance) and quality (reliability) of their reporting.
Conclusion We issued unmodified audit opinions on the financial statements of all 76 councils audited to date and most related entities. Readers can rely on the results in the audited financial statements.
Three councils were unable to produce audited financial statements within eight months of the financial year end, including Doomadgee Aboriginal Shire Council, whose financial statements remain unfinished. Historically, unfinished audits have significant audit issues that often translate into qualified opinions (which means the financial statements don’t completely comply with the relevant legislative requirements or standards). Torres Shire Council and Gladstone Regional Council had their audit opinions issued in March 2019 and April 2019 respectively.
Doomadgee Aboriginal Shire Council’s 2016–17 financial statements also remain unfinished. This council has not prioritised the preparation of its financial statements and has poor month end and year end financial reporting processes.
Wujal Wujal Aboriginal Shire Council and Northern Peninsula Area Regional Council have implemented improved financial reporting processes this year, and both met the 31 October statutory reporting deadline. This is the first time since 2013–14 that these councils have achieved this.
Overall, councils have improved their year end processes, leading to a decrease of 1.6 weeks in the average time taken to complete financial statements after 30 June. Since 2013–14, councils have reduced the average time to finalise financial statements by 5.8 weeks, which is a significant achievement. Across the sector, however, there are significant fluctuations in the robustness of monthly reporting. Councils should have strong, consistent month end and year end processes and effective internal quality assurance practices to review and challenge the information presented in the financial reports. Strong processes significantly reduce the likelihood of errors and adjustments in financial statements.
In 2017–18, 25 councils reported assets not previously recognised, totalling $378.2 million. Over the past three years, 40 councils have reported $793.3 million in ‘found’ assets, requiring them to make adjustments to asset balances. Fifteen of these councils have reported ‘found’ assets for three consecutive years, which may indicate fundamental issues with the systems and processes they use to demonstrate accountability and produce financial reports. Councils identifying consistent errors need to better understand their asset data and improve their processes for asset stocktakes and recognising contributed assets (assets given to the council, for example, by developers).
Local government entities: 2017–18 results of financial audits (Report 18: 2018–19)
13
We have issued 75 audit opinions for council-related entities, of which two were qualified. In prior years, we have reported on the public availability of the financial statements of council-related entities. Only 46 of the 80 council-related entities make their financial statements publicly available. When financial statements are not publicity available, local communities are not given an opportunity to assess the entities’ performance.
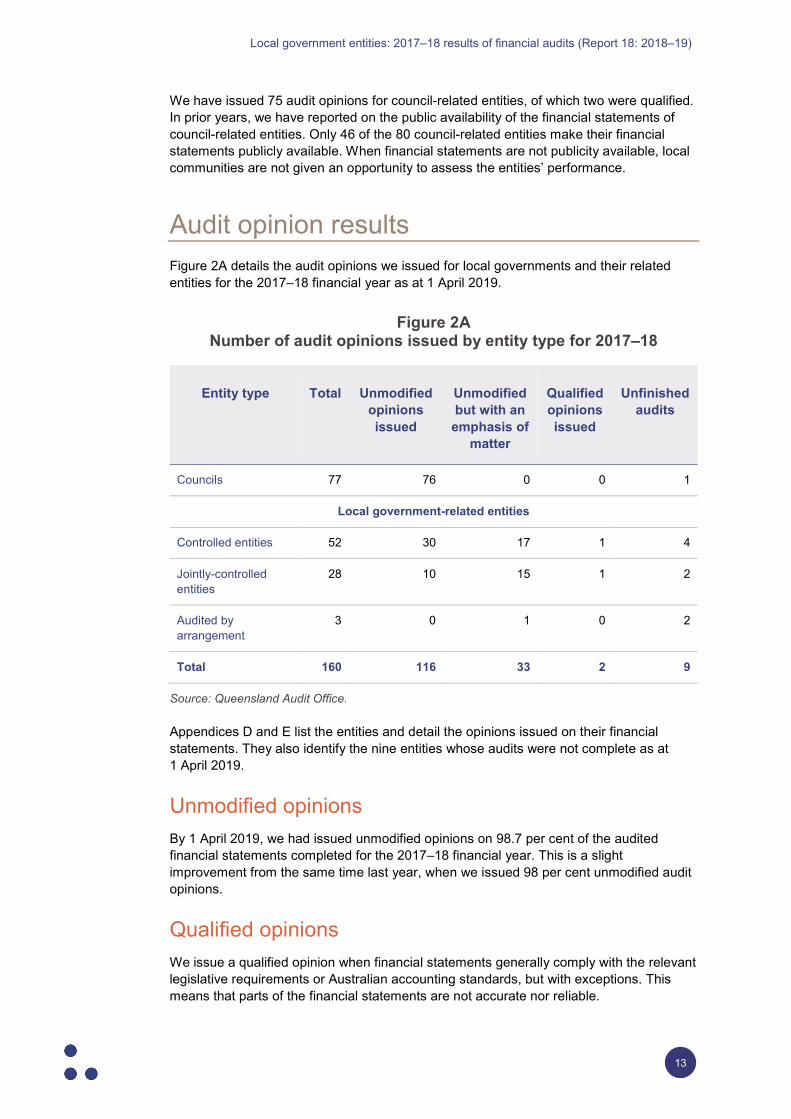
Audit opinion results Figure 2A details the audit opinions we issued for local governments and their related entities for the 2017–18 financial year as at 1 April 2019.
Figure 2A Number of audit opinions issued by entity type for 2017–18
Entity type Total Unmodified opinions issued
Unmodified but with an emphasis of
matter
Qualified opinions issued
Unfinished audits
Councils 77 76 0 0 1
Local government-related entities
Controlled entities 52 30 17 1 4
Jointly-controlled entities
28 10 15 1 2
Audited by arrangement
3 0 1 0 2
Total 160 116 33 2 9
Source: Queensland Audit Office.
Appendices D and E list the entities and detail the opinions issued on their financial statements. They also identify the nine entities whose audits were not complete as at 1 April 2019.
Unmodified opinions By 1 April 2019, we had issued unmodified opinions on 98.7 per cent of the audited financial statements completed for the 2017–18 financial year. This is a slight improvement from the same time last year, when we issued 98 per cent unmodified audit opinions.
Qualified opinions We issue a qualified opinion when financial statements generally comply with the relevant legislative requirements or Australian accounting standards, but with exceptions. This means that parts of the financial statements are not accurate nor reliable.
Local government entities: 2017–18 results of financial audits (Report 18: 2018–19)
14
Across the sector to date, we have not issued any qualified opinions on councils’ 2017–18 financial statements (2016–17: two). We have, however, issued two qualified opinions on local government-related entities for 2017–18 (2016–17: two).
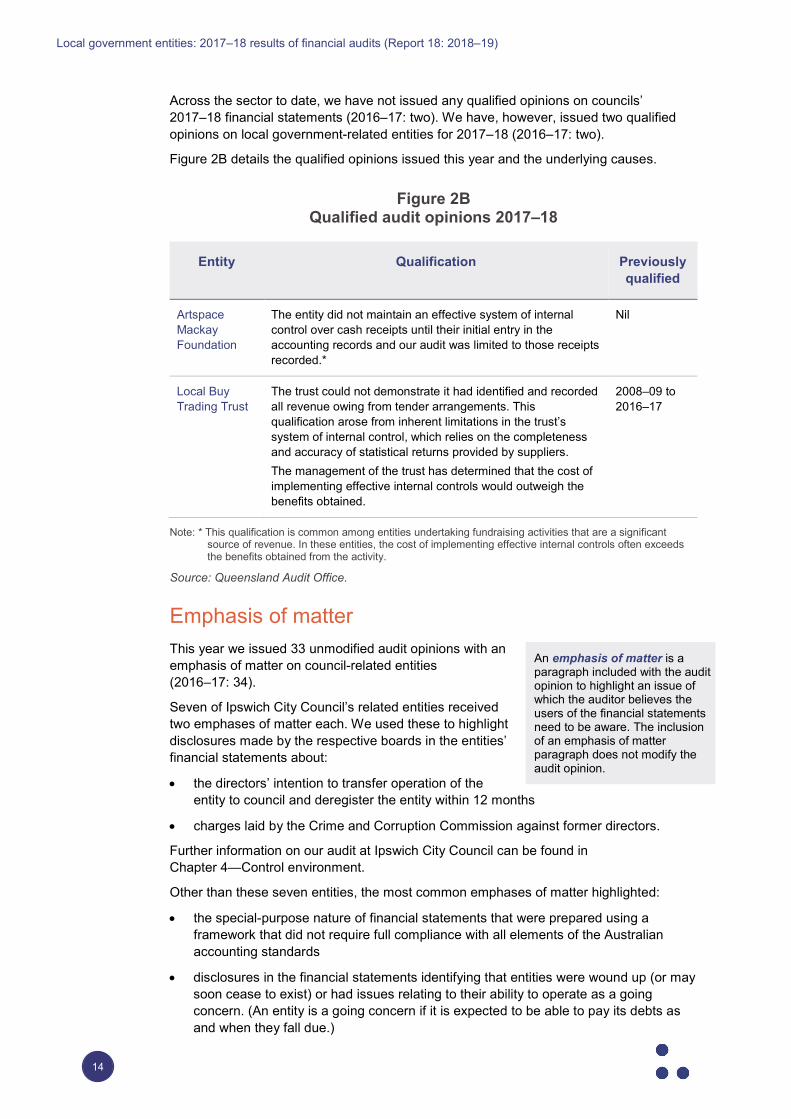
Figure 2B details the qualified opinions issued this year and the underlying causes.
Figure 2B Qualified audit opinions 2017–18
Entity Qualification Previously qualified
Artspace Mackay Foundation
The entity did not maintain an effective system of internal control over cash receipts until their initial entry in the accounting records and our audit was limited to those receipts recorded.*
Nil
Local Buy Trading Trust
The trust could not demonstrate it had identified and recorded all revenue owing from tender arrangements. This qualification arose from inherent limitations in the trust’s system of internal control, which relies on the completeness and accuracy of statistical returns provided by suppliers. The management of the trust has determined that the cost of implementing effective internal controls would outweigh the benefits obtained.
2008–09 to 2016–17
Note: * This qualification is common among entities undertaking fundraising activities that are a significant source of revenue. In these entities, the cost of implementing effective internal controls often exceeds the benefits obtained from the activity.
Source: Queensland Audit Office.
Emphasis of matter This year we issued 33 unmodified audit opinions with an emphasis of matter on council-related entities (2016–17: 34).
Seven of Ipswich City Council’s related entities received two emphases of matter each. We used these to highlight disclosures made by the respective boards in the entities’ financial statements about:
• the directors’ intention to transfer operation of the entity to council and deregister the entity within 12 months
• charges laid by the Crime and Corruption Commission against former directors.
Further information on our audit at Ipswich City Council can be found in Chapter 4—Control environment.
Other than these seven entities, the most common emphases of matter highlighted:
• the special-purpose nature of financial statements that were prepared using a framework that did not require full compliance with all elements of the Australian accounting standards
• disclosures in the financial statements identifying that entities were wound up (or may soon cease to exist) or had issues relating to their ability to operate as a going concern. (An entity is a going concern if it is expected to be able to pay its debts as and when they fall due.)
An emphasis of matter is a paragraph included with the audit opinion to highlight an issue of which the auditor believes the users of the financial statements need to be aware. The inclusion of an emphasis of matter paragraph does not modify the audit opinion.
Local government entities: 2017–18 results of financial audits (Report 18: 2018–19)
15
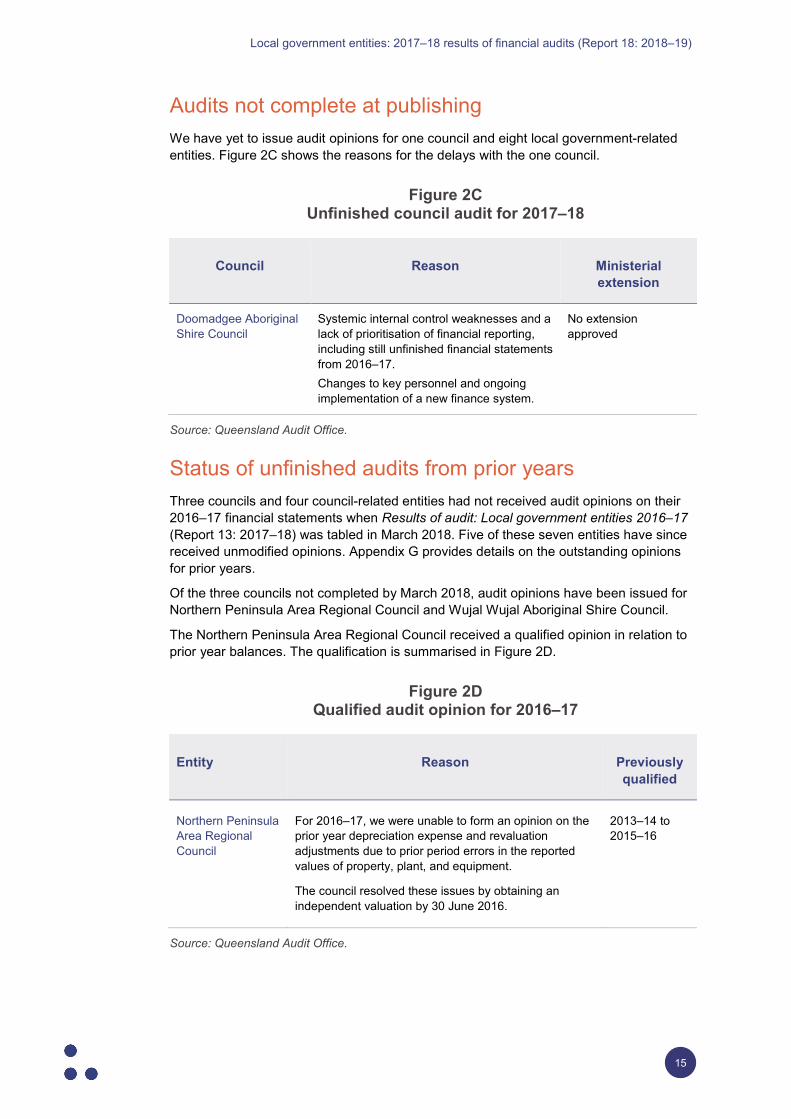
Audits not complete at publishing We have yet to issue audit opinions for one council and eight local government-related entities. Figure 2C shows the reasons for the delays with the one council.
Figure 2C Unfinished council audit for 2017–18
Source: Queensland Audit Office.
Status of unfinished audits from prior years Three councils and four council-related entities had not received audit opinions on their 2016–17 financial statements when Results of audit: Local government entities 2016–17 (Report 13: 2017–18) was tabled in March 2018. Five of these seven entities have since received unmodified opinions. Appendix G provides details on the outstanding opinions for prior years.
Of the three councils not completed by March 2018, audit opinions have been issued for Northern Peninsula Area Regional Council and Wujal Wujal Aboriginal Shire Council.
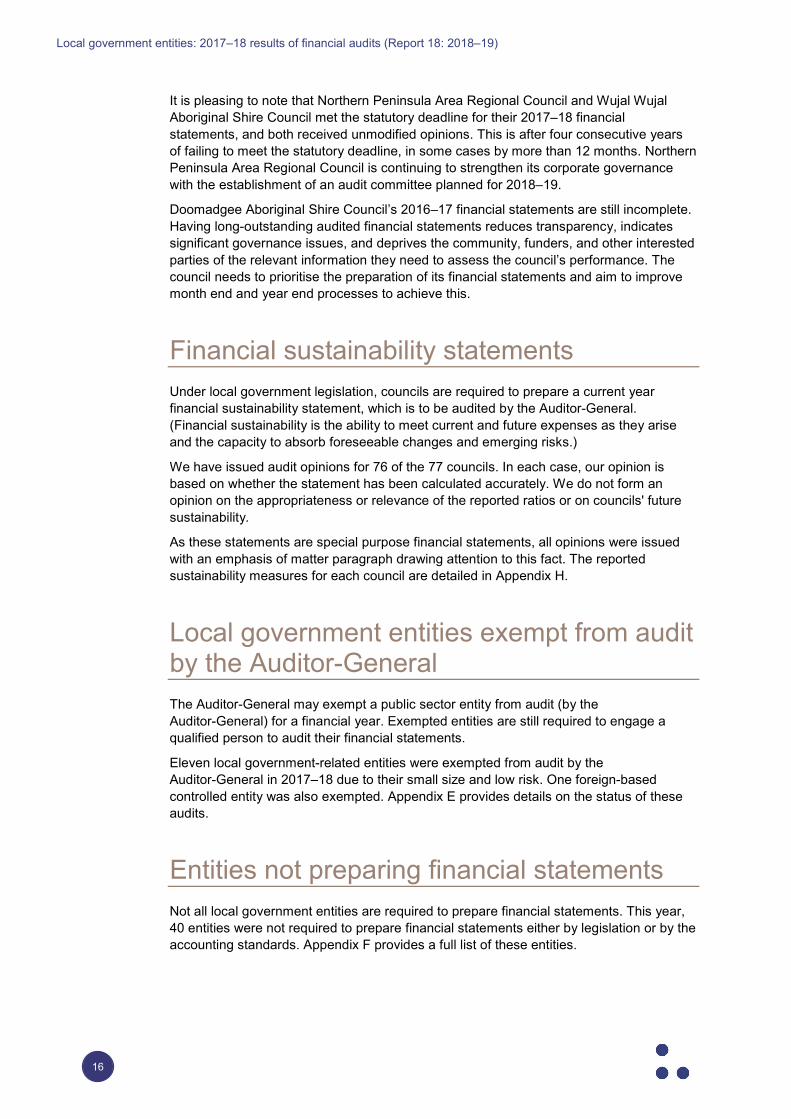
The Northern Peninsula Area Regional Council received a qualified opinion in relation to prior year balances. The qualification is summarised in Figure 2D.
Figure 2D Qualified audit opinion for 2016–17
Source: Queensland Audit Office.
Council Reason Ministerial extension
Doomadgee Aboriginal Shire Council
Systemic internal control weaknesses and a lack of prioritisation of financial reporting, including still unfinished financial statements from 2016–17. Changes to key personnel and ongoing implementation of a new finance system.
No extension approved
Entity Reason Previously qualified
Northern Peninsula Area Regional Council
For 2016–17, we were unable to form an opinion on the prior year depreciation expense and revaluation adjustments due to prior period errors in the reported values of property, plant, and equipment.
The council resolved these issues by obtaining an independent valuation by 30 June 2016.
2013–14 to 2015–16
Local government entities: 2017–18 results of financial audits (Report 18: 2018–19)
16
It is pleasing to note that Northern Peninsula Area Regional Council and Wujal Wujal Aboriginal Shire Council met the statutory deadline for their 2017–18 financial statements, and both received unmodified opinions. This is after four consecutive years of failing to meet the statutory deadline, in some cases by more than 12 months. Northern Peninsula Area Regional Council is continuing to strengthen its corporate governance with the establishment of an audit committee planned for 2018–19.
Doomadgee Aboriginal Shire Council’s 2016–17 financial statements are still incomplete. Having long-outstanding audited financial statements reduces transparency, indicates significant governance issues, and deprives the community, funders, and other interested parties of the relevant information they need to assess the council’s performance. The council needs to prioritise the preparation of its financial statements and aim to improve month end and year end processes to achieve this.
Financial sustainability statements Under local government legislation, councils are required to prepare a current year financial sustainability statement, which is to be audited by the Auditor-General. (Financial sustainability is the ability to meet current and future expenses as they arise and the capacity to absorb foreseeable changes and emerging risks.)
We have issued audit opinions for 76 of the 77 councils. In each case, our opinion is based on whether the statement has been calculated accurately. We do not form an opinion on the appropriateness or relevance of the reported ratios or on councils' future sustainability.
As these statements are special purpose financial statements, all opinions were issued with an emphasis of matter paragraph drawing attention to this fact. The reported sustainability measures for each council are detailed in Appendix H.
Local government entities exempt from audit by the Auditor-General The Auditor-General may exempt a public sector entity from audit (by the Auditor-General) for a financial year. Exempted entities are still required to engage a qualified person to audit their financial statements.
Eleven local government-related entities were exempted from audit by the Auditor-General in 2017–18 due to their small size and low risk. One foreign-based controlled entity was also exempted. Appendix E provides details on the status of these audits.
Entities not preparing financial statements Not all local government entities are required to prepare financial statements. This year, 40 entities were not required to prepare financial statements either by legislation or by the accounting standards. Appendix F provides a full list of these entities.
Local government entities: 2017–18 results of financial audits (Report 18: 2018–19)
17
Financial statement preparation Every year, we assess the effectiveness of each council’s financial statement preparation process. This assessment focuses on the councils’ ability to produce a quality set of financial statements in a timely manner.
Our main measures are how:
• successfully a council delivers on its agreed milestones for year end financial reporting processes
• effectively a council identifies and corrects errors in the financial statements before providing the statements to the audit team
• quickly the financial statements are certified compared to the legislative reporting deadline of 31 October.
Our assessment criteria and the results of our assessment for each council are included in Appendix I. We refine our assessment criteria each year to drive improvement and consistency in reporting across the public sector. Therefore, no comparison should be made of the traffic light assessments from year to year.
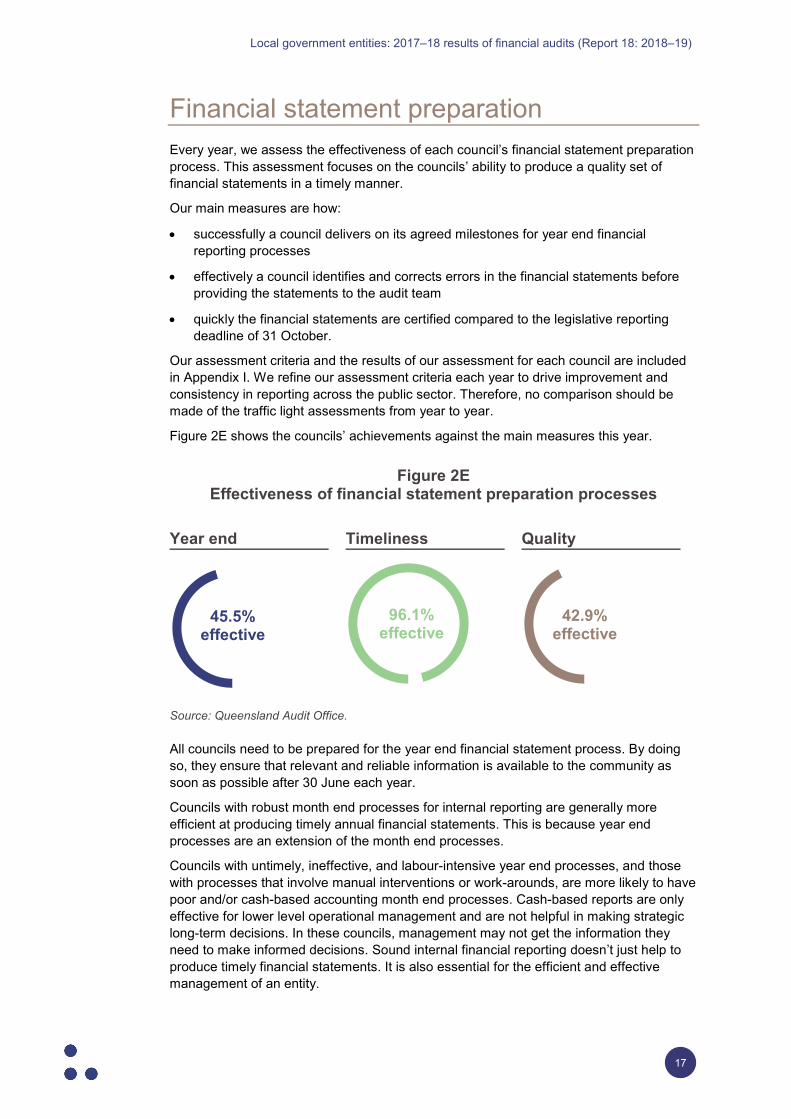
Figure 2E shows the councils’ achievements against the main measures this year.
Figure 2E Effectiveness of financial statement preparation processes
Source: Queensland Audit Office.
All councils need to be prepared for the year end financial statement process. By doing so, they ensure that relevant and reliable information is available to the community as soon as possible after 30 June each year.
Councils with robust month end processes for internal reporting are generally more efficient at producing timely annual financial statements. This is because year end processes are an extension of the month end processes.
Councils with untimely, ineffective, and labour-intensive year end processes, and those with processes that involve manual interventions or work-arounds, are more likely to have poor and/or cash-based accounting month end processes. Cash-based reports are only effective for lower level operational management and are not helpful in making strategic long-term decisions. In these councils, management may not get the information they need to make informed decisions. Sound internal financial reporting doesn’t just help to produce timely financial statements. It is also essential for the efficient and effective management of an entity.
Year end Timeliness Quality
45.5%effective
96.1%effective
42.9%effective
Local government entities: 2017–18 results of financial audits (Report 18: 2018–19)
18
Year end close process Each year, we agree with councils on the target dates for delivery of five key milestones for an efficient year end process.
This year, 35 councils completed their year end close processes by the agreed dates. This is an improvement from last year, when 30 councils achieved their agreed milestones.
The milestone most frequently missed was the completion of non-current asset valuations, with 29 councils failing to meet their agreed date. However, this was still an improvement from last year, when 40 councils failed to meet this milestone.
When councils did not manage their asset valuation processes well, we often identified errors in the draft financial statements provided to audit.
Timeliness of financial statements An entity’s ability to prepare timely financial statements is an indicator of the strength of its financial management processes. Financial statements are timely when they provide information to users in time to influence their decisions. As timeliness diminishes, the statements become less relevant to users.
This year, 71 councils (92.2 per cent) met their statutory deadline of 31 October. This is an improvement from the prior year (69 councils: 89.6 per cent).
A further three councils had their opinions issued by a later date agreed with the minister (2016–17: four).
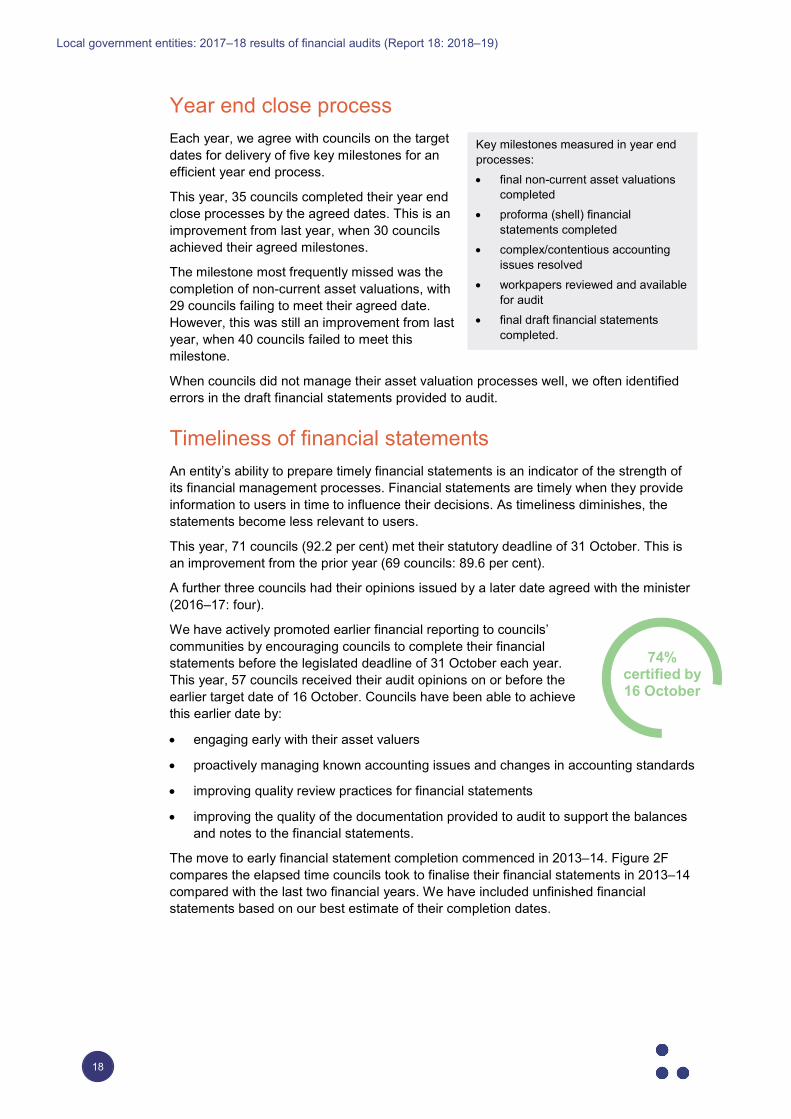
We have actively promoted earlier financial reporting to councils’ communities by encouraging councils to complete their financial statements before the legislated deadline of 31 October each year. This year, 57 councils received their audit opinions on or before the earlier target date of 16 October. Councils have been able to achieve this earlier date by:
• engaging early with their asset valuers
• proactively managing known accounting issues and changes in accounting standards
• improving quality review practices for financial statements
• improving the quality of the documentation provided to audit to support the balances and notes to the financial statements.
The move to early financial statement completion commenced in 2013–14. Figure 2F compares the elapsed time councils took to finalise their financial statements in 2013–14 compared with the last two financial years. We have included unfinished financial statements based on our best estimate of their completion dates.
Key milestones measured in year end processes: • final non-current asset valuations
completed • proforma (shell) financial
statements completed • complex/contentious accounting
issues resolved • workpapers reviewed and available
for audit • final draft financial statements
completed.
74%certified by 16 October
Local government entities: 2017–18 results of financial audits (Report 18: 2018–19)
19
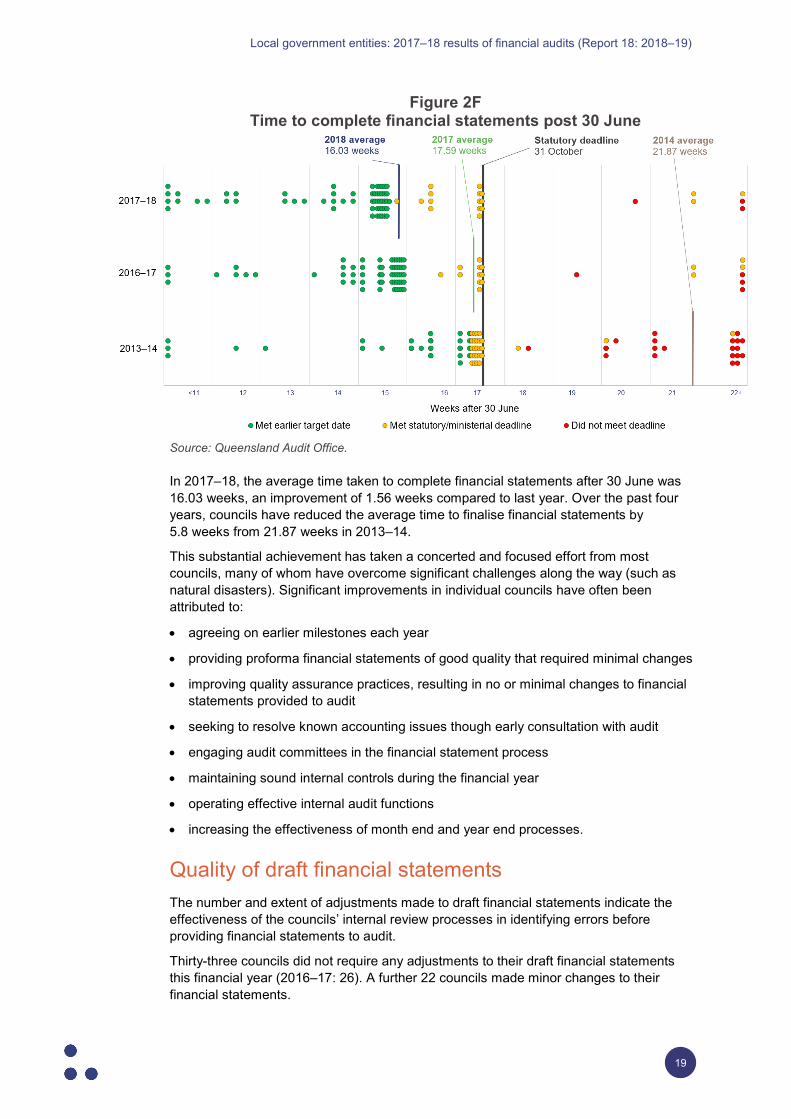
Figure 2F Time to complete financial statements post 30 June
Source: Queensland Audit Office.
In 2017–18, the average time taken to complete financial statements after 30 June was 16.03 weeks, an improvement of 1.56 weeks compared to last year. Over the past four years, councils have reduced the average time to finalise financial statements by 5.8 weeks from 21.87 weeks in 2013–14.
This substantial achievement has taken a concerted and focused effort from most councils, many of whom have overcome significant challenges along the way (such as natural disasters). Significant improvements in individual councils have often been attributed to:
• agreeing on earlier milestones each year
• providing proforma financial statements of good quality that required minimal changes
• improving quality assurance practices, resulting in no or minimal changes to financial statements provided to audit
• seeking to resolve known accounting issues though early consultation with audit
• engaging audit committees in the financial statement process
• maintaining sound internal controls during the financial year
• operating effective internal audit functions
• increasing the effectiveness of month end and year end processes.
Quality of draft financial statements The number and extent of adjustments made to draft financial statements indicate the effectiveness of the councils’ internal review processes in identifying errors before providing financial statements to audit.
Thirty-three councils did not require any adjustments to their draft financial statements this financial year (2016–17: 26). A further 22 councils made minor changes to their financial statements.
Local government entities: 2017–18 results of financial audits (Report 18: 2018–19)
20
The remaining 21 councils made more significant adjustments, with most resulting from the late identification and review of transactions, including incorrect assumptions used in calculating depreciation expense, asset valuations, and adjustments to classification of expenses (between operating and capital). Other adjustments were the result of incomplete or missing note disclosures in the financial statements provided to audit, and prior period errors.
Prior period errors When a council prepares its financial statements, the council or audit may identify material errors in the council’s prior year statements. (Material errors are those that are likely to influence decisions made by readers of financial statements.)
Figure 2G details the material prior period errors identified this year and corrected in the 2017–18 financial statements by restating comparative (prior year) figures.
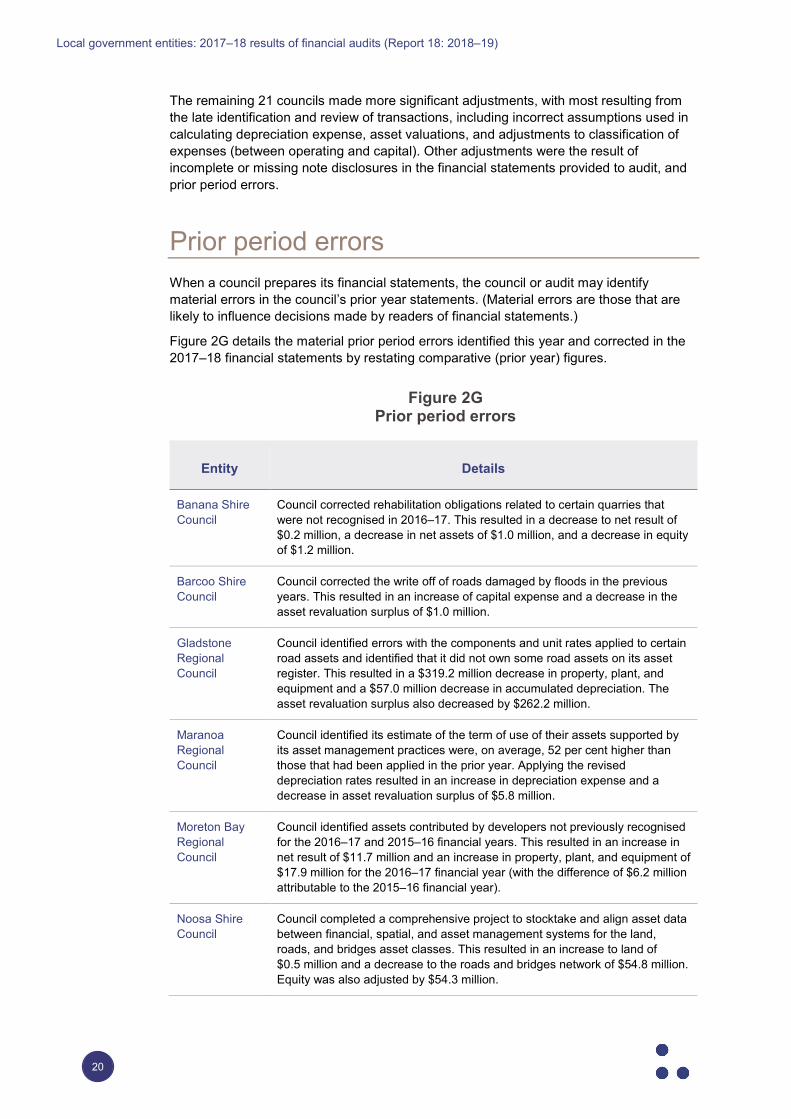
Figure 2G Prior period errors
Entity Details
Banana Shire Council
Council corrected rehabilitation obligations related to certain quarries that were not recognised in 2016–17. This resulted in a decrease to net result of $0.2 million, a decrease in net assets of $1.0 million, and a decrease in equity of $1.2 million.
Barcoo Shire Council
Council corrected the write off of roads damaged by floods in the previous years. This resulted in an increase of capital expense and a decrease in the asset revaluation surplus of $1.0 million.
Gladstone Regional Council
Council identified errors with the components and unit rates applied to certain road assets and identified that it did not own some road assets on its asset register. This resulted in a $319.2 million decrease in property, plant, and equipment and a $57.0 million decrease in accumulated depreciation. The asset revaluation surplus also decreased by $262.2 million.
Maranoa Regional Council
Council identified its estimate of the term of use of their assets supported by its asset management practices were, on average, 52 per cent higher than those that had been applied in the prior year. Applying the revised depreciation rates resulted in an increase in depreciation expense and a decrease in asset revaluation surplus of $5.8 million.
Moreton Bay Regional Council
Council identified assets contributed by developers not previously recognised for the 2016–17 and 2015–16 financial years. This resulted in an increase in net result of $11.7 million and an increase in property, plant, and equipment of $17.9 million for the 2016–17 financial year (with the difference of $6.2 million attributable to the 2015–16 financial year).
Noosa Shire Council
Council completed a comprehensive project to stocktake and align asset data between financial, spatial, and asset management systems for the land, roads, and bridges asset classes. This resulted in an increase to land of $0.5 million and a decrease to the roads and bridges network of $54.8 million. Equity was also adjusted by $54.3 million.
Local government entities: 2017–18 results of financial audits (Report 18: 2018–19)
21
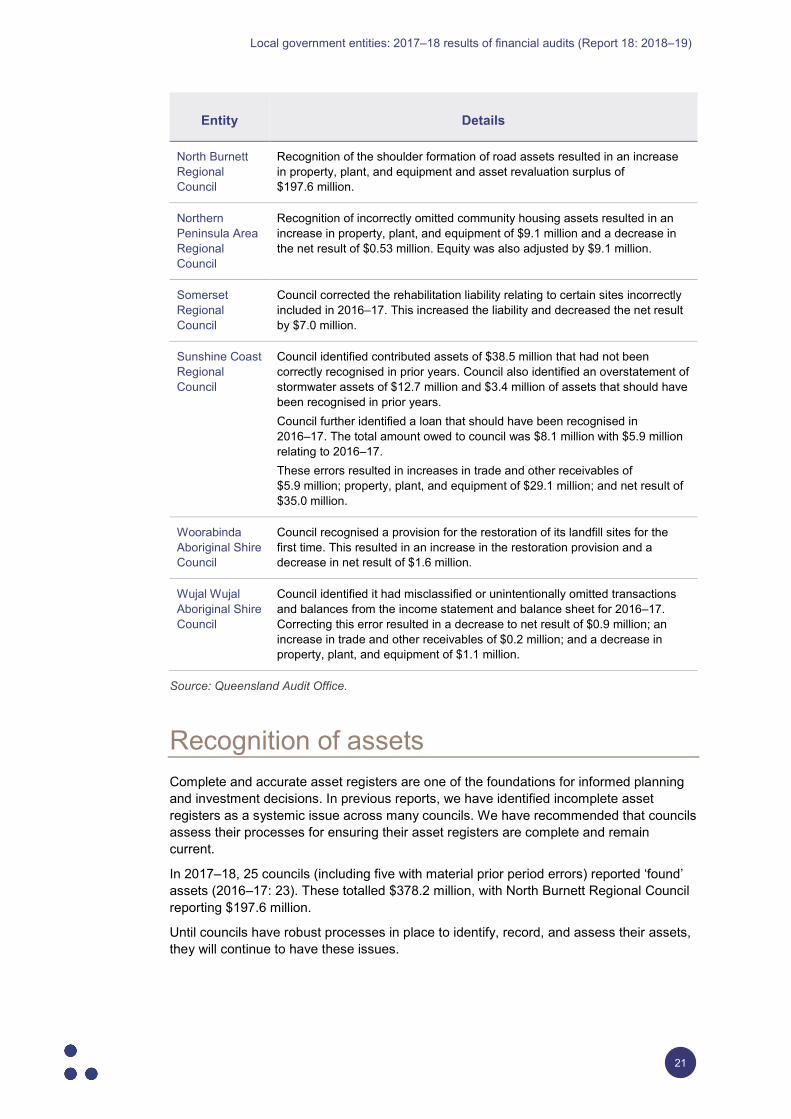
Entity Details
North Burnett Regional Council
Recognition of the shoulder formation of road assets resulted in an increase in property, plant, and equipment and asset revaluation surplus of $197.6 million.
Northern Peninsula Area Regional Council
Recognition of incorrectly omitted community housing assets resulted in an increase in property, plant, and equipment of $9.1 million and a decrease in the net result of $0.53 million. Equity was also adjusted by $9.1 million.
Somerset Regional Council
Council corrected the rehabilitation liability relating to certain sites incorrectly included in 2016–17. This increased the liability and decreased the net result by $7.0 million.
Sunshine Coast Regional Council
Council identified contributed assets of $38.5 million that had not been correctly recognised in prior years. Council also identified an overstatement of stormwater assets of $12.7 million and $3.4 million of assets that should have been recognised in prior years. Council further identified a loan that should have been recognised in 2016–17. The total amount owed to council was $8.1 million with $5.9 million relating to 2016–17. These errors resulted in increases in trade and other receivables of $5.9 million; property, plant, and equipment of $29.1 million; and net result of $35.0 million.
Woorabinda Aboriginal Shire Council
Council recognised a provision for the restoration of its landfill sites for the first time. This resulted in an increase in the restoration provision and a decrease in net result of $1.6 million.
Wujal Wujal Aboriginal Shire Council
Council identified it had misclassified or unintentionally omitted transactions and balances from the income statement and balance sheet for 2016–17. Correcting this error resulted in a decrease to net result of $0.9 million; an increase in trade and other receivables of $0.2 million; and a decrease in property, plant, and equipment of $1.1 million.
Source: Queensland Audit Office.
Recognition of assets Complete and accurate asset registers are one of the foundations for informed planning and investment decisions. In previous reports, we have identified incomplete asset registers as a systemic issue across many councils. We have recommended that councils assess their processes for ensuring their asset registers are complete and remain current.
In 2017–18, 25 councils (including five with material prior period errors) reported ‘found’ assets (2016–17: 23). These totalled $378.2 million, with North Burnett Regional Council reporting $197.6 million.
Until councils have robust processes in place to identify, record, and assess their assets, they will continue to have these issues.
Local government entities: 2017–18 results of financial audits (Report 18: 2018–19)
22
Councils identified ‘found’ assets through:
• data-cleansing activities—refining and purging data that may be incorrect, incomplete, or duplicated
• reconciling the councils’ geographical information system (GIS) with the financial asset registers (the GIS provides spatial or geographic data). Councils use the GIS to record multiple sets of information about assets (for example location coordinates, photographs, and condition assessments)
• conducting comprehensive revaluations that identified assets not included in council records
These should be one-off occurrences. Repeated instances of ‘found’ assets in the same asset classes indicate a fundamental problem with councils’ internal controls.
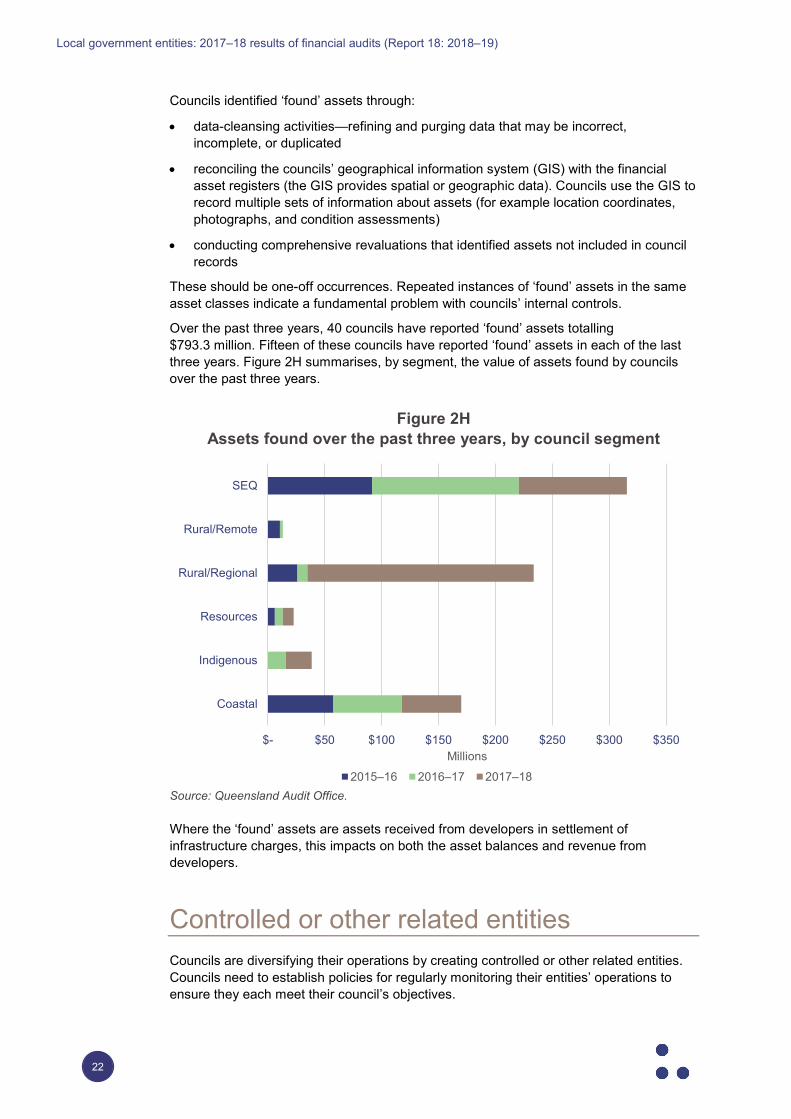
Over the past three years, 40 councils have reported ‘found’ assets totalling $793.3 million. Fifteen of these councils have reported ‘found’ assets in each of the last three years. Figure 2H summarises, by segment, the value of assets found by councils over the past three years.
Figure 2H Assets found over the past three years, by council segment
Source: Queensland Audit Office.
Where the ‘found’ assets are assets received from developers in settlement of infrastructure charges, this impacts on both the asset balances and revenue from developers.
Controlled or other related entities Councils are diversifying their operations by creating controlled or other related entities. Councils need to establish policies for regularly monitoring their entities’ operations to ensure they each meet their council’s objectives.
$- $50 $100 $150 $200 $250 $300 $350
Coastal
Indigenous
Resources
Rural/Regional
Rural/Remote
SEQ
Millions
2015–16 2016–17 2017–18
Local government entities: 2017–18 results of financial audits (Report 18: 2018–19)
23
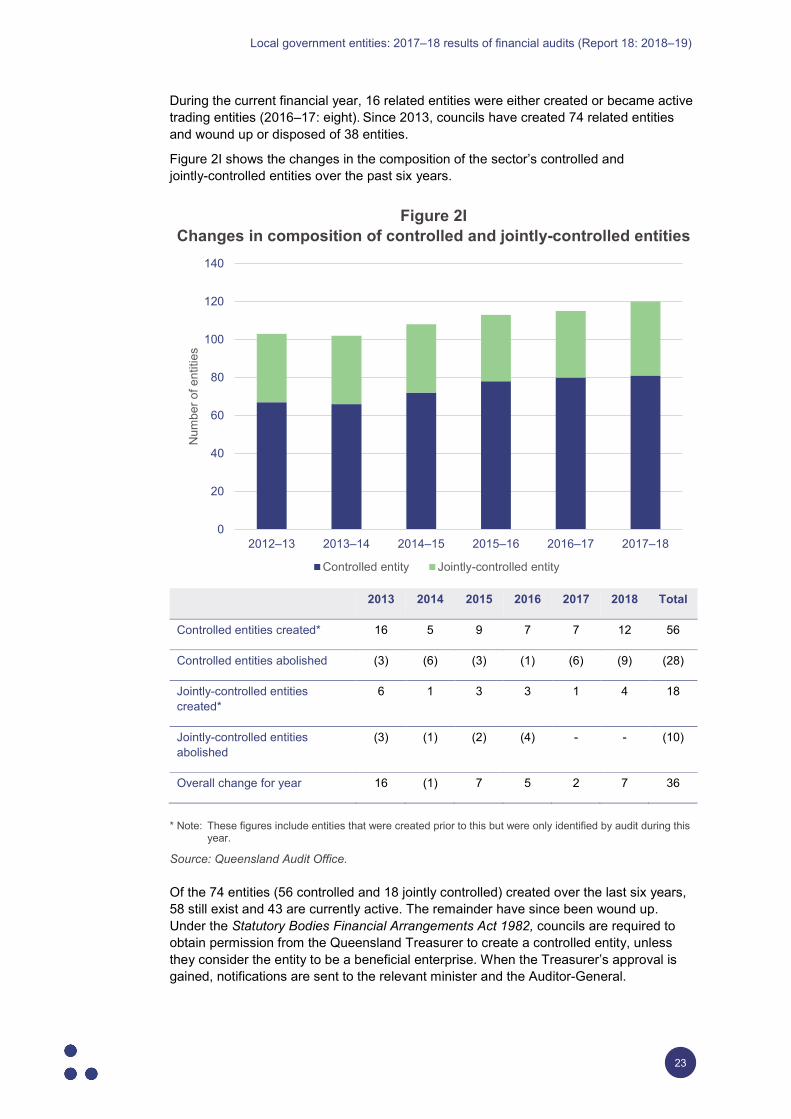
During the current financial year, 16 related entities were either created or became active trading entities (2016–17: eight). Since 2013, councils have created 74 related entities and wound up or disposed of 38 entities.
Figure 2I shows the changes in the composition of the sector’s controlled and jointly-controlled entities over the past six years.
Figure 2I Changes in composition of controlled and jointly-controlled entities
2013 2014 2015 2016 2017 2018 Total
Controlled entities created* 16 5 9 7 7 12 56
Controlled entities abolished (3) (6) (3) (1) (6) (9) (28)
Jointly-controlled entities created*
6 1 3 3 1 4 18
Jointly-controlled entities abolished
(3) (1) (2) (4) - - (10)
Overall change for year 16 (1) 7 5 2 7 36
* Note: These figures include entities that were created prior to this but were only identified by audit during this year.
Source: Queensland Audit Office.
Of the 74 entities (56 controlled and 18 jointly controlled) created over the last six years, 58 still exist and 43 are currently active. The remainder have since been wound up. Under the Statutory Bodies Financial Arrangements Act 1982, councils are required to obtain permission from the Queensland Treasurer to create a controlled entity, unless they consider the entity to be a beneficial enterprise. When the Treasurer’s approval is gained, notifications are sent to the relevant minister and the Auditor-General.
0
20
40
60
80
100
120
140
2012–13 2013–14 2014–15 2015–16 2016–17 2017–18
Num
ber o
f ent
ities
Controlled entity Jointly-controlled entity
Local government entities: 2017–18 results of financial audits (Report 18: 2018–19)
24
The South East Queensland (SEQ) segment has created 24 related entities since 2013, with Brisbane City Council, Ipswich City Council, and Redland City Council responsible for the majority (16 entities). Twenty-one of these entities still exist. Of these, 10 entities are for development and investment purposes, while the remaining are for community events, arts, and environmental activities.
The level of oversight councils exercise over their controlled entities varies significantly. Some have limited oversight, while others have detailed policies that establish governance, accountability, and monitoring frameworks.
For the past four years, we have reported that most councils do not have adequate monitoring in place over their controlled entities. Without this, councils risk inappropriate transactions or other business decisions being made without their knowledge and input. There is also an increased risk that councils’ objectives will not be met.
Councils with existing controlled entities or plans to create them should have policies in place to ensure that:
• the council develops a business case establishing the need for and objectives of the entity prior to creating it
• the council implements monitoring controls over the entity’s key processes
• the entity regularly reports to council governance committees.
In prior reports, we have recommended that councils review the monitoring controls and memberships of their controlled entities’ boards, and that the Department of Local Government, Racing and Multicultural Affairs mandates that the financial statements of controlled entities be made publicly available.
As shown in Figure 2A, this year, 52 controlled entities and 28 jointly-controlled entities prepared financial statements for audit.
Of the 52 controlled entities, 32 have published their financial statements (2016–17: 26 entities). These entities used three methods of publication, either publishing:
• directly on their website or their parent council’s website
• through council meeting minutes, which are published on a separate part of the council website
• on the Australian Charities and Not-for-profit Commission's website.
Of the 28 jointly-controlled entities that prepared financial statements, 14 entities have published their financial statements on their own website or that of the Australian Charities and Not-for-profit Commission.
Local government entities: 2017–18 results of financial audits (Report 18: 2018–19)
25
3. Financial performance, position, and sustainability
This chapter analyses the financial performance, position, and sustainability of Queensland local governments. Our analysis alerts users to future challenges, including existing and emerging risks facing the councils. This chapter summarises the sector’s results. Appendix H contains the details of the financial sustainability measures (ratios) used and the 2017–18 results for each council. These measures remain unchanged from those used last year.
Conclusion Overall, the local government sector continues to spend more than it earns with 22 councils being at higher risk of becoming unsustainable.
While the sector’s operating surplus for the year of $333.7 million notionally decreased by $281.3 million from 2016–17, this is distorted by a $232.6 million advance payment of Financial Assistance Grants by the Australian Government in June 2017.
Councils are working to curb their expenses and increase their own-source revenue, but they are affected by rising service demands, changes in economic activity, and volatile revenue sources (such as grants). To remain financially sustainable, councils need to critically review the services and service levels they provide to their community and continually focus on long-term planning. While they continue to make operating losses, councils will be dependent on grant funding to maintain service delivery to their communities.
There is a continuing trend of councils amassing cash in preference to debt to fund infrastructure renewals and upgrades. Consequently, the relevance of the net financial liabilities ratio is significantly diminished, and a cash expense cover ratio may be more relevant for assessing councils’ financial sustainability in the short term.
Councils’ reluctance to borrow is partly due to the economic circumstances in some regions where operating surpluses are not achieved year on year and the ability to service debt is reduced. Twenty councils are currently maintaining unrestricted cash (that is, cash not tied to specific projects under funding agreements or legislation) balances that could sustain their operating activities for 12 months or longer. However, nine councils could only sustain their operating activities for less than three months. Based on benchmarks commonly reported in other Australian jurisdictions, we consider a target of between three to six months to be adequate.
Local government entities: 2017–18 results of financial audits (Report 18: 2018–19)
26
Some councils with low cash reserves have access to working capital facilities at Queensland Treasury Corporation to effectively manage their cash balance. However, two of the nine councils—Kowanyama Aboriginal Shire Council, and Wujal Wujal Aboriginal Shire Council—have average operating losses exceeding 20 per cent. These councils need to actively manage their cash balances or risk being unable to pay their debts on time in the short term without using restricted cash for incorrect purposes and breaching their respective grant agreements. Restricted cash is tied to specific projects under grants, funding agreements or legislation.
On average, the sector’s infrastructure assets have a remaining useful life of 48 years. This is consistent with our analysis from 2013–14. Over the past five years, Rural/Remote councils and those in South East Queensland have maintained or increased the average remaining useful lives of their infrastructure assets. They have mainly done this by renewing their assets following natural disasters and constructing new assets in growth areas that represent a significant portion of the councils’ asset base. The remaining useful lives in all other regions have decreased during the last five years, indicating that these councils are not replacing or renewing their assets as quickly as they are using them.
Accounting for the rehabilitation of landfill sites continues to be a work in progress for the sector, although significant improvements have been made. The rehabilitation of landfill sites is a major long-term obligation for most councils. Monitoring costs continue for 20 to 30 years after the landfill site closes. Councils have adopted inconsistent approaches, some of which have the potential to cause them sustainability issues in the future as they may not be accurately calculating their future rehabilitation obligations and therefore not budgeting appropriately.
Financial sustainability
Financial sustainability risk assessments Figure 3A summarises the risk assessments of the financial sustainability of the 77 councils. (Our risk assessment criteria are included in Appendix H, Figure H3.) Unfinished audits for 2017–18 have been included at their previous year’s assessment.
To enable like-for-like comparisons, we have used the six segments identified by the Local Government Association of Queensland: Coastal, Indigenous, Resources, Rural/Regional, Rural/Remote, and South East Queensland (SEQ) councils.
Local government entities: 2017–18 results of financial audits (Report 18: 2018–19)
27
Figure 3A Summary of financial sustainability risk assessment
Source: Queensland Audit Office.
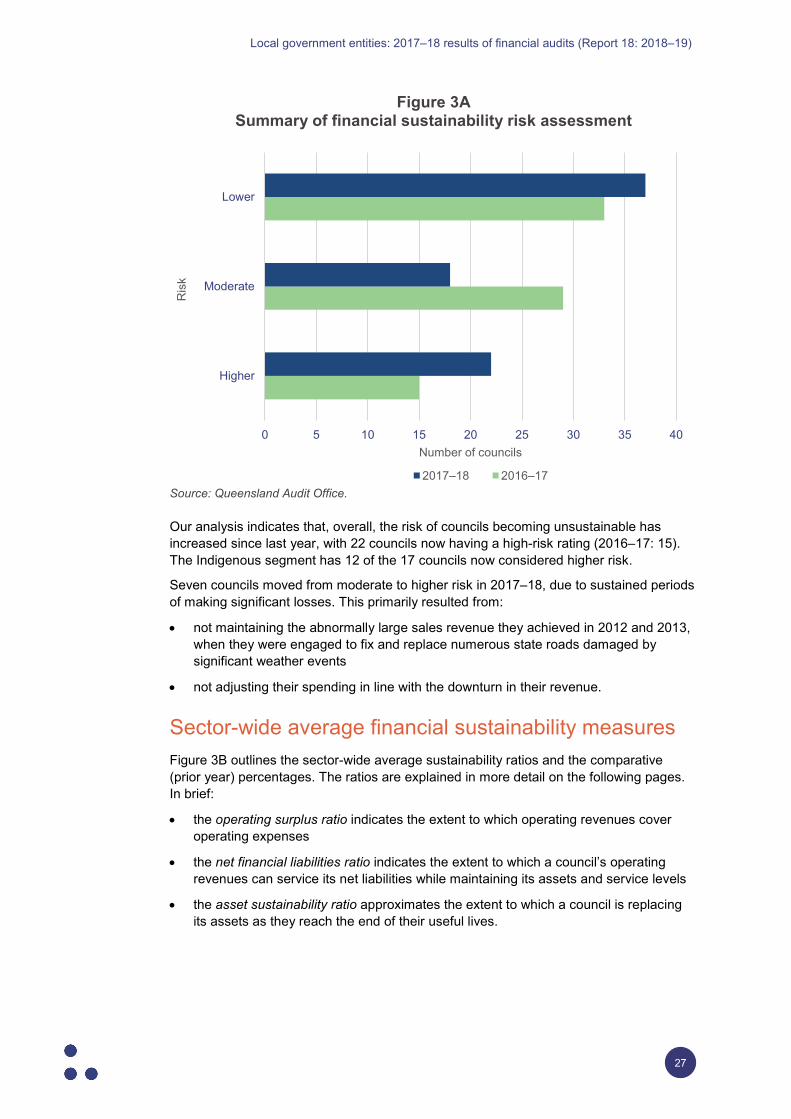
Our analysis indicates that, overall, the risk of councils becoming unsustainable has increased since last year, with 22 councils now having a high-risk rating (2016–17: 15). The Indigenous segment has 12 of the 17 councils now considered higher risk.
Seven councils moved from moderate to higher risk in 2017–18, due to sustained periods of making significant losses. This primarily resulted from:
• not maintaining the abnormally large sales revenue they achieved in 2012 and 2013, when they were engaged to fix and replace numerous state roads damaged by significant weather events
• not adjusting their spending in line with the downturn in their revenue.
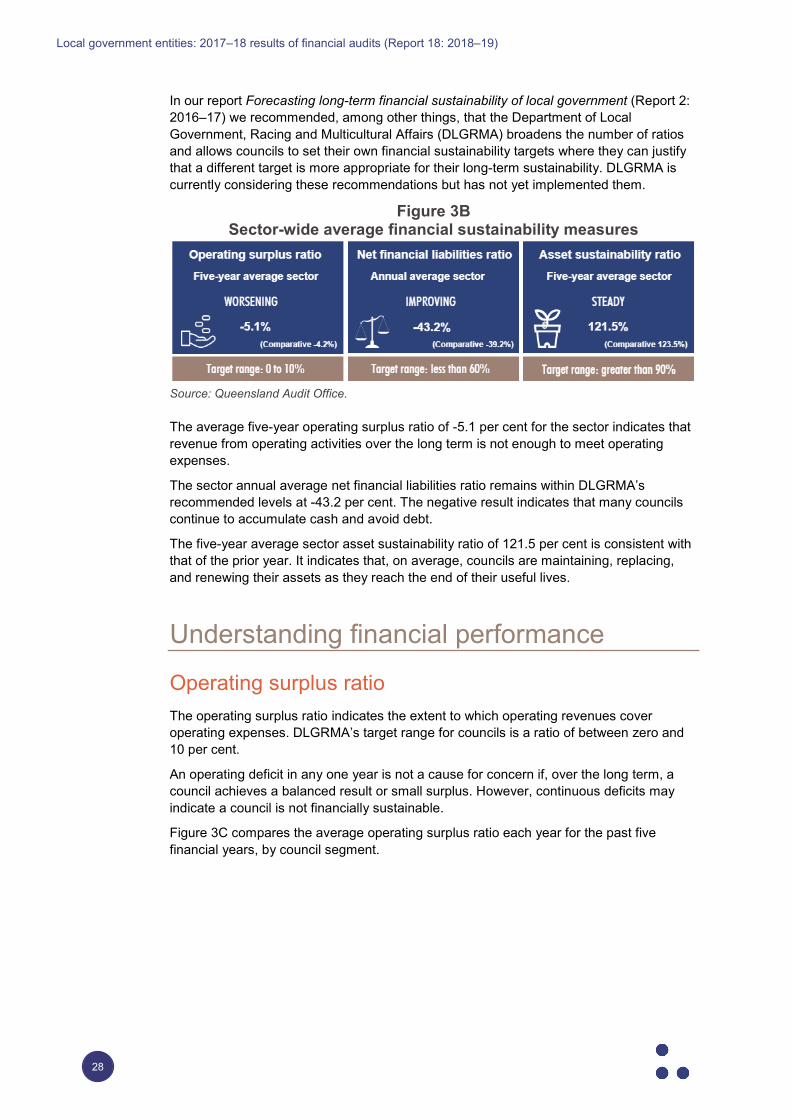
Sector-wide average financial sustainability measures Figure 3B outlines the sector-wide average sustainability ratios and the comparative (prior year) percentages. The ratios are explained in more detail on the following pages. In brief:
• the operating surplus ratio indicates the extent to which operating revenues cover operating expenses
• the net financial liabilities ratio indicates the extent to which a council’s operating revenues can service its net liabilities while maintaining its assets and service levels
• the asset sustainability ratio approximates the extent to which a council is replacing its assets as they reach the end of their useful lives.
0 5 10 15 20 25 30 35 40
Higher
Moderate
Lower
Number of councils
Ris
k
2017–18 2016–17
Local government entities: 2017–18 results of financial audits (Report 18: 2018–19)
28
In our report Forecasting long-term financial sustainability of local government (Report 2: 2016–17) we recommended, among other things, that the Department of Local Government, Racing and Multicultural Affairs (DLGRMA) broadens the number of ratios and allows councils to set their own financial sustainability targets where they can justify that a different target is more appropriate for their long-term sustainability. DLGRMA is currently considering these recommendations but has not yet implemented them.
Figure 3B Sector-wide average financial sustainability measures
Source: Queensland Audit Office.
The average five-year operating surplus ratio of -5.1 per cent for the sector indicates that revenue from operating activities over the long term is not enough to meet operating expenses.
The sector annual average net financial liabilities ratio remains within DLGRMA’s recommended levels at -43.2 per cent. The negative result indicates that many councils continue to accumulate cash and avoid debt.
The five-year average sector asset sustainability ratio of 121.5 per cent is consistent with that of the prior year. It indicates that, on average, councils are maintaining, replacing, and renewing their assets as they reach the end of their useful lives.
Understanding financial performance
Operating surplus ratio The operating surplus ratio indicates the extent to which operating revenues cover operating expenses. DLGRMA’s target range for councils is a ratio of between zero and 10 per cent.
An operating deficit in any one year is not a cause for concern if, over the long term, a council achieves a balanced result or small surplus. However, continuous deficits may indicate a council is not financially sustainable.
Figure 3C compares the average operating surplus ratio each year for the past five financial years, by council segment.
Local government entities: 2017–18 results of financial audits (Report 18: 2018–19)
29
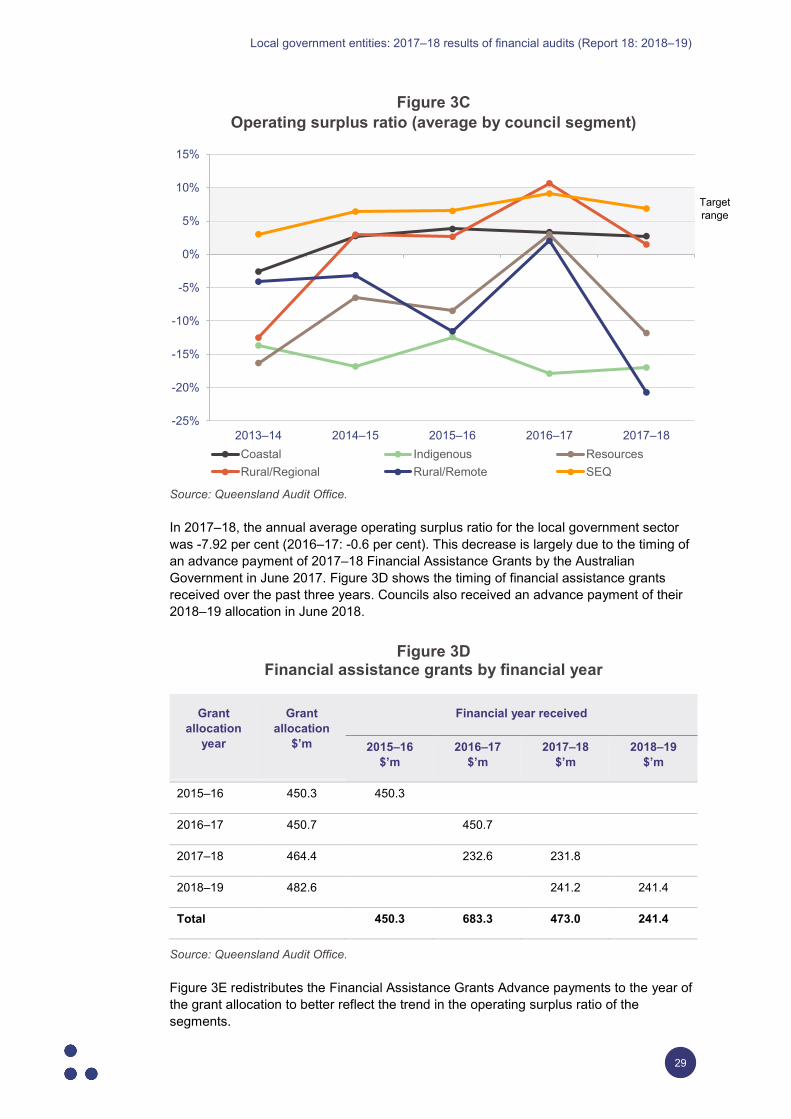
Figure 3C Operating surplus ratio (average by council segment)
Source: Queensland Audit Office.
In 2017–18, the annual average operating surplus ratio for the local government sector was -7.92 per cent (2016–17: -0.6 per cent). This decrease is largely due to the timing of an advance payment of 2017–18 Financial Assistance Grants by the Australian Government in June 2017. Figure 3D shows the timing of financial assistance grants received over the past three years. Councils also received an advance payment of their 2018–19 allocation in June 2018.
Figure 3D Financial assistance grants by financial year
Grant allocation
year
Grant allocation
$’m
Financial year received
2015–16 $’m
2016–17 $’m
2017–18 $’m
2018–19 $’m
2015–16 450.3 450.3
2016–17 450.7 450.7
2017–18 464.4 232.6 231.8
2018–19 482.6 241.2 241.4
Total 450.3 683.3 473.0 241.4
Source: Queensland Audit Office.
Figure 3E redistributes the Financial Assistance Grants Advance payments to the year of the grant allocation to better reflect the trend in the operating surplus ratio of the segments.
Target range
-25%
-20%
-15%
-10%
-5%
0%
5%
10%
15%
2013–14 2014–15 2015–16 2016–17 2017–18Coastal Indigenous ResourcesRural/Regional Rural/Remote SEQ
Local government entities: 2017–18 results of financial audits (Report 18: 2018–19)
30
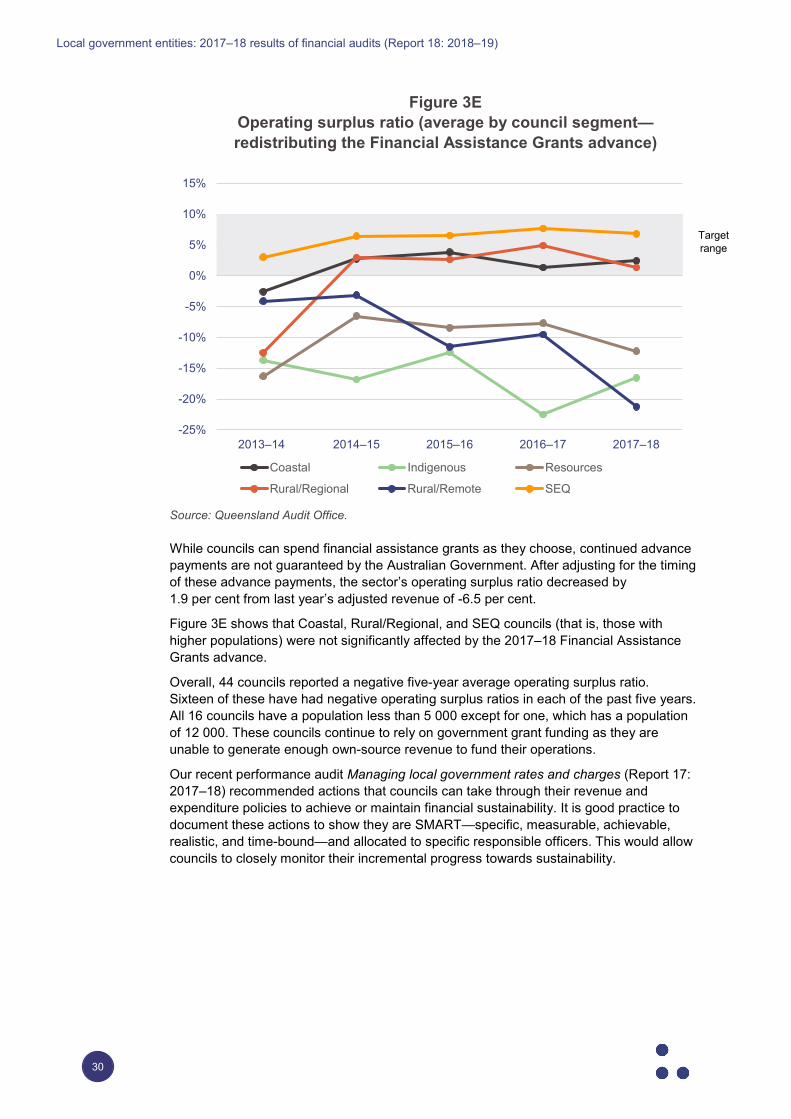
Figure 3E Operating surplus ratio (average by council segment—redistributing the Financial Assistance Grants advance)
Source: Queensland Audit Office.
While councils can spend financial assistance grants as they choose, continued advance payments are not guaranteed by the Australian Government. After adjusting for the timing of these advance payments, the sector’s operating surplus ratio decreased by 1.9 per cent from last year’s adjusted revenue of -6.5 per cent.
Figure 3E shows that Coastal, Rural/Regional, and SEQ councils (that is, those with higher populations) were not significantly affected by the 2017–18 Financial Assistance Grants advance.
Overall, 44 councils reported a negative five-year average operating surplus ratio. Sixteen of these have had negative operating surplus ratios in each of the past five years. All 16 councils have a population less than 5 000 except for one, which has a population of 12 000. These councils continue to rely on government grant funding as they are unable to generate enough own-source revenue to fund their operations.
Our recent performance audit Managing local government rates and charges (Report 17: 2017–18) recommended actions that councils can take through their revenue and expenditure policies to achieve or maintain financial sustainability. It is good practice to document these actions to show they are SMART—specific, measurable, achievable, realistic, and time-bound—and allocated to specific responsible officers. This would allow councils to closely monitor their incremental progress towards sustainability.
Target range
-25%
-20%
-15%
-10%
-5%
0%
5%
10%
15%
2013–14 2014–15 2015–16 2016–17 2017–18
Coastal Indigenous Resources
Rural/Regional Rural/Remote SEQ
Local government entities: 2017–18 results of financial audits (Report 18: 2018–19)
31
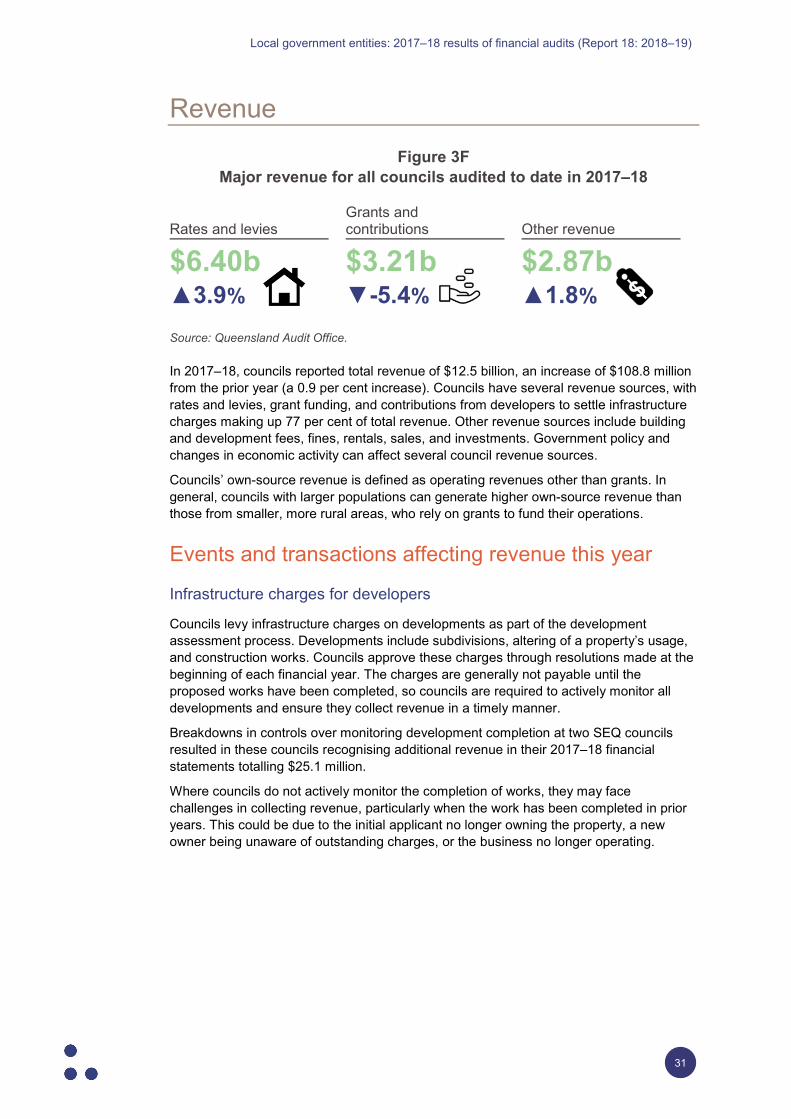
Revenue Figure 3F
Major revenue for all councils audited to date in 2017–18
Rates and levies Grants and contributions Other revenue
$6.40b ▲3.9%
$3.21b ▼-5.4%
$2.87b ▲1.8%
Source: Queensland Audit Office.
In 2017–18, councils reported total revenue of $12.5 billion, an increase of $108.8 million from the prior year (a 0.9 per cent increase). Councils have several revenue sources, with rates and levies, grant funding, and contributions from developers to settle infrastructure charges making up 77 per cent of total revenue. Other revenue sources include building and development fees, fines, rentals, sales, and investments. Government policy and changes in economic activity can affect several council revenue sources.
Councils’ own-source revenue is defined as operating revenues other than grants. In general, councils with larger populations can generate higher own-source revenue than those from smaller, more rural areas, who rely on grants to fund their operations.
Events and transactions affecting revenue this year
Infrastructure charges for developers
Councils levy infrastructure charges on developments as part of the development assessment process. Developments include subdivisions, altering of a property’s usage, and construction works. Councils approve these charges through resolutions made at the beginning of each financial year. The charges are generally not payable until the proposed works have been completed, so councils are required to actively monitor all developments and ensure they collect revenue in a timely manner.
Breakdowns in controls over monitoring development completion at two SEQ councils resulted in these councils recognising additional revenue in their 2017–18 financial statements totalling $25.1 million.
Where councils do not actively monitor the completion of works, they may face challenges in collecting revenue, particularly when the work has been completed in prior years. This could be due to the initial applicant no longer owning the property, a new owner being unaware of outstanding charges, or the business no longer operating.
Local government entities: 2017–18 results of financial audits (Report 18: 2018–19)
32
Future challenges and emerging risks
New accounting standards
The new Australian Accounting Standards Board (AASB) 15 Revenue from Contracts with Customers and AASB 1058 Income of Not-for-Profit Entities standards, take effect from 1 July 2019.
Councils have started to analyse their different revenue sources to determine the impact of these standards. They have identified that their current grant funding agreements vary in terms of specific detail relevant to AASB 15. They have also identified that, although some grants have performance obligations, the terms of these grants do not necessarily support the specific criteria for AASB 15.
To facilitate an efficient and consistent approach, DLGRMA has established a working group with representatives from councils, the department, and the Queensland Audit Office to review the terms of common grants across the sector. Once the review is complete, DLGRMA will issue guidance to all councils.
While this working group will look at common grants, each council will still need to assess its various revenue streams and other less common grants.
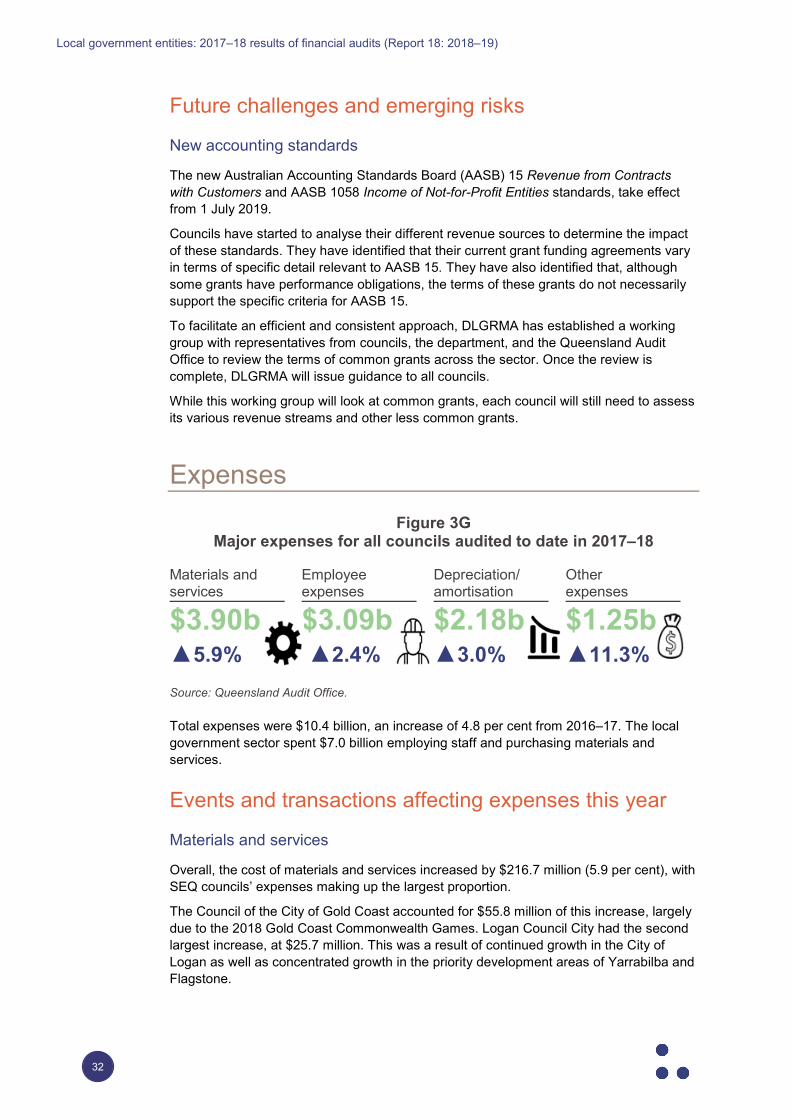
Expenses Figure 3G
Major expenses for all councils audited to date in 2017–18
Materials and services
Employee expenses
Depreciation/ amortisation
Other expenses
$3.90b ▲5.9%
$3.09b ▲2.4%
$2.18b ▲3.0%
$1.25b ▲11.3%
Source: Queensland Audit Office.
Total expenses were $10.4 billion, an increase of 4.8 per cent from 2016–17. The local government sector spent $7.0 billion employing staff and purchasing materials and services.
Events and transactions affecting expenses this year
Materials and services
Overall, the cost of materials and services increased by $216.7 million (5.9 per cent), with SEQ councils’ expenses making up the largest proportion.
The Council of the City of Gold Coast accounted for $55.8 million of this increase, largely due to the 2018 Gold Coast Commonwealth Games. Logan Council City had the second largest increase, at $25.7 million. This was a result of continued growth in the City of Logan as well as concentrated growth in the priority development areas of Yarrabilba and Flagstone.
Local government entities: 2017–18 results of financial audits (Report 18: 2018–19)
33
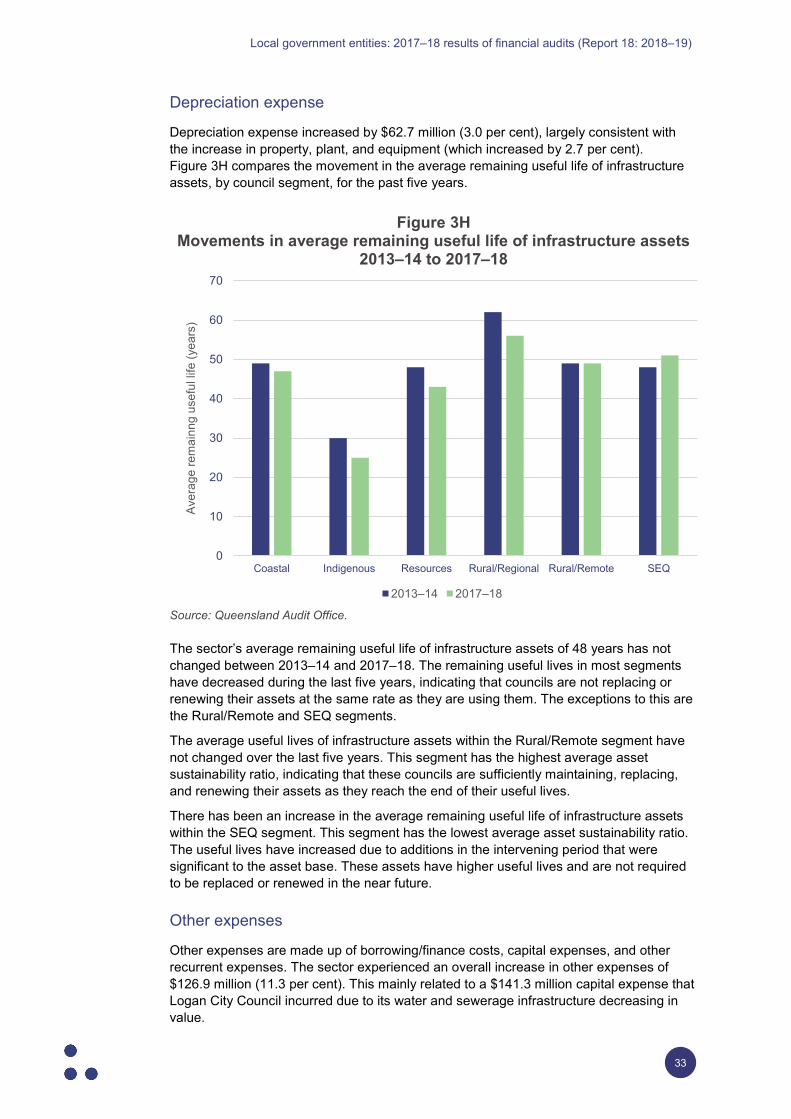
Depreciation expense
Depreciation expense increased by $62.7 million (3.0 per cent), largely consistent with the increase in property, plant, and equipment (which increased by 2.7 per cent). Figure 3H compares the movement in the average remaining useful life of infrastructure assets, by council segment, for the past five years.
Figure 3H Movements in average remaining useful life of infrastructure assets
2013–14 to 2017–18
Source: Queensland Audit Office.
The sector’s average remaining useful life of infrastructure assets of 48 years has not changed between 2013–14 and 2017–18. The remaining useful lives in most segments have decreased during the last five years, indicating that councils are not replacing or renewing their assets at the same rate as they are using them. The exceptions to this are the Rural/Remote and SEQ segments.
The average useful lives of infrastructure assets within the Rural/Remote segment have not changed over the last five years. This segment has the highest average asset sustainability ratio, indicating that these councils are sufficiently maintaining, replacing, and renewing their assets as they reach the end of their useful lives.
There has been an increase in the average remaining useful life of infrastructure assets within the SEQ segment. This segment has the lowest average asset sustainability ratio. The useful lives have increased due to additions in the intervening period that were significant to the asset base. These assets have higher useful lives and are not required to be replaced or renewed in the near future.
Other expenses
Other expenses are made up of borrowing/finance costs, capital expenses, and other recurrent expenses. The sector experienced an overall increase in other expenses of $126.9 million (11.3 per cent). This mainly related to a $141.3 million capital expense that Logan City Council incurred due to its water and sewerage infrastructure decreasing in value.
0
10
20
30
40
50
60
70
Coastal Indigenous Resources Rural/Regional Rural/Remote SEQ
Aver
age
rem
ainn
g us
eful
life
(yea
rs)
2013–14 2017–18
Local government entities: 2017–18 results of financial audits (Report 18: 2018–19)
34
Future challenges and emerging risks
New accounting standard
The introduction of AASB 16 Leases, from 1 July 2019, provides a single lease accounting model for leases. This will result in almost all operating leases being recognised on the statement of financial position, as the distinction between operating and finance leases will be removed. Under this standard, most leases previously not reported as assets and liabilities will be brought onto the balance sheet. The timing of recognition of expenses will also change.
In the local government sector, this standard will have the biggest impact on Brisbane City Council. It quantified the likely impact of this standard in its 2017–18 financial statements as a decrease of approximately $150 million to net assets.
For other councils, the biggest impact will be in accounting for peppercorn leases. Peppercorn leases involve below-market payments and are common within the sector, with councils often receiving these leases from the state government.
In November 2018, the Australian Accounting Standards Board proposed deferring the mandatory valuation requirements of peppercorn leases. Part of the reason for the deferral was significant valuation issues. Measuring the value of these leases at fair value is difficult, due to the nature of the premises leased and restrictions on the use of them. Councils choosing to defer valuation will be required to make relevant disclosures about their arrangements.
Understanding financial position Financial position is measured by a council’s net assets, that is, the difference between total assets and total liabilities. A growing net asset position indicates that a council has greater capacity to meet an increase in future service demands. At 30 June 2018, the net asset position of councils totalled $109.5 billion, which is a 2.6 per cent improvement from the prior year.
Councils’ borrowings totalled $5.4 billion (2016–17: $5.6 billion). Councils use debt funding to build their infrastructure and other assets that provide long-term services to their communities.
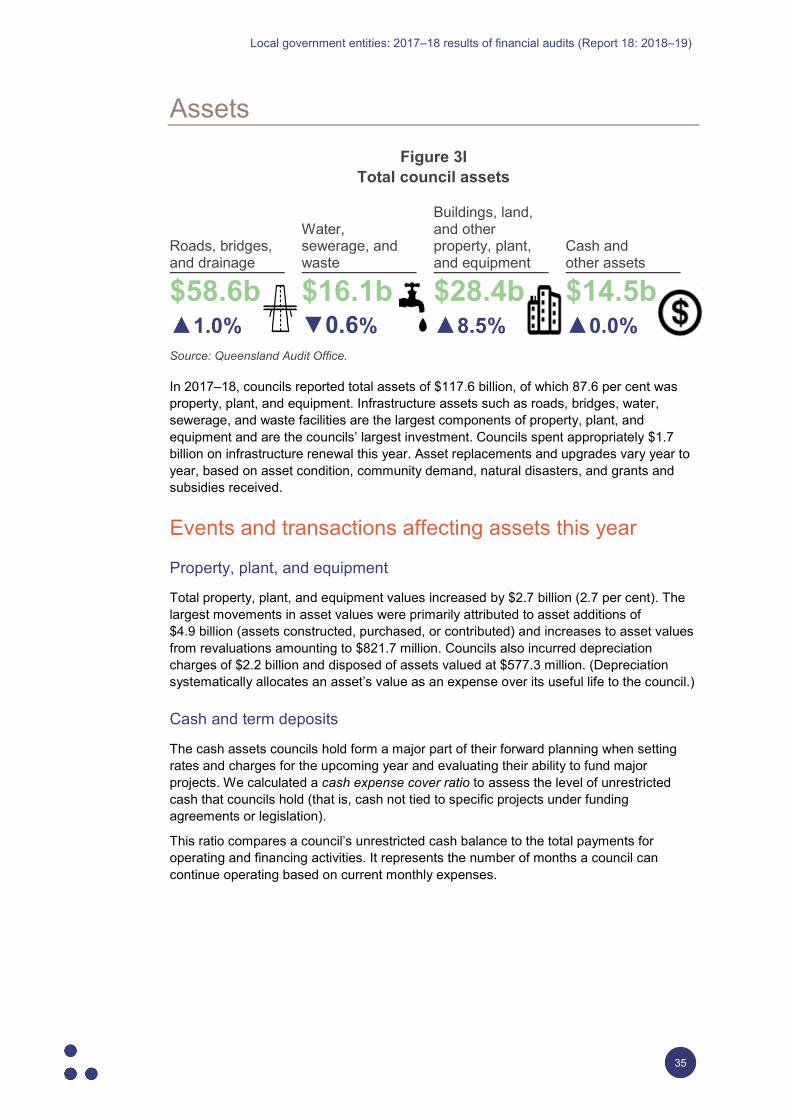
Local government entities: 2017–18 results of financial audits (Report 18: 2018–19)
35
Assets Figure 3I
Total council assets
Roads, bridges, and drainage
Water, sewerage, and waste
Buildings, land, and other property, plant, and equipment
Cash and other assets
$58.6b ▲1.0%
$16.1b ▼0.6%
$28.4b ▲8.5%
$14.5b ▲0.0%
Source: Queensland Audit Office.
In 2017–18, councils reported total assets of $117.6 billion, of which 87.6 per cent was property, plant, and equipment. Infrastructure assets such as roads, bridges, water, sewerage, and waste facilities are the largest components of property, plant, and equipment and are the councils’ largest investment. Councils spent appropriately $1.7 billion on infrastructure renewal this year. Asset replacements and upgrades vary year to year, based on asset condition, community demand, natural disasters, and grants and subsidies received.
Events and transactions affecting assets this year
Property, plant, and equipment
Total property, plant, and equipment values increased by $2.7 billion (2.7 per cent). The largest movements in asset values were primarily attributed to asset additions of $4.9 billion (assets constructed, purchased, or contributed) and increases to asset values from revaluations amounting to $821.7 million. Councils also incurred depreciation charges of $2.2 billion and disposed of assets valued at $577.3 million. (Depreciation systematically allocates an asset’s value as an expense over its useful life to the council.)
Cash and term deposits
The cash assets councils hold form a major part of their forward planning when setting rates and charges for the upcoming year and evaluating their ability to fund major projects. We calculated a cash expense cover ratio to assess the level of unrestricted cash that councils hold (that is, cash not tied to specific projects under funding agreements or legislation).
This ratio compares a council’s unrestricted cash balance to the total payments for operating and financing activities. It represents the number of months a council can continue operating based on current monthly expenses.
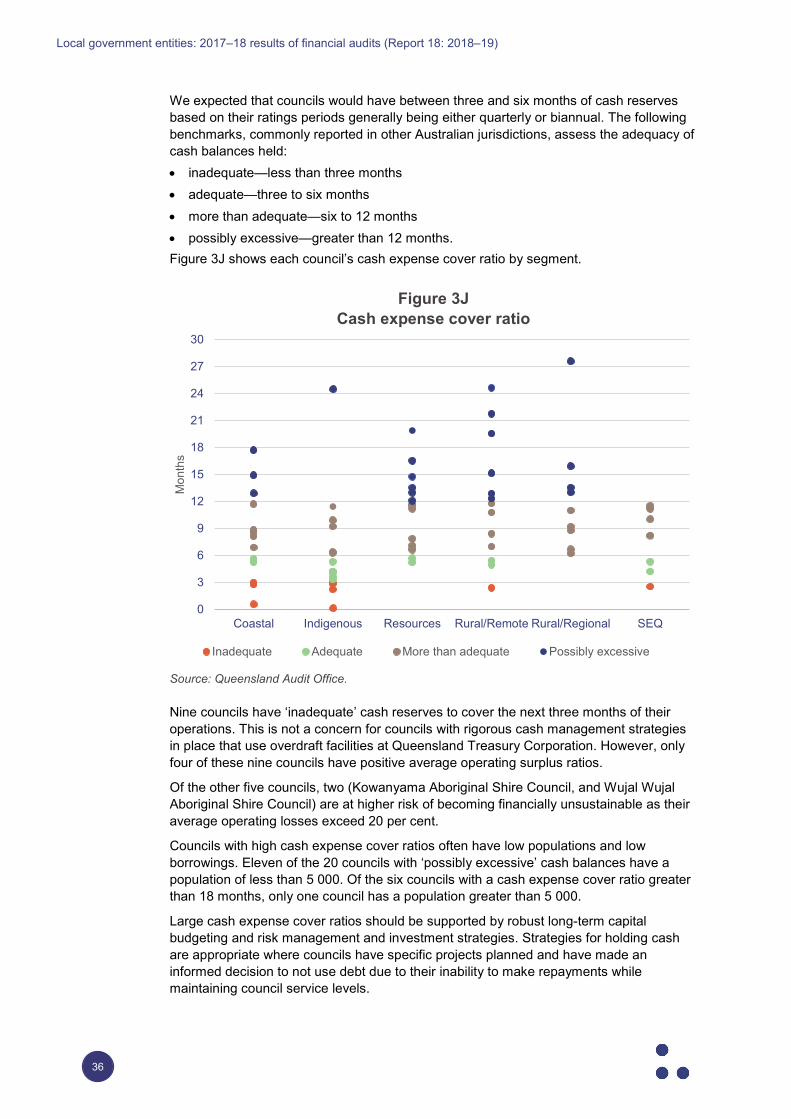
Local government entities: 2017–18 results of financial audits (Report 18: 2018–19)
36
We expected that councils would have between three and six months of cash reserves based on their ratings periods generally being either quarterly or biannual. The following benchmarks, commonly reported in other Australian jurisdictions, assess the adequacy of cash balances held: • inadequate—less than three months • adequate—three to six months • more than adequate—six to 12 months • possibly excessive—greater than 12 months. Figure 3J shows each council’s cash expense cover ratio by segment.
Figure 3J Cash expense cover ratio
Source: Queensland Audit Office.
Nine councils have ‘inadequate’ cash reserves to cover the next three months of their operations. This is not a concern for councils with rigorous cash management strategies in place that use overdraft facilities at Queensland Treasury Corporation. However, only four of these nine councils have positive average operating surplus ratios.
Of the other five councils, two (Kowanyama Aboriginal Shire Council, and Wujal Wujal Aboriginal Shire Council) are at higher risk of becoming financially unsustainable as their average operating losses exceed 20 per cent.
Councils with high cash expense cover ratios often have low populations and low borrowings. Eleven of the 20 councils with ‘possibly excessive’ cash balances have a population of less than 5 000. Of the six councils with a cash expense cover ratio greater than 18 months, only one council has a population greater than 5 000.
Large cash expense cover ratios should be supported by robust long-term capital budgeting and risk management and investment strategies. Strategies for holding cash are appropriate where councils have specific projects planned and have made an informed decision to not use debt due to their inability to make repayments while maintaining council service levels.
0
3
6
9
12
15
18
21
24
27
30
Coastal Indigenous Resources Rural/Remote Rural/Regional SEQ
Mon
ths
Inadequate Adequate More than adequate Possibly excessive
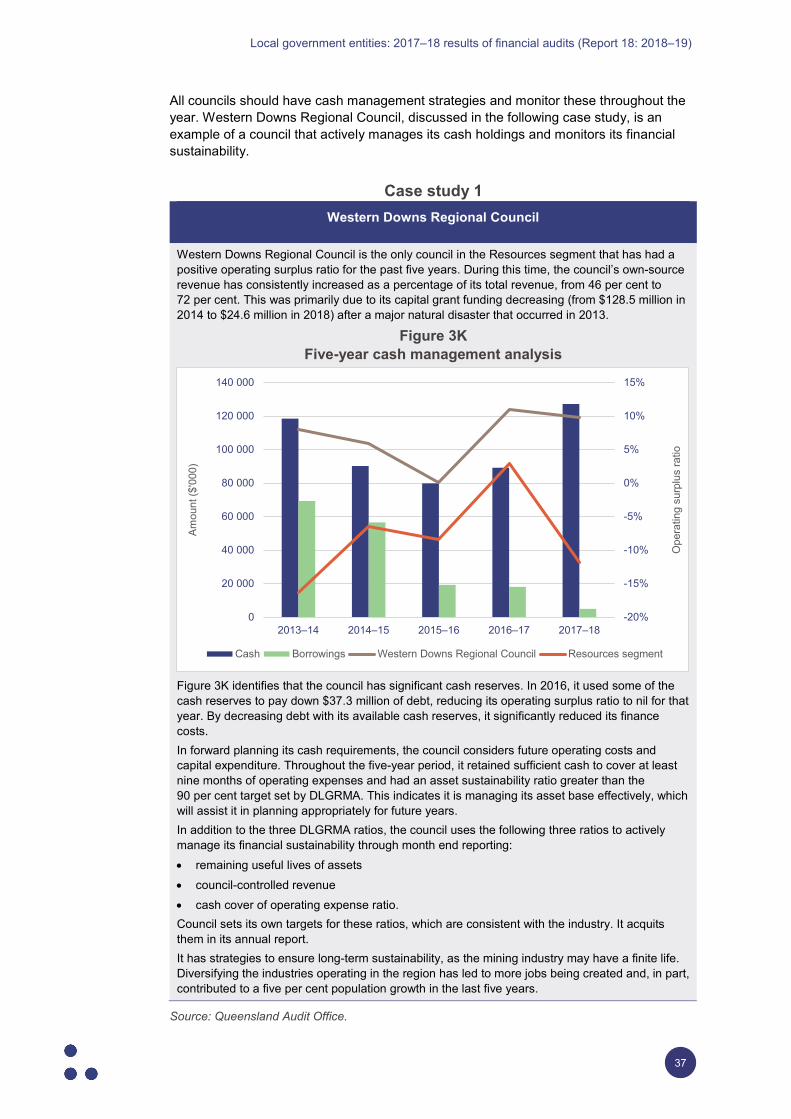
Local government entities: 2017–18 results of financial audits (Report 18: 2018–19)
37
All councils should have cash management strategies and monitor these throughout the year. Western Downs Regional Council, discussed in the following case study, is an example of a council that actively manages its cash holdings and monitors its financial sustainability.
Case study 1 Western Downs Regional Council
Western Downs Regional Council is the only council in the Resources segment that has had a positive operating surplus ratio for the past five years. During this time, the council’s own-source revenue has consistently increased as a percentage of its total revenue, from 46 per cent to 72 per cent. This was primarily due to its capital grant funding decreasing (from $128.5 million in 2014 to $24.6 million in 2018) after a major natural disaster that occurred in 2013.
Figure 3K Five-year cash management analysis
Figure 3K identifies that the council has significant cash reserves. In 2016, it used some of the cash reserves to pay down $37.3 million of debt, reducing its operating surplus ratio to nil for that year. By decreasing debt with its available cash reserves, it significantly reduced its finance costs. In forward planning its cash requirements, the council considers future operating costs and capital expenditure. Throughout the five-year period, it retained sufficient cash to cover at least nine months of operating expenses and had an asset sustainability ratio greater than the 90 per cent target set by DLGRMA. This indicates it is managing its asset base effectively, which will assist it in planning appropriately for future years. In addition to the three DLGRMA ratios, the council uses the following three ratios to actively manage its financial sustainability through month end reporting: • remaining useful lives of assets • council-controlled revenue • cash cover of operating expense ratio. Council sets its own targets for these ratios, which are consistent with the industry. It acquits them in its annual report. It has strategies to ensure long-term sustainability, as the mining industry may have a finite life. Diversifying the industries operating in the region has led to more jobs being created and, in part, contributed to a five per cent population growth in the last five years.
Source: Queensland Audit Office.
-20%
-15%
-10%
-5%
0%
5%
10%
15%
0
20 000
40 000
60 000
80 000
100 000
120 000
140 000
2013–14 2014–15 2015–16 2016–17 2017–18
Ope
ratin
g su
rplu
s ra
tio
Amou
nt ($
'000
)
Cash Borrowings Western Downs Regional Council Resources segment
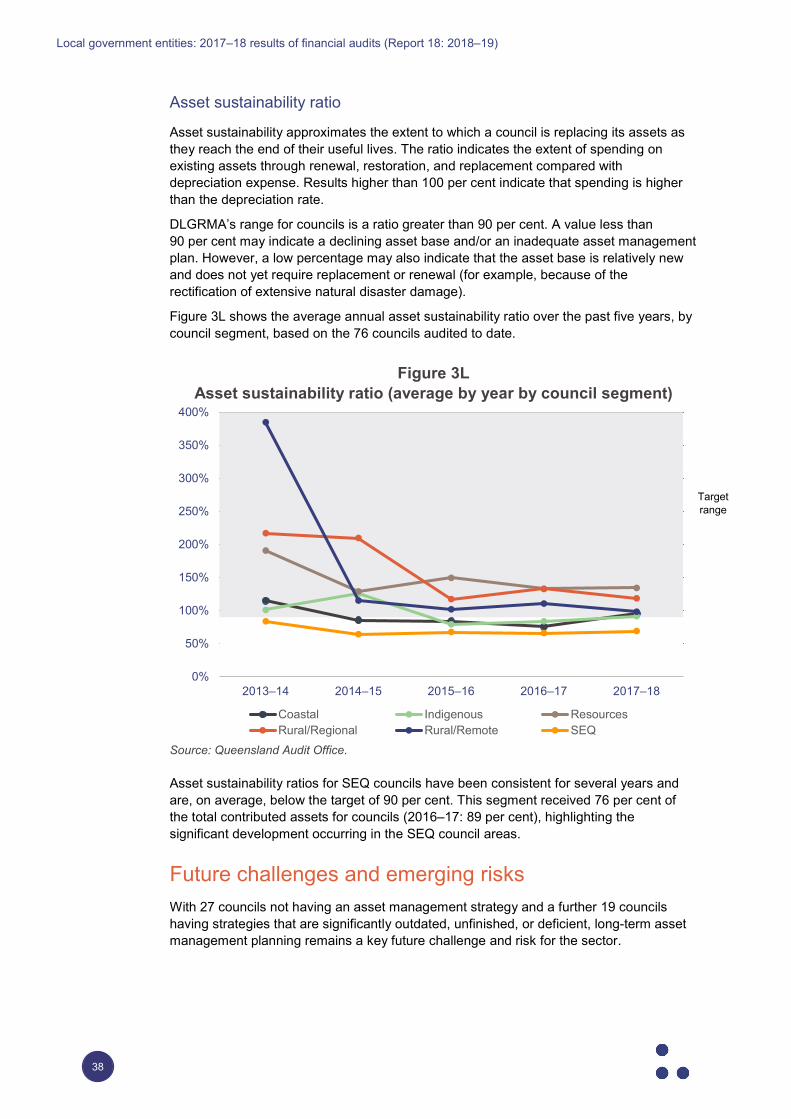
Local government entities: 2017–18 results of financial audits (Report 18: 2018–19)
38
Asset sustainability ratio
Asset sustainability approximates the extent to which a council is replacing its assets as they reach the end of their useful lives. The ratio indicates the extent of spending on existing assets through renewal, restoration, and replacement compared with depreciation expense. Results higher than 100 per cent indicate that spending is higher than the depreciation rate.
DLGRMA’s range for councils is a ratio greater than 90 per cent. A value less than 90 per cent may indicate a declining asset base and/or an inadequate asset management plan. However, a low percentage may also indicate that the asset base is relatively new and does not yet require replacement or renewal (for example, because of the rectification of extensive natural disaster damage).
Figure 3L shows the average annual asset sustainability ratio over the past five years, by council segment, based on the 76 councils audited to date.
Figure 3L Asset sustainability ratio (average by year by council segment)
Source: Queensland Audit Office.
Asset sustainability ratios for SEQ councils have been consistent for several years and are, on average, below the target of 90 per cent. This segment received 76 per cent of the total contributed assets for councils (2016–17: 89 per cent), highlighting the significant development occurring in the SEQ council areas.
Future challenges and emerging risks With 27 councils not having an asset management strategy and a further 19 councils having strategies that are significantly outdated, unfinished, or deficient, long-term asset management planning remains a key future challenge and risk for the sector.
Target range
0%
50%
100%
150%
200%
250%
300%
350%
400%
2013–14 2014–15 2015–16 2016–17 2017–18
Coastal Indigenous ResourcesRural/Regional Rural/Remote SEQ
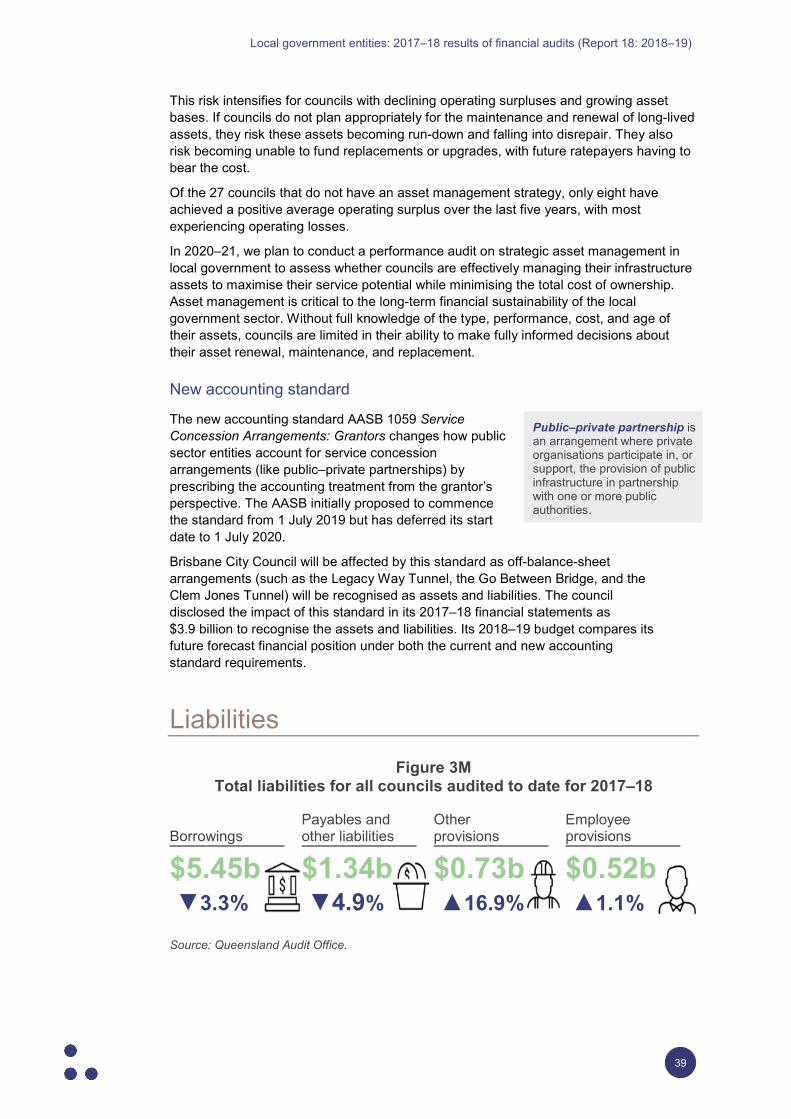
Local government entities: 2017–18 results of financial audits (Report 18: 2018–19)
39
This risk intensifies for councils with declining operating surpluses and growing asset bases. If councils do not plan appropriately for the maintenance and renewal of long-lived assets, they risk these assets becoming run-down and falling into disrepair. They also risk becoming unable to fund replacements or upgrades, with future ratepayers having to bear the cost.
Of the 27 councils that do not have an asset management strategy, only eight have achieved a positive average operating surplus over the last five years, with most experiencing operating losses.
In 2020–21, we plan to conduct a performance audit on strategic asset management in local government to assess whether councils are effectively managing their infrastructure assets to maximise their service potential while minimising the total cost of ownership. Asset management is critical to the long-term financial sustainability of the local government sector. Without full knowledge of the type, performance, cost, and age of their assets, councils are limited in their ability to make fully informed decisions about their asset renewal, maintenance, and replacement.
New accounting standard
The new accounting standard AASB 1059 Service Concession Arrangements: Grantors changes how public sector entities account for service concession arrangements (like public–private partnerships) by prescribing the accounting treatment from the grantor’s perspective. The AASB initially proposed to commence the standard from 1 July 2019 but has deferred its start date to 1 July 2020.
Brisbane City Council will be affected by this standard as off-balance-sheet arrangements (such as the Legacy Way Tunnel, the Go Between Bridge, and the Clem Jones Tunnel) will be recognised as assets and liabilities. The council disclosed the impact of this standard in its 2017–18 financial statements as $3.9 billion to recognise the assets and liabilities. Its 2018–19 budget compares its future forecast financial position under both the current and new accounting standard requirements.
Liabilities Figure 3M
Total liabilities for all councils audited to date for 2017–18
Borrowings Payables and other liabilities
Other provisions
Employee provisions
$5.45b ▼3.3%
$1.34b ▼4.9%
$0.73b ▲16.9%
$0.52b ▲1.1%
Source: Queensland Audit Office.
Public–private partnership is an arrangement where private organisations participate in, or support, the provision of public infrastructure in partnership with one or more public authorities.
Local government entities: 2017–18 results of financial audits (Report 18: 2018–19)
40
In 2017–18, councils reported total liabilities of $8.04 billion. Borrowings made up 68 per cent of total liabilities. Councils’ payables and other liabilities are mainly made up of amounts owed to suppliers. Provisions included obligations to rehabilitate landfills and quarries, as well as employee leave entitlements.
Events and transactions affecting debt this year
Borrowings
SEQ and Coastal councils hold the highest amount of debt ($5.1 billion). Councils have borrowed to fund infrastructure assets and other assets that provide services to their communities over a long period.
A total of 58 councils currently hold debt, with 28 councils having individual debt greater than $10 million. Overall, 12 councils increased their borrowings by a combined $59.6 million in the 2018 financial year.
Cairns Regional Council and Bundaberg Regional Council account for 73 per cent of the debt increase. Both councils drew additional debt to fund significant capital works within their regions. The two councils’ net financial liabilities ratios are well within DLGRMA’s target range, meaning they have adequate capacity to manage their debt.
Net financial liabilities ratio
The net financial liabilities ratio indicates the extent to which a council’s operating revenues can service its net liabilities (usually loans and leases) while maintaining its assets and community service levels. DLGRMA’s target range is for a net financial liabilities ratio below 60 per cent. If the net financial liabilities ratio is greater than 60 per cent of operating revenue, councils have limited capacity to increase loan borrowings and may experience stress in servicing their debt.
The sector average net financial liabilities ratio for 2017–18 is -43.2 per cent, which is within DLGRMA’s recommended levels of sustainability. It is substantially below zero because councils favour cash over debt. Consequently, this ratio is an irrelevant measure of financial sustainability for most councils.
Figure 3N compares the movement in the average net financial liabilities ratio over the past five years by council segment, based on the 76 councils audited to date.
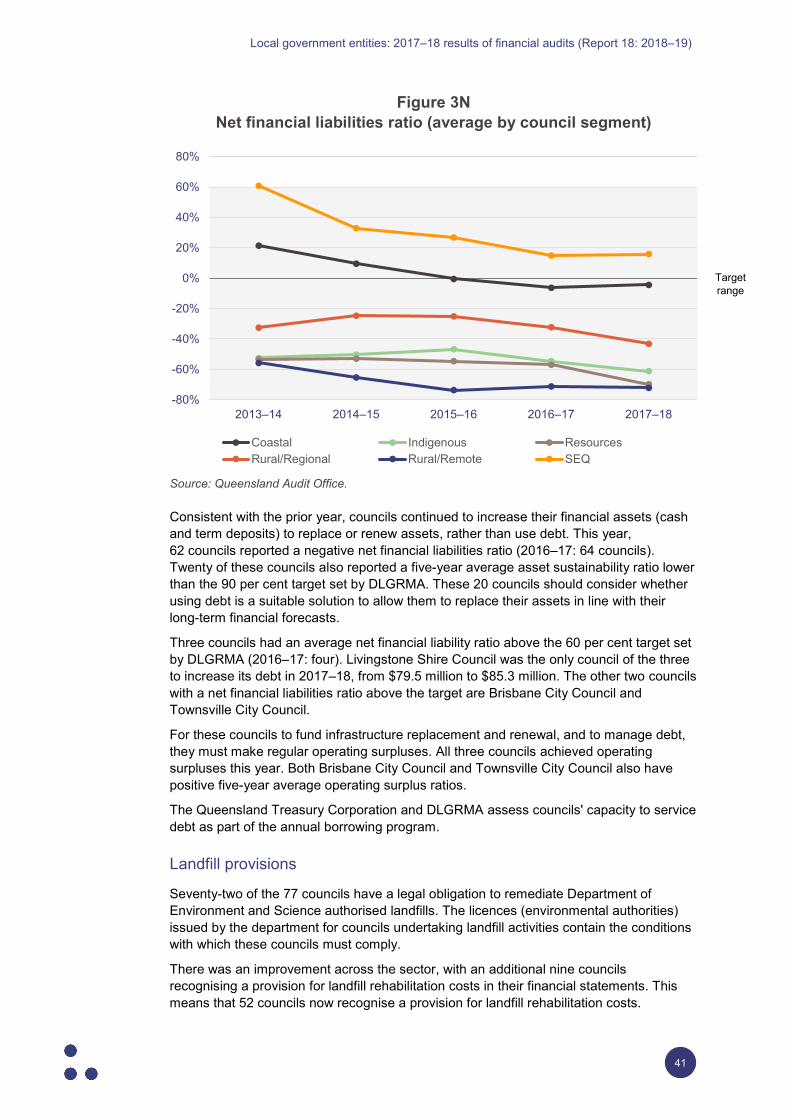
Local government entities: 2017–18 results of financial audits (Report 18: 2018–19)
41
Figure 3N Net financial liabilities ratio (average by council segment)
Source: Queensland Audit Office.
Consistent with the prior year, councils continued to increase their financial assets (cash and term deposits) to replace or renew assets, rather than use debt. This year, 62 councils reported a negative net financial liabilities ratio (2016–17: 64 councils). Twenty of these councils also reported a five-year average asset sustainability ratio lower than the 90 per cent target set by DLGRMA. These 20 councils should consider whether using debt is a suitable solution to allow them to replace their assets in line with their long-term financial forecasts.
Three councils had an average net financial liability ratio above the 60 per cent target set by DLGRMA (2016–17: four). Livingstone Shire Council was the only council of the three to increase its debt in 2017–18, from $79.5 million to $85.3 million. The other two councils with a net financial liabilities ratio above the target are Brisbane City Council and Townsville City Council.
For these councils to fund infrastructure replacement and renewal, and to manage debt, they must make regular operating surpluses. All three councils achieved operating surpluses this year. Both Brisbane City Council and Townsville City Council also have positive five-year average operating surplus ratios.
The Queensland Treasury Corporation and DLGRMA assess councils' capacity to service debt as part of the annual borrowing program.
Landfill provisions
Seventy-two of the 77 councils have a legal obligation to remediate Department of Environment and Science authorised landfills. The licences (environmental authorities) issued by the department for councils undertaking landfill activities contain the conditions with which these councils must comply.
There was an improvement across the sector, with an additional nine councils recognising a provision for landfill rehabilitation costs in their financial statements. This means that 52 councils now recognise a provision for landfill rehabilitation costs.
Target range
-80%
-60%
-40%
-20%
0%
20%
40%
60%
80%
2013–14 2014–15 2015–16 2016–17 2017–18
Coastal Indigenous ResourcesRural/Regional Rural/Remote SEQ
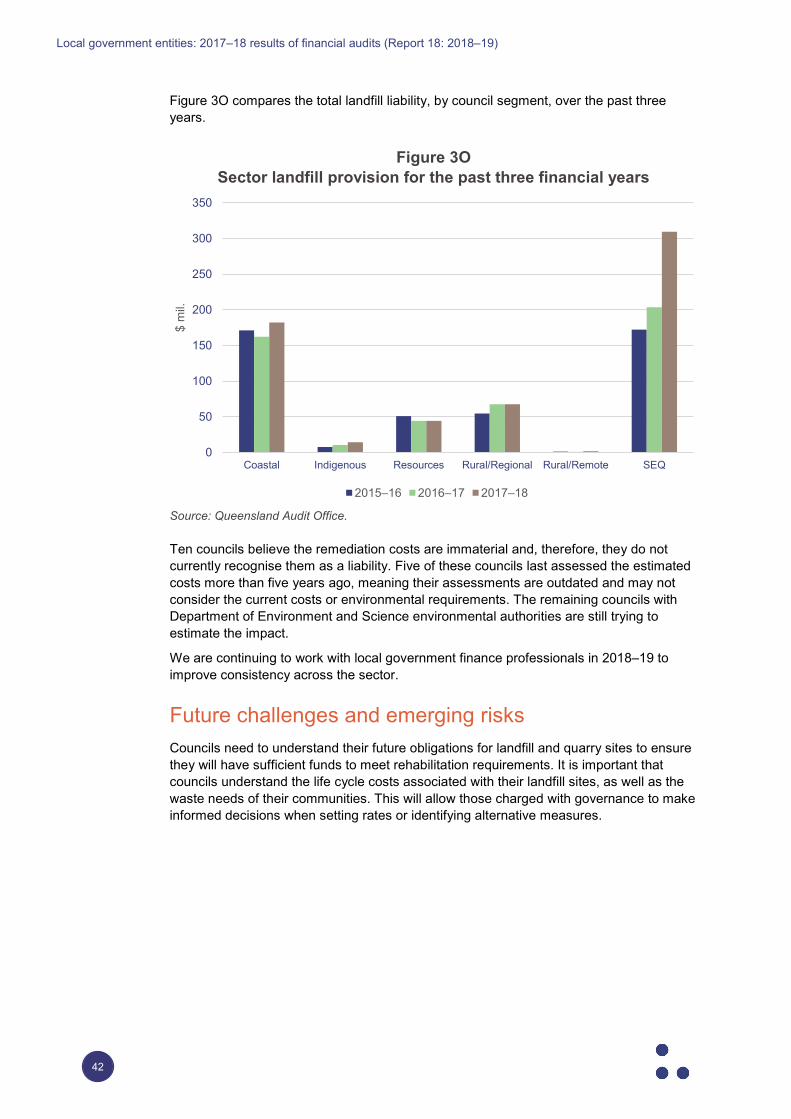
Local government entities: 2017–18 results of financial audits (Report 18: 2018–19)
42
Figure 3O compares the total landfill liability, by council segment, over the past three years.
Figure 3O Sector landfill provision for the past three financial years
Source: Queensland Audit Office.
Ten councils believe the remediation costs are immaterial and, therefore, they do not currently recognise them as a liability. Five of these councils last assessed the estimated costs more than five years ago, meaning their assessments are outdated and may not consider the current costs or environmental requirements. The remaining councils with Department of Environment and Science environmental authorities are still trying to estimate the impact.
We are continuing to work with local government finance professionals in 2018–19 to improve consistency across the sector.
Future challenges and emerging risks Councils need to understand their future obligations for landfill and quarry sites to ensure they will have sufficient funds to meet rehabilitation requirements. It is important that councils understand the life cycle costs associated with their landfill sites, as well as the waste needs of their communities. This will allow those charged with governance to make informed decisions when setting rates or identifying alternative measures.
0
50
100
150
200
250
300
350
Coastal Indigenous Resources Rural/Regional Rural/Remote SEQ
$ m
il.
2015–16 2016–17 2017–18
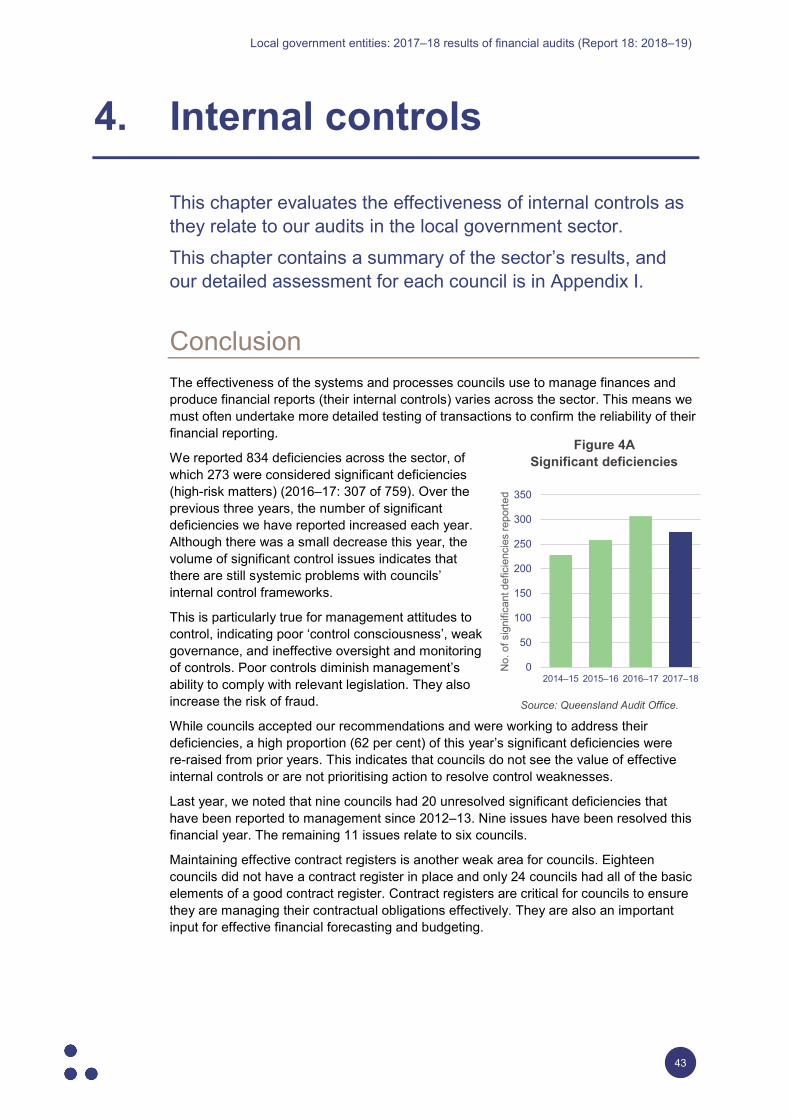
Local government entities: 2017–18 results of financial audits (Report 18: 2018–19)
43
4. Internal controls
This chapter evaluates the effectiveness of internal controls as they relate to our audits in the local government sector. This chapter contains a summary of the sector’s results, and our detailed assessment for each council is in Appendix I.
Conclusion The effectiveness of the systems and processes councils use to manage finances and produce financial reports (their internal controls) varies across the sector. This means we must often undertake more detailed testing of transactions to confirm the reliability of their financial reporting.
We reported 834 deficiencies across the sector, of which 273 were considered significant deficiencies (high-risk matters) (2016–17: 307 of 759). Over the previous three years, the number of significant deficiencies we have reported increased each year. Although there was a small decrease this year, the volume of significant control issues indicates that there are still systemic problems with councils’ internal control frameworks.
This is particularly true for management attitudes to control, indicating poor ‘control consciousness’, weak governance, and ineffective oversight and monitoring of controls. Poor controls diminish management’s ability to comply with relevant legislation. They also increase the risk of fraud.
While councils accepted our recommendations and were working to address their deficiencies, a high proportion (62 per cent) of this year’s significant deficiencies were re-raised from prior years. This indicates that councils do not see the value of effective internal controls or are not prioritising action to resolve control weaknesses.
Last year, we noted that nine councils had 20 unresolved significant deficiencies that have been reported to management since 2012–13. Nine issues have been resolved this financial year. The remaining 11 issues relate to six councils.
Maintaining effective contract registers is another weak area for councils. Eighteen councils did not have a contract register in place and only 24 councils had all of the basic elements of a good contract register. Contract registers are critical for councils to ensure they are managing their contractual obligations effectively. They are also an important input for effective financial forecasting and budgeting.
Source: Queensland Audit Office.
0
50
100
150
200
250
300
350
2014–15 2015–16 2016–17 2017–18
No.
of s
igni
fican
t def
icie
ncie
s re
porte
d
Figure 4ASignificant deficiencies
Local government entities: 2017–18 results of financial audits (Report 18: 2018–19)
44
Audit committees play a key role in ensuring management takes timely and effective action to address control deficiencies. Unlike councils in other states, Queensland councils are not mandated to form audit committees with independent chairs. Combined, the 18 councils without audit committees and the 26 councils without independent audit committee chairs account for 76 per cent of the significant deficiencies we reported for the sector this year. To provide effective independent oversight, these councils need to reinstate their audit committees and appoint appropriately qualified independent members.
Although required by legislation, six councils do not currently maintain an internal audit function. This further demonstrates the lack of value this sector places on internal control.
Our audit of internal controls We assess internal controls in councils to ensure they are suitably designed to:
• prevent, or detect and correct, material misstatements in the financial report
• achieve compliance with legislative requirements
• use public resources effectively.
Where we identify controls that we plan to rely on, we test how effectively they are operating to ensure they are functioning as intended.
We are required to communicate to management any deficiencies in internal controls.
Our rating of internal control deficiencies Our rating of internal control deficiencies allows management to gauge relative importance and prioritise remedial actions.
We increase the rating from a deficiency to a significant deficiency when:
• we consider immediate remedial action is required
• there is a risk of material misstatement in the financial statements
• there is a risk to reputation
• the non-compliance with policies and applicable laws and regulations is significant
• there is potential to cause financial loss including fraud
• management has not taken appropriate, timely action to resolve the deficiency.
Control deficiencies categorised by COSO component
We categorise internal controls using the Committee of the Sponsoring Organizations of the Treadway Commission (COSO) internal controls framework, which is widely recognised as a benchmark for designing and evaluating internal controls.
The framework identifies five components that need to be present and operating together for a successful internal control system. These components are explained in Appendix I.
A deficiency arises when internal controls are ineffective or missing, and are unable to prevent, or detect and correct, misstatements in the financial statements. A deficiency may also result in non-compliance with policies and applicable laws and regulations and/or inappropriate use of public resources.
Local government entities: 2017–18 results of financial audits (Report 18: 2018–19)
45
Control environment During 2017–18 we found:
• 23 councils continued to have significantly outdated, unfinalised, or non-existent asset management plans (2016–17: 30 councils)
• 9 councils did not have a current business continuity plan or disaster recovery plan (2016–17: 14 councils)
• 25 councils had outdated, inadequate, or insufficient policies and procedures for information technology, procurement, fraud, and corruption (2016–17: 24 councils).
Forty-two of the significant deficiencies we raised this year have been outstanding for more than 12 months. This indicates that, although councils accept the recommendations, they do not give priority to improving governance policies that influence their day-to-day operations. Councils need to be conscious of not creating an environment where there is a lack of policies or insufficient governance to guide the actions of management and staff.
Ipswich City Council, discussed in the case study below, is an example of the consequences of not addressing significant internal control and governance weaknesses. This case study also outlines the additional work undertaken to form our audit opinion in 2017–18.
Case study 2
Ipswich City Council
The Crime and Corruption Commission (CCC) investigated allegations of corrupt conduct by elected officials and senior executive employees of Ipswich City Council. This investigation resulted in multiple people being charged with criminal offences. The CCC also released a report in August 2018, Culture and corruption risks in local government: Lessons from an investigation into Ipswich City Council (Operation Windage), highlighting the key governance failures and cultural issues in local governments that allowed the alleged behaviour to occur.
In response, the state government passed the Local Government (Dissolution of Ipswich City Council) Act 2018, dissolving Ipswich City Council. An interim administrator was appointed on 23 August 2018 in place of the council.
Figure 4B shows the number of issues we have raised across the Ipswich City Council group over the past five years.
Control environment
Structures, policies,
attitudes, and values that influence daily operations
63 significant deficiencies
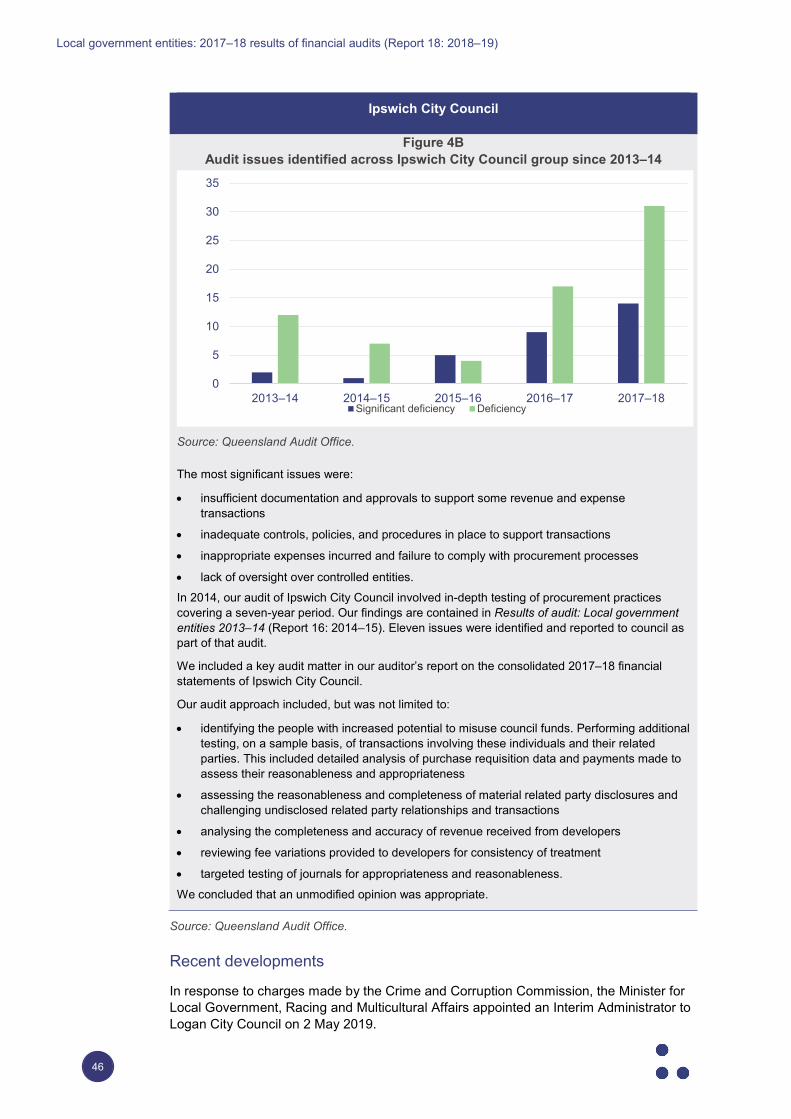
Local government entities: 2017–18 results of financial audits (Report 18: 2018–19)
46
Ipswich City Council
Figure 4B Audit issues identified across Ipswich City Council group since 2013–14
Source: Queensland Audit Office.
The most significant issues were:
• insufficient documentation and approvals to support some revenue and expense transactions
• inadequate controls, policies, and procedures in place to support transactions
• inappropriate expenses incurred and failure to comply with procurement processes
• lack of oversight over controlled entities.
In 2014, our audit of Ipswich City Council involved in-depth testing of procurement practices covering a seven-year period. Our findings are contained in Results of audit: Local government entities 2013–14 (Report 16: 2014–15). Eleven issues were identified and reported to council as part of that audit.
We included a key audit matter in our auditor’s report on the consolidated 2017–18 financial statements of Ipswich City Council.
Our audit approach included, but was not limited to:
• identifying the people with increased potential to misuse council funds. Performing additional testing, on a sample basis, of transactions involving these individuals and their related parties. This included detailed analysis of purchase requisition data and payments made to assess their reasonableness and appropriateness
• assessing the reasonableness and completeness of material related party disclosures and challenging undisclosed related party relationships and transactions
• analysing the completeness and accuracy of revenue received from developers
• reviewing fee variations provided to developers for consistency of treatment
• targeted testing of journals for appropriateness and reasonableness.
We concluded that an unmodified opinion was appropriate.
Source: Queensland Audit Office.
Recent developments
In response to charges made by the Crime and Corruption Commission, the Minister for Local Government, Racing and Multicultural Affairs appointed an Interim Administrator to Logan City Council on 2 May 2019.
0
5
10
15
20
25
30
35
2013–14 2014–15 2015–16 2016–17 2017–18Significant deficiency Deficiency
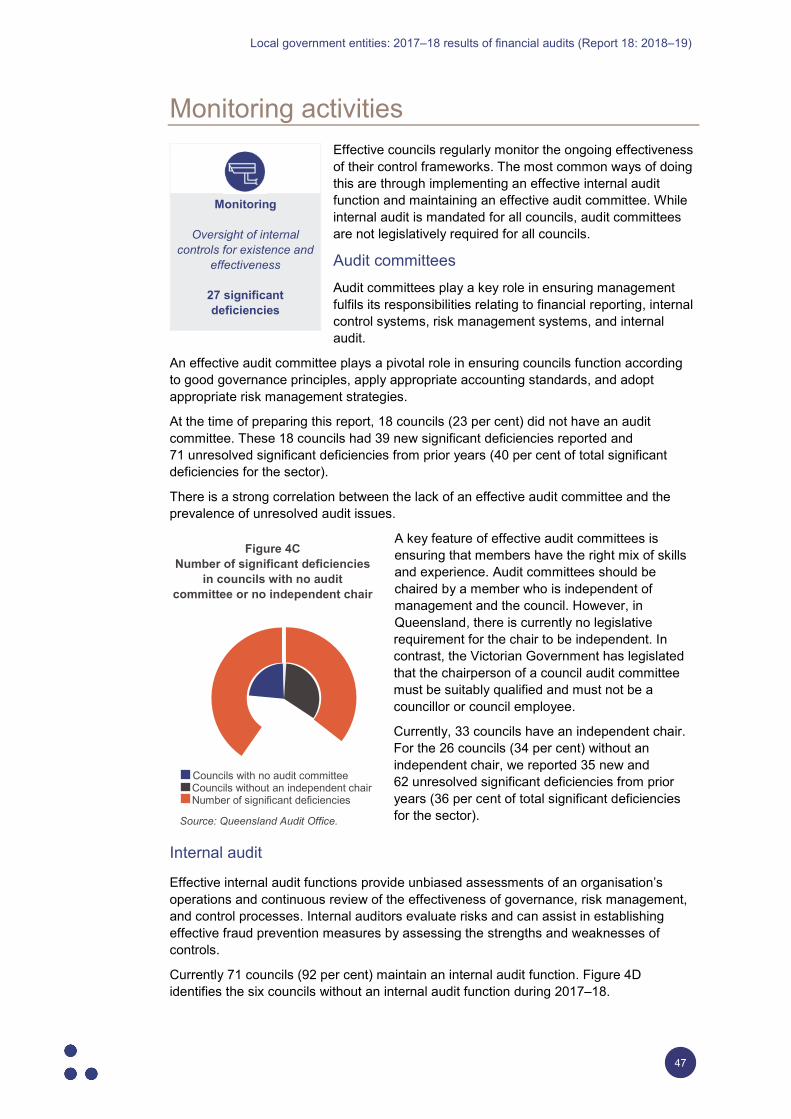
Local government entities: 2017–18 results of financial audits (Report 18: 2018–19)
47
Monitoring activities Effective councils regularly monitor the ongoing effectiveness of their control frameworks. The most common ways of doing this are through implementing an effective internal audit function and maintaining an effective audit committee. While internal audit is mandated for all councils, audit committees are not legislatively required for all councils.
Audit committees Audit committees play a key role in ensuring management fulfils its responsibilities relating to financial reporting, internal control systems, risk management systems, and internal audit.
An effective audit committee plays a pivotal role in ensuring councils function according to good governance principles, apply appropriate accounting standards, and adopt appropriate risk management strategies.
At the time of preparing this report, 18 councils (23 per cent) did not have an audit committee. These 18 councils had 39 new significant deficiencies reported and 71 unresolved significant deficiencies from prior years (40 per cent of total significant deficiencies for the sector).
There is a strong correlation between the lack of an effective audit committee and the prevalence of unresolved audit issues.
A key feature of effective audit committees is ensuring that members have the right mix of skills and experience. Audit committees should be chaired by a member who is independent of management and the council. However, in Queensland, there is currently no legislative requirement for the chair to be independent. In contrast, the Victorian Government has legislated that the chairperson of a council audit committee must be suitably qualified and must not be a councillor or council employee.
Currently, 33 councils have an independent chair. For the 26 councils (34 per cent) without an independent chair, we reported 35 new and 62 unresolved significant deficiencies from prior years (36 per cent of total significant deficiencies for the sector).
Internal audit
Effective internal audit functions provide unbiased assessments of an organisation’s operations and continuous review of the effectiveness of governance, risk management, and control processes. Internal auditors evaluate risks and can assist in establishing effective fraud prevention measures by assessing the strengths and weaknesses of controls.
Currently 71 councils (92 per cent) maintain an internal audit function. Figure 4D identifies the six councils without an internal audit function during 2017–18.
Monitoring
Oversight of internal
controls for existence and effectiveness
27 significant deficiencies
Figure 4C Number of significant deficiencies
in councils with no audit committee or no independent chair
Source: Queensland Audit Office.
Councils with no audit committee Councils without an independent chair Number of significant deficiencies
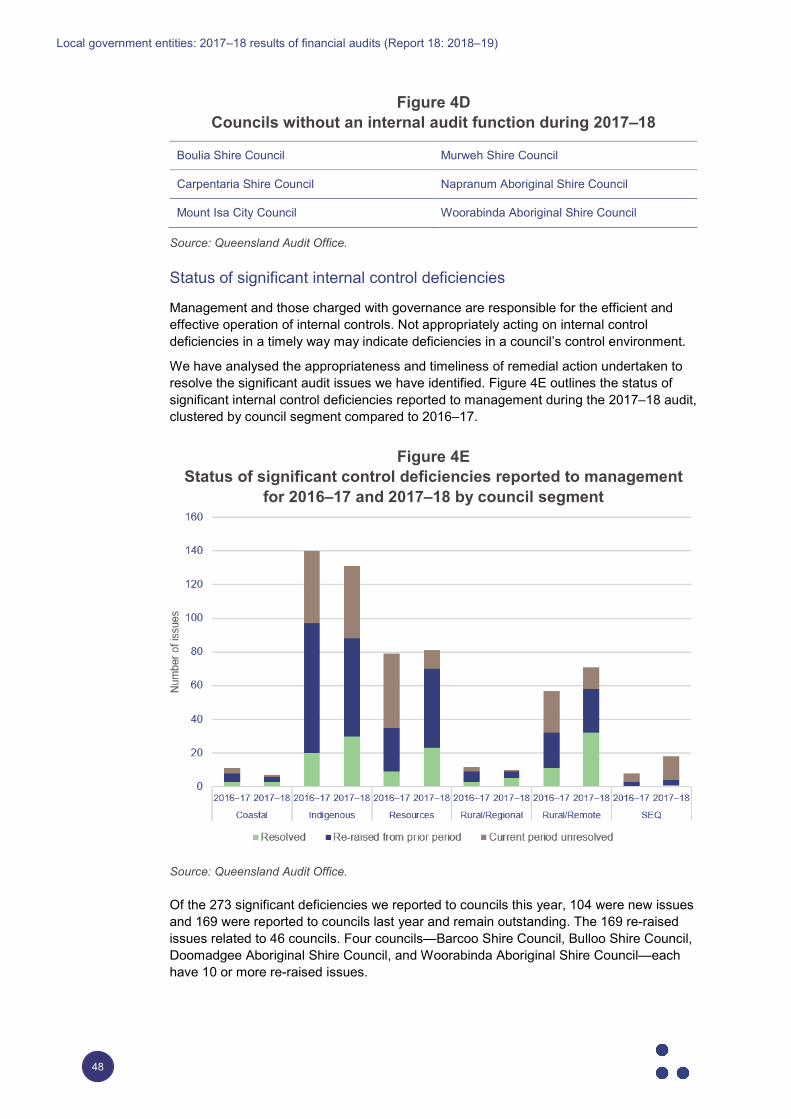
Local government entities: 2017–18 results of financial audits (Report 18: 2018–19)
48
Figure 4D Councils without an internal audit function during 2017–18
Boulia Shire Council Murweh Shire Council
Carpentaria Shire Council Napranum Aboriginal Shire Council
Mount Isa City Council Woorabinda Aboriginal Shire Council
Source: Queensland Audit Office.
Status of significant internal control deficiencies
Management and those charged with governance are responsible for the efficient and effective operation of internal controls. Not appropriately acting on internal control deficiencies in a timely way may indicate deficiencies in a council’s control environment.
We have analysed the appropriateness and timeliness of remedial action undertaken to resolve the significant audit issues we have identified. Figure 4E outlines the status of significant internal control deficiencies reported to management during the 2017–18 audit, clustered by council segment compared to 2016–17.
Figure 4E Status of significant control deficiencies reported to management
for 2016–17 and 2017–18 by council segment
Source: Queensland Audit Office.
Of the 273 significant deficiencies we reported to councils this year, 104 were new issues and 169 were reported to councils last year and remain outstanding. The 169 re-raised issues related to 46 councils. Four councils—Barcoo Shire Council, Bulloo Shire Council, Doomadgee Aboriginal Shire Council, and Woorabinda Aboriginal Shire Council—each have 10 or more re-raised issues.
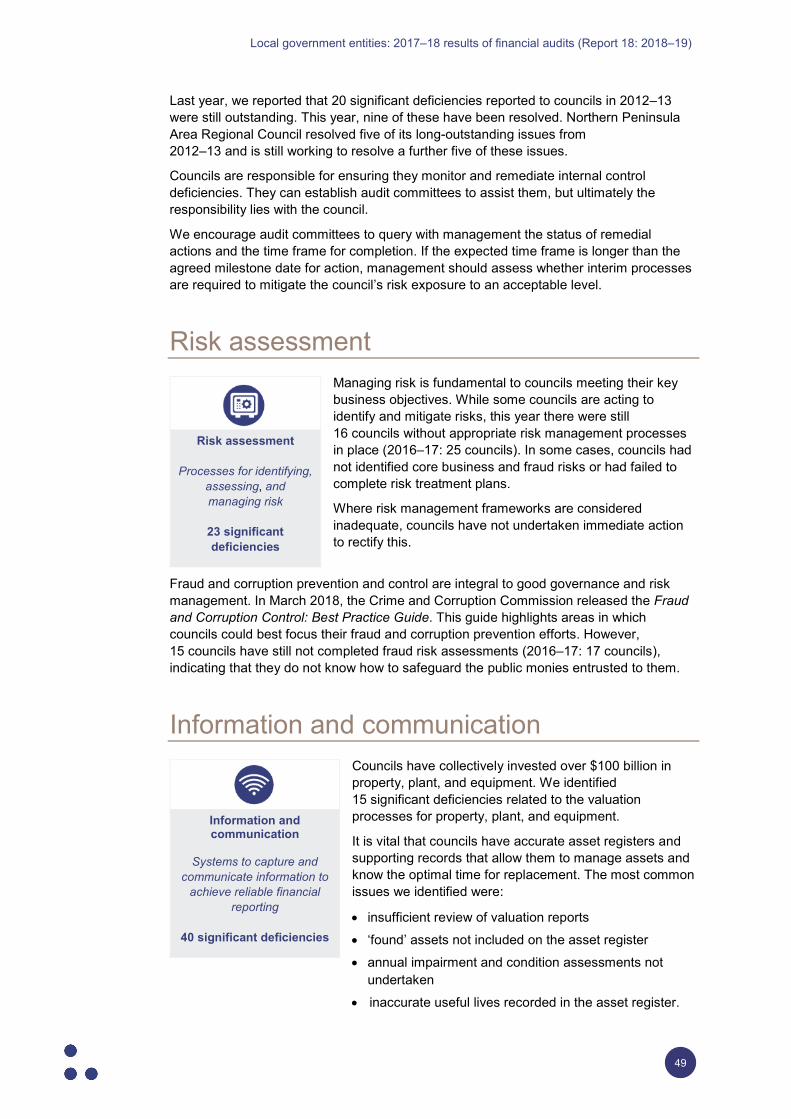
Local government entities: 2017–18 results of financial audits (Report 18: 2018–19)
49
Last year, we reported that 20 significant deficiencies reported to councils in 2012–13 were still outstanding. This year, nine of these have been resolved. Northern Peninsula Area Regional Council resolved five of its long-outstanding issues from 2012–13 and is still working to resolve a further five of these issues.
Councils are responsible for ensuring they monitor and remediate internal control deficiencies. They can establish audit committees to assist them, but ultimately the responsibility lies with the council.
We encourage audit committees to query with management the status of remedial actions and the time frame for completion. If the expected time frame is longer than the agreed milestone date for action, management should assess whether interim processes are required to mitigate the council’s risk exposure to an acceptable level.
Risk assessment Managing risk is fundamental to councils meeting their key business objectives. While some councils are acting to identify and mitigate risks, this year there were still 16 councils without appropriate risk management processes in place (2016–17: 25 councils). In some cases, councils had not identified core business and fraud risks or had failed to complete risk treatment plans.
Where risk management frameworks are considered inadequate, councils have not undertaken immediate action to rectify this.
Fraud and corruption prevention and control are integral to good governance and risk management. In March 2018, the Crime and Corruption Commission released the Fraud and Corruption Control: Best Practice Guide. This guide highlights areas in which councils could best focus their fraud and corruption prevention efforts. However, 15 councils have still not completed fraud risk assessments (2016–17: 17 councils), indicating that they do not know how to safeguard the public monies entrusted to them.
Information and communication Councils have collectively invested over $100 billion in property, plant, and equipment. We identified 15 significant deficiencies related to the valuation processes for property, plant, and equipment.
It is vital that councils have accurate asset registers and supporting records that allow them to manage assets and know the optimal time for replacement. The most common issues we identified were:
• insufficient review of valuation reports • ‘found’ assets not included on the asset register • annual impairment and condition assessments not
undertaken • inaccurate useful lives recorded in the asset register.
Risk assessment
Processes for identifying, assessing, and managing risk
23 significant deficiencies
Information and communication
Systems to capture and
communicate information to achieve reliable financial
reporting
40 significant deficiencies
Local government entities: 2017–18 results of financial audits (Report 18: 2018–19)
50
Contract registers
Incomplete contract registers increase the risk that councils:
• do not monitor contracts for compliance with performance obligations
• cannot identify expiring contracts
• report inaccurate commitments in their financial statements.
Contract registers are critical if councils are to ensure they manage their contractual obligations effectively. They also provide a source of truth to those charged with governance and assist in budgeting for committed costs.
At a minimum, a contract register should contain the following five elements:
1. start and end date of the contract 2. total contracted amount and annual amounts 3. contract manager assigned to the contract 4. link to or reference to a copy of the contract 5. trigger date for renewal to ensure an appropriate
procurement process can be followed. We assessed councils’ contract registers against each of these elements, as shown in Figure 4F.
We identified 18 councils without a contract register in place. Only 24 councils had all five elements in their contract register.
Control activities Reviewing the information recorded in councils’ systems is vital in ensuring that reliable information is produced for internal and external reporting purposes, and for preventing fraud and error.
We identified 28 significant deficiencies at 17 councils, resulting from inadequate checks of reconciliations, journals, and payroll transactions (2016–17: 29 at 19 councils). Without adequate review, the risk of processing erroneous or fraudulent transactions significantly increases.
As well as reviewing transactions processed, councils need to review changes to the underlying data that support these transactions. We identified 15 councils that did not review
changes made to vendor masterfiles (the collection of all records relating to vendors). For 13 of these councils, this weakness has existed for more than 12 months.
In addition, six councils did not review the employee masterfile change reports. When an independent officer does not review masterfile change reports in a timely manner, the council is at higher risk of losses due to fraud.
Control activities
Implementation of policies and procedures to prevent
or detect errors and safeguard assets
120 significant
deficiencies
Figure 4F Councils’ contract registers
with key elements
Source: Queensland Audit Office.
20
25
30
35
40
45
50
55
No.
of c
ounc
ils
Five key elements
1 2 3 4 5
Local government entities: 2017–18 results of financial audits (Report 18: 2018–19)
51
General information technology controls
Strong information technology (IT) controls are fundamental to all councils, given the heavy reliance on technology to deliver their day-to-day activities. Poor IT controls could result in potential cyber-attacks and an increased risk of fraud.
This year, we identified 10 significant deficiencies for councils regarding not reviewing user access or privileged user activities (2016–17: 24). (Privileged users have access to all areas of the critical system.)
We identified a further two significant deficiencies relating to insufficient security for electronic funds transfer files and general security (2016–17: nine).
Inappropriate access within finance systems creates opportunities for officers to perpetrate fraud by making inappropriate changes to payment details recorded in the system.
Local government entities: 2017–18 results of financial audits (Report 18: 2018–19)
52
Appendices A. Full responses from entities 53
B. Queensland local governments by category 57
C. Legislative context 59
D. Our audit opinions 61
E. Entities exempt from audit by the Auditor-General 68
F. Local government entities for which we will not issue opinions 69
G. Audit opinions issued for prior financial years 71
H. Financial sustainability measures 72
I. Our assessment of councils’ financial governance 81
J. Glossary 92
Local government entities: 2017–18 results of financial audits (Report 18: 2018–19)
53
A. Full responses from entities
As mandated in section 64 of the Auditor-General Act 2009, the Queensland Audit Office gave a copy of this report with a request for comments to all 77 councils and the Department of Local Government, Racing and Multicultural Affairs.
The heads of these entities are responsible for the accuracy, fairness, and balance of their comments.
This appendix contains their responses.
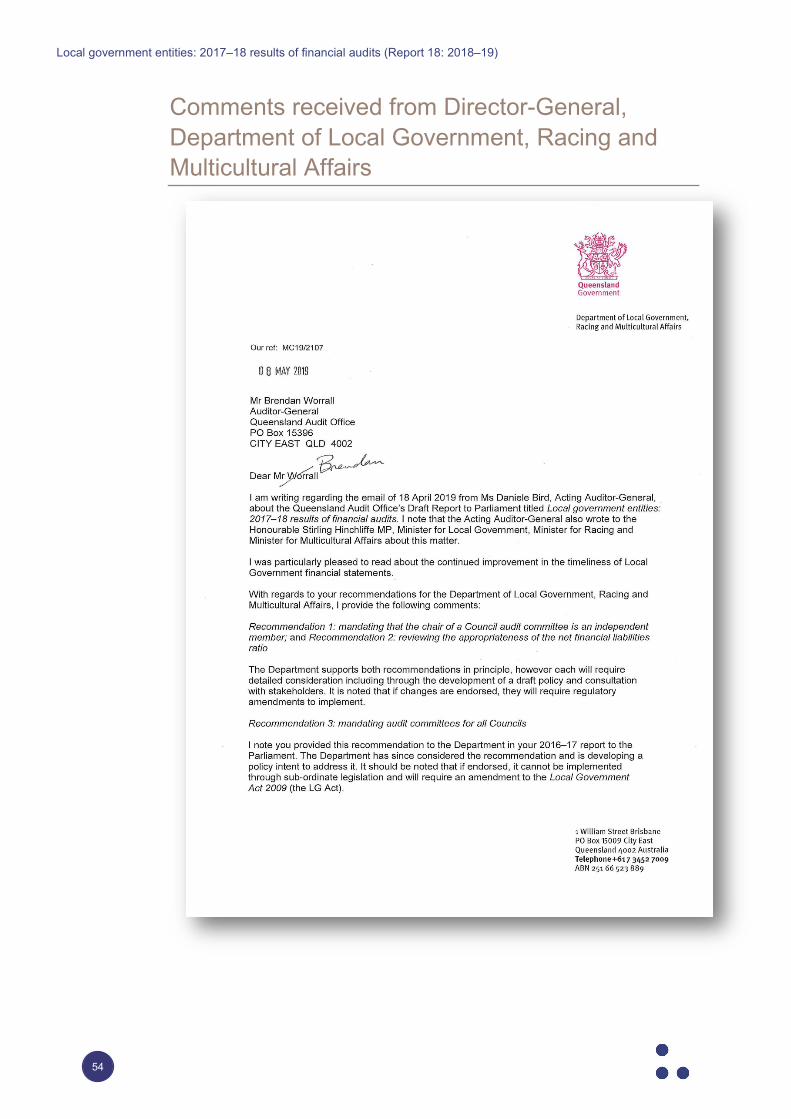
Local government entities: 2017–18 results of financial audits (Report 18: 2018–19)
54
Comments received from Director-General, Department of Local Government, Racing and Multicultural Affairs
Local government entities: 2017–18 results of financial audits (Report 18: 2018–19)
55
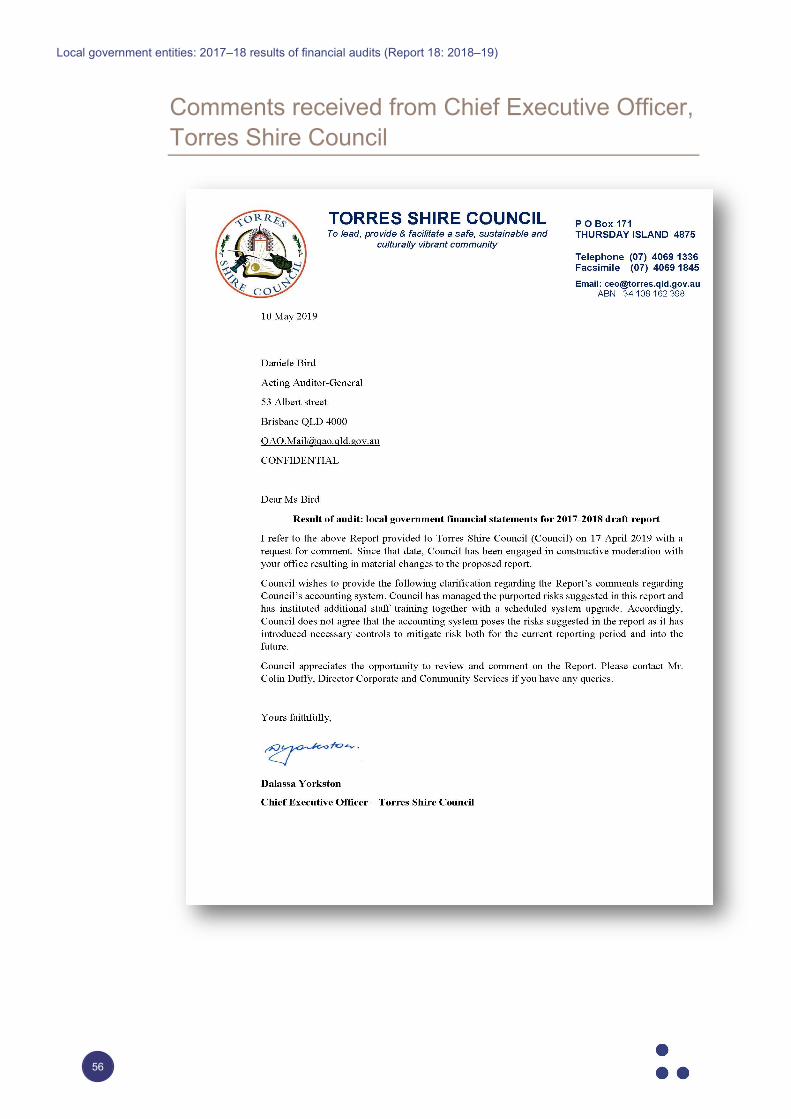
Local government entities: 2017–18 results of financial audits (Report 18: 2018–19)
56
Comments received from Chief Executive Officer, Torres Shire Council
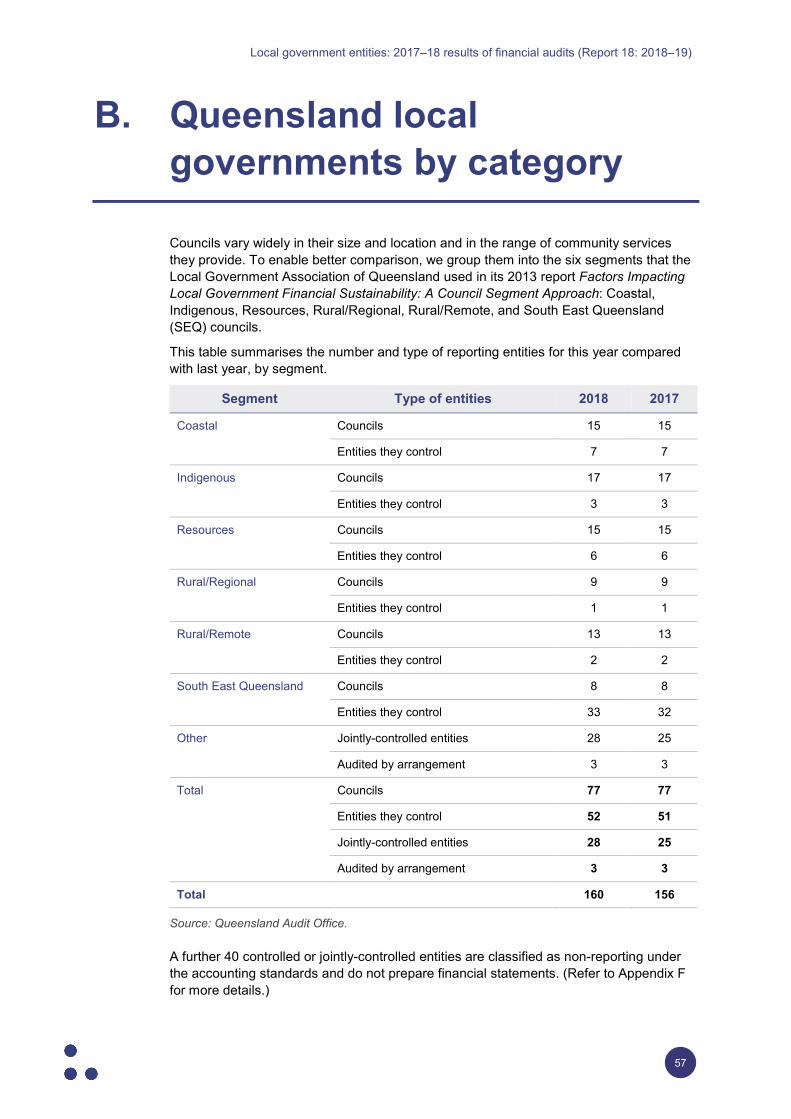
Local government entities: 2017–18 results of financial audits (Report 18: 2018–19)
57
B. Queensland local governments by category
Councils vary widely in their size and location and in the range of community services they provide. To enable better comparison, we group them into the six segments that the Local Government Association of Queensland used in its 2013 report Factors Impacting Local Government Financial Sustainability: A Council Segment Approach: Coastal, Indigenous, Resources, Rural/Regional, Rural/Remote, and South East Queensland (SEQ) councils.
This table summarises the number and type of reporting entities for this year compared with last year, by segment.
Segment Type of entities 2018 2017
Coastal Councils 15 15
Entities they control 7 7
Indigenous Councils 17 17
Entities they control 3 3
Resources Councils 15 15
Entities they control 6 6
Rural/Regional Councils 9 9
Entities they control 1 1
Rural/Remote Councils 13 13
Entities they control 2 2
South East Queensland Councils 8 8
Entities they control 33 32
Other Jointly-controlled entities 28 25
Audited by arrangement 3 3
Total
Councils 77 77
Entities they control 52 51
Jointly-controlled entities 28 25
Audited by arrangement 3 3
Total 160 156
Source: Queensland Audit Office.
A further 40 controlled or jointly-controlled entities are classified as non-reporting under the accounting standards and do not prepare financial statements. (Refer to Appendix F for more details.)
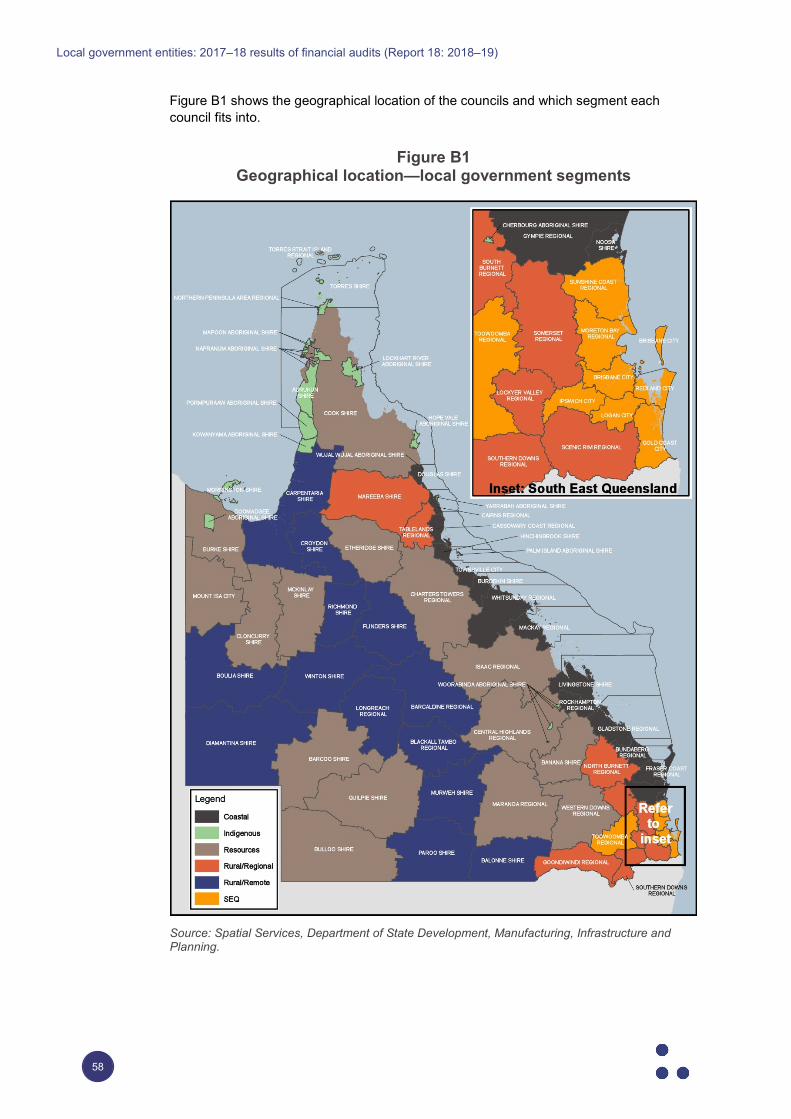
Local government entities: 2017–18 results of financial audits (Report 18: 2018–19)
58
Figure B1 shows the geographical location of the councils and which segment each council fits into.
Figure B1 Geographical location—local government segments
Source: Spatial Services, Department of State Development, Manufacturing, Infrastructure and Planning.
Local government entities: 2017–18 results of financial audits (Report 18: 2018–19)
59
C. Legislative context
Framework Under the Constitution of Queensland 2001, there must be a system of local government in Queensland that is made up of councils. A local government (council) is an elected body that has the power to make local laws suitable to the needs and resources of the area it represents.
Councils’ legislative framework is the Local Government Act 2009 (the Act) and the Local Government Regulation 2012 (the regulation).
The purpose of the Act is to specify the nature and extent of local governments’ responsibilities and powers. It requires the system of local government to be accountable, effective, efficient, and sustainable.
The regulation requires each council to prepare, by 31 October:
• a general purpose financial statement
• a current year financial sustainability statement
• a long-term financial sustainability statement.
Brisbane City Council has the City of Brisbane Act 2010 and City of Brisbane Regulation 2012. The regulation imposes the same financial reporting time frames and financial reporting requirements on Brisbane City Council as other councils have.
Each council must release its annual report within one month of the audit opinion date. The Minister for Local Government, Racing and Multicultural Affairs may grant an extension to the deadline where extraordinary circumstances exist.
Only the general purpose financial statement and the current year financial sustainability statement are subject to audit.
The current year financial sustainability statement includes the following three measures of financial sustainability:
• operating surplus ratio, which indicates the extent to which operating revenues cover operating expenses
• net financial liabilities ratio, which indicates the extent to which a council’s operating revenues can service its net liabilities while maintaining its assets and service levels
• asset sustainability ratio, which approximates the extent to which a council is replacing its assets as they reach the end of their useful lives.
Accountability requirements The Local Government Act 2009 requires councils to establish financial management systems to identify and manage financial risks, including risks to reliable and timely reporting. The performance of financial management systems requires regular review.
Local government entities: 2017–18 results of financial audits (Report 18: 2018–19)
60
Queensland local government financial statements These financial statements are used by a broad range of parties, including parliamentarians, councillors, taxpayers, employees, and users of local government services. For these statements to be useful, the information reported must be accurate and timely.
The Auditor-General’s audit opinion on these entities’ financial statements assures users that the statements are accurate and in accordance with relevant legislative requirements.
We express an unmodified opinion when the financial statements are prepared in accordance with the relevant legislative requirements and Australian accounting standards. We qualify our audit opinion where financial statements do not comply with the relevant legislative requirements and Australian accounting standards and are not accurate and reliable.
Sometimes we include an emphasis of matter in our audit reports to highlight an issue that will help users to better understand the financial statements. These do not change the audit opinion.
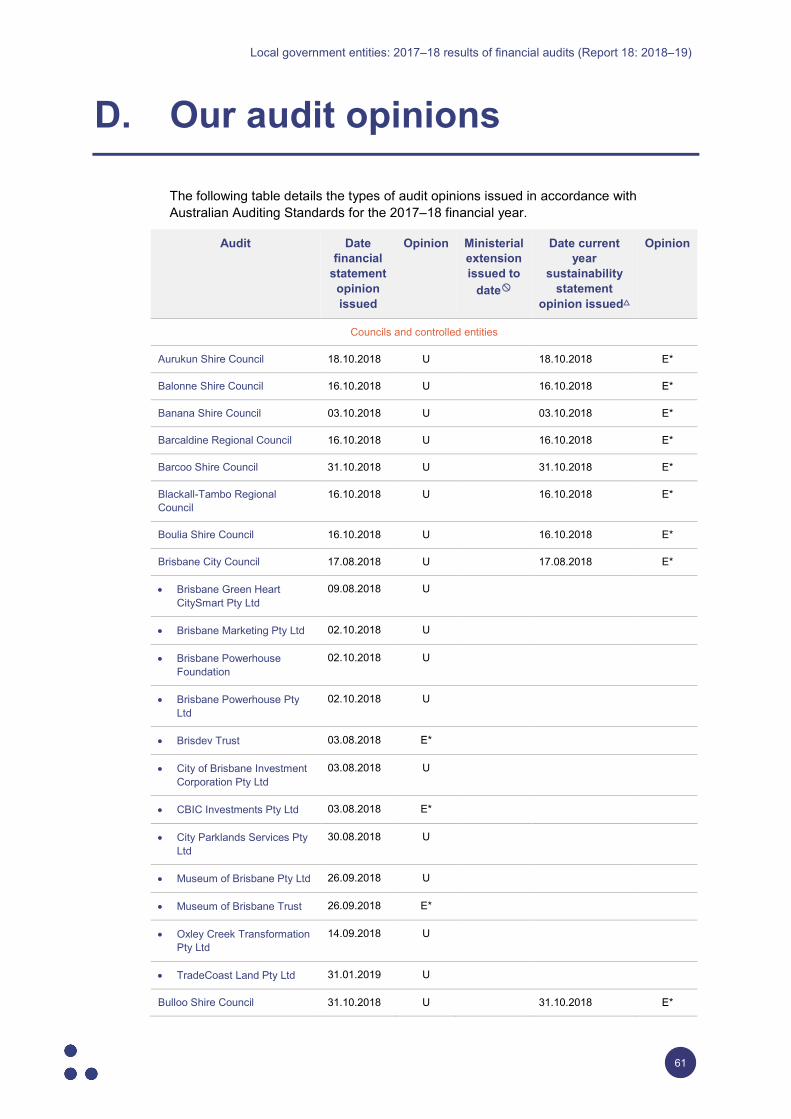
Local government entities: 2017–18 results of financial audits (Report 18: 2018–19)
61
D. Our audit opinions
The following table details the types of audit opinions issued in accordance with Australian Auditing Standards for the 2017–18 financial year.
Audit Date financial
statement opinion issued
Opinion Ministerial extension issued to
date🚫🚫
Date current year
sustainability statement
opinion issued△
Opinion
Councils and controlled entities
Aurukun Shire Council 18.10.2018 U 18.10.2018 E*
Balonne Shire Council 16.10.2018 U 16.10.2018 E*
Banana Shire Council 03.10.2018 U 03.10.2018 E*
Barcaldine Regional Council 16.10.2018 U 16.10.2018 E*
Barcoo Shire Council 31.10.2018 U 31.10.2018 E*
Blackall-Tambo Regional Council
16.10.2018 U 16.10.2018 E*
Boulia Shire Council 16.10.2018 U 16.10.2018 E*
Brisbane City Council 17.08.2018 U 17.08.2018 E*
• Brisbane Green Heart CitySmart Pty Ltd
09.08.2018 U
• Brisbane Marketing Pty Ltd 02.10.2018 U
• Brisbane Powerhouse Foundation
02.10.2018 U
• Brisbane Powerhouse Pty Ltd
02.10.2018 U
• Brisdev Trust 03.08.2018 E*
• City of Brisbane Investment Corporation Pty Ltd
03.08.2018 U
• CBIC Investments Pty Ltd 03.08.2018 E*
• City Parklands Services Pty Ltd
30.08.2018 U
• Museum of Brisbane Pty Ltd 26.09.2018 U
• Museum of Brisbane Trust 26.09.2018 E*
• Oxley Creek Transformation Pty Ltd
14.09.2018 U
• TradeCoast Land Pty Ltd 31.01.2019 U
Bulloo Shire Council 31.10.2018 U 31.10.2018 E*
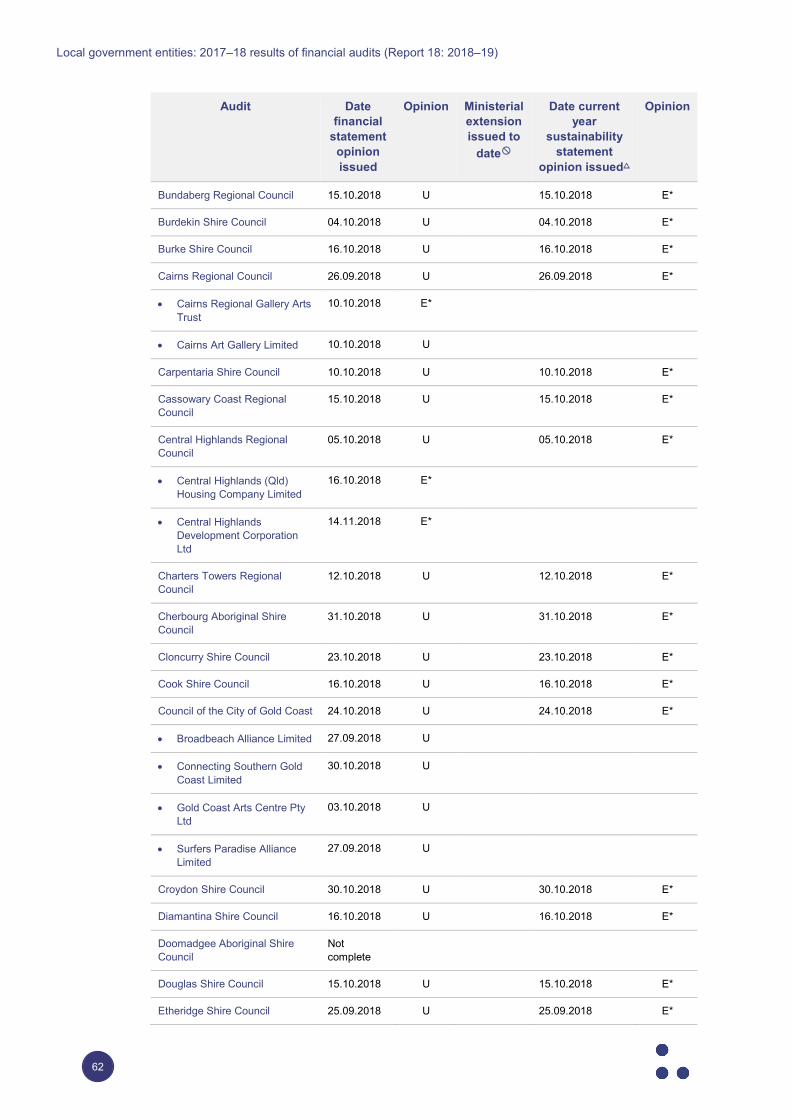
Local government entities: 2017–18 results of financial audits (Report 18: 2018–19)
62
Audit Date financial
statement opinion issued
Opinion Ministerial extension issued to
date🚫🚫
Date current year
sustainability statement
opinion issued△
Opinion
Bundaberg Regional Council 15.10.2018 U 15.10.2018 E*
Burdekin Shire Council 04.10.2018 U 04.10.2018 E*
Burke Shire Council 16.10.2018 U 16.10.2018 E*
Cairns Regional Council 26.09.2018 U 26.09.2018 E*
• Cairns Regional Gallery Arts Trust
10.10.2018 E*
• Cairns Art Gallery Limited 10.10.2018 U
Carpentaria Shire Council 10.10.2018 U 10.10.2018 E*
Cassowary Coast Regional Council
15.10.2018 U 15.10.2018 E*
Central Highlands Regional Council
05.10.2018 U 05.10.2018 E*
• Central Highlands (Qld) Housing Company Limited
16.10.2018 E*
• Central Highlands Development Corporation Ltd
14.11.2018 E*
Charters Towers Regional Council
12.10.2018 U 12.10.2018 E*
Cherbourg Aboriginal Shire Council
31.10.2018 U 31.10.2018 E*
Cloncurry Shire Council 23.10.2018 U 23.10.2018 E*
Cook Shire Council 16.10.2018 U 16.10.2018 E*
Council of the City of Gold Coast 24.10.2018 U 24.10.2018 E*
• Broadbeach Alliance Limited 27.09.2018 U
• Connecting Southern Gold Coast Limited
30.10.2018 U
• Gold Coast Arts Centre Pty Ltd
03.10.2018 U
• Surfers Paradise Alliance Limited
27.09.2018 U
Croydon Shire Council 30.10.2018 U 30.10.2018 E*
Diamantina Shire Council 16.10.2018 U 16.10.2018 E*
Doomadgee Aboriginal Shire Council
Not complete
Douglas Shire Council 15.10.2018 U 15.10.2018 E*
Etheridge Shire Council 25.09.2018 U 25.09.2018 E*
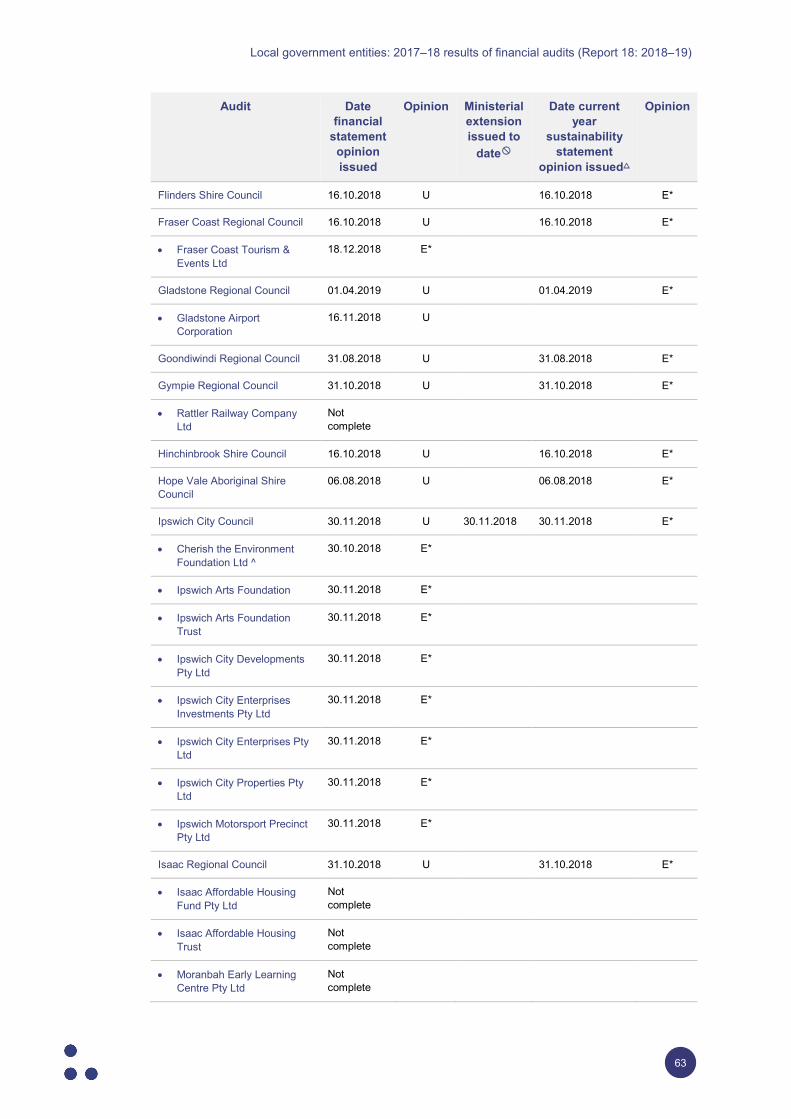
Local government entities: 2017–18 results of financial audits (Report 18: 2018–19)
63
Audit Date financial
statement opinion issued
Opinion Ministerial extension issued to
date🚫🚫
Date current year
sustainability statement
opinion issued△
Opinion
Flinders Shire Council 16.10.2018 U 16.10.2018 E*
Fraser Coast Regional Council 16.10.2018 U 16.10.2018 E*
• Fraser Coast Tourism & Events Ltd
18.12.2018 E*
Gladstone Regional Council 01.04.2019 U 01.04.2019 E*
• Gladstone Airport Corporation
16.11.2018 U
Goondiwindi Regional Council 31.08.2018 U 31.08.2018 E*
Gympie Regional Council 31.10.2018 U 31.10.2018 E*
• Rattler Railway Company Ltd
Not complete
Hinchinbrook Shire Council 16.10.2018 U 16.10.2018 E*
Hope Vale Aboriginal Shire Council
06.08.2018 U 06.08.2018 E*
Ipswich City Council 30.11.2018 U 30.11.2018 30.11.2018 E*
• Cherish the Environment Foundation Ltd ^
30.10.2018 E*
• Ipswich Arts Foundation 30.11.2018 E*
• Ipswich Arts Foundation Trust
30.11.2018 E*
• Ipswich City Developments Pty Ltd
30.11.2018 E*
• Ipswich City Enterprises Investments Pty Ltd
30.11.2018 E*
• Ipswich City Enterprises Pty Ltd
30.11.2018 E*
• Ipswich City Properties Pty Ltd
30.11.2018 E*
• Ipswich Motorsport Precinct Pty Ltd
30.11.2018 E*
Isaac Regional Council 31.10.2018 U 31.10.2018 E*
• Isaac Affordable Housing Fund Pty Ltd
Not complete
• Isaac Affordable Housing Trust
Not complete
• Moranbah Early Learning Centre Pty Ltd
Not complete
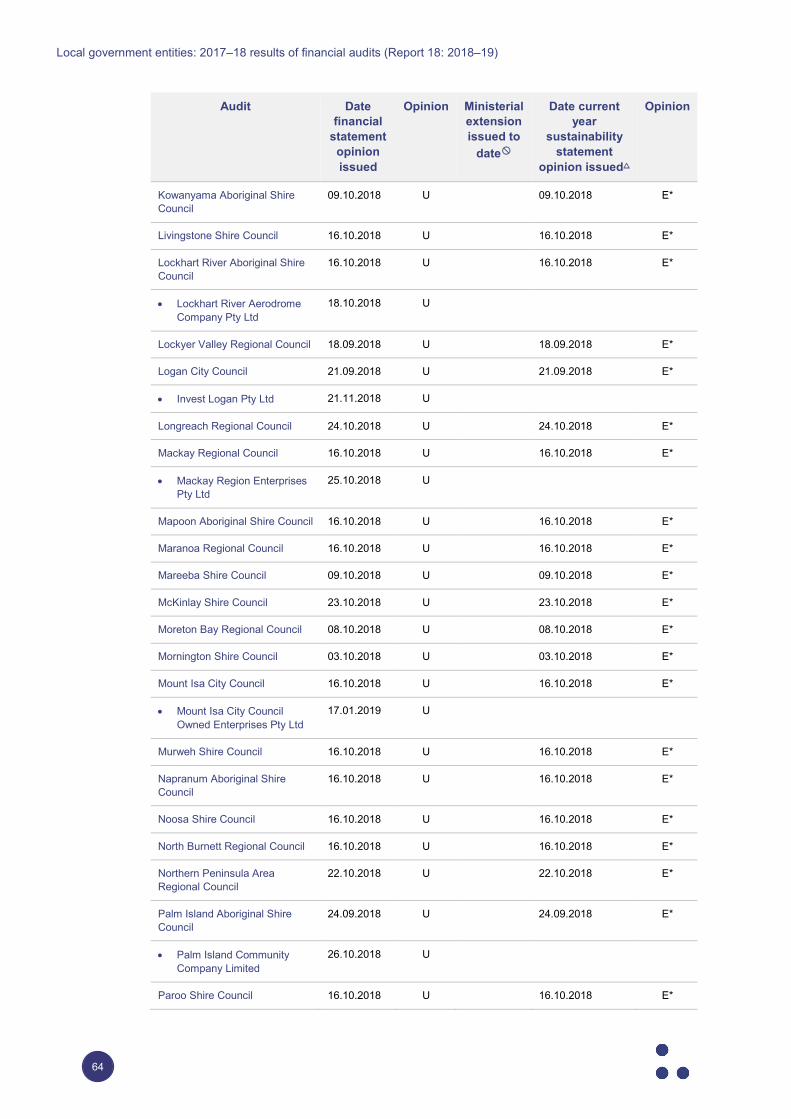
Local government entities: 2017–18 results of financial audits (Report 18: 2018–19)
64
Audit Date financial
statement opinion issued
Opinion Ministerial extension issued to
date🚫🚫
Date current year
sustainability statement
opinion issued△
Opinion
Kowanyama Aboriginal Shire Council
09.10.2018 U 09.10.2018 E*
Livingstone Shire Council 16.10.2018 U 16.10.2018 E*
Lockhart River Aboriginal Shire Council
16.10.2018 U 16.10.2018 E*
• Lockhart River Aerodrome Company Pty Ltd
18.10.2018 U
Lockyer Valley Regional Council 18.09.2018 U 18.09.2018 E*
Logan City Council 21.09.2018 U 21.09.2018 E*
• Invest Logan Pty Ltd 21.11.2018 U
Longreach Regional Council 24.10.2018 U 24.10.2018 E*
Mackay Regional Council 16.10.2018 U 16.10.2018 E*
• Mackay Region Enterprises Pty Ltd
25.10.2018 U
Mapoon Aboriginal Shire Council 16.10.2018 U 16.10.2018 E*
Maranoa Regional Council 16.10.2018 U 16.10.2018 E*
Mareeba Shire Council 09.10.2018 U 09.10.2018 E*
McKinlay Shire Council 23.10.2018 U 23.10.2018 E*
Moreton Bay Regional Council 08.10.2018 U 08.10.2018 E*
Mornington Shire Council 03.10.2018 U 03.10.2018 E*
Mount Isa City Council 16.10.2018 U 16.10.2018 E*
• Mount Isa City Council Owned Enterprises Pty Ltd
17.01.2019 U
Murweh Shire Council 16.10.2018 U 16.10.2018 E*
Napranum Aboriginal Shire Council
16.10.2018 U 16.10.2018 E*
Noosa Shire Council 16.10.2018 U 16.10.2018 E*
North Burnett Regional Council 16.10.2018 U 16.10.2018 E*
Northern Peninsula Area Regional Council
22.10.2018 U 22.10.2018 E*
Palm Island Aboriginal Shire Council
24.09.2018 U 24.09.2018 E*
• Palm Island Community Company Limited
26.10.2018 U
Paroo Shire Council 16.10.2018 U 16.10.2018 E*
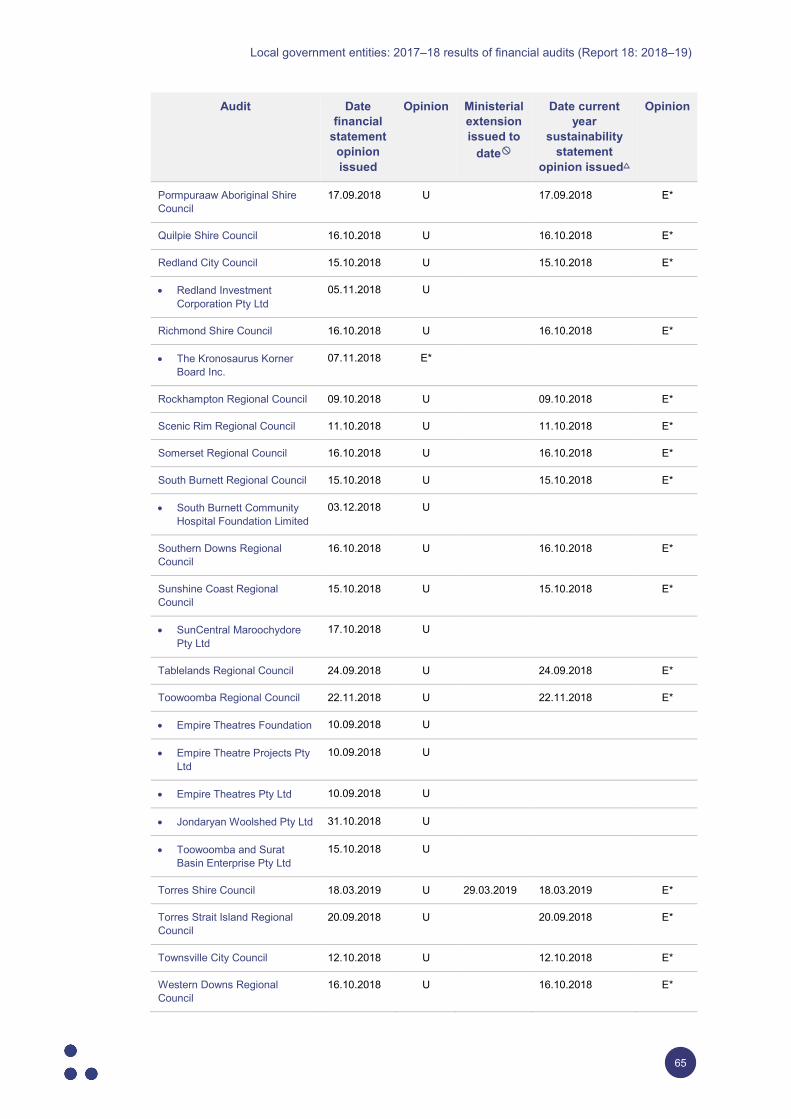
Local government entities: 2017–18 results of financial audits (Report 18: 2018–19)
65
Audit Date financial
statement opinion issued
Opinion Ministerial extension issued to
date🚫🚫
Date current year
sustainability statement
opinion issued△
Opinion
Pormpuraaw Aboriginal Shire Council
17.09.2018 U 17.09.2018 E*
Quilpie Shire Council 16.10.2018 U 16.10.2018 E*
Redland City Council 15.10.2018 U 15.10.2018 E*
• Redland Investment Corporation Pty Ltd
05.11.2018 U
Richmond Shire Council 16.10.2018 U 16.10.2018 E*
• The Kronosaurus Korner Board Inc.
07.11.2018 E*
Rockhampton Regional Council 09.10.2018 U 09.10.2018 E*
Scenic Rim Regional Council 11.10.2018 U 11.10.2018 E*
Somerset Regional Council 16.10.2018 U 16.10.2018 E*
South Burnett Regional Council 15.10.2018 U 15.10.2018 E*
• South Burnett Community Hospital Foundation Limited
03.12.2018 U
Southern Downs Regional Council
16.10.2018 U 16.10.2018 E*
Sunshine Coast Regional Council
15.10.2018 U 15.10.2018 E*
• SunCentral Maroochydore Pty Ltd
17.10.2018 U
Tablelands Regional Council 24.09.2018 U 24.09.2018 E*
Toowoomba Regional Council 22.11.2018 U 22.11.2018 E*
• Empire Theatres Foundation 10.09.2018 U
• Empire Theatre Projects Pty Ltd
10.09.2018 U
• Empire Theatres Pty Ltd 10.09.2018 U
• Jondaryan Woolshed Pty Ltd 31.10.2018 U
• Toowoomba and Surat Basin Enterprise Pty Ltd
15.10.2018 U
Torres Shire Council 18.03.2019 U 29.03.2019 18.03.2019 E*
Torres Strait Island Regional Council
20.09.2018 U 20.09.2018 E*
Townsville City Council 12.10.2018 U 12.10.2018 E*
Western Downs Regional Council
16.10.2018 U 16.10.2018 E*
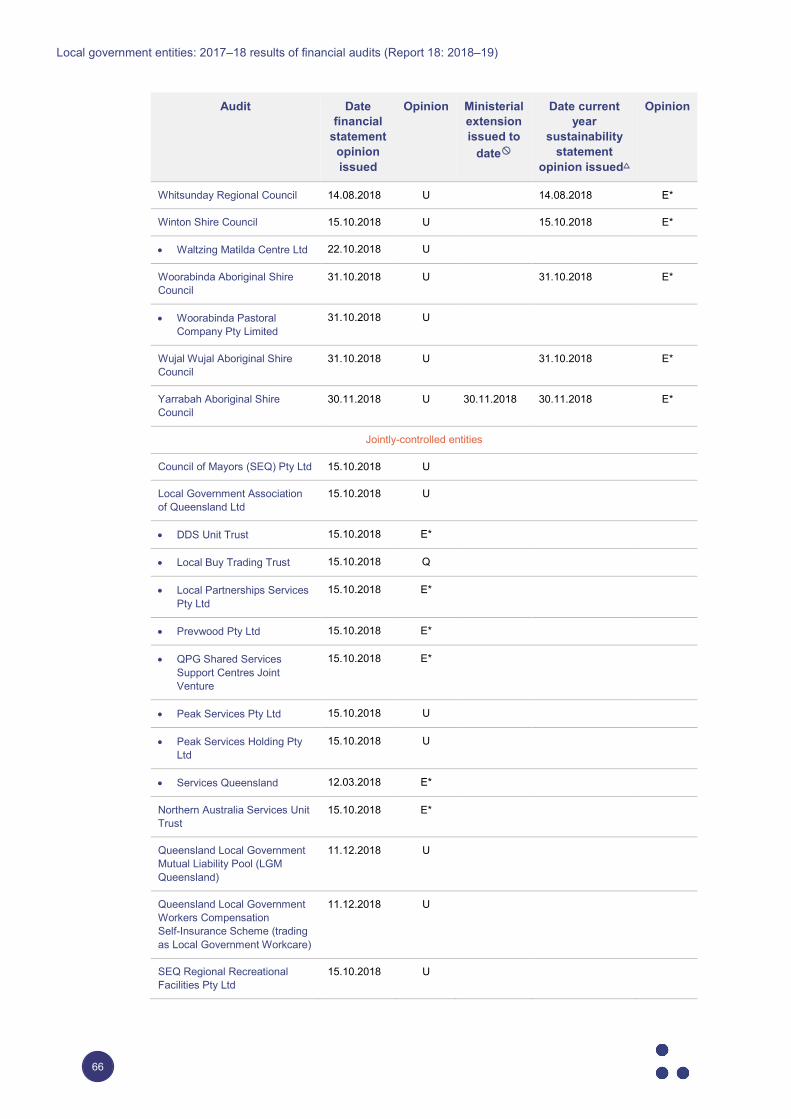
Local government entities: 2017–18 results of financial audits (Report 18: 2018–19)
66
Audit Date financial
statement opinion issued
Opinion Ministerial extension issued to
date🚫🚫
Date current year
sustainability statement
opinion issued△
Opinion
Whitsunday Regional Council 14.08.2018 U 14.08.2018 E*
Winton Shire Council 15.10.2018 U 15.10.2018 E*
• Waltzing Matilda Centre Ltd 22.10.2018 U
Woorabinda Aboriginal Shire Council
31.10.2018 U 31.10.2018 E*
• Woorabinda Pastoral Company Pty Limited
31.10.2018 U
Wujal Wujal Aboriginal Shire Council
31.10.2018 U 31.10.2018 E*
Yarrabah Aboriginal Shire Council
30.11.2018 U 30.11.2018 30.11.2018 E*
Jointly-controlled entities
Council of Mayors (SEQ) Pty Ltd 15.10.2018 U
Local Government Association of Queensland Ltd
15.10.2018 U
• DDS Unit Trust 15.10.2018 E*
• Local Buy Trading Trust 15.10.2018 Q
• Local Partnerships Services Pty Ltd
15.10.2018 E*
• Prevwood Pty Ltd 15.10.2018 E*
• QPG Shared Services Support Centres Joint Venture
15.10.2018 E*
• Peak Services Pty Ltd 15.10.2018 U
• Peak Services Holding Pty Ltd
15.10.2018 U
• Services Queensland 12.03.2018 E*
Northern Australia Services Unit Trust
15.10.2018 E*
Queensland Local Government Mutual Liability Pool (LGM Queensland)
11.12.2018 U
Queensland Local Government Workers Compensation Self-Insurance Scheme (trading as Local Government Workcare)
11.12.2018 U
SEQ Regional Recreational Facilities Pty Ltd
15.10.2018 U
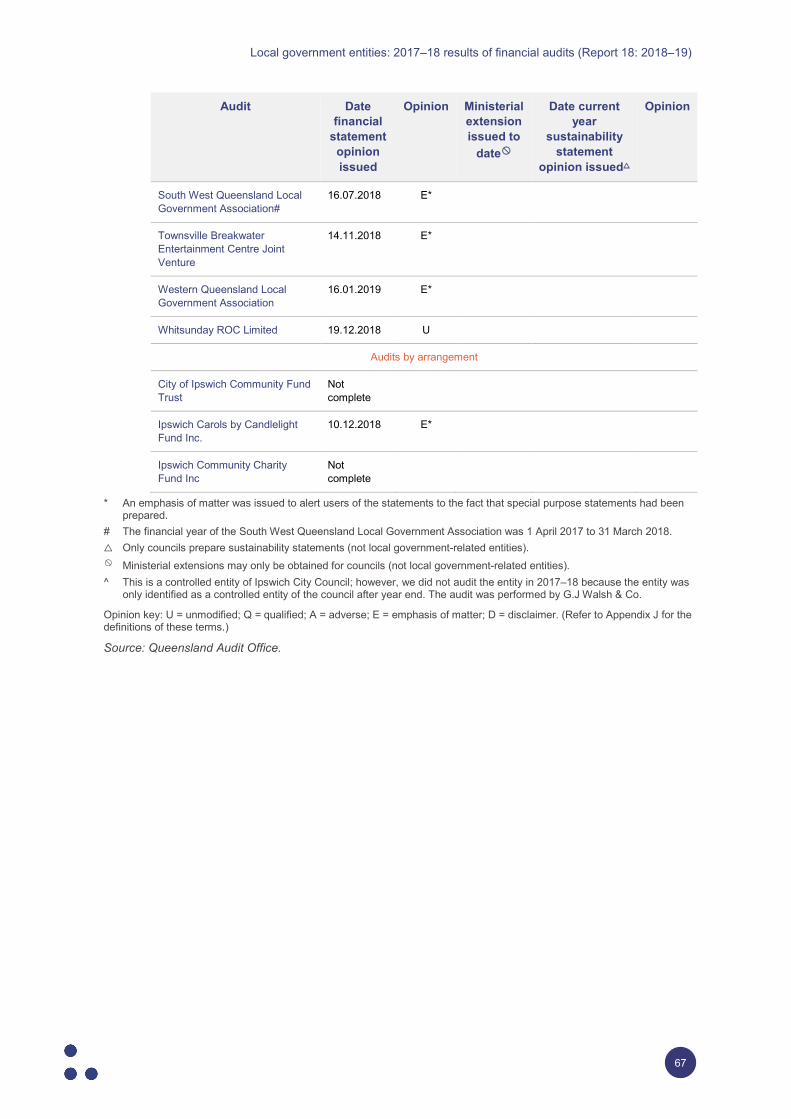
Local government entities: 2017–18 results of financial audits (Report 18: 2018–19)
67
Audit Date financial
statement opinion issued
Opinion Ministerial extension issued to
date🚫🚫
Date current year
sustainability statement
opinion issued△
Opinion
South West Queensland Local Government Association#
16.07.2018 E*
Townsville Breakwater Entertainment Centre Joint Venture
14.11.2018 E*
Western Queensland Local Government Association
16.01.2019 E*
Whitsunday ROC Limited 19.12.2018 U
Audits by arrangement
City of Ipswich Community Fund Trust
Not complete
Ipswich Carols by Candlelight Fund Inc.
10.12.2018 E*
Ipswich Community Charity Fund Inc
Not complete
* An emphasis of matter was issued to alert users of the statements to the fact that special purpose statements had been prepared.
# The financial year of the South West Queensland Local Government Association was 1 April 2017 to 31 March 2018. △ Only councils prepare sustainability statements (not local government-related entities). 🚫🚫 Ministerial extensions may only be obtained for councils (not local government-related entities). ^ This is a controlled entity of Ipswich City Council; however, we did not audit the entity in 2017–18 because the entity was
only identified as a controlled entity of the council after year end. The audit was performed by G.J Walsh & Co.
Opinion key: U = unmodified; Q = qualified; A = adverse; E = emphasis of matter; D = disclaimer. (Refer to Appendix J for the definitions of these terms.)
Source: Queensland Audit Office.
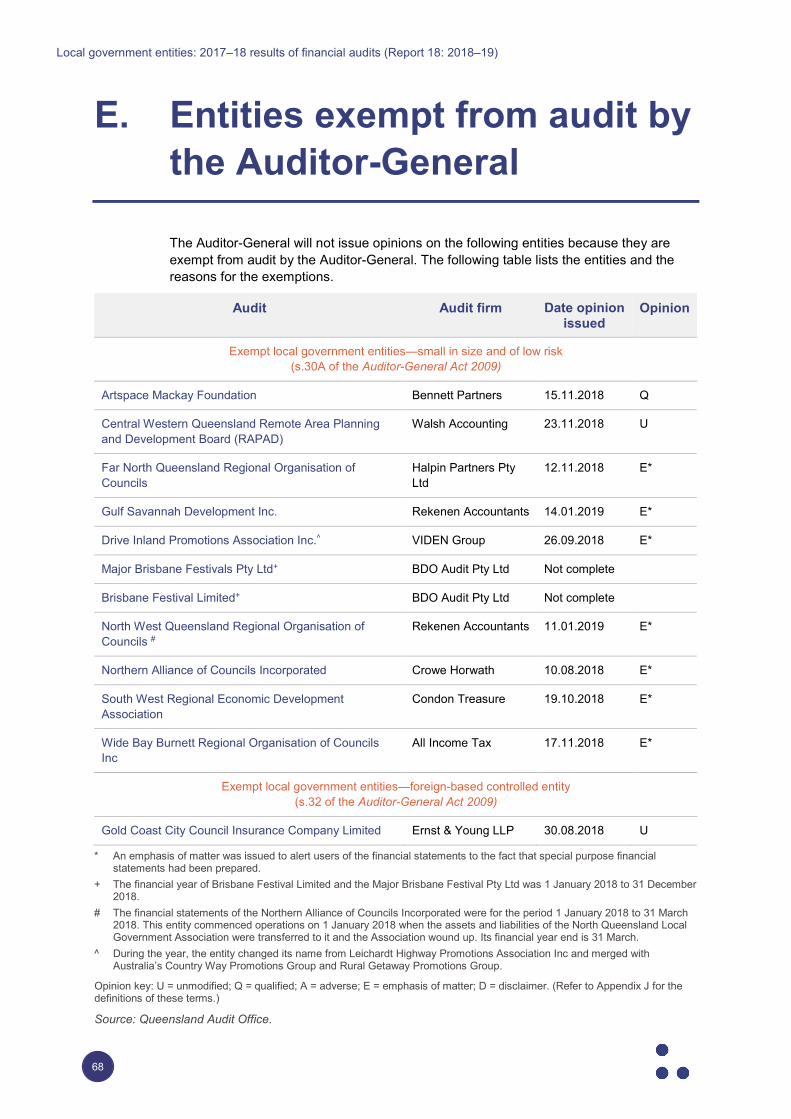
Local government entities: 2017–18 results of financial audits (Report 18: 2018–19)
68
E. Entities exempt from audit by the Auditor-General
The Auditor-General will not issue opinions on the following entities because they are exempt from audit by the Auditor-General. The following table lists the entities and the reasons for the exemptions.
Audit Audit firm Date opinion issued
Opinion
Exempt local government entities—small in size and of low risk (s.30A of the Auditor-General Act 2009)
Artspace Mackay Foundation Bennett Partners 15.11.2018 Q
Central Western Queensland Remote Area Planning and Development Board (RAPAD)
Walsh Accounting 23.11.2018 U
Far North Queensland Regional Organisation of Councils
Halpin Partners Pty Ltd
12.11.2018 E*
Gulf Savannah Development Inc. Rekenen Accountants 14.01.2019 E*
Drive Inland Promotions Association Inc.^ VIDEN Group 26.09.2018 E*
Major Brisbane Festivals Pty Ltd+ BDO Audit Pty Ltd Not complete
Brisbane Festival Limited+ BDO Audit Pty Ltd Not complete
North West Queensland Regional Organisation of Councils #
Rekenen Accountants 11.01.2019 E*
Northern Alliance of Councils Incorporated Crowe Horwath 10.08.2018 E*
South West Regional Economic Development Association
Condon Treasure 19.10.2018 E*
Wide Bay Burnett Regional Organisation of Councils Inc
All Income Tax 17.11.2018 E*
Exempt local government entities—foreign-based controlled entity (s.32 of the Auditor-General Act 2009)
Gold Coast City Council Insurance Company Limited Ernst & Young LLP 30.08.2018 U
* An emphasis of matter was issued to alert users of the financial statements to the fact that special purpose financial statements had been prepared.
+ The financial year of Brisbane Festival Limited and the Major Brisbane Festival Pty Ltd was 1 January 2018 to 31 December 2018.
# The financial statements of the Northern Alliance of Councils Incorporated were for the period 1 January 2018 to 31 March 2018. This entity commenced operations on 1 January 2018 when the assets and liabilities of the North Queensland Local Government Association were transferred to it and the Association wound up. Its financial year end is 31 March.
^ During the year, the entity changed its name from Leichardt Highway Promotions Association Inc and merged with Australia’s Country Way Promotions Group and Rural Getaway Promotions Group.
Opinion key: U = unmodified; Q = qualified; A = adverse; E = emphasis of matter; D = disclaimer. (Refer to Appendix J for the definitions of these terms.)
Source: Queensland Audit Office.
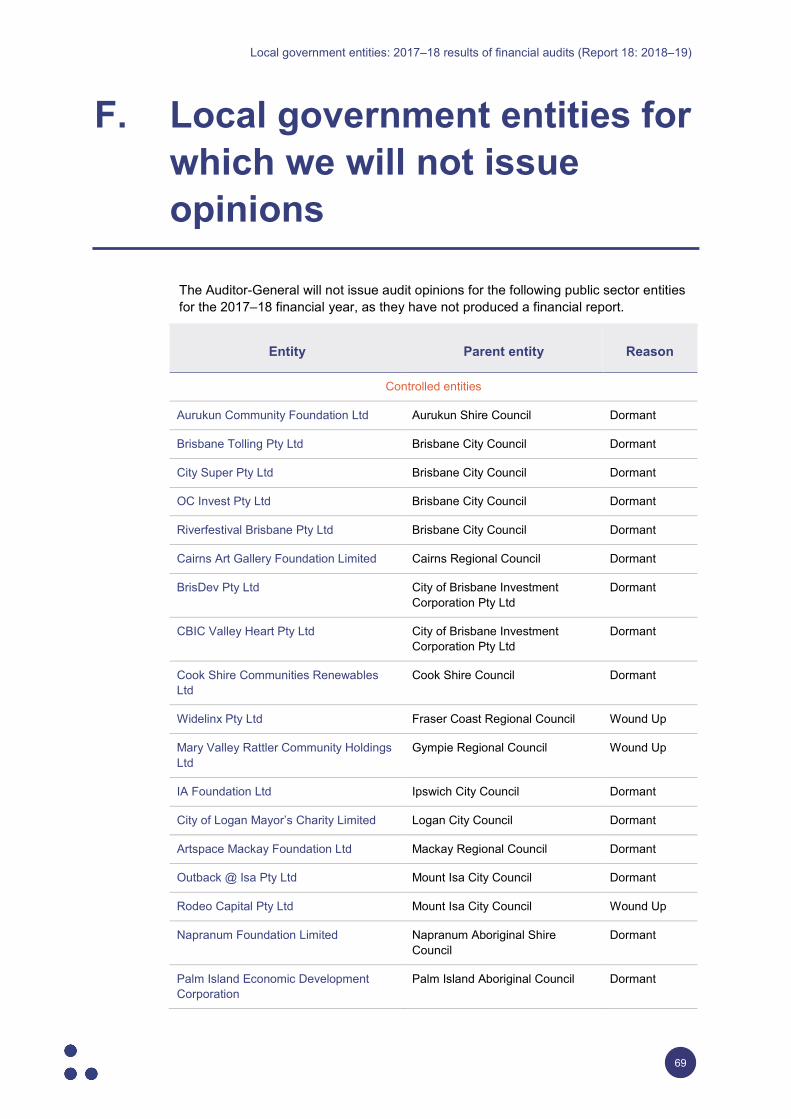
Local government entities: 2017–18 results of financial audits (Report 18: 2018–19)
69
F. Local government entities for which we will not issue opinions
The Auditor-General will not issue audit opinions for the following public sector entities for the 2017–18 financial year, as they have not produced a financial report.
Entity Parent entity Reason
Controlled entities
Aurukun Community Foundation Ltd Aurukun Shire Council Dormant
Brisbane Tolling Pty Ltd Brisbane City Council Dormant
City Super Pty Ltd Brisbane City Council Dormant
OC Invest Pty Ltd Brisbane City Council Dormant
Riverfestival Brisbane Pty Ltd Brisbane City Council Dormant
Cairns Art Gallery Foundation Limited Cairns Regional Council Dormant
BrisDev Pty Ltd City of Brisbane Investment Corporation Pty Ltd
Dormant
CBIC Valley Heart Pty Ltd City of Brisbane Investment Corporation Pty Ltd
Dormant
Cook Shire Communities Renewables Ltd
Cook Shire Council Dormant
Widelinx Pty Ltd Fraser Coast Regional Council Wound Up
Mary Valley Rattler Community Holdings Ltd
Gympie Regional Council Wound Up
IA Foundation Ltd Ipswich City Council Dormant
City of Logan Mayor’s Charity Limited Logan City Council Dormant
Artspace Mackay Foundation Ltd Mackay Regional Council Dormant
Outback @ Isa Pty Ltd Mount Isa City Council Dormant
Rodeo Capital Pty Ltd Mount Isa City Council Wound Up
Napranum Foundation Limited Napranum Aboriginal Shire Council
Dormant
Palm Island Economic Development Corporation
Palm Island Aboriginal Council Dormant
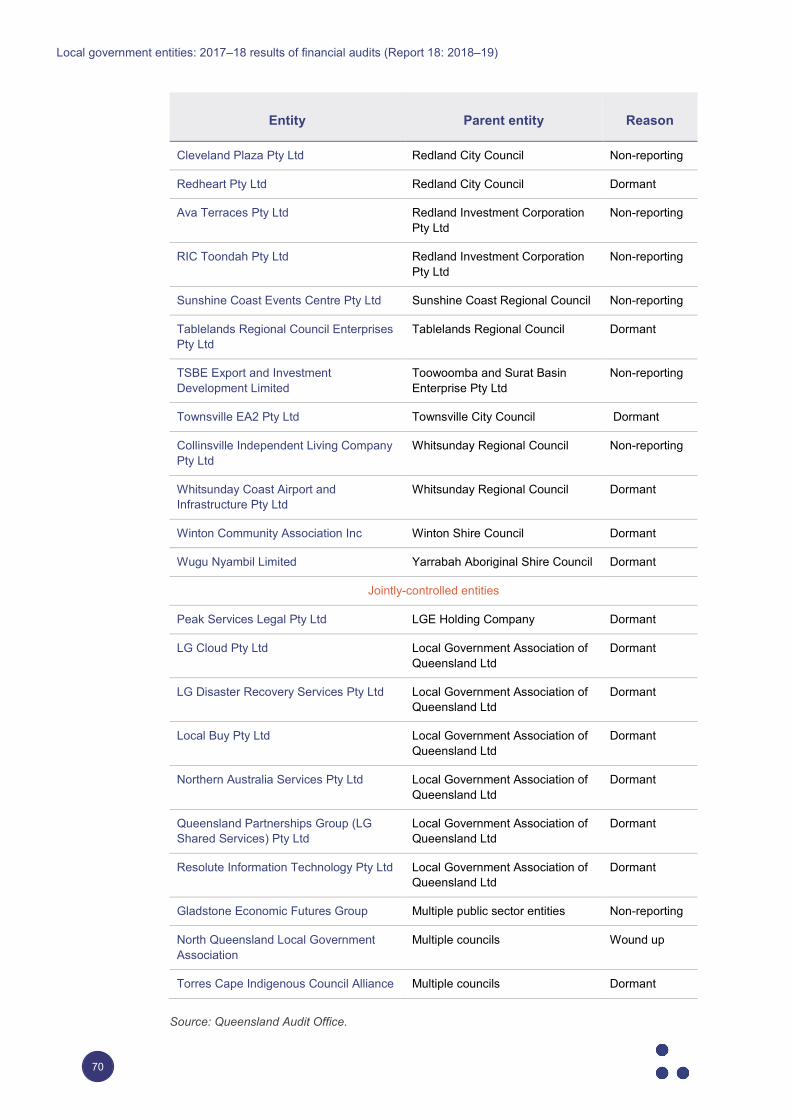
Local government entities: 2017–18 results of financial audits (Report 18: 2018–19)
70
Entity Parent entity Reason
Cleveland Plaza Pty Ltd Redland City Council Non-reporting
Redheart Pty Ltd Redland City Council Dormant
Ava Terraces Pty Ltd Redland Investment Corporation Pty Ltd
Non-reporting
RIC Toondah Pty Ltd Redland Investment Corporation Pty Ltd
Non-reporting
Sunshine Coast Events Centre Pty Ltd Sunshine Coast Regional Council Non-reporting
Tablelands Regional Council Enterprises Pty Ltd
Tablelands Regional Council Dormant
TSBE Export and Investment Development Limited
Toowoomba and Surat Basin Enterprise Pty Ltd
Non-reporting
Townsville EA2 Pty Ltd Townsville City Council Dormant
Collinsville Independent Living Company Pty Ltd
Whitsunday Regional Council Non-reporting
Whitsunday Coast Airport and Infrastructure Pty Ltd
Whitsunday Regional Council Dormant
Winton Community Association Inc Winton Shire Council Dormant
Wugu Nyambil Limited Yarrabah Aboriginal Shire Council Dormant
Jointly-controlled entities
Peak Services Legal Pty Ltd LGE Holding Company Dormant
LG Cloud Pty Ltd Local Government Association of Queensland Ltd
Dormant
LG Disaster Recovery Services Pty Ltd Local Government Association of Queensland Ltd
Dormant
Local Buy Pty Ltd Local Government Association of Queensland Ltd
Dormant
Northern Australia Services Pty Ltd Local Government Association of Queensland Ltd
Dormant
Queensland Partnerships Group (LG Shared Services) Pty Ltd
Local Government Association of Queensland Ltd
Dormant
Resolute Information Technology Pty Ltd Local Government Association of Queensland Ltd
Dormant
Gladstone Economic Futures Group Multiple public sector entities Non-reporting
North Queensland Local Government Association
Multiple councils Wound up
Torres Cape Indigenous Council Alliance Multiple councils Dormant
Source: Queensland Audit Office.
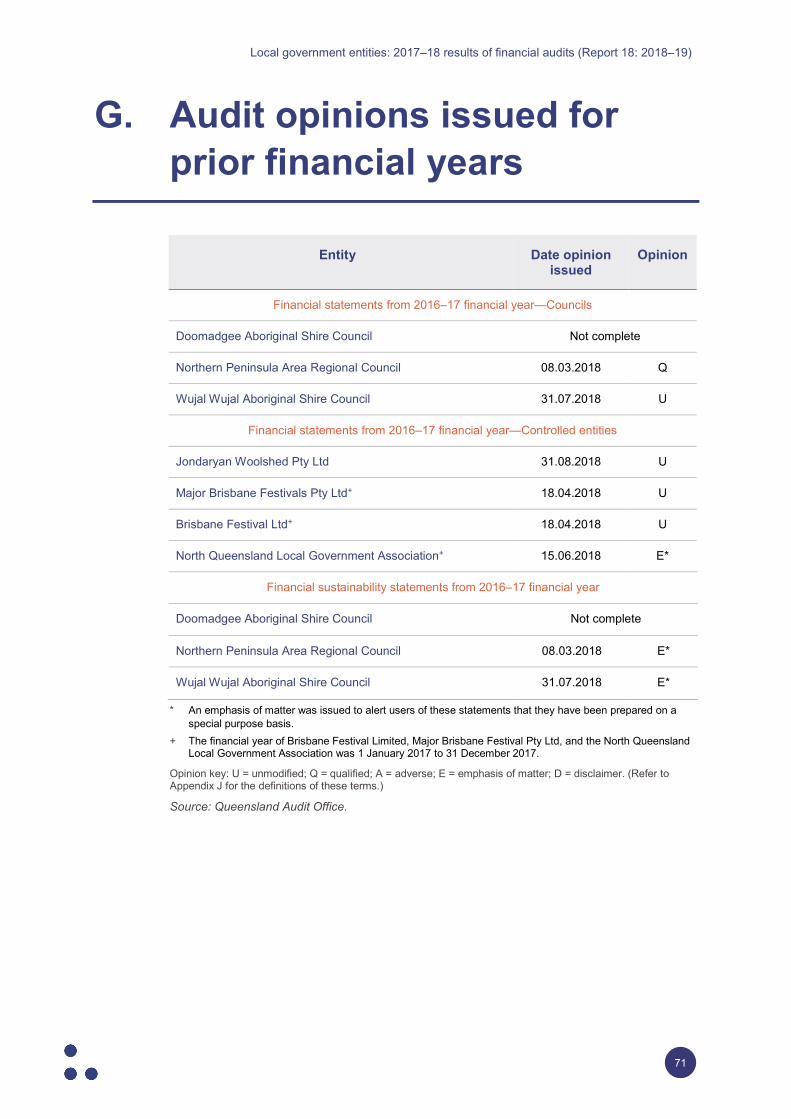
Local government entities: 2017–18 results of financial audits (Report 18: 2018–19)
71
G. Audit opinions issued for prior financial years
* An emphasis of matter was issued to alert users of these statements that they have been prepared on a special purpose basis.
+ The financial year of Brisbane Festival Limited, Major Brisbane Festival Pty Ltd, and the North Queensland Local Government Association was 1 January 2017 to 31 December 2017.
Opinion key: U = unmodified; Q = qualified; A = adverse; E = emphasis of matter; D = disclaimer. (Refer to Appendix J for the definitions of these terms.)
Source: Queensland Audit Office.
Entity Date opinion issued
Opinion
Financial statements from 2016–17 financial year—Councils
Doomadgee Aboriginal Shire Council Not complete
Northern Peninsula Area Regional Council 08.03.2018 Q
Wujal Wujal Aboriginal Shire Council 31.07.2018 U
Financial statements from 2016–17 financial year—Controlled entities
Jondaryan Woolshed Pty Ltd 31.08.2018 U
Major Brisbane Festivals Pty Ltd+ 18.04.2018 U
Brisbane Festival Ltd+ 18.04.2018 U
North Queensland Local Government Association+ 15.06.2018 E*
Financial sustainability statements from 2016–17 financial year
Doomadgee Aboriginal Shire Council Not complete
Northern Peninsula Area Regional Council 08.03.2018 E*
Wujal Wujal Aboriginal Shire Council 31.07.2018 E*
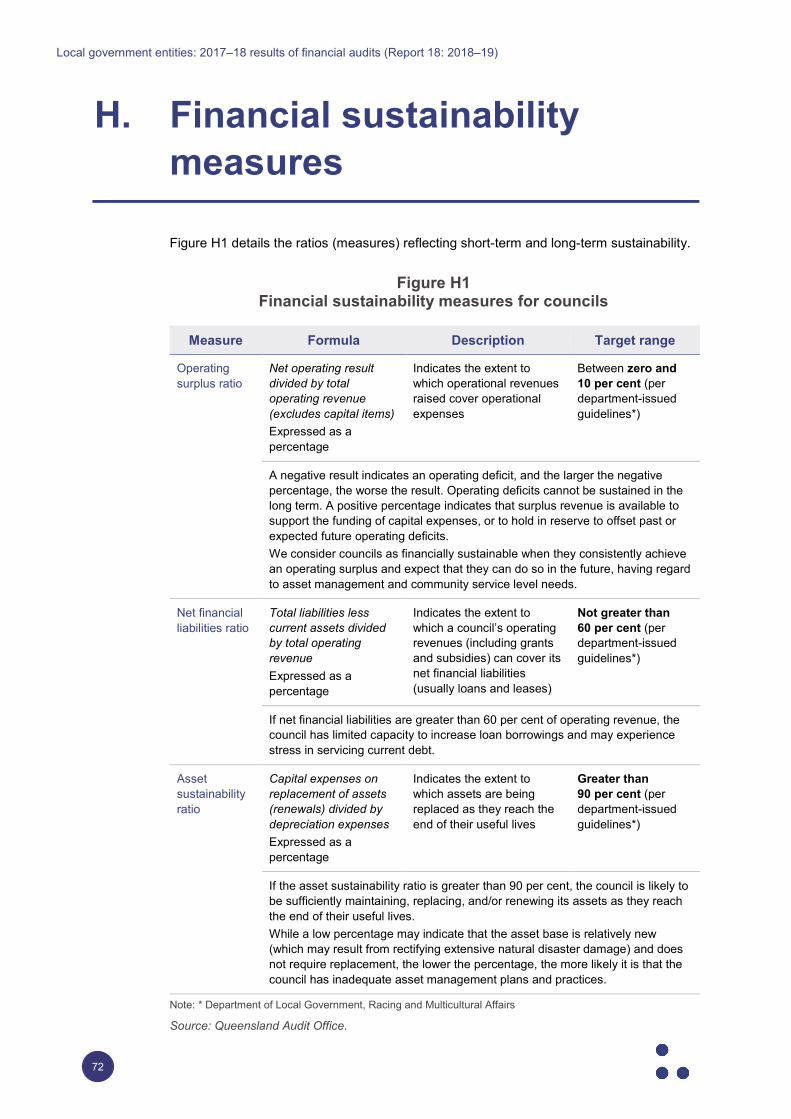
Local government entities: 2017–18 results of financial audits (Report 18: 2018–19)
72
H. Financial sustainability measures
Figure H1 details the ratios (measures) reflecting short-term and long-term sustainability.
Figure H1 Financial sustainability measures for councils
Measure Formula Description Target range
Operating surplus ratio
Net operating result divided by total operating revenue (excludes capital items) Expressed as a percentage
Indicates the extent to which operational revenues raised cover operational expenses
Between zero and 10 per cent (per department-issued guidelines*)
A negative result indicates an operating deficit, and the larger the negative percentage, the worse the result. Operating deficits cannot be sustained in the long term. A positive percentage indicates that surplus revenue is available to support the funding of capital expenses, or to hold in reserve to offset past or expected future operating deficits. We consider councils as financially sustainable when they consistently achieve an operating surplus and expect that they can do so in the future, having regard to asset management and community service level needs.
Net financial liabilities ratio
Total liabilities less current assets divided by total operating revenue Expressed as a percentage
Indicates the extent to which a council’s operating revenues (including grants and subsidies) can cover its net financial liabilities (usually loans and leases)
Not greater than 60 per cent (per department-issued guidelines*)
If net financial liabilities are greater than 60 per cent of operating revenue, the council has limited capacity to increase loan borrowings and may experience stress in servicing current debt.
Asset sustainability ratio
Capital expenses on replacement of assets (renewals) divided by depreciation expenses Expressed as a percentage
Indicates the extent to which assets are being replaced as they reach the end of their useful lives
Greater than 90 per cent (per department-issued guidelines*)
If the asset sustainability ratio is greater than 90 per cent, the council is likely to be sufficiently maintaining, replacing, and/or renewing its assets as they reach the end of their useful lives. While a low percentage may indicate that the asset base is relatively new (which may result from rectifying extensive natural disaster damage) and does not require replacement, the lower the percentage, the more likely it is that the council has inadequate asset management plans and practices.
Note: * Department of Local Government, Racing and Multicultural Affairs
Source: Queensland Audit Office.
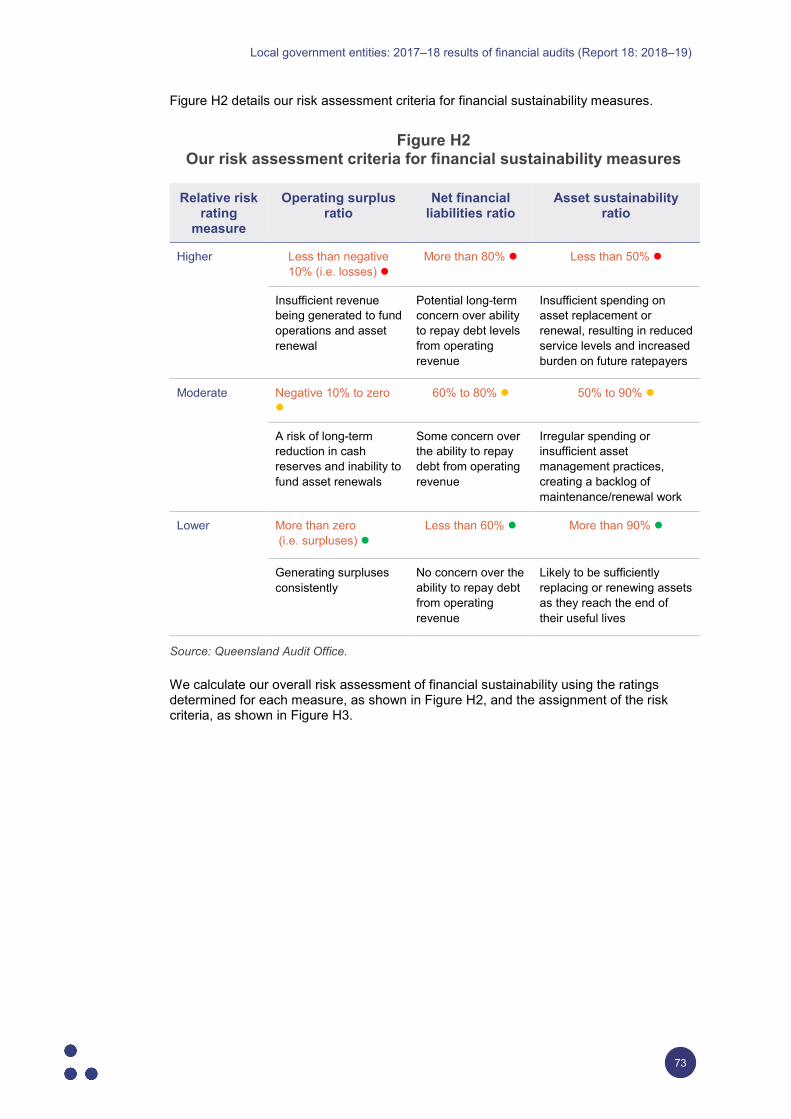
Local government entities: 2017–18 results of financial audits (Report 18: 2018–19)
73
Figure H2 details our risk assessment criteria for financial sustainability measures.
Figure H2 Our risk assessment criteria for financial sustainability measures
Relative risk rating
measure
Operating surplus ratio
Net financial liabilities ratio
Asset sustainability ratio
Higher Less than negative 10% (i.e. losses)
More than 80% Less than 50%
Insufficient revenue being generated to fund operations and asset renewal
Potential long-term concern over ability to repay debt levels from operating revenue
Insufficient spending on asset replacement or renewal, resulting in reduced service levels and increased burden on future ratepayers
Moderate Negative 10% to zero
60% to 80% 50% to 90%
A risk of long-term reduction in cash reserves and inability to fund asset renewals
Some concern over the ability to repay debt from operating revenue
Irregular spending or insufficient asset management practices, creating a backlog of maintenance/renewal work
Lower More than zero (i.e. surpluses)
Less than 60% More than 90%
Generating surpluses consistently
No concern over the ability to repay debt from operating revenue
Likely to be sufficiently replacing or renewing assets as they reach the end of their useful lives
Source: Queensland Audit Office.
We calculate our overall risk assessment of financial sustainability using the ratings determined for each measure, as shown in Figure H2, and the assignment of the risk criteria, as shown in Figure H3.
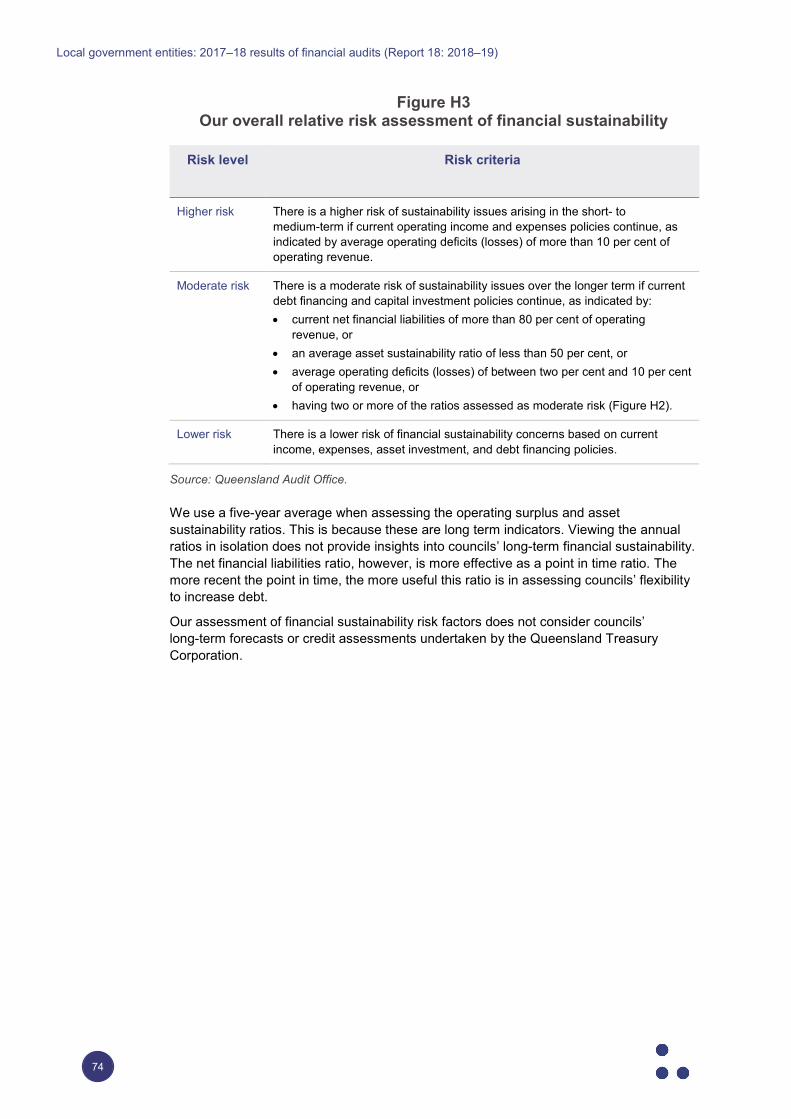
Local government entities: 2017–18 results of financial audits (Report 18: 2018–19)
74
Figure H3 Our overall relative risk assessment of financial sustainability
Risk level Risk criteria
Higher risk There is a higher risk of sustainability issues arising in the short- to medium-term if current operating income and expenses policies continue, as indicated by average operating deficits (losses) of more than 10 per cent of operating revenue.
Moderate risk There is a moderate risk of sustainability issues over the longer term if current debt financing and capital investment policies continue, as indicated by: • current net financial liabilities of more than 80 per cent of operating
revenue, or • an average asset sustainability ratio of less than 50 per cent, or • average operating deficits (losses) of between two per cent and 10 per cent
of operating revenue, or • having two or more of the ratios assessed as moderate risk (Figure H2).
Lower risk There is a lower risk of financial sustainability concerns based on current income, expenses, asset investment, and debt financing policies.
Source: Queensland Audit Office.
We use a five-year average when assessing the operating surplus and asset sustainability ratios. This is because these are long term indicators. Viewing the annual ratios in isolation does not provide insights into councils’ long-term financial sustainability. The net financial liabilities ratio, however, is more effective as a point in time ratio. The more recent the point in time, the more useful this ratio is in assessing councils’ flexibility to increase debt.
Our assessment of financial sustainability risk factors does not consider councils’ long-term forecasts or credit assessments undertaken by the Queensland Treasury Corporation.
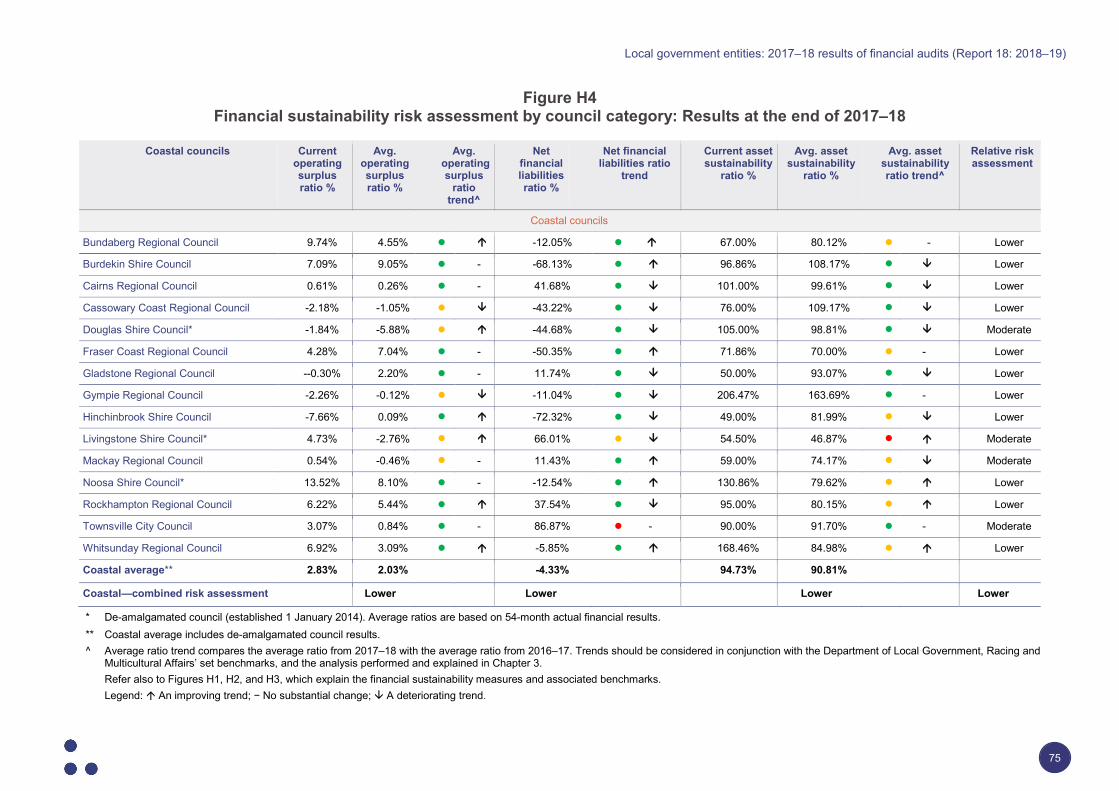
Local government entities: 2017–18 results of financial audits (Report 18: 2018–19)
75
Figure H4 Financial sustainability risk assessment by council category: Results at the end of 2017–18
Coastal councils Current operating surplus ratio %
Avg. operating surplus ratio %
Avg. operating
surplus ratio
trend^
Net financial liabilities ratio %
Net financial liabilities ratio
trend
Current asset sustainability
ratio %
Avg. asset sustainability
ratio %
Avg. asset sustainability ratio trend^
Relative risk assessment
Coastal councils
Bundaberg Regional Council 9.74% 4.55% -12.05% 67.00% 80.12% - Lower
Burdekin Shire Council 7.09% 9.05% - -68.13% 96.86% 108.17% Lower
Cairns Regional Council 0.61% 0.26% - 41.68% 101.00% 99.61% Lower
Cassowary Coast Regional Council -2.18% -1.05% -43.22% 76.00% 109.17% Lower
Douglas Shire Council* -1.84% -5.88% -44.68% 105.00% 98.81% Moderate
Fraser Coast Regional Council 4.28% 7.04% - -50.35% 71.86% 70.00% - Lower
Gladstone Regional Council --0.30% 2.20% - 11.74% 50.00% 93.07% Lower
Gympie Regional Council -2.26% -0.12% -11.04% 206.47% 163.69% - Lower
Hinchinbrook Shire Council -7.66% 0.09% -72.32% 49.00% 81.99% Lower
Livingstone Shire Council* 4.73% -2.76% 66.01% 54.50% 46.87% Moderate
Mackay Regional Council 0.54% -0.46% - 11.43% 59.00% 74.17% Moderate
Noosa Shire Council* 13.52% 8.10% - -12.54% 130.86% 79.62% Lower
Rockhampton Regional Council 6.22% 5.44% 37.54% 95.00% 80.15% Lower
Townsville City Council 3.07% 0.84% - 86.87% - 90.00% 91.70% - Moderate
Whitsunday Regional Council 6.92% 3.09% -5.85% 168.46% 84.98% Lower
Coastal average** 2.83% 2.03% -4.33% 94.73% 90.81%
Coastal—combined risk assessment Lower Lower Lower Lower
* De-amalgamated council (established 1 January 2014). Average ratios are based on 54-month actual financial results. ** Coastal average includes de-amalgamated council results. ^ Average ratio trend compares the average ratio from 2017–18 with the average ratio from 2016–17. Trends should be considered in conjunction with the Department of Local Government, Racing and
Multicultural Affairs’ set benchmarks, and the analysis performed and explained in Chapter 3. Refer also to Figures H1, H2, and H3, which explain the financial sustainability measures and associated benchmarks. Legend: An improving trend; − No substantial change; A deteriorating trend.
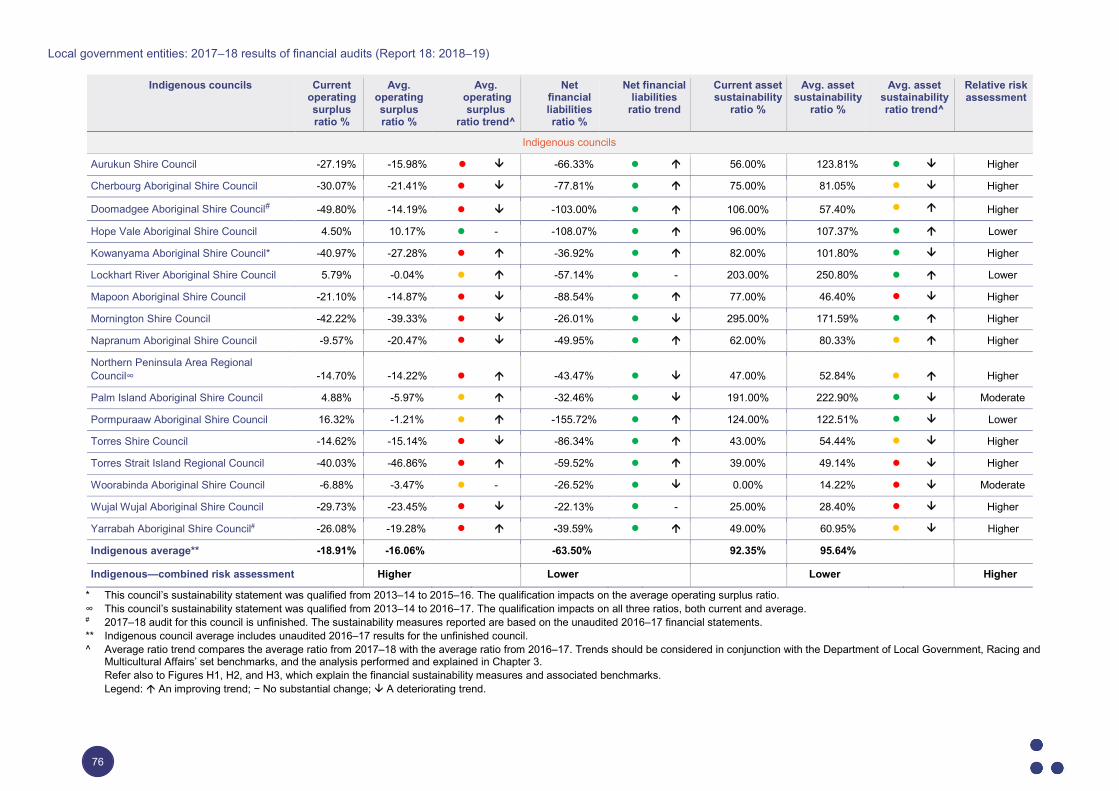
Local government entities: 2017–18 results of financial audits (Report 18: 2018–19)
76
Indigenous councils Current operating surplus ratio %
Avg. operating surplus ratio %
Avg. operating
surplus ratio trend^
Net financial liabilities ratio %
Net financial liabilities
ratio trend
Current asset sustainability
ratio %
Avg. asset sustainability
ratio %
Avg. asset sustainability ratio trend^
Relative risk assessment
Indigenous councils
Aurukun Shire Council -27.19% -15.98% -66.33% 56.00% 123.81% Higher
Cherbourg Aboriginal Shire Council -30.07% -21.41% -77.81% 75.00% 81.05% Higher
Doomadgee Aboriginal Shire Council# -49.80% -14.19% -103.00% 106.00% 57.40% Higher
Hope Vale Aboriginal Shire Council 4.50% 10.17% - -108.07% 96.00% 107.37% Lower
Kowanyama Aboriginal Shire Council* -40.97% -27.28% -36.92% 82.00% 101.80% Higher
Lockhart River Aboriginal Shire Council 5.79% -0.04% -57.14% - 203.00% 250.80% Lower
Mapoon Aboriginal Shire Council -21.10% -14.87% -88.54% 77.00% 46.40% Higher
Mornington Shire Council -42.22% -39.33% -26.01% 295.00% 171.59% Higher
Napranum Aboriginal Shire Council -9.57% -20.47% -49.95% 62.00% 80.33% Higher
Northern Peninsula Area Regional Council∞ -14.70% -14.22% -43.47% 47.00% 52.84% Higher
Palm Island Aboriginal Shire Council 4.88% -5.97% -32.46% 191.00% 222.90% Moderate
Pormpuraaw Aboriginal Shire Council 16.32% -1.21% -155.72% 124.00% 122.51% Lower
Torres Shire Council -14.62% -15.14% -86.34% 43.00% 54.44% Higher
Torres Strait Island Regional Council -40.03% -46.86% -59.52% 39.00% 49.14% Higher
Woorabinda Aboriginal Shire Council -6.88% -3.47% - -26.52% 0.00% 14.22% Moderate
Wujal Wujal Aboriginal Shire Council -29.73% -23.45% -22.13% - 25.00% 28.40% Higher
Yarrabah Aboriginal Shire Council# -26.08% -19.28% -39.59% 49.00% 60.95% Higher
Indigenous average** -18.91% -16.06% -63.50% 92.35% 95.64%
Indigenous—combined risk assessment Higher Lower Lower Higher
* This council’s sustainability statement was qualified from 2013–14 to 2015–16. The qualification impacts on the average operating surplus ratio. ∞ This council’s sustainability statement was qualified from 2013–14 to 2016–17. The qualification impacts on all three ratios, both current and average. # 2017–18 audit for this council is unfinished. The sustainability measures reported are based on the unaudited 2016–17 financial statements. ** Indigenous council average includes unaudited 2016–17 results for the unfinished council. ^ Average ratio trend compares the average ratio from 2017–18 with the average ratio from 2016–17. Trends should be considered in conjunction with the Department of Local Government, Racing and
Multicultural Affairs’ set benchmarks, and the analysis performed and explained in Chapter 3. Refer also to Figures H1, H2, and H3, which explain the financial sustainability measures and associated benchmarks. Legend: An improving trend; − No substantial change; A deteriorating trend.
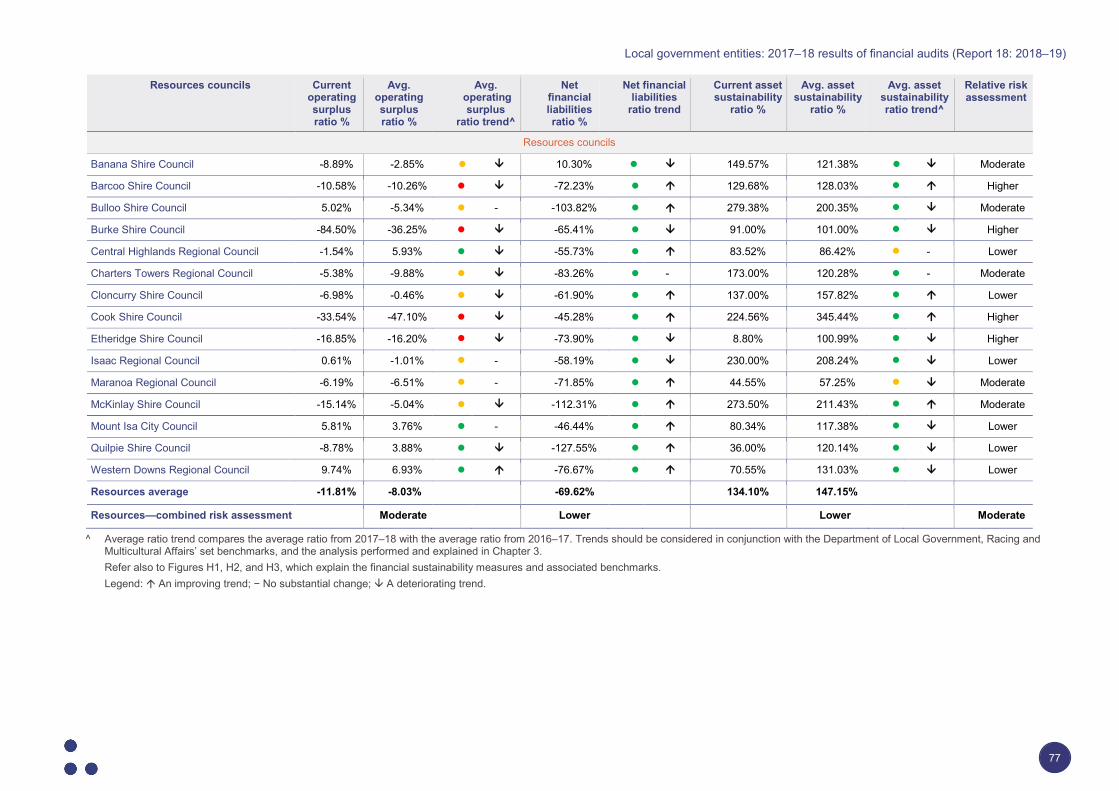
Local government entities: 2017–18 results of financial audits (Report 18: 2018–19)
77
Resources councils Current operating surplus ratio %
Avg. operating surplus ratio %
Avg. operating
surplus ratio trend^
Net financial liabilities ratio %
Net financial liabilities
ratio trend
Current asset sustainability
ratio %
Avg. asset sustainability
ratio %
Avg. asset sustainability ratio trend^
Relative risk assessment
Resources councils
Banana Shire Council -8.89% -2.85% 10.30% 149.57% 121.38% Moderate
Barcoo Shire Council -10.58% -10.26% -72.23% 129.68% 128.03% Higher
Bulloo Shire Council 5.02% -5.34% - -103.82% 279.38% 200.35% Moderate
Burke Shire Council -84.50% -36.25% -65.41% 91.00% 101.00% Higher
Central Highlands Regional Council -1.54% 5.93% -55.73% 83.52% 86.42% - Lower
Charters Towers Regional Council -5.38% -9.88% -83.26% - 173.00% 120.28% - Moderate
Cloncurry Shire Council -6.98% -0.46% -61.90% 137.00% 157.82% Lower
Cook Shire Council -33.54% -47.10% -45.28% 224.56% 345.44% Higher
Etheridge Shire Council -16.85% -16.20% -73.90% 8.80% 100.99% Higher
Isaac Regional Council 0.61% -1.01% - -58.19% 230.00% 208.24% Lower
Maranoa Regional Council -6.19% -6.51% - -71.85% 44.55% 57.25% Moderate
McKinlay Shire Council -15.14% -5.04% -112.31% 273.50% 211.43% Moderate
Mount Isa City Council 5.81% 3.76% - -46.44% 80.34% 117.38% Lower
Quilpie Shire Council -8.78% 3.88% -127.55% 36.00% 120.14% Lower
Western Downs Regional Council 9.74% 6.93% -76.67% 70.55% 131.03% Lower
Resources average -11.81% -8.03% -69.62% 134.10% 147.15%
Resources—combined risk assessment Moderate Lower Lower Moderate
^ Average ratio trend compares the average ratio from 2017–18 with the average ratio from 2016–17. Trends should be considered in conjunction with the Department of Local Government, Racing and Multicultural Affairs’ set benchmarks, and the analysis performed and explained in Chapter 3.
Refer also to Figures H1, H2, and H3, which explain the financial sustainability measures and associated benchmarks. Legend: An improving trend; − No substantial change; A deteriorating trend.
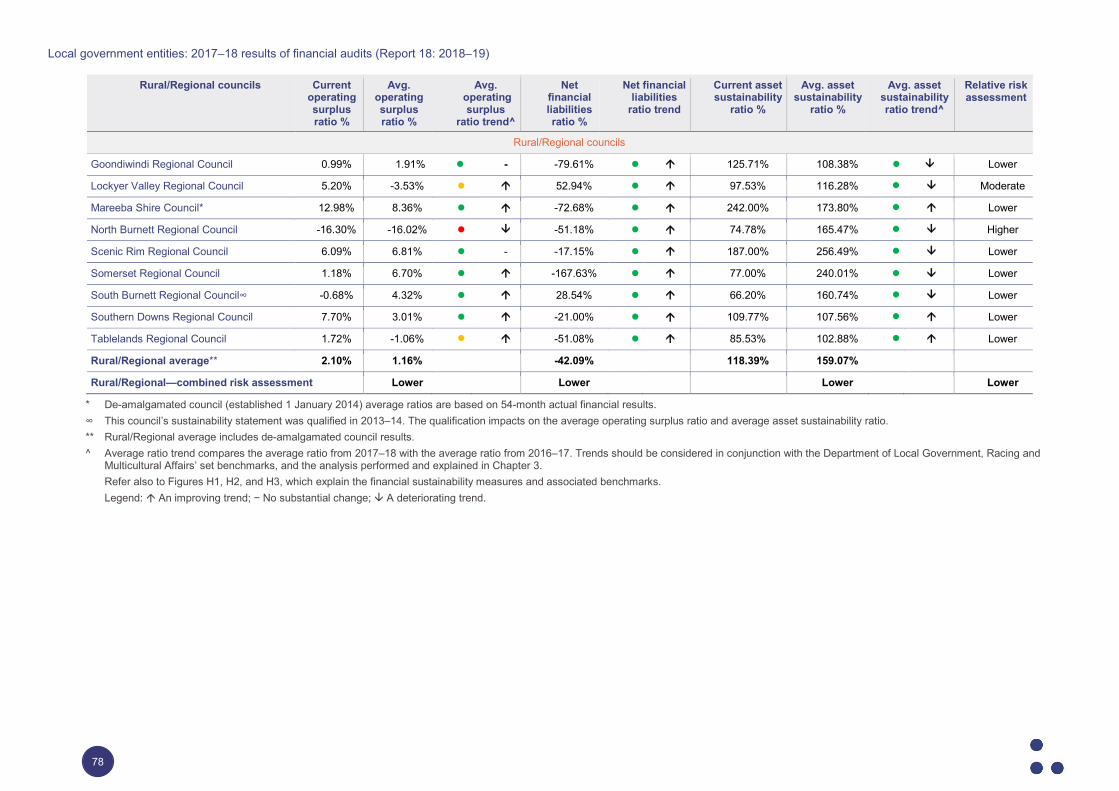
Local government entities: 2017–18 results of financial audits (Report 18: 2018–19)
78
Rural/Regional councils Current operating surplus ratio %
Avg. operating surplus ratio %
Avg. operating
surplus ratio trend^
Net financial liabilities ratio %
Net financial liabilities
ratio trend
Current asset sustainability
ratio %
Avg. asset sustainability
ratio %
Avg. asset sustainability ratio trend^
Relative risk assessment
Rural/Regional councils
Goondiwindi Regional Council 0.99% 1.91% - -79.61% 125.71% 108.38% Lower
Lockyer Valley Regional Council 5.20% -3.53% 52.94% 97.53% 116.28% Moderate
Mareeba Shire Council* 12.98% 8.36% -72.68% 242.00% 173.80% Lower
North Burnett Regional Council -16.30% -16.02% -51.18% 74.78% 165.47% Higher
Scenic Rim Regional Council 6.09% 6.81% - -17.15% 187.00% 256.49% Lower
Somerset Regional Council 1.18% 6.70% -167.63% 77.00% 240.01% Lower
South Burnett Regional Council∞ -0.68% 4.32% 28.54% 66.20% 160.74% Lower
Southern Downs Regional Council 7.70% 3.01% -21.00% 109.77% 107.56% Lower
Tablelands Regional Council 1.72% -1.06% -51.08% 85.53% 102.88% Lower
Rural/Regional average** 2.10% 1.16% -42.09% 118.39% 159.07%
Rural/Regional—combined risk assessment Lower Lower Lower Lower
* De-amalgamated council (established 1 January 2014) average ratios are based on 54-month actual financial results. ∞ This council’s sustainability statement was qualified in 2013–14. The qualification impacts on the average operating surplus ratio and average asset sustainability ratio. ** Rural/Regional average includes de-amalgamated council results. ^ Average ratio trend compares the average ratio from 2017–18 with the average ratio from 2016–17. Trends should be considered in conjunction with the Department of Local Government, Racing and
Multicultural Affairs’ set benchmarks, and the analysis performed and explained in Chapter 3. Refer also to Figures H1, H2, and H3, which explain the financial sustainability measures and associated benchmarks. Legend: An improving trend; − No substantial change; A deteriorating trend.
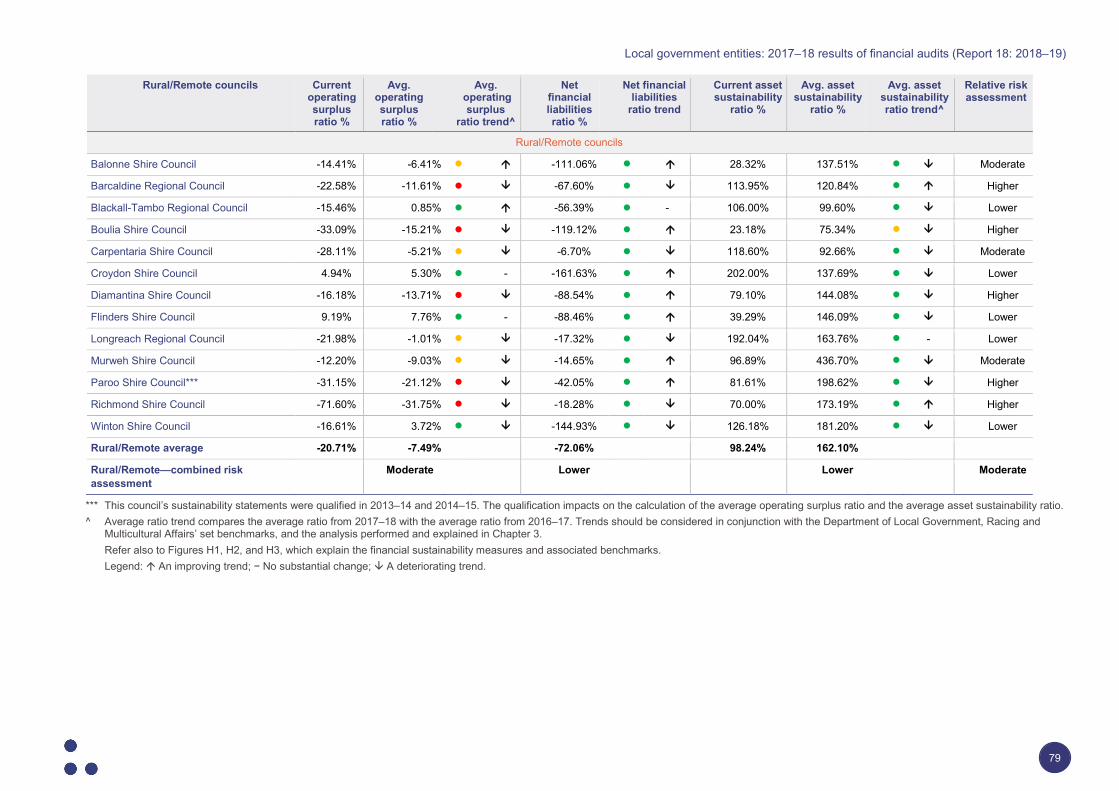
Local government entities: 2017–18 results of financial audits (Report 18: 2018–19)
79
Rural/Remote councils Current operating surplus ratio %
Avg. operating surplus ratio %
Avg. operating
surplus ratio trend^
Net financial liabilities ratio %
Net financial liabilities
ratio trend
Current asset sustainability
ratio %
Avg. asset sustainability
ratio %
Avg. asset sustainability ratio trend^
Relative risk assessment
Rural/Remote councils
Balonne Shire Council -14.41% -6.41% -111.06% 28.32% 137.51% Moderate
Barcaldine Regional Council -22.58% -11.61% -67.60% 113.95% 120.84% Higher
Blackall-Tambo Regional Council -15.46% 0.85% -56.39% - 106.00% 99.60% Lower
Boulia Shire Council -33.09% -15.21% -119.12% 23.18% 75.34% Higher
Carpentaria Shire Council -28.11% -5.21% -6.70% 118.60% 92.66% Moderate
Croydon Shire Council 4.94% 5.30% - -161.63% 202.00% 137.69% Lower
Diamantina Shire Council -16.18% -13.71% -88.54% 79.10% 144.08% Higher
Flinders Shire Council 9.19% 7.76% - -88.46% 39.29% 146.09% Lower
Longreach Regional Council -21.98% -1.01% -17.32% 192.04% 163.76% - Lower
Murweh Shire Council -12.20% -9.03% -14.65% 96.89% 436.70% Moderate
Paroo Shire Council*** -31.15% -21.12% -42.05% 81.61% 198.62% Higher
Richmond Shire Council -71.60% -31.75% -18.28% 70.00% 173.19% Higher
Winton Shire Council -16.61% 3.72% -144.93% 126.18% 181.20% Lower
Rural/Remote average -20.71% -7.49% -72.06% 98.24% 162.10%
Rural/Remote—combined risk assessment
Moderate Lower Lower Moderate
*** This council’s sustainability statements were qualified in 2013–14 and 2014–15. The qualification impacts on the calculation of the average operating surplus ratio and the average asset sustainability ratio. ^ Average ratio trend compares the average ratio from 2017–18 with the average ratio from 2016–17. Trends should be considered in conjunction with the Department of Local Government, Racing and
Multicultural Affairs’ set benchmarks, and the analysis performed and explained in Chapter 3. Refer also to Figures H1, H2, and H3, which explain the financial sustainability measures and associated benchmarks. Legend: An improving trend; − No substantial change; A deteriorating trend.
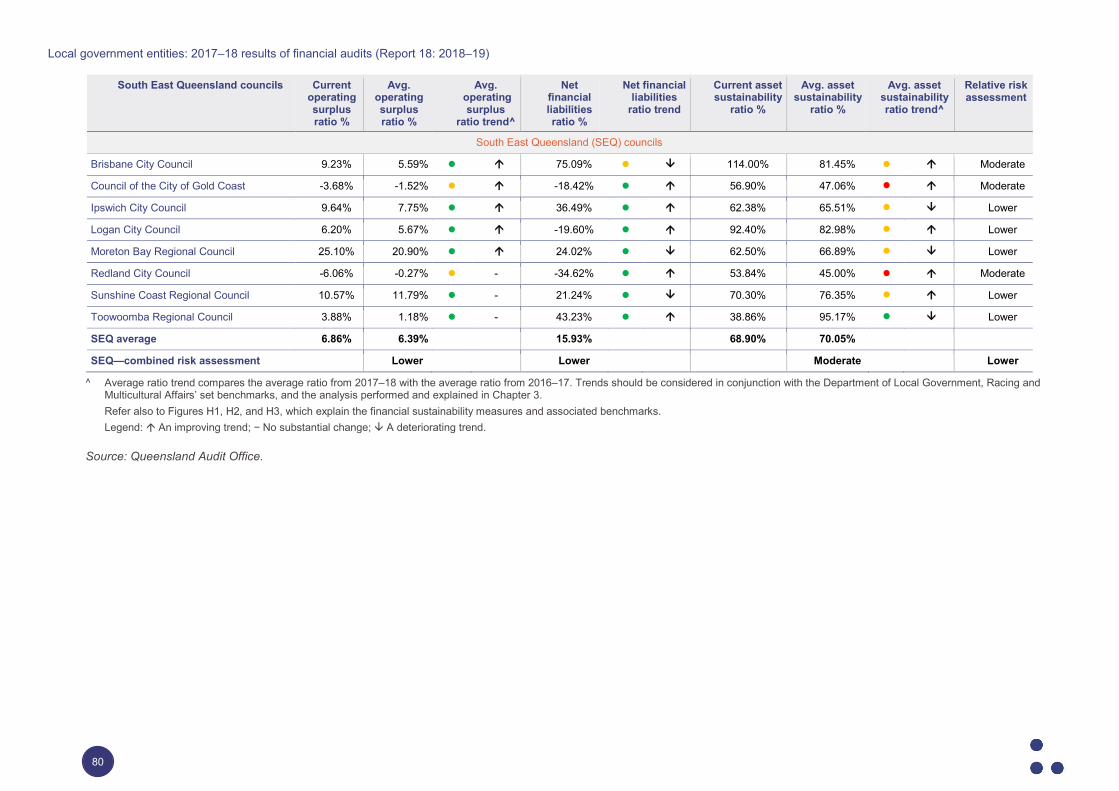
Local government entities: 2017–18 results of financial audits (Report 18: 2018–19)
80
South East Queensland councils Current operating surplus ratio %
Avg. operating surplus ratio %
Avg. operating
surplus ratio trend^
Net financial liabilities ratio %
Net financial liabilities
ratio trend
Current asset sustainability
ratio %
Avg. asset sustainability
ratio %
Avg. asset sustainability ratio trend^
Relative risk assessment
South East Queensland (SEQ) councils
Brisbane City Council 9.23% 5.59% 75.09% 114.00% 81.45% Moderate
Council of the City of Gold Coast -3.68% -1.52% -18.42% 56.90% 47.06% Moderate
Ipswich City Council 9.64% 7.75% 36.49% 62.38% 65.51% Lower
Logan City Council 6.20% 5.67% -19.60% 92.40% 82.98% Lower
Moreton Bay Regional Council 25.10% 20.90% 24.02% 62.50% 66.89% Lower
Redland City Council -6.06% -0.27% - -34.62% 53.84% 45.00% Moderate
Sunshine Coast Regional Council 10.57% 11.79% - 21.24% 70.30% 76.35% Lower
Toowoomba Regional Council 3.88% 1.18% - 43.23% 38.86% 95.17% Lower
SEQ average 6.86% 6.39% 15.93% 68.90% 70.05%
SEQ—combined risk assessment Lower Lower Moderate Lower
^ Average ratio trend compares the average ratio from 2017–18 with the average ratio from 2016–17. Trends should be considered in conjunction with the Department of Local Government, Racing and Multicultural Affairs’ set benchmarks, and the analysis performed and explained in Chapter 3.
Refer also to Figures H1, H2, and H3, which explain the financial sustainability measures and associated benchmarks. Legend: An improving trend; − No substantial change; A deteriorating trend.
Source: Queensland Audit Office.
Local government entities: 2017–18 results of financial audits (Report 18: 2018–19)
81
I. Our assessment of councils’ financial governance
Auditing internal controls Entities design, implement, and maintain internal controls to mitigate risks that may prevent them from achieving reliable financial reporting, effective and efficient operations, and compliance with applicable laws and regulations.
In undertaking our audit, we are required under the Australian auditing standards to obtain an understanding of an entity’s internal controls relevant to the preparation of the financial report.
We assess internal controls to ensure they are suitably designed to prevent, or detect and correct, material misstatements in the financial report, and achieve compliance with legislative requirements and appropriate use of public resources.
Our assessment determines the nature, timing, and extent of the testing we perform to address the risk of material misstatement in the financial statements.
Where we believe the design and implementation of controls is effective, we select the controls we intend to test further by considering a balance of factors including:
• significance of the related risks
• characteristics of balances, transactions, or disclosures (volume, value, and complexity)
• nature and complexity of the entity’s information systems
• whether the design of the controls addresses the risk of material misstatement and facilitates an efficient audit.
Where we identify deficiencies in internal controls, we determine the impact on our audit approach, considering whether additional audit procedures are necessary to address the risk of material misstatement in the financial statements.
We design our audit procedures to address the risk of material misstatement, so we can express an opinion on the financial report. We do not express an opinion on the effectiveness of internal controls.
Internal controls framework We categorise internal controls using the Committee of Sponsoring Organizations of the Treadway Commission (COSO) internal controls framework, which is widely recognised as a benchmark for designing and evaluating internal controls.
The framework identifies five components for a successful internal control system. These components are explained in the following paragraphs.
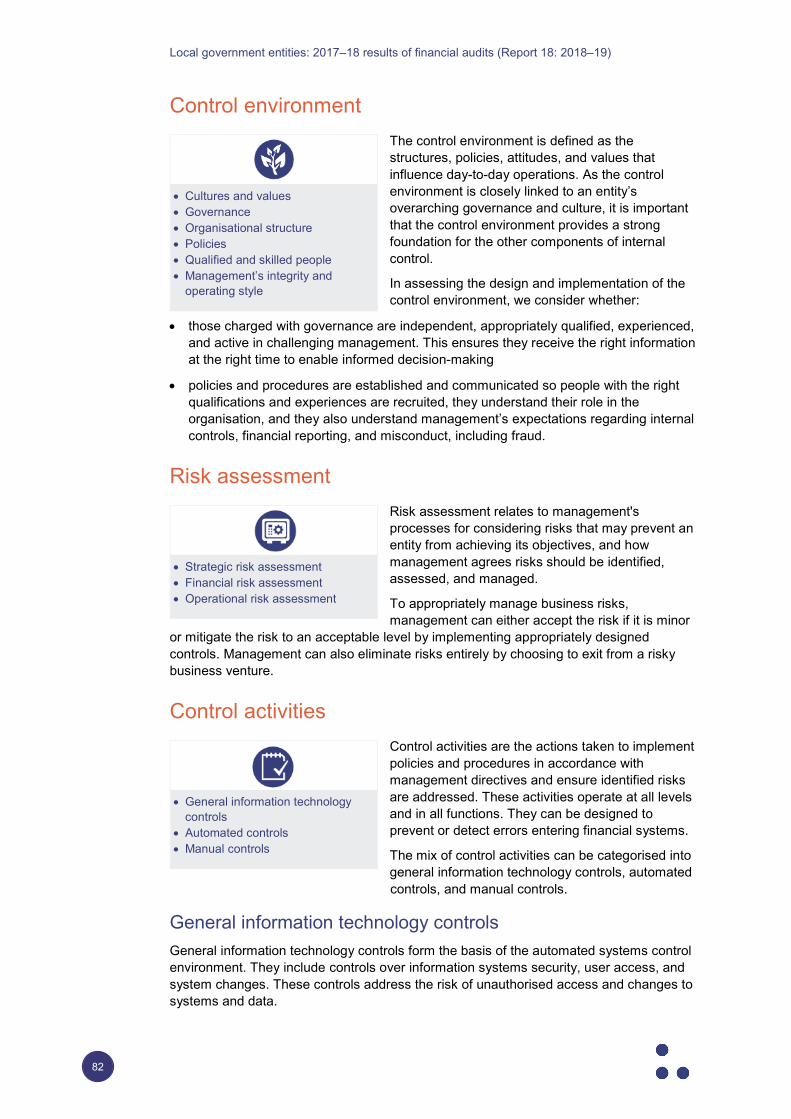
Local government entities: 2017–18 results of financial audits (Report 18: 2018–19)
82
Control environment The control environment is defined as the structures, policies, attitudes, and values that influence day-to-day operations. As the control environment is closely linked to an entity’s overarching governance and culture, it is important that the control environment provides a strong foundation for the other components of internal control.
In assessing the design and implementation of the control environment, we consider whether:
• those charged with governance are independent, appropriately qualified, experienced, and active in challenging management. This ensures they receive the right information at the right time to enable informed decision-making
• policies and procedures are established and communicated so people with the right qualifications and experiences are recruited, they understand their role in the organisation, and they also understand management’s expectations regarding internal controls, financial reporting, and misconduct, including fraud.
Risk assessment Risk assessment relates to management's processes for considering risks that may prevent an entity from achieving its objectives, and how management agrees risks should be identified, assessed, and managed.
To appropriately manage business risks, management can either accept the risk if it is minor
or mitigate the risk to an acceptable level by implementing appropriately designed controls. Management can also eliminate risks entirely by choosing to exit from a risky business venture.
Control activities Control activities are the actions taken to implement policies and procedures in accordance with management directives and ensure identified risks are addressed. These activities operate at all levels and in all functions. They can be designed to prevent or detect errors entering financial systems.
The mix of control activities can be categorised into general information technology controls, automated controls, and manual controls.
General information technology controls General information technology controls form the basis of the automated systems control environment. They include controls over information systems security, user access, and system changes. These controls address the risk of unauthorised access and changes to systems and data.
• Cultures and values • Governance • Organisational structure • Policies • Qualified and skilled people • Management’s integrity and
operating style
• Strategic risk assessment • Financial risk assessment • Operational risk assessment
• General information technology controls
• Automated controls • Manual controls
Local government entities: 2017–18 results of financial audits (Report 18: 2018–19)
83
Automated control activities Automated controls are embedded within information technology systems. These controls can improve timeliness, availability, and accuracy of information by consistently applying predefined business rules. They enable entities to perform complex calculations when processing large volumes of transactions. They also improve the effectiveness of financial delegations and the segregation of duties.
Manual control activities Manual controls contain a human element, which can provide the opportunity to assess the reasonableness and appropriateness of transactions. However, these controls may be less reliable than automated elements as they can be more easily bypassed or overridden. They include activities such as approvals, authorisations, verifications, reconciliations, reviews of operating performance, and segregation of incompatible duties. Manual controls may be performed with the aid of information technology systems.
Information and communication Information and communication controls are the systems used to provide information to employees, and the ways in which responsibilities are communicated.
This aspect of internal control also considers how management generates financial reports, and how these reports are communicated to internal and external parties to support the functioning of internal controls.
Monitoring activities Monitoring activities are the methods management uses to oversee and assess whether internal controls are present and operating effectively. This may be achieved through ongoing supervision, periodic self-assessments, and separate evaluations. Monitoring activities also concern the evaluation and communication of control deficiencies in a timely manner to effect corrective action.
Typically, the internal audit function and an independent audit and risk committee are responsible for assessing and overseeing management’s implementation of controls and their resolution of control deficiencies. These two functions work together to ensure that internal control deficiencies are identified and then resolved in a timely manner.
• Non-financial systems • Financial systems • Reporting systems
• Management supervision • Self-assessment • Internal audit
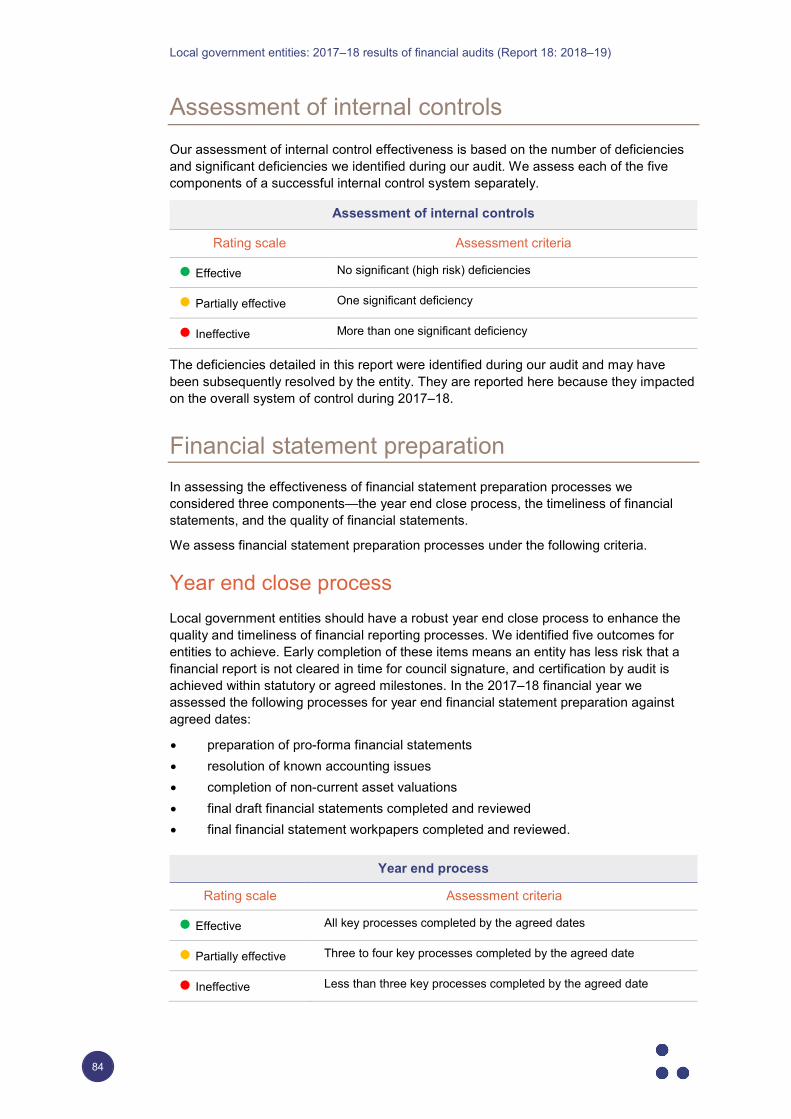
Local government entities: 2017–18 results of financial audits (Report 18: 2018–19)
84
Assessment of internal controls Our assessment of internal control effectiveness is based on the number of deficiencies and significant deficiencies we identified during our audit. We assess each of the five components of a successful internal control system separately.
The deficiencies detailed in this report were identified during our audit and may have been subsequently resolved by the entity. They are reported here because they impacted on the overall system of control during 2017–18.
Financial statement preparation In assessing the effectiveness of financial statement preparation processes we considered three components—the year end close process, the timeliness of financial statements, and the quality of financial statements.
We assess financial statement preparation processes under the following criteria.
Year end close process Local government entities should have a robust year end close process to enhance the quality and timeliness of financial reporting processes. We identified five outcomes for entities to achieve. Early completion of these items means an entity has less risk that a financial report is not cleared in time for council signature, and certification by audit is achieved within statutory or agreed milestones. In the 2017–18 financial year we assessed the following processes for year end financial statement preparation against agreed dates:
• preparation of pro-forma financial statements • resolution of known accounting issues • completion of non-current asset valuations • final draft financial statements completed and reviewed • final financial statement workpapers completed and reviewed.
Year end process
Rating scale Assessment criteria
Effective All key processes completed by the agreed dates
Partially effective Three to four key processes completed by the agreed date
Ineffective Less than three key processes completed by the agreed date
Assessment of internal controls
Rating scale Assessment criteria
Effective No significant (high risk) deficiencies
Partially effective One significant deficiency
Ineffective More than one significant deficiency
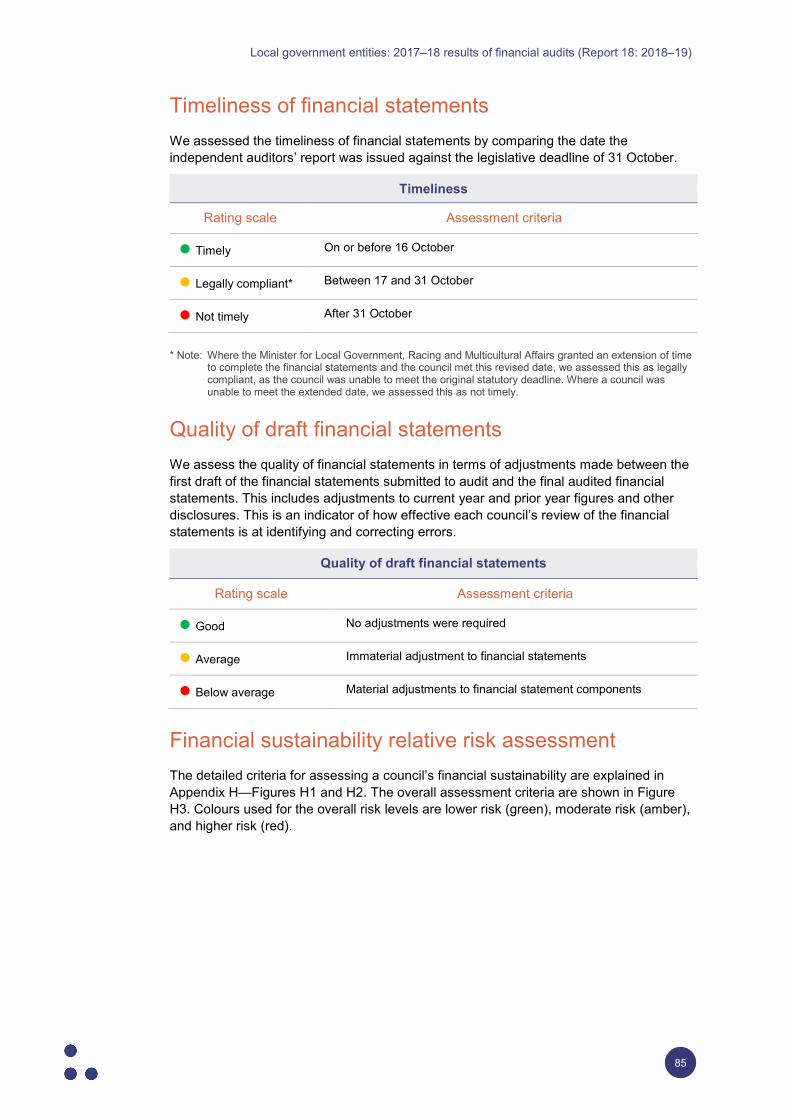
Local government entities: 2017–18 results of financial audits (Report 18: 2018–19)
85
Timeliness of financial statements We assessed the timeliness of financial statements by comparing the date the independent auditors’ report was issued against the legislative deadline of 31 October.
Timeliness
Rating scale Assessment criteria
Timely On or before 16 October
Legally compliant* Between 17 and 31 October
Not timely After 31 October
* Note: Where the Minister for Local Government, Racing and Multicultural Affairs granted an extension of time to complete the financial statements and the council met this revised date, we assessed this as legally compliant, as the council was unable to meet the original statutory deadline. Where a council was unable to meet the extended date, we assessed this as not timely.
Quality of draft financial statements We assess the quality of financial statements in terms of adjustments made between the first draft of the financial statements submitted to audit and the final audited financial statements. This includes adjustments to current year and prior year figures and other disclosures. This is an indicator of how effective each council’s review of the financial statements is at identifying and correcting errors.
Quality of draft financial statements
Rating scale Assessment criteria
Good No adjustments were required
Average Immaterial adjustment to financial statements
Below average Material adjustments to financial statement components
Financial sustainability relative risk assessment The detailed criteria for assessing a council’s financial sustainability are explained in Appendix H—Figures H1 and H2. The overall assessment criteria are shown in Figure H3. Colours used for the overall risk levels are lower risk (green), moderate risk (amber), and higher risk (red).
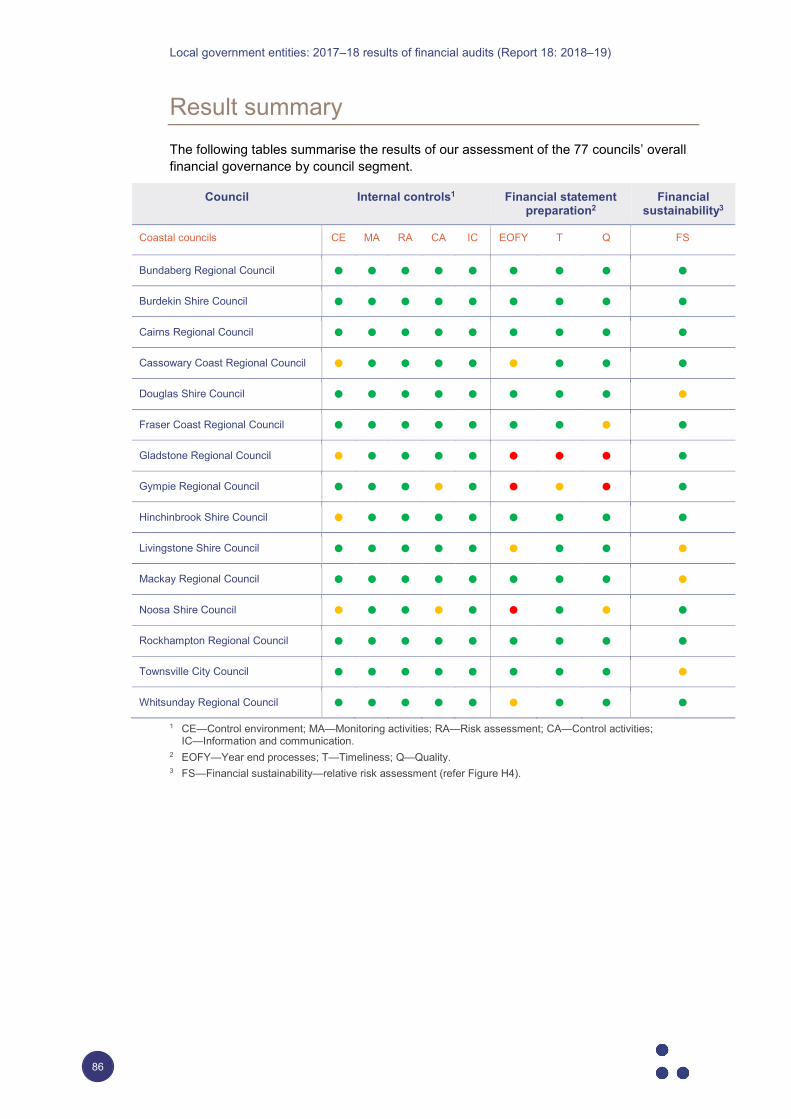
Local government entities: 2017–18 results of financial audits (Report 18: 2018–19)
86
Result summary The following tables summarise the results of our assessment of the 77 councils’ overall financial governance by council segment.
Council Internal controls1 Financial statement preparation2
Financial sustainability3
Coastal councils CE MA RA CA IC EOFY T Q FS
Bundaberg Regional Council ● ● ● ● ● ● ● ● ●
Burdekin Shire Council ● ● ● ● ● ● ● ● ●
Cairns Regional Council ● ● ● ● ● ● ● ● ●
Cassowary Coast Regional Council ● ● ● ● ● ● ● ● ●
Douglas Shire Council ● ● ● ● ● ● ● ● ●
Fraser Coast Regional Council ● ● ● ● ● ● ● ● ●
Gladstone Regional Council ● ● ● ● ● ● ● ● ●
Gympie Regional Council ● ● ● ● ● ● ● ● ●
Hinchinbrook Shire Council ● ● ● ● ● ● ● ● ●
Livingstone Shire Council ● ● ● ● ● ● ● ● ●
Mackay Regional Council ● ● ● ● ● ● ● ● ●
Noosa Shire Council ● ● ● ● ● ● ● ● ●
Rockhampton Regional Council ● ● ● ● ● ● ● ● ●
Townsville City Council ● ● ● ● ● ● ● ● ●
Whitsunday Regional Council ● ● ● ● ● ● ● ● ●
1 CE—Control environment; MA—Monitoring activities; RA—Risk assessment; CA—Control activities; IC—Information and communication.
2 EOFY—Year end processes; T—Timeliness; Q—Quality. 3 FS—Financial sustainability—relative risk assessment (refer Figure H4).
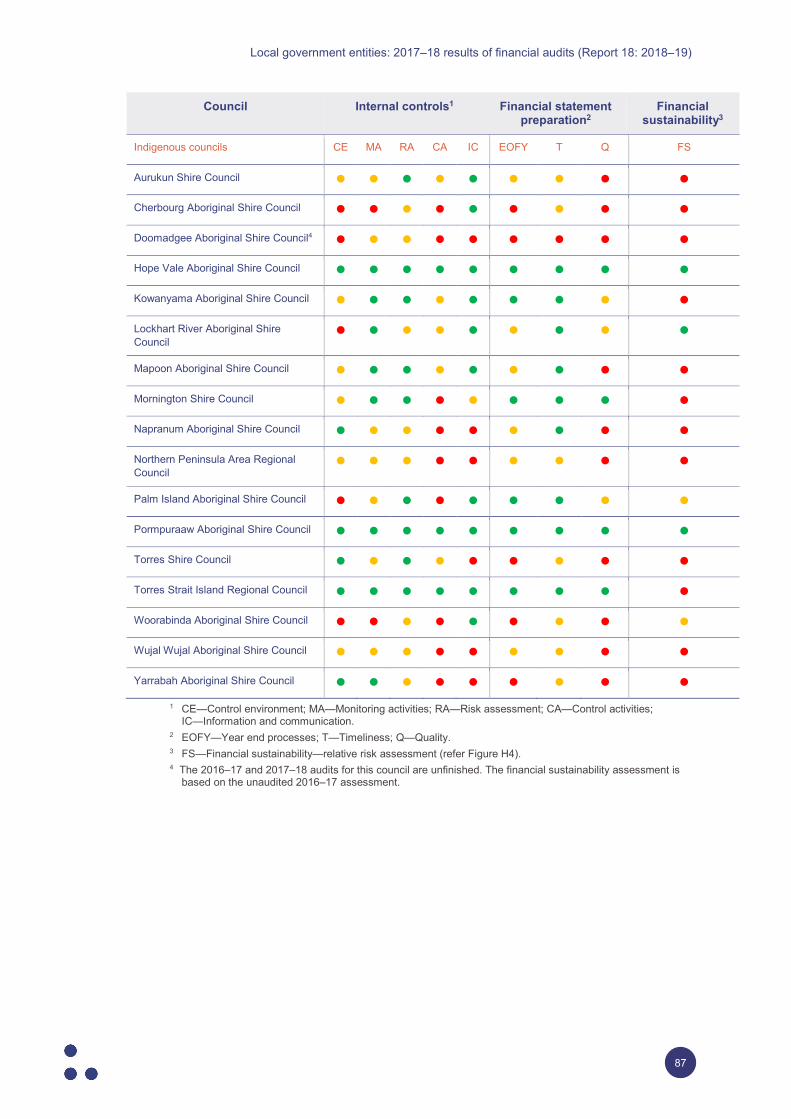
Local government entities: 2017–18 results of financial audits (Report 18: 2018–19)
87
1 CE—Control environment; MA—Monitoring activities; RA—Risk assessment; CA—Control activities; IC—Information and communication.
2 EOFY—Year end processes; T—Timeliness; Q—Quality. 3 FS—Financial sustainability—relative risk assessment (refer Figure H4). 4 The 2016–17 and 2017–18 audits for this council are unfinished. The financial sustainability assessment is
based on the unaudited 2016–17 assessment.
Council Internal controls1 Financial statement preparation2
Financial sustainability3
Indigenous councils CE MA RA CA IC EOFY T Q FS
Aurukun Shire Council ● ● ● ● ● ● ● ● ●
Cherbourg Aboriginal Shire Council ● ● ● ● ● ● ● ● ●
Doomadgee Aboriginal Shire Council4 ● ● ● ● ● ● ● ● ●
Hope Vale Aboriginal Shire Council ● ● ● ● ● ● ● ● ●
Kowanyama Aboriginal Shire Council ● ● ● ● ● ● ● ● ●
Lockhart River Aboriginal Shire Council
● ● ● ● ● ● ● ● ●
Mapoon Aboriginal Shire Council ● ● ● ● ● ● ● ● ●
Mornington Shire Council ● ● ● ● ● ● ● ● ●
Napranum Aboriginal Shire Council ● ● ● ● ● ● ● ● ●
Northern Peninsula Area Regional Council
● ● ● ● ● ● ● ● ●
Palm Island Aboriginal Shire Council ● ● ● ● ● ● ● ● ●
Pormpuraaw Aboriginal Shire Council ● ● ● ● ● ● ● ● ●
Torres Shire Council ● ● ● ● ● ● ● ● ●
Torres Strait Island Regional Council ● ● ● ● ● ● ● ● ●
Woorabinda Aboriginal Shire Council ● ● ● ● ● ● ● ● ●
Wujal Wujal Aboriginal Shire Council ● ● ● ● ● ● ● ● ●
Yarrabah Aboriginal Shire Council ● ● ● ● ● ● ● ● ●
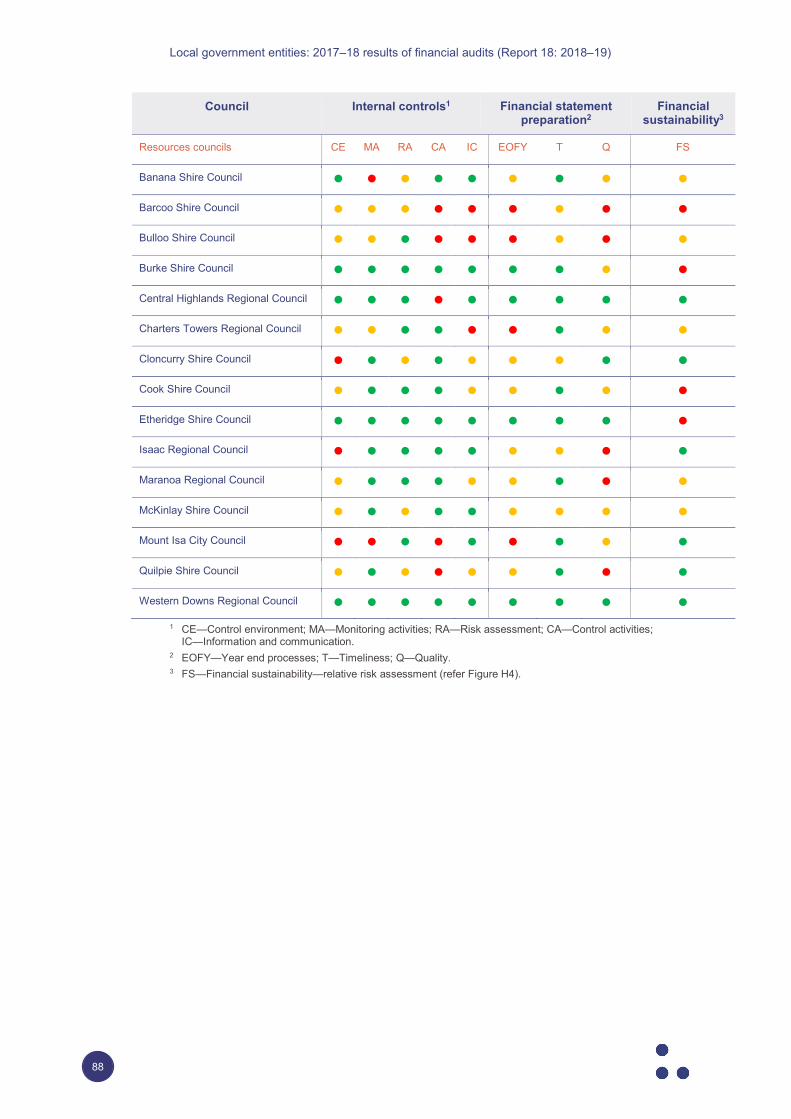
Local government entities: 2017–18 results of financial audits (Report 18: 2018–19)
88
Council Internal controls1 Financial statement preparation2
Financial sustainability3
Resources councils CE MA RA CA IC EOFY T Q FS
Banana Shire Council ● ● ● ● ● ● ● ● ●
Barcoo Shire Council ● ● ● ● ● ● ● ● ●
Bulloo Shire Council ● ● ● ● ● ● ● ● ●
Burke Shire Council ● ● ● ● ● ● ● ● ●
Central Highlands Regional Council ● ● ● ● ● ● ● ● ●
Charters Towers Regional Council ● ● ● ● ● ● ● ● ●
Cloncurry Shire Council ● ● ● ● ● ● ● ● ●
Cook Shire Council ● ● ● ● ● ● ● ● ●
Etheridge Shire Council ● ● ● ● ● ● ● ● ●
Isaac Regional Council ● ● ● ● ● ● ● ● ●
Maranoa Regional Council ● ● ● ● ● ● ● ● ●
McKinlay Shire Council ● ● ● ● ● ● ● ● ●
Mount Isa City Council ● ● ● ● ● ● ● ● ●
Quilpie Shire Council ● ● ● ● ● ● ● ● ●
Western Downs Regional Council ● ● ● ● ● ● ● ● ●
1 CE—Control environment; MA—Monitoring activities; RA—Risk assessment; CA—Control activities; IC—Information and communication.
2 EOFY—Year end processes; T—Timeliness; Q—Quality. 3 FS—Financial sustainability—relative risk assessment (refer Figure H4).
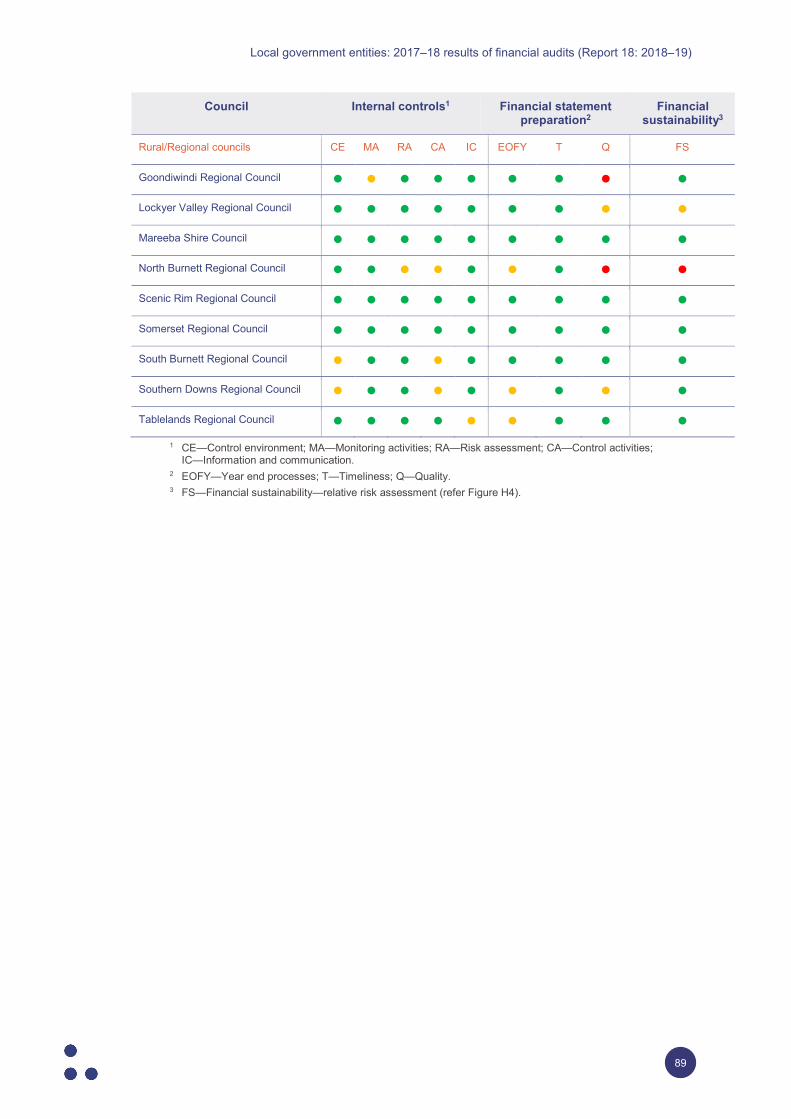
Local government entities: 2017–18 results of financial audits (Report 18: 2018–19)
89
1 CE—Control environment; MA—Monitoring activities; RA—Risk assessment; CA—Control activities; IC—Information and communication.
2 EOFY—Year end processes; T—Timeliness; Q—Quality. 3 FS—Financial sustainability—relative risk assessment (refer Figure H4).
Council Internal controls1 Financial statement preparation2
Financial sustainability3
Rural/Regional councils CE MA RA CA IC EOFY T Q FS
Goondiwindi Regional Council ● ● ● ● ● ● ● ● ●
Lockyer Valley Regional Council ● ● ● ● ● ● ● ● ●
Mareeba Shire Council ● ● ● ● ● ● ● ● ●
North Burnett Regional Council ● ● ● ● ● ● ● ● ●
Scenic Rim Regional Council ● ● ● ● ● ● ● ● ●
Somerset Regional Council ● ● ● ● ● ● ● ● ●
South Burnett Regional Council ● ● ● ● ● ● ● ● ●
Southern Downs Regional Council ● ● ● ● ● ● ● ● ●
Tablelands Regional Council ● ● ● ● ● ● ● ● ●
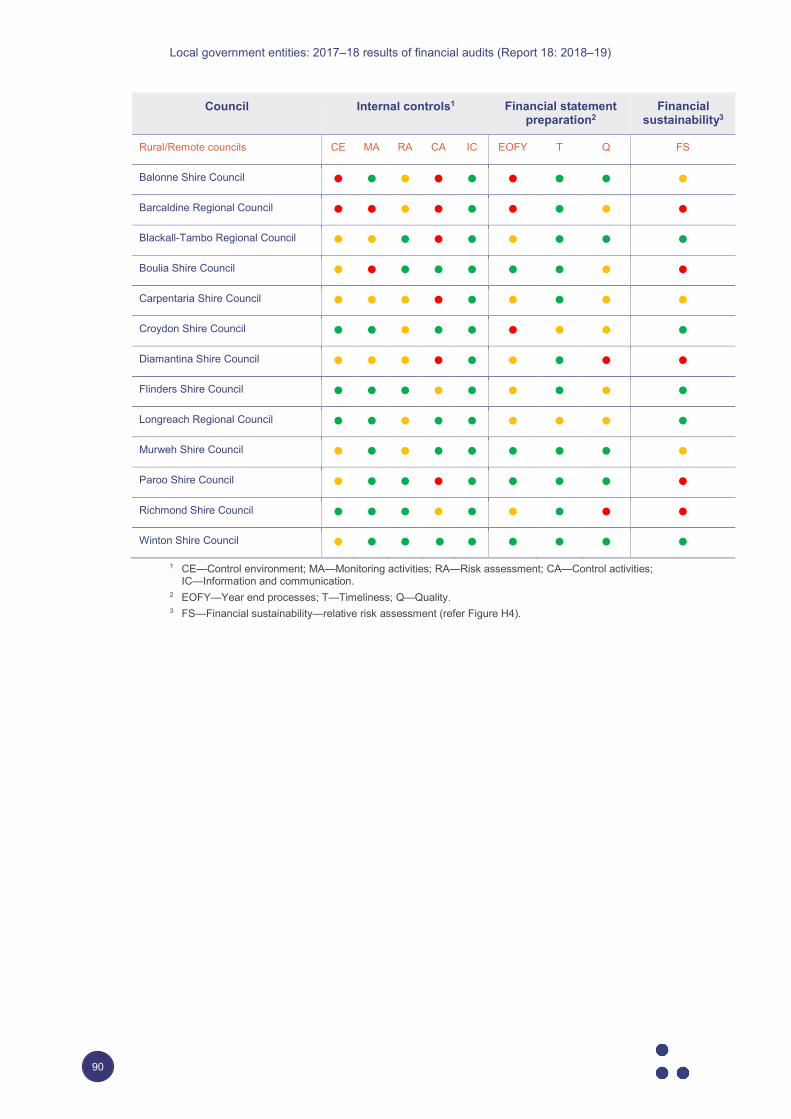
Local government entities: 2017–18 results of financial audits (Report 18: 2018–19)
90
Council Internal controls1 Financial statement preparation2
Financial sustainability3
Rural/Remote councils CE MA RA CA IC EOFY T Q FS
Balonne Shire Council ● ● ● ● ● ● ● ● ●
Barcaldine Regional Council ● ● ● ● ● ● ● ● ●
Blackall-Tambo Regional Council ● ● ● ● ● ● ● ● ●
Boulia Shire Council ● ● ● ● ● ● ● ● ●
Carpentaria Shire Council ● ● ● ● ● ● ● ● ●
Croydon Shire Council ● ● ● ● ● ● ● ● ●
Diamantina Shire Council ● ● ● ● ● ● ● ● ●
Flinders Shire Council ● ● ● ● ● ● ● ● ●
Longreach Regional Council ● ● ● ● ● ● ● ● ●
Murweh Shire Council ● ● ● ● ● ● ● ● ●
Paroo Shire Council ● ● ● ● ● ● ● ● ●
Richmond Shire Council ● ● ● ● ● ● ● ● ●
Winton Shire Council ● ● ● ● ● ● ● ● ●
1 CE—Control environment; MA—Monitoring activities; RA—Risk assessment; CA—Control activities; IC—Information and communication.
2 EOFY—Year end processes; T—Timeliness; Q—Quality. 3 FS—Financial sustainability—relative risk assessment (refer Figure H4).
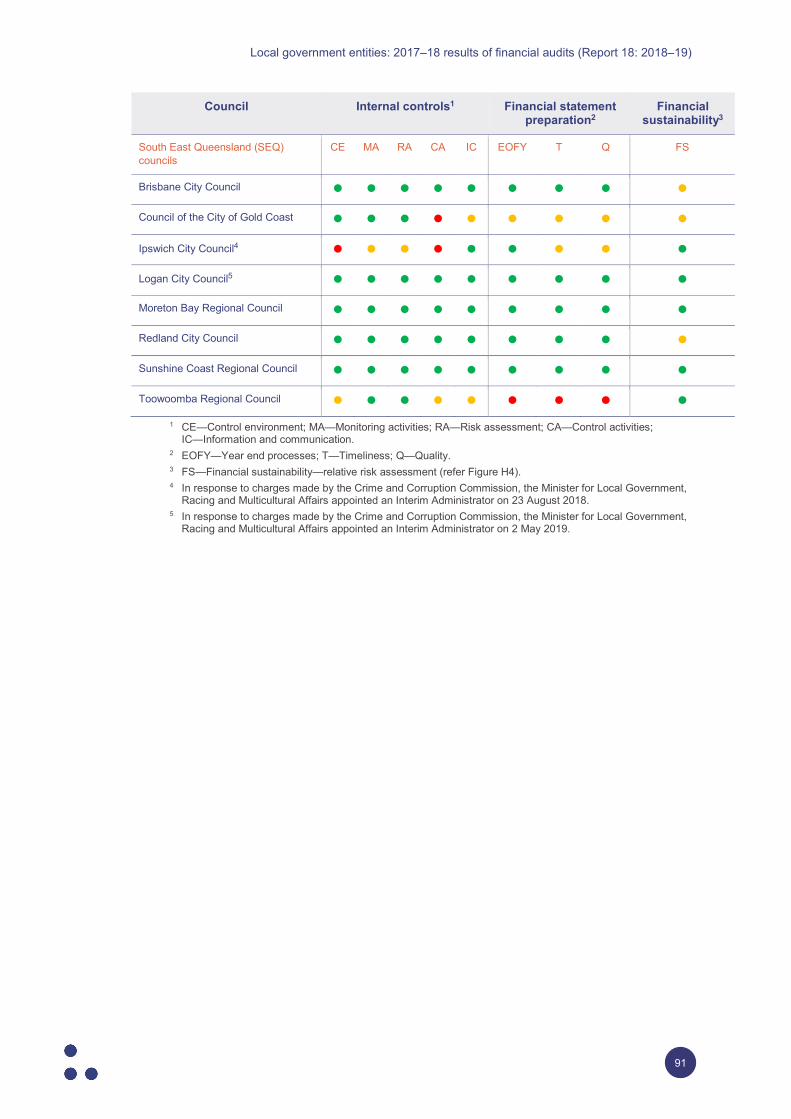
Local government entities: 2017–18 results of financial audits (Report 18: 2018–19)
91
1 CE—Control environment; MA—Monitoring activities; RA—Risk assessment; CA—Control activities; IC—Information and communication.
2 EOFY—Year end processes; T—Timeliness; Q—Quality. 3 FS—Financial sustainability—relative risk assessment (refer Figure H4). 4 In response to charges made by the Crime and Corruption Commission, the Minister for Local Government,
Racing and Multicultural Affairs appointed an Interim Administrator on 23 August 2018. 5 In response to charges made by the Crime and Corruption Commission, the Minister for Local Government,
Racing and Multicultural Affairs appointed an Interim Administrator on 2 May 2019.
Council Internal controls1 Financial statement preparation2
Financial sustainability3
South East Queensland (SEQ) councils
CE MA RA CA IC EOFY T Q FS
Brisbane City Council ● ● ● ● ● ● ● ● ●
Council of the City of Gold Coast ● ● ● ● ● ● ● ● ●
Ipswich City Council4 ● ● ● ● ● ● ● ● ●
Logan City Council5 ● ● ● ● ● ● ● ● ●
Moreton Bay Regional Council ● ● ● ● ● ● ● ● ●
Redland City Council ● ● ● ● ● ● ● ● ●
Sunshine Coast Regional Council ● ● ● ● ● ● ● ● ●
Toowoomba Regional Council ● ● ● ● ● ● ● ● ●
Local government entities: 2017–18 results of financial audits (Report 18: 2018–19)
92
J. Glossary
Term Definition
Accountability The responsibility of public sector entities to achieve their objectives of reliable financial reporting, effective and efficient operations, compliance with applicable laws, and reporting to interested parties.
Acquisition Establishing control of an asset, undertaking the risks and receiving the rights to future benefits as would be conferred with ownership, in exchange for the cost of procurement.
Adverse audit opinion There is pervasive evidence to indicate the financial report is materially misstated. Where an adverse opinion is issued, the whole report is modified (that is, it is not possible to issue an unmodified opinion on aspects of the report).
Asset valuation The process of determining the fair value of an asset.
Audit-by-arrangement An audit by the Auditor-General of an entity that is not a public sector entity, conducted at the request of a minister or a public sector entity and with the consent of the entity.
Audit committee A committee intended to assist a council or board in discharging their obligations. Duties and responsibilities can involve oversight of all or a combination of the following: • effectiveness and reliability of internal controls • quality and integrity of accounting and reporting practices • effectiveness of performance management • legal and regulatory compliance • auditor's qualifications and independence • performance of the internal audit function and of external
auditors.
Auditor-General Act 2009 An act of the State of Queensland that establishes the responsibilities of the Queensland Auditor-General, the operation of the Queensland Audit Office, the nature and scope of audits to be conducted, and the relationship of the Queensland Auditor-General with parliament.
Auditor’s opinion A written expression of the auditor’s overall conclusion on the financial report based on audit evidence obtained.
Australian accounting standards
The rules by which financial statements are prepared in Australia. These standards ensure consistency in measuring and reporting on similar transactions.
Australian Accounting Standards Board (AASB)
An Australian Government agency that develops and maintains accounting standards applicable to entities in the private and public sectors of the Australian economy.
Local government entities: 2017–18 results of financial audits (Report 18: 2018–19)
93
Term Definition
Beneficial enterprise An organisation that a local government establishes or participates in, that benefits whole or part of the local government area.
Capital expenses Expenses to acquire assets or improve the service potential of existing assets. They are reported in an entity’s balance sheet.
Controlled entity An entity owned by one or more public sector entities.
Depreciation The systematic allocation of a fixed asset’s capital value as an expense over its expected useful life, to take account of normal usage, obsolescence, or the passage of time.
Disclaimer of audit opinion A disclaimer is issued where the auditor was unable to obtain sufficient and appropriate audit evidence to form an unmodified audit opinion. Where a disclaimer of opinion is issued, the whole report is modified (that is, it is not possible to issue an unmodified opinion on aspects of the report).
Emphasis of matter A paragraph included with an audit opinion to highlight an issue of which the auditor believes the users of the financial statements need to be aware. The inclusion of an emphasis of matter paragraph does not modify the audit opinion.
Fair value The amount for which an asset could be exchanged, or a liability settled, between knowledgeable, willing parties in an arm’s length transaction.
Financial statement A report on an entity’s financial performance over a period of time, and financial position at a point in time, prepared in accordance with a financial reporting framework. This includes a profit and loss statement, balance sheet, cash flow statement, a statement of changes in equity, and accompanying notes disclosing how amounts have been recognised and measured.
Financial sustainability The ability to meet current and future expenses as they arise and capacity to absorb foreseeable changes and emerging risks.
Found assets These are physical assets that the council was unaware of, but over which they have control.
Fraud Any act or omission, including a misrepresentation, that knowingly or recklessly misleads, or attempts to mislead, a party to obtain a financial or other benefit or to avoid an obligation.
Going concern An entity that is a going concern is expected to be able to pay its debts as and when they fall due, and to continue to operate without any intention or necessity to liquidate or wind up its operations.
Governance The arrangements in place at an entity to plan, direct, and control its activities to achieve its strategic and operational goals.
Impairment When an asset’s carrying amount exceeds the amount that can be recovered through use or sale of the asset.
Local government entities: 2017–18 results of financial audits (Report 18: 2018–19)
94
Term Definition
Internal audit An appraisal activity established or provided as a service to an entity. Its functions include examining, evaluating, and monitoring the adequacy and effectiveness of internal control, and reporting deficiencies to management.
Legislative time frame The date that is prescribed by legislation or date granted by the Minister for Local Government, Racing and Multicultural Affairs for a council to finalise its financial statements or annual report.
Management Those with the executive responsibility for conducting an entity’s operations.
Material misstatement An error in or omission from an entity’s financial statements that has the potential to influence the decisions made by users of the financial statements.
Misstatement A difference between the amount, classification, presentation, or disclosure of a reported financial statement item and the amount, classification, presentation, or disclosure that is required for the item to be in accordance with the applicable financial reporting framework. Misstatements can arise from error or fraud.
Modified audit opinion A modified opinion is expressed when financial statements do not comply with the relevant legislative requirements and Australian accounting standards and are not accurate and reliable. There are three types of modified audit opinions—qualified, adverse, and disclaimer—and their use depends on circumstances and the severity of non-compliance.
Net assets Total assets less total liabilities.
Net result Calculated by subtracting an entity’s total expenses from its total revenue. The net result is designed to show what the entity has earned or lost in a given period of time.
Non-current assets An entity's long-term investments, where the full value will not be realised within the financial year. These assets are capitalised rather than expensed, meaning that the cost of the asset can be allocated over the number of years for which the asset will be in use, instead of allocating the entire cost to the financial year in which the asset was purchased.
Operating result Calculated by subtracting continuing operations expenses from continuing operations revenue to show what the entity has earned or lost in a given period of time.
Own-source revenue These are revenue sources which local governments have the power to collect on their own account. They can include revenue from property rates, sales of goods and services (such as user fees), interest income, and other income (such as developer contributions and fines). They exclude grants.
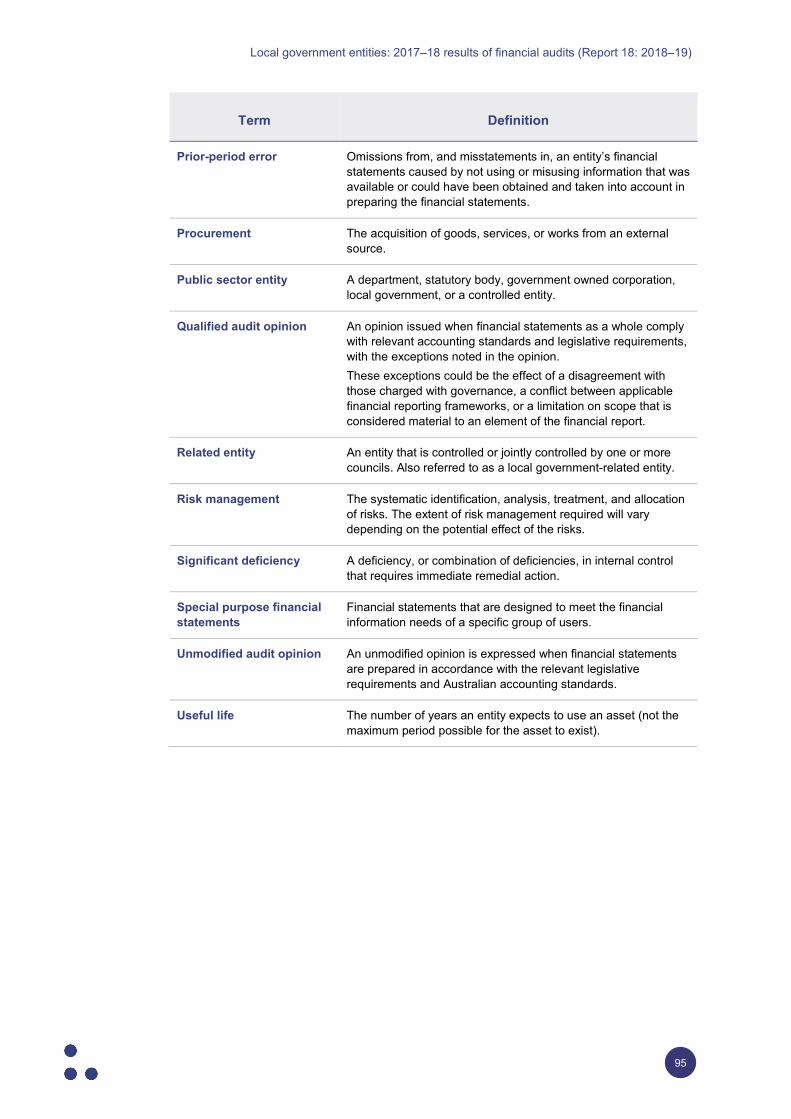
Local government entities: 2017–18 results of financial audits (Report 18: 2018–19)
95
Term Definition
Prior-period error Omissions from, and misstatements in, an entity’s financial statements caused by not using or misusing information that was available or could have been obtained and taken into account in preparing the financial statements.
Procurement The acquisition of goods, services, or works from an external source.
Public sector entity A department, statutory body, government owned corporation, local government, or a controlled entity.
Qualified audit opinion An opinion issued when financial statements as a whole comply with relevant accounting standards and legislative requirements, with the exceptions noted in the opinion. These exceptions could be the effect of a disagreement with those charged with governance, a conflict between applicable financial reporting frameworks, or a limitation on scope that is considered material to an element of the financial report.
Related entity An entity that is controlled or jointly controlled by one or more councils. Also referred to as a local government-related entity.
Risk management The systematic identification, analysis, treatment, and allocation of risks. The extent of risk management required will vary depending on the potential effect of the risks.
Significant deficiency A deficiency, or combination of deficiencies, in internal control that requires immediate remedial action.
Special purpose financial statements
Financial statements that are designed to meet the financial information needs of a specific group of users.
Unmodified audit opinion An unmodified opinion is expressed when financial statements are prepared in accordance with the relevant legislative requirements and Australian accounting standards.
Useful life The number of years an entity expects to use an asset (not the maximum period possible for the asset to exist).
Local government entities: 2017–18 results of financial audits (Report 18: 2018–19)
96
Auditor-General reports to parliament Reports tabled in 2018–19
1. Monitoring and managing ICT projects Tabled July 2018
2. Access to the National Disability Insurance Scheme for people with impaired decision-making capacity Tabled September 2018
3. Delivering shared corporate services in Queensland Tabled September 2018
4. Managing transfers in pharmacy ownership Tabled September 2018
5. Follow-up of Bushfire prevention and preparedness Tabled October 2018
6. Delivering coronial services Tabled October 2018
7. Conserving threatened species Tabled November 2018
8. Water: 2017–18 results of financial audits Tabled November 2018
9. Energy: 2017–18 results of financial audits Tabled November 2018
10. Digitising public hospitals Tabled December 2018
11. Transport: 2017–18 results of financial audits Tabled December 2018
12. Market-led proposals Tabled December 2018
13. Health: 2017–18 results of financial audits Tabled February 2019
14. Queensland state government: 2017–18 results of financial audits Tabled February 2019
15. Follow-up of Oversight of recurrent grants to non-state schools Tabled March 2019
16. Follow-up of Maintenance of public schools Tabled April 2019
17. Managing consumer food safety in Queensland Tabled May 2019
18. Local government: 2017–18 results of audit Tabled May 2019
Local government entities: 2017–18 results of financial audits (Report 18: 2018–19)
97
Report cost This report cost $280 000 to produce.
Copyright © The State of Queensland (Queensland Audit Office) 2019.
The Queensland Government supports and encourages the dissemination of its information. The copyright in this publication is licensed under a Creative Commons Attribution-Non-Commercial-No Derivatives (CC BY-NC-ND) 3.0 Australia licence.
To view this licence visit https://creativecommons.org/licenses/by-nc-nd/3.0/au/
Under this licence you are free, without having to seek permission from QAO, to use this publication in accordance with the licence terms. For permissions beyond the scope of this licence contact [email protected]
Content from this work should be attributed as: The State of Queensland (Queensland Audit Office) Report 18: 2018–19 Local government entities: 2017–18 results of financial audits, available under CC BY-NC-ND 3.0 Australia
Front cover image is stock photograph purchased by QAO.
ISSN 1834-1128.
qao.qld.gov.au/reports-resources/parliament
Suggest a performance audit topic
Contribute to a performance audit in progress
Subscribe to news
Connect with QAO on LinkedIn
T: (07) 3149 6000 M: [email protected] W: qao.qld.gov.au 53 Albert Street, Brisbane Qld 4000 PO Box 15396, City East Qld 4002