Embed Size (px)
Citation preview
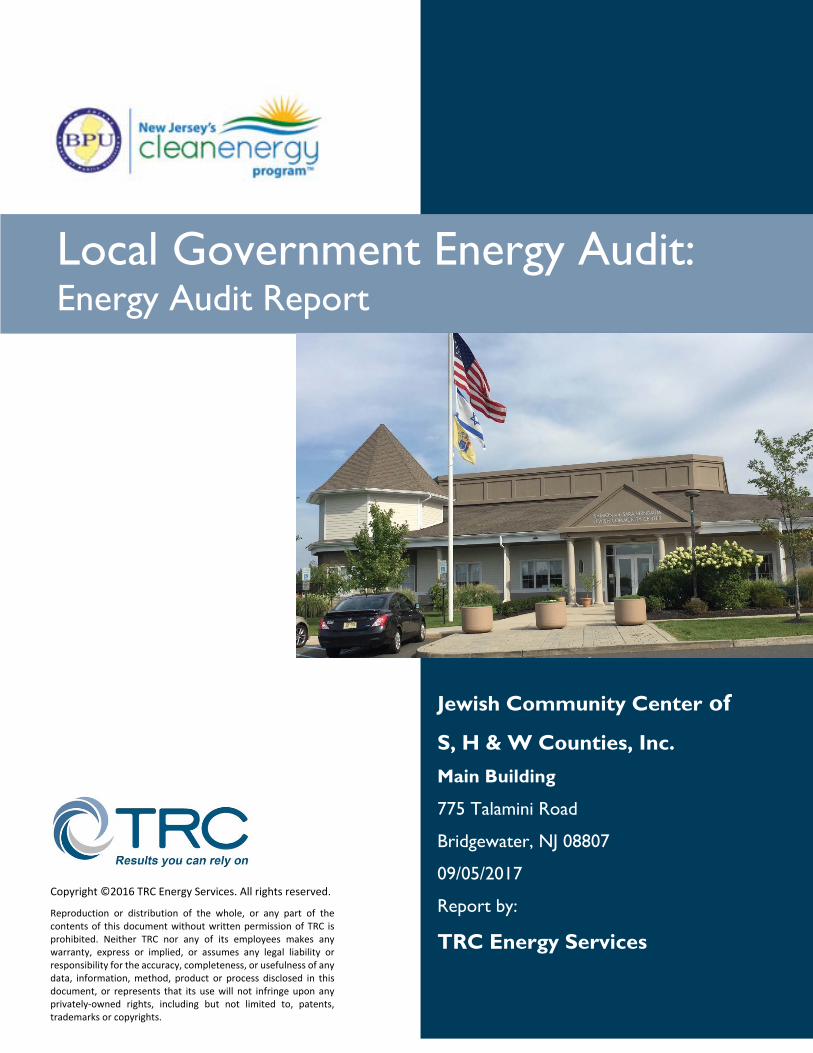
Local Government Energy Audit: Energy Audit Report
Copyright ©2016 TRC Energy Services. All rights reserved.
Reproduction or distribution of the whole, or any part of the contents of this document without written permission of TRC is prohibited. Neither TRC nor any of its employees makes any warranty, express or implied, or assumes any legal liability or responsibility for the accuracy, completeness, or usefulness of any data, information, method, product or process disclosed in this document, or represents that its use will not infringe upon any privately‐owned rights, including but not limited to, patents, trademarks or copyrights.
Jewish Community Center of
S, H & W Counties, Inc.
Main Building
775 Talamini Road
Bridgewater, NJ 08807
09/05/2017
Report by:
TRC Energy Services
9/5/2017
Disclaimer The intent of this energy analysis report is to identify energy savings opportunities associated with recommended upgrades to the facility’s systems at this site. Approximate savings are included in this report to make decisions about reducing energy use at the facility. This report is not intended to serve as a detailed engineering design document. Detailed design efforts are required in order to implement several of the improvements evaluated as part of this energy analysis.
The energy conservation measures and estimates of energy consumption contained in this report have been reviewed for technical accuracy. However, all estimates contained herein of energy consumption at the site are not guaranteed, because energy consumption ultimately depends on behavioral factors, the weather, and many other uncontrollable variables. The energy assessor and New Jersey Board of Public Utilities (NJBPU) shall in no event be liable should the actual energy consumption vary from the estimated consumption shown herein.
Estimated installation costs are based on a variety of sources, including our own experience at similar facilities, our own pricing research using local contractors and vendors, and cost estimating handbooks such as those provided by RS Means. The cost estimates represent our best judgment for the proposed action. The Owner is encouraged to independently confirm these cost estimates and to obtain multiple estimates when considering measure installations. Since actual installed costs can vary widely for a particular installation, and for conditions which cannot be known prior to in‐depth investigation and design, the energy assessor does not guarantee installed cost estimates and shall in no event be liable should actual installed costs vary from the estimated costs herein.
New Jersey’s Clean Energy Program (NJCEP) incentive values provided in this report are estimates and are based on program information available at the time this report is written. The NJBPU reserves the right to extend, modify, or terminate programs without prior or further notice, including incentive levels and eligibility requirements. The Owner should review available program incentives and requirements prior to selecting and/or installing any recommended measures.
LGEA: Energy Audit Report – Jewish Community Center Of Somerset, Main Building 3
Table of Contents
1 Executive Summary ....................................................................................................................... 6
1.1 Facility Summary ....................................................................................................................... 6 1.2 Your Cost Reduction Opportunities........................................................................................... 6
Energy Conservation Measures .......................................................................................................................... 6 Energy Efficient Practices ................................................................................................................................... 8 Self‐Generation Measures ................................................................................................................................. 9
1.3 Implementation Planning .......................................................................................................... 9
2 Facility Information and Existing Conditions ................................................................................ 11
2.1 Project Contacts ...................................................................................................................... 11 2.2 General Site Information ......................................................................................................... 11 2.3 Building Occupancy ................................................................................................................. 11 2.4 Building Envelope .................................................................................................................... 12 2.5 On‐site Generation .................................................................................................................. 12 2.6 Energy‐Using Systems ............................................................................................................. 12
Lighting ........................................................................................................................................................ 12 Air Conditioning (DX) ........................................................................................................................................ 13 Building Energy Management System ............................................................................................................. 13 Domestic Hot Water ......................................................................................................................................... 13 Food Service & Laundry Equipment ................................................................................................................. 13 Refrigeration .................................................................................................................................................... 13 Plug Load & Vending Machines ........................................................................................................................ 13
2.7 Water‐Using Systems .............................................................................................................. 14
3 Site Energy Use and Costs ............................................................................................................ 15
3.1 Total Cost of Energy ................................................................................................................ 15 3.2 Electricity Usage ...................................................................................................................... 16 3.3 Natural Gas Usage ................................................................................................................... 17 3.4 Benchmarking .......................................................................................................................... 18 3.5 Energy End‐Use Breakdown .................................................................................................... 19
4 Energy Conservation Measure ..................................................................................................... 20
4.1 Recommended ECMs .............................................................................................................. 20 4.1.1 Lighting Upgrades .................................................................................................................... 21
ECM 1: Install LED Fixtures ............................................................................................................................... 21 ECM 2: Retrofit Fixtures with LED Lamps ......................................................................................................... 22 ECM 3: Install LED Exit Signs ............................................................................................................................. 22
4.1.2 Lighting Control Measures ...................................................................................................... 23
ECM 4: Install Occupancy Sensor Lighting Controls ......................................................................................... 23
4.1.3 Electric Unitary HVAC Measures ............................................................................................. 24
ECM 5: Install High Efficiency Electric AC ......................................................................................................... 24
4.1.4 HVAC System Improvements .................................................................................................. 24
LGEA: Energy Audit Report – Jewish Community Center Of Somerset, Main Building 4
ECM 6: Install Dual Enthalpy outside Economizer Control ............................................................................... 25
4.1.5 Domestic Water Heating Upgrade .......................................................................................... 25
ECM 7: Install Low‐Flow DHW Devices ............................................................................................................. 25
4.1.6 Food Service Equipment & Refrigeration Measures. .............................................................. 26
ECM 8: Dishwasher Replacement .................................................................................................................... 26 ECM 9: Replace Refrigeration Equipment ........................................................................................................ 26
4.1.7 Plug Load Equipment Control ‐ Vending Machine .................................................................. 27
ECM 10: Vending Machine Control .................................................................................................................. 27
5 Energy Efficient Practices ............................................................................................................. 28
Reduce Air Leakage .......................................................................................................................................... 28 Close Doors and Windows ............................................................................................................................... 28 Perform Proper Lighting Maintenance ............................................................................................................. 28 Develop a Lighting Maintenance Schedule ...................................................................................................... 28 Ensure Lighting Controls Are Operating Properly ............................................................................................ 28 Perform Routine Motor Maintenance ............................................................................................................. 29 Use Fans to Reduce Cooling Load .................................................................................................................... 29 Practice Proper Use of Thermostat Schedules and Temperature Resets ........................................................ 29 Clean Evaporator/Condenser Coils on AC Systems .......................................................................................... 29 Clean and/or Replace HVAC Filters .................................................................................................................. 29 Check for and Seal Duct Leakage ..................................................................................................................... 29 Perform Proper Boiler Maintenance ................................................................................................................ 29 Perform Proper Furnace Maintenance ............................................................................................................ 30 Perform Proper Water Heater Maintenance ................................................................................................... 30 Plug Load Controls............................................................................................................................................ 30 Water Conservation ......................................................................................................................................... 30
6 Self‐Generation Measures ........................................................................................................... 31
6.1 Photovoltaic............................................................................................................................. 31 6.2 Combined Heat and Power ..................................................................................................... 32
7 Project Funding / Incentives ........................................................................................................ 34
7.1 SmartStart ............................................................................................................................... 35 7.2 Direct Install ............................................................................................................................ 36
8 Energy Purchasing and Procurement Strategies ........................................................................... 37
8.1 Retail Electric Supply Options.................................................................................................. 37 8.2 Retail Natural Gas Supply Options .......................................................................................... 37
Appendix A: Equipment Inventory & Recommendations
Appendix B: ENERGY STAR Statement of Energy Performance
Appendix C: Photo Gallery

LGEA: Energy Audit Report – Jewish Community Center Of Somerset, Main Building 5
Table of Figures
Figure 1 – Previous 12 Month Utility Costs ................................................................................................... 7
Figure 2 – Potential Post‐Implementation Costs .......................................................................................... 7
Figure 3 – Summary of Energy Reduction Opportunities ............................................................................. 7
Figure 4 – Photovoltaic Potential .................................................................................................................. 9
Figure 5 – Project Contacts ......................................................................................................................... 11
Figure 6 ‐ Building Schedule ........................................................................................................................ 11
Figure 7 ‐ Utility Summary .......................................................................................................................... 15
Figure 8 ‐ Energy Cost Breakdown .............................................................................................................. 15
Figure 9 ‐ Electric Usage & Demand ............................................................................................................ 16
Figure 10 ‐ Electric Usage & Demand.......................................................................................................... 16
Figure 11 ‐ Natural Gas Usage ..................................................................................................................... 17
Figure 12 ‐ Natural Gas Usage ..................................................................................................................... 17
Figure 13 ‐ Energy Use Intensity Comparison – Existing Conditions........................................................... 18
Figure 14 ‐ Energy Use Intensity Comparison – Following Installation of Recommended Measures ........ 18
Figure 15 ‐ Energy Balance (% and kBtu/SF) ............................................................................................... 19
Figure 16 – Summary of Recommended ECMs ........................................................................................... 20
Figure 17 – Summary of Lighting Upgrade ECMs ........................................................................................ 21
Figure 18 – Summary of Lighting Control ECMs ......................................................................................... 23
Figure 19 ‐ Summary of Unitary HVAC ECMs .............................................................................................. 24
Figure 20 ‐ Summary of HVAC System Improvement ECMs ....................................................................... 24
Figure 21 ‐ Summary of Domestic Water Heating ECMs ............................................................................ 25
Figure 22 ‐ Photovoltaic Screening ............................................................................................................. 31
Figure 23 ‐ Combined Heat and Power Screening ...................................................................................... 32
Figure 24 ‐ ECM Incentive Program Eligibility ............................................................................................. 34
LGEA: Energy Audit Report – Jewish Community Center Of Somerset, Main Building 6
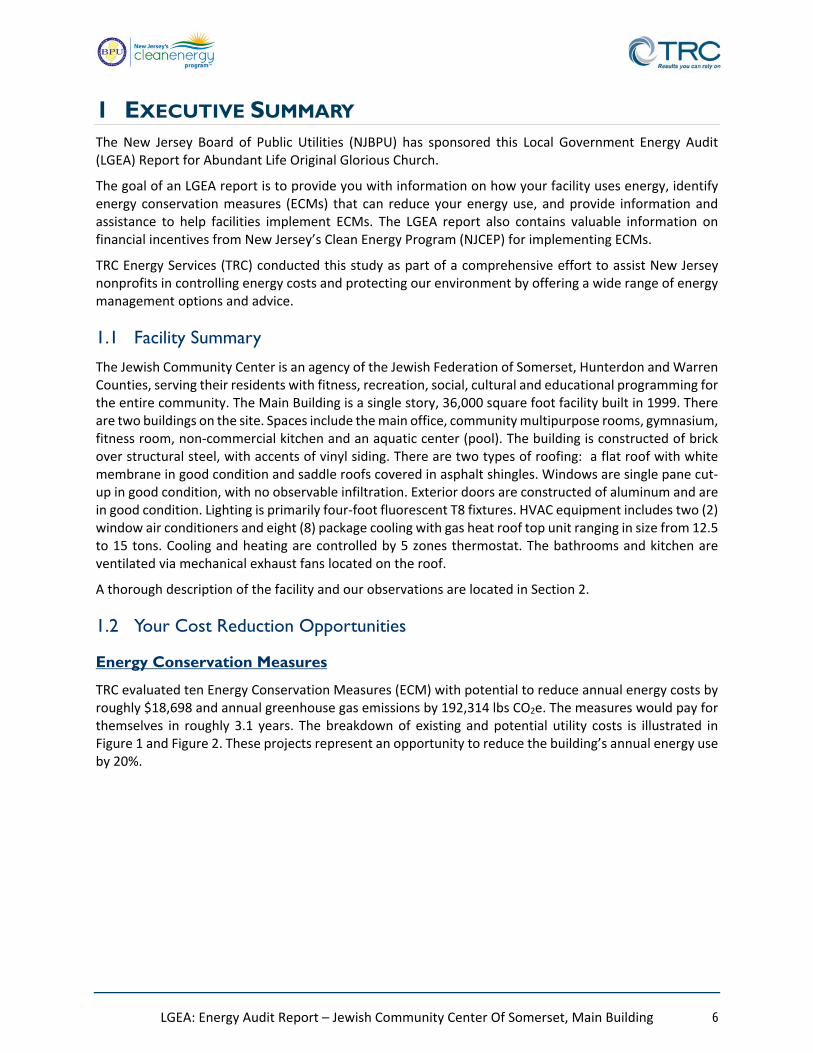
1 EXECUTIVE SUMMARY The New Jersey Board of Public Utilities (NJBPU) has sponsored this Local Government Energy Audit (LGEA) Report for Abundant Life Original Glorious Church.
The goal of an LGEA report is to provide you with information on how your facility uses energy, identify energy conservation measures (ECMs) that can reduce your energy use, and provide information and assistance to help facilities implement ECMs. The LGEA report also contains valuable information on financial incentives from New Jersey’s Clean Energy Program (NJCEP) for implementing ECMs.
TRC Energy Services (TRC) conducted this study as part of a comprehensive effort to assist New Jersey nonprofits in controlling energy costs and protecting our environment by offering a wide range of energy management options and advice.
1.1 Facility Summary
The Jewish Community Center is an agency of the Jewish Federation of Somerset, Hunterdon and Warren Counties, serving their residents with fitness, recreation, social, cultural and educational programming for the entire community. The Main Building is a single story, 36,000 square foot facility built in 1999. There are two buildings on the site. Spaces include the main office, community multipurpose rooms, gymnasium, fitness room, non‐commercial kitchen and an aquatic center (pool). The building is constructed of brick over structural steel, with accents of vinyl siding. There are two types of roofing: a flat roof with white membrane in good condition and saddle roofs covered in asphalt shingles. Windows are single pane cut‐up in good condition, with no observable infiltration. Exterior doors are constructed of aluminum and are in good condition. Lighting is primarily four‐foot fluorescent T8 fixtures. HVAC equipment includes two (2) window air conditioners and eight (8) package cooling with gas heat roof top unit ranging in size from 12.5 to 15 tons. Cooling and heating are controlled by 5 zones thermostat. The bathrooms and kitchen are ventilated via mechanical exhaust fans located on the roof.
A thorough description of the facility and our observations are located in Section 2.
1.2 Your Cost Reduction Opportunities
Energy Conservation Measures
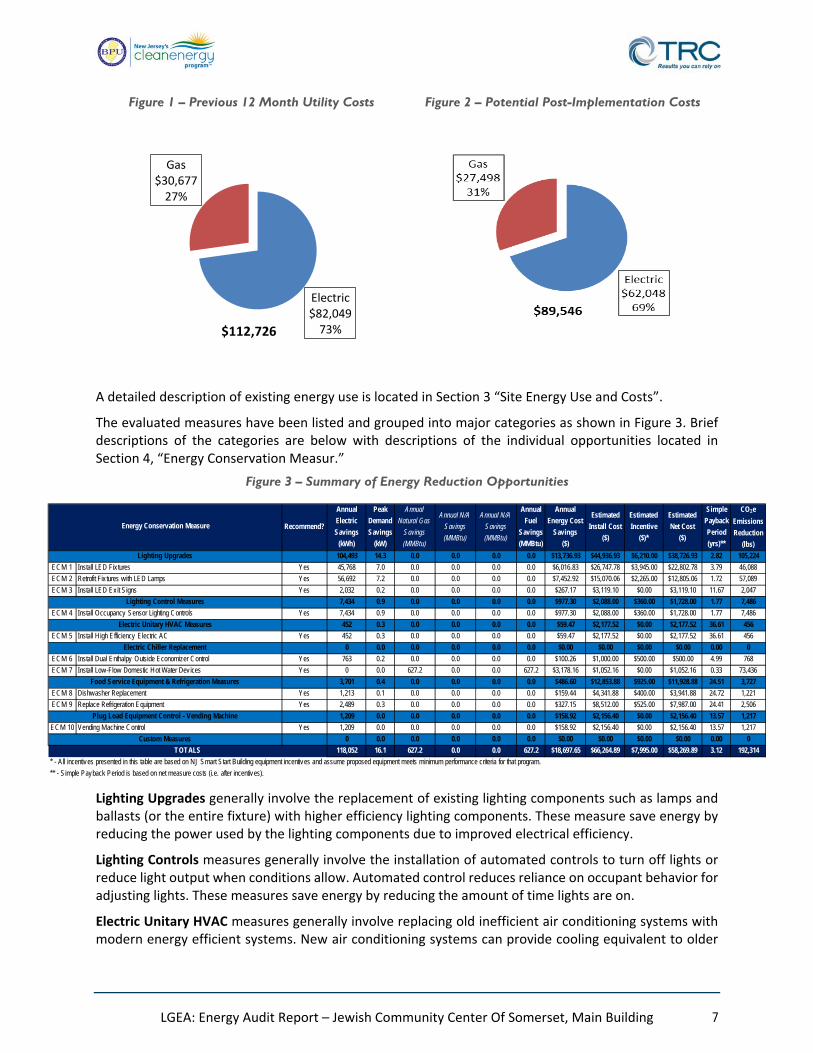
TRC evaluated ten Energy Conservation Measures (ECM) with potential to reduce annual energy costs by roughly $18,698 and annual greenhouse gas emissions by 192,314 lbs CO2e. The measures would pay for themselves in roughly 3.1 years. The breakdown of existing and potential utility costs is illustrated in Figure 1 and Figure 2. These projects represent an opportunity to reduce the building’s annual energy use by 20%.
LGEA: Energy Audit Report – Jewish Community Center Of Somerset, Main Building 7
Figure 1 – Previous 12 Month Utility Costs
Figure 2 – Potential Post-Implementation Costs
A detailed description of existing energy use is located in Section 3 “Site Energy Use and Costs”.
The evaluated measures have been listed and grouped into major categories as shown in Figure 3. Brief descriptions of the categories are below with descriptions of the individual opportunities located in Section 4, “Energy Conservation Measur.”
Figure 3 – Summary of Energy Reduction Opportunities
Lighting Upgrades generally involve the replacement of existing lighting components such as lamps and ballasts (or the entire fixture) with higher efficiency lighting components. These measure save energy by reducing the power used by the lighting components due to improved electrical efficiency.
Lighting Controls measures generally involve the installation of automated controls to turn off lights or reduce light output when conditions allow. Automated control reduces reliance on occupant behavior for adjusting lights. These measures save energy by reducing the amount of time lights are on.
Electric Unitary HVAC measures generally involve replacing old inefficient air conditioning systems with modern energy efficient systems. New air conditioning systems can provide cooling equivalent to older
Electric$82,04973%
Gas$30,67727%
$112,726
Recommend?
Annual
Electric
Savings
(kWh)
Peak
Demand
Savings
(kW)
Annual
Natural Gas
Savings
(MMBtu)
Annual N/A
Savings
(MMBtu)
Annual N/A
Savings
(MMBtu)
Annual
Fuel
Savings
(MMBtu)
Annual
Energy Cost
Savings
($)
Estimated
Install Cost
($)
Estimated
Incentive
($)*
Estimated
Net Cost
($)
Simple
Payback
Period
(yrs)**
CO2e
Emissions
Reduction
(lbs)
104,493 14.3 0.0 0.0 0.0 0.0 $13,736.93 $44,936.93 $6,210.00 $38,726.93 2.82 105,224
ECM 1 Install LED Fix tures Yes 45,768 7.0 0.0 0.0 0.0 0.0 $6,016.83 $26,747.78 $3,945.00 $22,802.78 3.79 46,088
ECM 2 Retrofit Fix tures with LED Lamps Yes 56,692 7.2 0.0 0.0 0.0 0.0 $7,452.92 $15,070.06 $2,265.00 $12,805.06 1.72 57,089
ECM 3 Install LED Exit Signs Yes 2,032 0.2 0.0 0.0 0.0 0.0 $267.17 $3,119.10 $0.00 $3,119.10 11.67 2,047
7,434 0.9 0.0 0.0 0.0 0.0 $977.30 $2,088.00 $360.00 $1,728.00 1.77 7,486
ECM 4 Install Occupancy Sensor Lighting Controls Yes 7,434 0.9 0.0 0.0 0.0 0.0 $977.30 $2,088.00 $360.00 $1,728.00 1.77 7,486
452 0.3 0.0 0.0 0.0 0.0 $59.47 $2,177.52 $0.00 $2,177.52 36.61 456
ECM 5 Install High Efficiency Electric AC Yes 452 0.3 0.0 0.0 0.0 0.0 $59.47 $2,177.52 $0.00 $2,177.52 36.61 456
0 0.0 0.0 0.0 0.0 0.0 $0.00 $0.00 $0.00 $0.00 0.00 0
ECM 6 Install Dual Enthalpy Outside Economizer Control Yes 763 0.2 0.0 0.0 0.0 0.0 $100.26 $1,000.00 $500.00 $500.00 4.99 768
ECM 7 Install Low-Flow Domestic Hot Water Dev ices Yes 0 0.0 627.2 0.0 0.0 627.2 $3,178.16 $1,052.16 $0.00 $1,052.16 0.33 73,436
3,701 0.4 0.0 0.0 0.0 0.0 $486.60 $12,853.88 $925.00 $11,928.88 24.51 3,727
ECM 8 Dishwasher Replacement Yes 1,213 0.1 0.0 0.0 0.0 0.0 $159.44 $4,341.88 $400.00 $3,941.88 24.72 1,221
ECM 9 Replace Refrigeration Equipment Yes 2,489 0.3 0.0 0.0 0.0 0.0 $327.15 $8,512.00 $525.00 $7,987.00 24.41 2,506
1,209 0.0 0.0 0.0 0.0 0.0 $158.92 $2,156.40 $0.00 $2,156.40 13.57 1,217
ECM 10 Vending Machine Control Yes 1,209 0.0 0.0 0.0 0.0 0.0 $158.92 $2,156.40 $0.00 $2,156.40 13.57 1,217
0 0.0 0.0 0.0 0.0 0.0 $0.00 $0.00 $0.00 $0.00 0.00 0
118,052 16.1 627.2 0.0 0.0 627.2 $18,697.65 $66,264.89 $7,995.00 $58,269.89 3.12 192,314
* - All incentives presented in this table are based on NJ Smart Start Building equipment incentives and assume proposed equipment meets minimum performance criteria for that program.
** - Simple Payback Period is based on net measure costs (i.e. after incentives).
Energy Conservation Measure
Food Service Equipment & Refrigeration Measures
Plug Load Equipment Control - Vending Machine
Lighting Upgrades
Lighting Control Measures
Electric Unitary HVAC Measures
Electric Chiller Replacement
Custom Measures
TOTALS
LGEA: Energy Audit Report – Jewish Community Center Of Somerset, Main Building 8
air condition systems, but use less energy. These measures save energy by reducing the power used by the air condition system due to improved electrical efficiency.
HVAC System Improvements generally involve the installation of automated controls to reduce heating and cooling demand when conditions allow. These measures could encompass changing temperature set points, using outside air for free cooling, or limiting excessive outside air during extreme outdoor air temperatures. These measures save energy by reducing the demand on the systems and the amount of time systems operate.
Domestic Water Heating upgrade measures generally involve replacing old inefficient domestic water heating systems with modern energy efficient systems. New domestic water heating systems can provide equivalent or greater capacity as older systems, but use less energy. These measures save energy by reducing the fuel used by the domestic water heating systems due to improved efficiency or the removal of standby losses.
Plug Load Equipment control measures generally involve installing automation that limits the power use or operation of equipment plugged into an electrical receptacle based on occupancy.
Energy Efficient Practices
Energy performance can also be improved by employing certain behavioral and operational adjustments as well as performing routine maintenance on building systems. Through these practices equipment lifetime can be extended; occupant comfort, health and safety can be improved; and annual energy, operation, and maintenance costs can be reduced. TRC identified 16 opportunities including:
Reduce Air Leakage
Close Doors and Windows
Perform Proper Lighting Maintenance
Develop a Lighting Maintenance Schedule
Ensure Lighting Controls Are Operating Properly
Perform Routine Motor Maintenance
Use Fans to Reduce Cooling Load
Practice Proper Use of Thermostat Schedules and Temperature Resets
Clean Evaporator/Condenser Coils on AC Systems
Clean and/or Replace HVAC Filters
Check for and Seal Duct Leakage
Perform Proper Boiler Maintenance
Perform Proper Furnace Maintenance
Perform Proper Water Heater Maintenance
Install Plug Load Controls
Water Conservation
For details on these Energy Efficient Practices, please refer to Section 5.
LGEA: Energy Audit Report – Jewish Community Center Of Somerset, Main Building 9
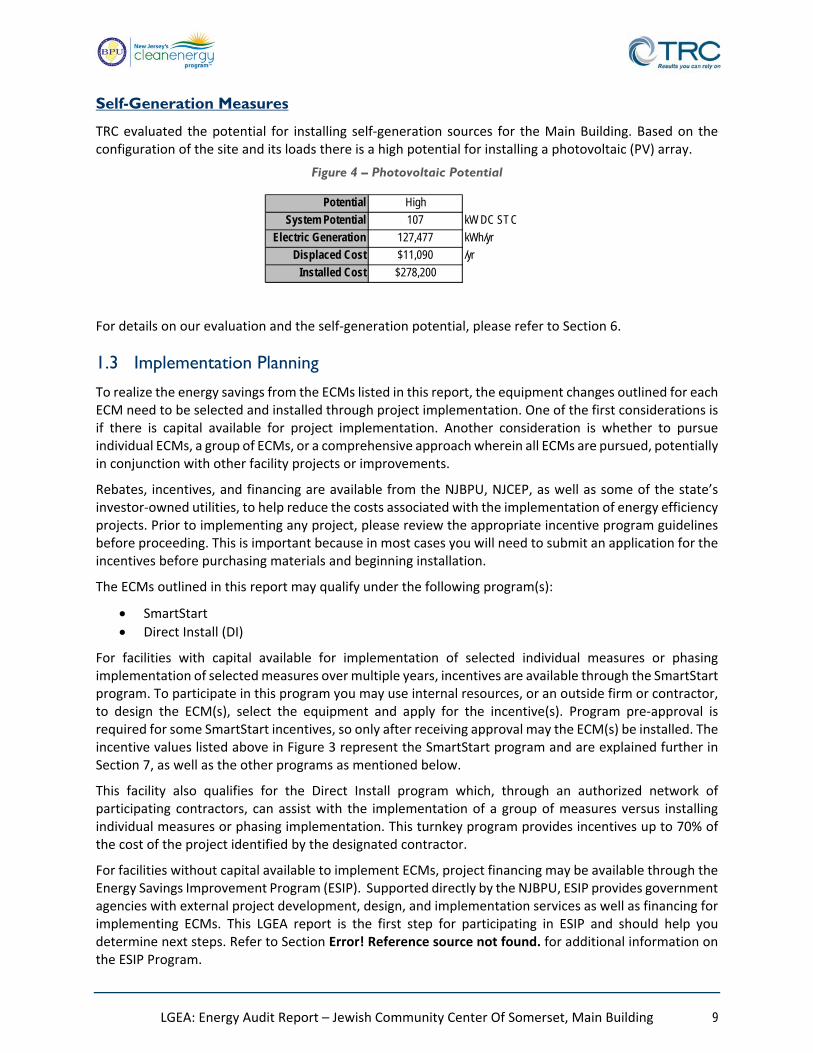
Self-Generation Measures
TRC evaluated the potential for installing self‐generation sources for the Main Building. Based on the configuration of the site and its loads there is a high potential for installing a photovoltaic (PV) array.
Figure 4 – Photovoltaic Potential
For details on our evaluation and the self‐generation potential, please refer to Section 6.
1.3 Implementation Planning
To realize the energy savings from the ECMs listed in this report, the equipment changes outlined for each ECM need to be selected and installed through project implementation. One of the first considerations is if there is capital available for project implementation. Another consideration is whether to pursue individual ECMs, a group of ECMs, or a comprehensive approach wherein all ECMs are pursued, potentially in conjunction with other facility projects or improvements.
Rebates, incentives, and financing are available from the NJBPU, NJCEP, as well as some of the state’s investor‐owned utilities, to help reduce the costs associated with the implementation of energy efficiency projects. Prior to implementing any project, please review the appropriate incentive program guidelines before proceeding. This is important because in most cases you will need to submit an application for the incentives before purchasing materials and beginning installation.
The ECMs outlined in this report may qualify under the following program(s):
SmartStart
Direct Install (DI)
For facilities with capital available for implementation of selected individual measures or phasing implementation of selected measures over multiple years, incentives are available through the SmartStart program. To participate in this program you may use internal resources, or an outside firm or contractor, to design the ECM(s), select the equipment and apply for the incentive(s). Program pre‐approval is required for some SmartStart incentives, so only after receiving approval may the ECM(s) be installed. The incentive values listed above in Figure 3 represent the SmartStart program and are explained further in Section 7, as well as the other programs as mentioned below.
This facility also qualifies for the Direct Install program which, through an authorized network of participating contractors, can assist with the implementation of a group of measures versus installing individual measures or phasing implementation. This turnkey program provides incentives up to 70% of the cost of the project identified by the designated contractor.
For facilities without capital available to implement ECMs, project financing may be available through the Energy Savings Improvement Program (ESIP). Supported directly by the NJBPU, ESIP provides government agencies with external project development, design, and implementation services as well as financing for implementing ECMs. This LGEA report is the first step for participating in ESIP and should help you determine next steps. Refer to Section Error! Reference source not found. for additional information on the ESIP Program.
Potential High
System Potential 107 kW DC STC
Electric Generation 127,477 kWh/yr
Displaced Cost $11,090 /yr
Installed Cost $278,200

LGEA: Energy Audit Report – Jewish Community Center Of Somerset, Main Building 10
The Demand Response Energy Aggregator is a program (non‐NJCEP) designed to reduce consumer electric load when wholesale electricity prices are high or when the reliability of the electric grid is threatened due to peak demand. Demand Response (DR) service providers (a.k.a. Curtailment Service Providers) are registered with PJM, the independent system operator (ISO) for mid‐Atlantic state region that is charged with maintaining electric grid reliability locally. By enabling grid operators to call upon Curtailment Service Providers and energy consumers to reduce electric usage during times of peak demand, the grid is made more reliable and overall transmission costs are reduced for all ratepayers. Curtailment Service Providers provide regular payments to medium and large consumers of electric power for their participation in DR programs. Program participation is voluntary and participants will receive payments whether or not their facility is called upon to curtail their load. Refer to Section Error! Reference source not found. for additional information on this program.
Additional descriptions of all relevant incentive programs are located in Section 7. You may also check the following website for further information on available rebates and incentives: www.njcleanenergy.com/ci.
To ensure projects are implemented such that maximum savings and incentives are achieved, bids and specifications should be reviewed by your procurement personnel and/or consultant(s) to ensure that selected equipment coincides with LGEA recommendations, as well as applicable incentive program guidelines and requirements.
LGEA: Energy Audit Report – Jewish Community Center Of Somerset, Main Building 11
2 FACILITY INFORMATION AND EXISTING CONDITIONS
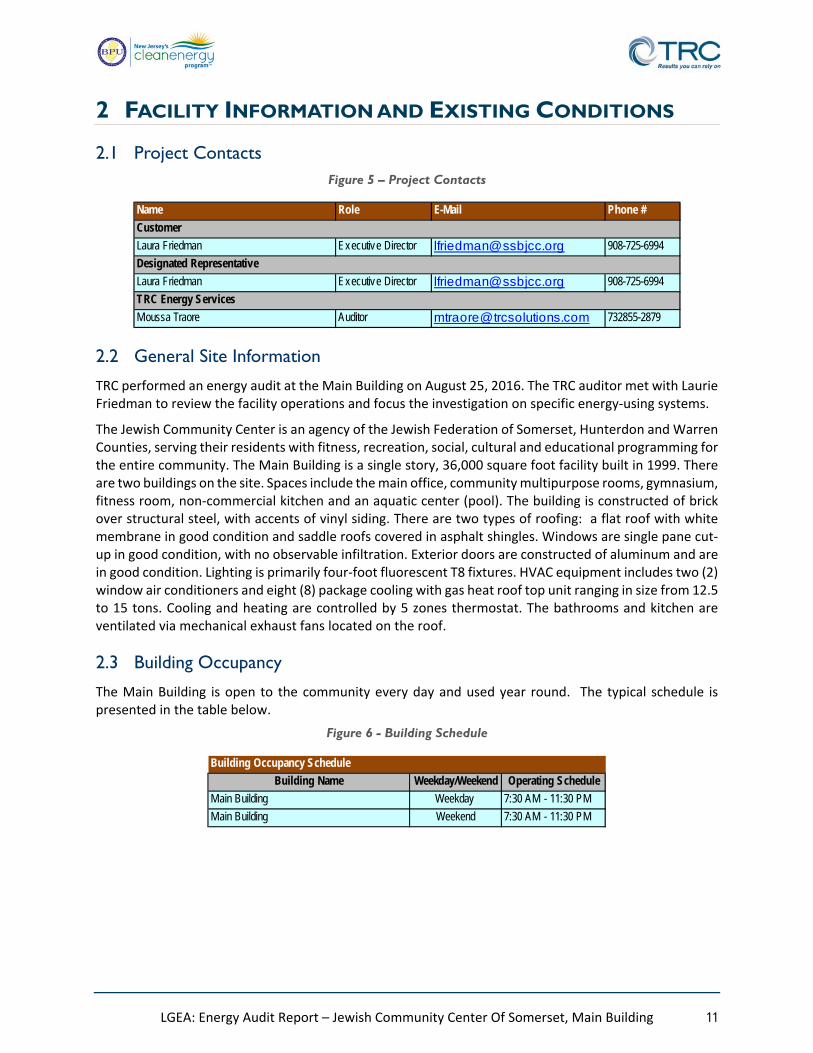
2.1 Project Contacts Figure 5 – Project Contacts
2.2 General Site Information
TRC performed an energy audit at the Main Building on August 25, 2016. The TRC auditor met with Laurie Friedman to review the facility operations and focus the investigation on specific energy‐using systems.
The Jewish Community Center is an agency of the Jewish Federation of Somerset, Hunterdon and Warren Counties, serving their residents with fitness, recreation, social, cultural and educational programming for the entire community. The Main Building is a single story, 36,000 square foot facility built in 1999. There are two buildings on the site. Spaces include the main office, community multipurpose rooms, gymnasium, fitness room, non‐commercial kitchen and an aquatic center (pool). The building is constructed of brick over structural steel, with accents of vinyl siding. There are two types of roofing: a flat roof with white membrane in good condition and saddle roofs covered in asphalt shingles. Windows are single pane cut‐up in good condition, with no observable infiltration. Exterior doors are constructed of aluminum and are in good condition. Lighting is primarily four‐foot fluorescent T8 fixtures. HVAC equipment includes two (2) window air conditioners and eight (8) package cooling with gas heat roof top unit ranging in size from 12.5 to 15 tons. Cooling and heating are controlled by 5 zones thermostat. The bathrooms and kitchen are ventilated via mechanical exhaust fans located on the roof.
2.3 Building Occupancy
The Main Building is open to the community every day and used year round. The typical schedule is presented in the table below.
Figure 6 - Building Schedule
Name Role E-Mail Phone #
Laura Friedman Executive Director [email protected] 908-725-6994
Laura Friedman Executive Director [email protected] 908-725-6994
Moussa Traore Auditor [email protected] 732855-2879
Customer
Designated Representative
TRC Energy Services
Building Name Weekday/Weekend Operating Schedule
Main Building Weekday 7:30 AM - 11:30 PM
Main Building Weekend 7:30 AM - 11:30 PM
Building Occupancy Schedule
LGEA: Energy Audit Report – Jewish Community Center Of Somerset, Main Building 12
2.4 Building Envelope
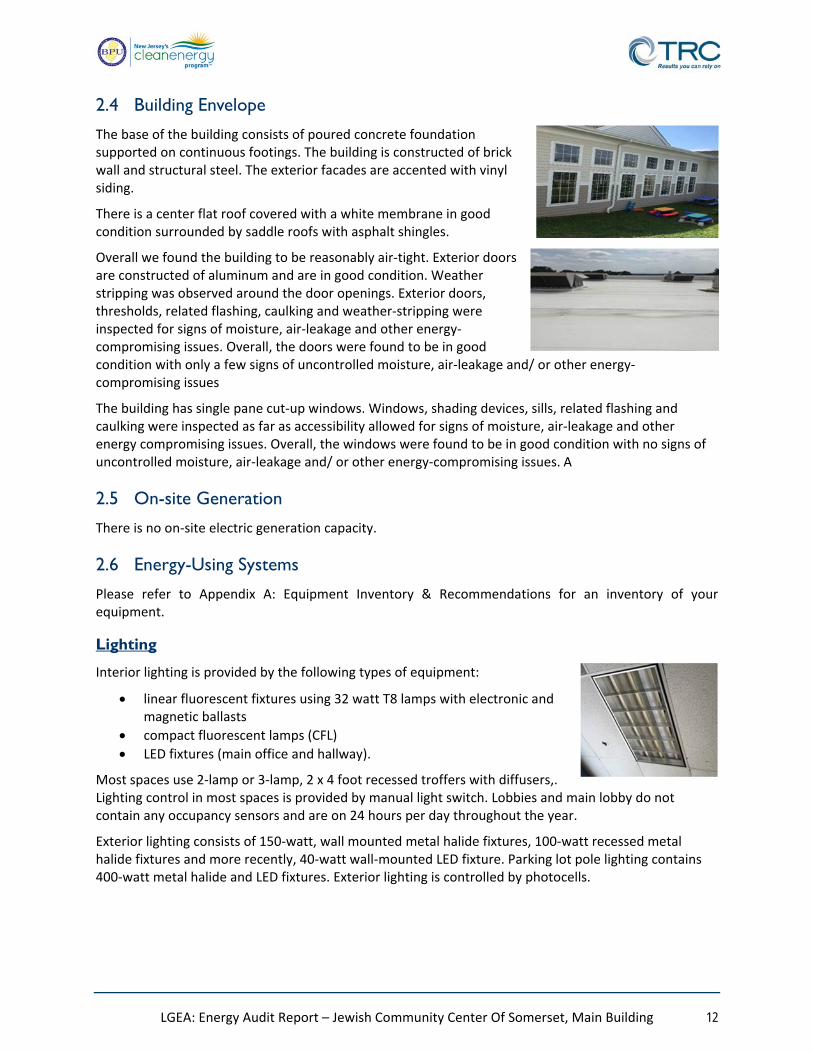
The base of the building consists of poured concrete foundation supported on continuous footings. The building is constructed of brick wall and structural steel. The exterior facades are accented with vinyl siding.
There is a center flat roof covered with a white membrane in good condition surrounded by saddle roofs with asphalt shingles.
Overall we found the building to be reasonably air‐tight. Exterior doors are constructed of aluminum and are in good condition. Weather stripping was observed around the door openings. Exterior doors, thresholds, related flashing, caulking and weather‐stripping were inspected for signs of moisture, air‐leakage and other energy‐compromising issues. Overall, the doors were found to be in good condition with only a few signs of uncontrolled moisture, air‐leakage and/ or other energy‐compromising issues
The building has single pane cut‐up windows. Windows, shading devices, sills, related flashing and caulking were inspected as far as accessibility allowed for signs of moisture, air‐leakage and other energy compromising issues. Overall, the windows were found to be in good condition with no signs of uncontrolled moisture, air‐leakage and/ or other energy‐compromising issues. A
2.5 On-site Generation
There is no on‐site electric generation capacity.
2.6 Energy-Using Systems
Please refer to Appendix A: Equipment Inventory & Recommendations for an inventory of your equipment.
Lighting
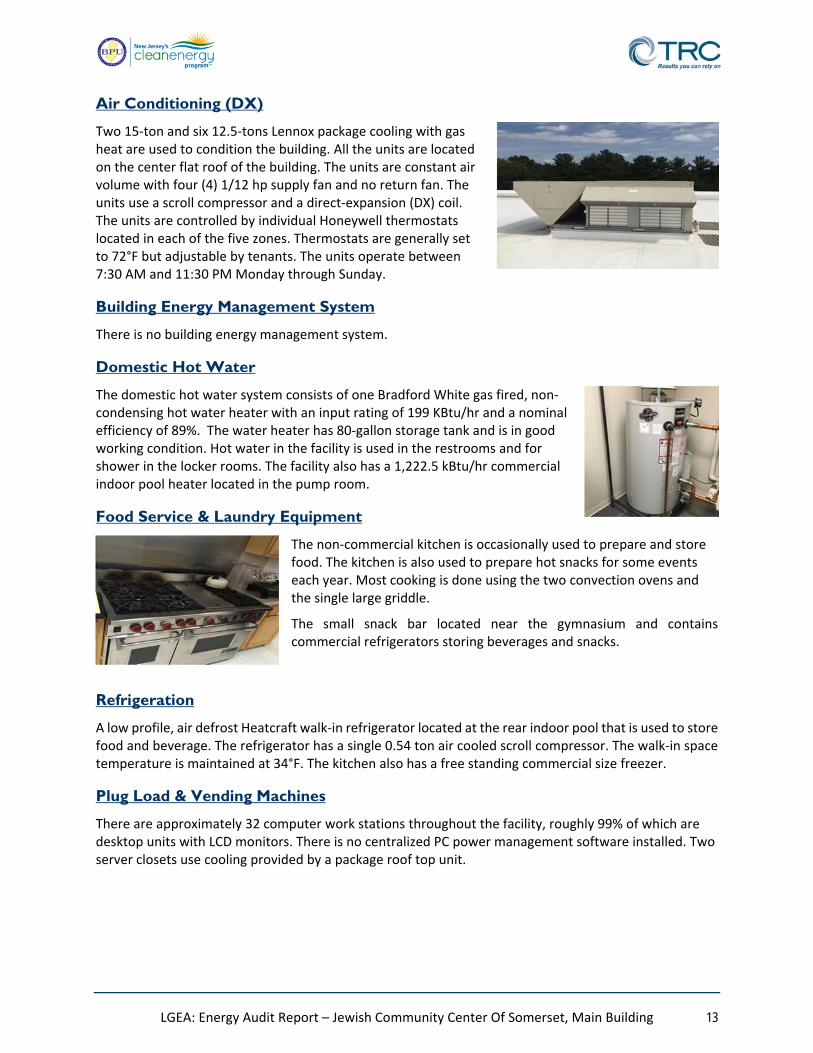
Interior lighting is provided by the following types of equipment:
linear fluorescent fixtures using 32 watt T8 lamps with electronic and magnetic ballasts
compact fluorescent lamps (CFL)
LED fixtures (main office and hallway).
Most spaces use 2‐lamp or 3‐lamp, 2 x 4 foot recessed troffers with diffusers,. Lighting control in most spaces is provided by manual light switch. Lobbies and main lobby do not contain any occupancy sensors and are on 24 hours per day throughout the year.
Exterior lighting consists of 150‐watt, wall mounted metal halide fixtures, 100‐watt recessed metal halide fixtures and more recently, 40‐watt wall‐mounted LED fixture. Parking lot pole lighting contains 400‐watt metal halide and LED fixtures. Exterior lighting is controlled by photocells.
LGEA: Energy Audit Report – Jewish Community Center Of Somerset, Main Building 13
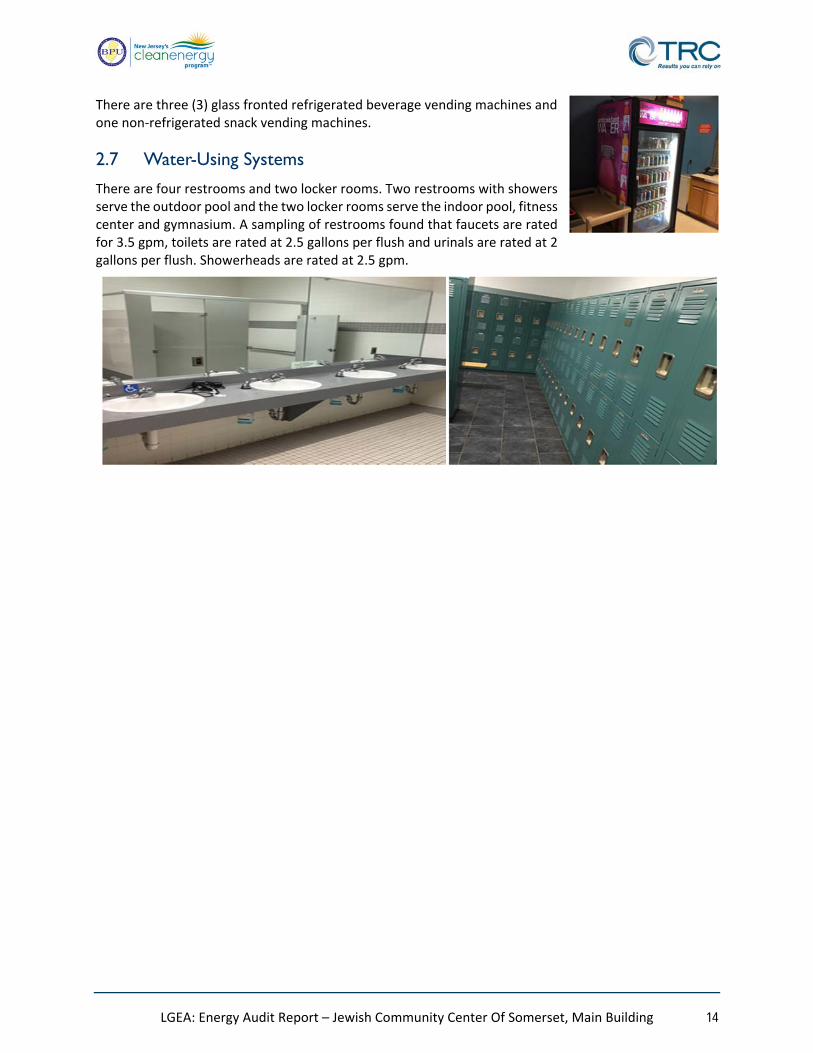
Air Conditioning (DX)
Two 15‐ton and six 12.5‐tons Lennox package cooling with gas heat are used to condition the building. All the units are located on the center flat roof of the building. The units are constant air volume with four (4) 1/12 hp supply fan and no return fan. The units use a scroll compressor and a direct‐expansion (DX) coil. The units are controlled by individual Honeywell thermostats located in each of the five zones. Thermostats are generally set to 72°F but adjustable by tenants. The units operate between 7:30 AM and 11:30 PM Monday through Sunday.
Building Energy Management System
There is no building energy management system.
Domestic Hot Water
The domestic hot water system consists of one Bradford White gas fired, non‐condensing hot water heater with an input rating of 199 KBtu/hr and a nominal efficiency of 89%. The water heater has 80‐gallon storage tank and is in good working condition. Hot water in the facility is used in the restrooms and for shower in the locker rooms. The facility also has a 1,222.5 kBtu/hr commercial indoor pool heater located in the pump room.
Food Service & Laundry Equipment
The non‐commercial kitchen is occasionally used to prepare and store food. The kitchen is also used to prepare hot snacks for some events each year. Most cooking is done using the two convection ovens and the single large griddle.
The small snack bar located near the gymnasium and contains commercial refrigerators storing beverages and snacks.
Refrigeration
A low profile, air defrost Heatcraft walk‐in refrigerator located at the rear indoor pool that is used to store food and beverage. The refrigerator has a single 0.54 ton air cooled scroll compressor. The walk‐in space temperature is maintained at 34°F. The kitchen also has a free standing commercial size freezer.
Plug Load & Vending Machines
There are approximately 32 computer work stations throughout the facility, roughly 99% of which are desktop units with LCD monitors. There is no centralized PC power management software installed. Two server closets use cooling provided by a package roof top unit.
LGEA: Energy Audit Report – Jewish Community Center Of Somerset, Main Building 14
There are three (3) glass fronted refrigerated beverage vending machines and one non‐refrigerated snack vending machines.
2.7 Water-Using Systems
There are four restrooms and two locker rooms. Two restrooms with showers serve the outdoor pool and the two locker rooms serve the indoor pool, fitness center and gymnasium. A sampling of restrooms found that faucets are rated for 3.5 gpm, toilets are rated at 2.5 gallons per flush and urinals are rated at 2 gallons per flush. Showerheads are rated at 2.5 gpm.
LGEA: Energy Audit Report – Jewish Community Center Of Somerset, Main Building 15
3 SITE ENERGY USE AND COSTS Utility data for electricity and natural gas was analyzed to identify opportunities for savings and determine the annual energy performance metrics for the building in energy cost/ft2 and energy use/ft2. These energy use indices are indicative of the relative energy effectiveness of this building. There are a number of factors that could cause the energy use of this building to vary from the “typical” energy use forsimilar facilities such as local climate conditions, daily occupancy hours of the facility, seasonal fluctuations in occupancy, daily operating hours of energy use systems, and occupant behavior. Refer to Section 3.4 for additional information.
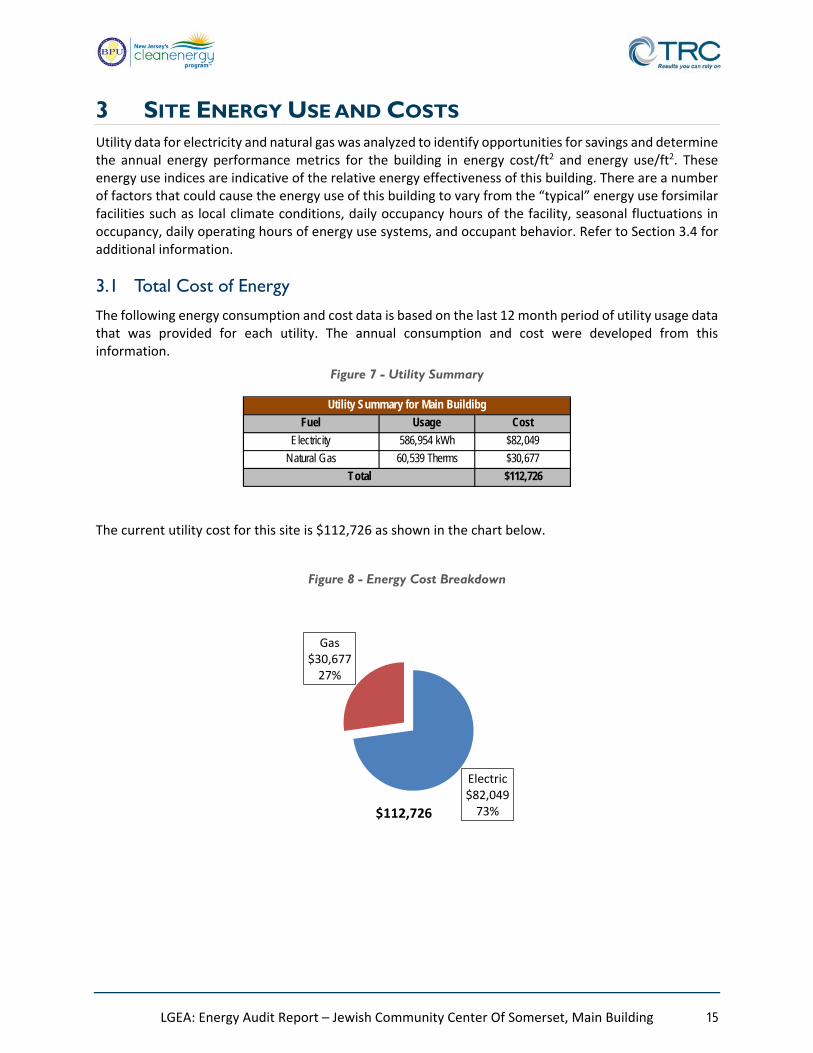
3.1 Total Cost of Energy
The following energy consumption and cost data is based on the last 12 month period of utility usage data that was provided for each utility. The annual consumption and cost were developed from this information.
Figure 7 - Utility Summary
The current utility cost for this site is $112,726 as shown in the chart below.
Figure 8 - Energy Cost Breakdown
Usage Cost
586,954 kWh $82,049
60,539 Therms $30,677
$112,726
Utility Summary for Main Buildibg
Fuel
Total
Electricity
Natural Gas
Electric$82,04973%
Gas$30,67727%
$112,726
LGEA: Energy Audit Report – Jewish Community Center Of Somerset, Main Building 16
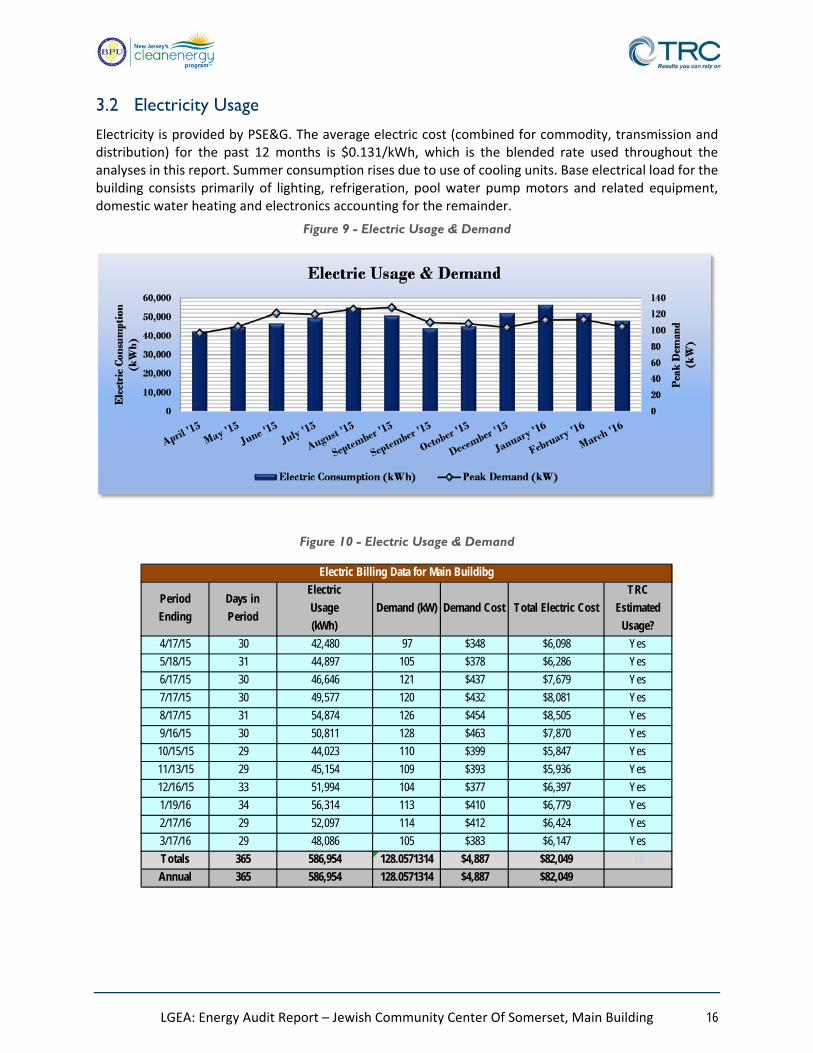
3.2 Electricity Usage
Electricity is provided by PSE&G. The average electric cost (combined for commodity, transmission and distribution) for the past 12 months is $0.131/kWh, which is the blended rate used throughout the analyses in this report. Summer consumption rises due to use of cooling units. Base electrical load for the building consists primarily of lighting, refrigeration, pool water pump motors and related equipment, domestic water heating and electronics accounting for the remainder.
Figure 9 - Electric Usage & Demand
Figure 10 - Electric Usage & Demand
Period
Ending
Days in
Period
Electric
Usage
(kWh)
Demand (kW) Demand Cost Total Electric Cost
TRC
Estimated
Usage?
4/17/15 30 42,480 97 $348 $6,098 Yes
5/18/15 31 44,897 105 $378 $6,286 Yes
6/17/15 30 46,646 121 $437 $7,679 Yes
7/17/15 30 49,577 120 $432 $8,081 Yes
8/17/15 31 54,874 126 $454 $8,505 Yes
9/16/15 30 50,811 128 $463 $7,870 Yes
10/15/15 29 44,023 110 $399 $5,847 Yes
11/13/15 29 45,154 109 $393 $5,936 Yes
12/16/15 33 51,994 104 $377 $6,397 Yes
1/19/16 34 56,314 113 $410 $6,779 Yes
2/17/16 29 52,097 114 $412 $6,424 Yes
3/17/16 29 48,086 105 $383 $6,147 Yes
Totals 365 586,954 128.0571314 $4,887 $82,049 12
Annual 365 586,954 128.0571314 $4,887 $82,049
Electric Billing Data for Main Buildibg
LGEA: Energy Audit Report – Jewish Community Center Of Somerset, Main Building 17
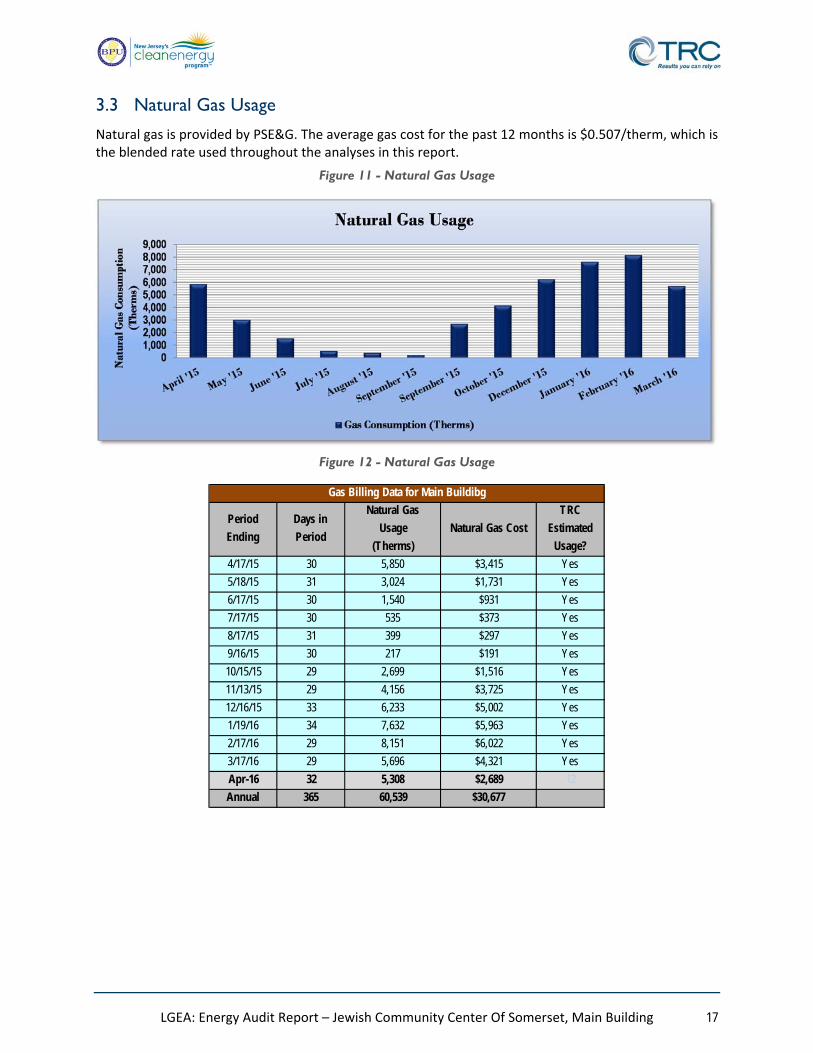
3.3 Natural Gas Usage
Natural gas is provided by PSE&G. The average gas cost for the past 12 months is $0.507/therm, which is the blended rate used throughout the analyses in this report.
Figure 11 - Natural Gas Usage
Figure 12 - Natural Gas Usage
Period
Ending
Days in
Period
Natural Gas
Usage
(Therms)
Natural Gas Cost
TRC
Estimated
Usage?
4/17/15 30 5,850 $3,415 Yes
5/18/15 31 3,024 $1,731 Yes
6/17/15 30 1,540 $931 Yes
7/17/15 30 535 $373 Yes
8/17/15 31 399 $297 Yes
9/16/15 30 217 $191 Yes
10/15/15 29 2,699 $1,516 Yes
11/13/15 29 4,156 $3,725 Yes
12/16/15 33 6,233 $5,002 Yes
1/19/16 34 7,632 $5,963 Yes
2/17/16 29 8,151 $6,022 Yes
3/17/16 29 5,696 $4,321 Yes
Apr-16 32 5,308 $2,689 12
Annual 365 60,539 $30,677
Gas Billing Data for Main Buildibg
LGEA: Energy Audit Report – Jewish Community Center Of Somerset, Main Building 18
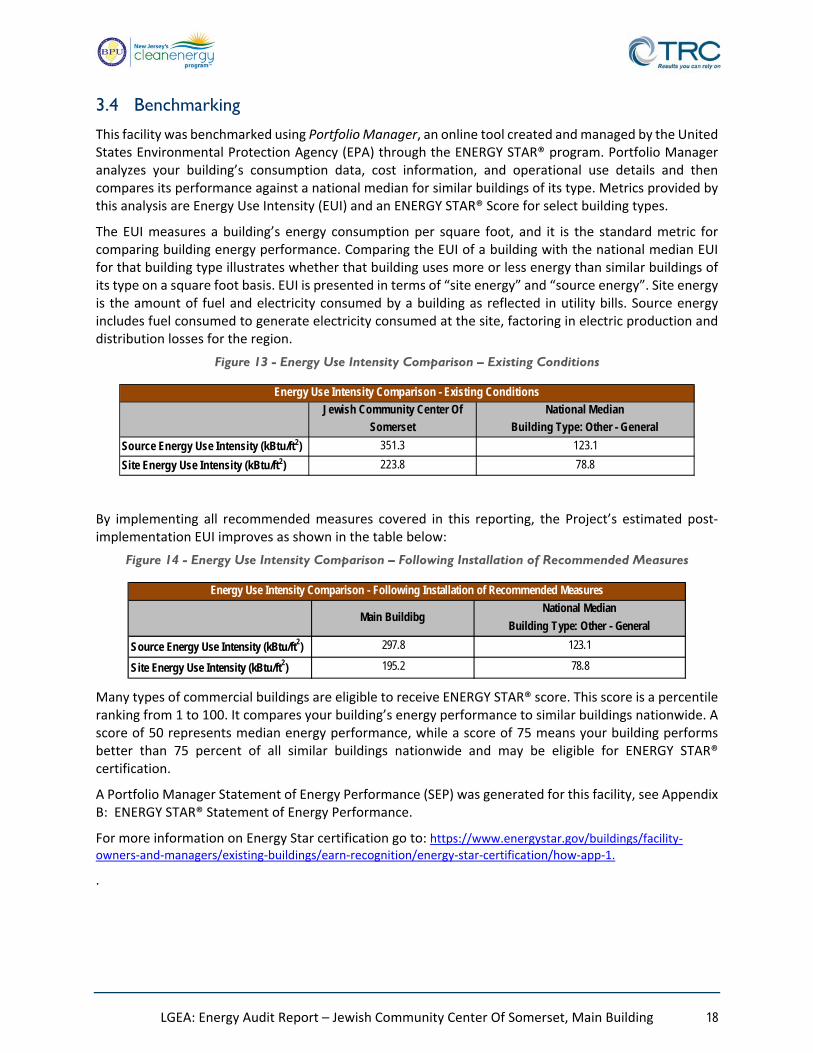
3.4 Benchmarking
This facility was benchmarked using Portfolio Manager, an online tool created and managed by the United States Environmental Protection Agency (EPA) through the ENERGY STAR® program. Portfolio Manager analyzes your building’s consumption data, cost information, and operational use details and then compares its performance against a national median for similar buildings of its type. Metrics provided by this analysis are Energy Use Intensity (EUI) and an ENERGY STAR® Score for select building types.
The EUI measures a building’s energy consumption per square foot, and it is the standard metric for comparing building energy performance. Comparing the EUI of a building with the national median EUI for that building type illustrates whether that building uses more or less energy than similar buildings of its type on a square foot basis. EUI is presented in terms of “site energy” and “source energy”. Site energy is the amount of fuel and electricity consumed by a building as reflected in utility bills. Source energy includes fuel consumed to generate electricity consumed at the site, factoring in electric production and distribution losses for the region.
Figure 13 - Energy Use Intensity Comparison – Existing Conditions
By implementing all recommended measures covered in this reporting, the Project’s estimated post‐implementation EUI improves as shown in the table below:
Figure 14 - Energy Use Intensity Comparison – Following Installation of Recommended Measures
Many types of commercial buildings are eligible to receive ENERGY STAR® score. This score is a percentile ranking from 1 to 100. It compares your building’s energy performance to similar buildings nationwide. A score of 50 represents median energy performance, while a score of 75 means your building performs better than 75 percent of all similar buildings nationwide and may be eligible for ENERGY STAR® certification.
A Portfolio Manager Statement of Energy Performance (SEP) was generated for this facility, see Appendix B: ENERGY STAR® Statement of Energy Performance.
For more information on Energy Star certification go to: https://www.energystar.gov/buildings/facility‐owners‐and‐managers/existing‐buildings/earn‐recognition/energy‐star‐certification/how‐app‐1.
.
Jewish Community Center Of
Somerset
National Median
Building Type: Other - General
Source Energy Use Intensity (kBtu/ft2) 351.3 123.1
Site Energy Use Intensity (kBtu/ft2) 223.8 78.8
Energy Use Intensity Comparison - Existing Conditions
Main BuildibgNational Median
Building Type: Other - General
Source Energy Use Intensity (kBtu/ft2) 297.8 123.1
Site Energy Use Intensity (kBtu/ft2) 195.2 78.8
Energy Use Intensity Comparison - Following Installation of Recommended Measures
LGEA: Energy Audit Report – Jewish Community Center Of Somerset, Main Building 19
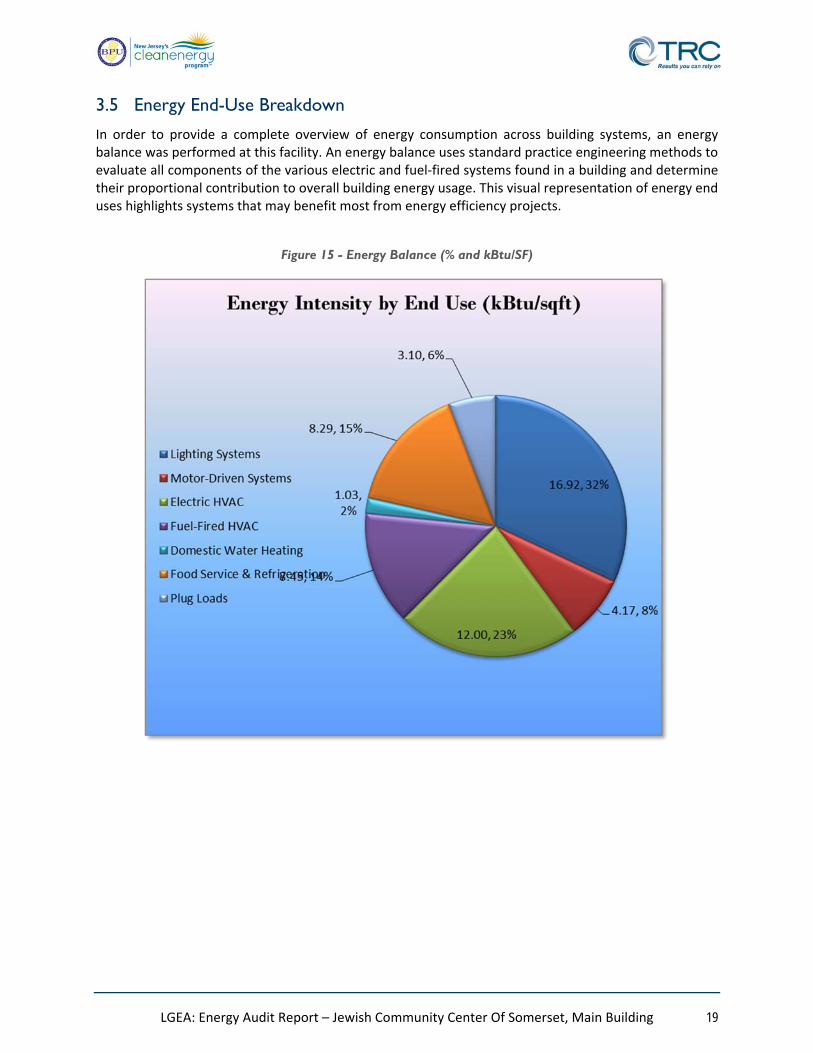
3.5 Energy End-Use Breakdown
In order to provide a complete overview of energy consumption across building systems, an energy balance was performed at this facility. An energy balance uses standard practice engineering methods to evaluate all components of the various electric and fuel‐fired systems found in a building and determine their proportional contribution to overall building energy usage. This visual representation of energy end uses highlights systems that may benefit most from energy efficiency projects.
Figure 15 - Energy Balance (% and kBtu/SF)

LGEA: Energy Audit Report – Jewish Community Center Of Somerset, Main Building 20
4 ENERGY CONSERVATION MEASURE
Level of Analysis
The goal of this audit report is to identify potential energy projects, help prioritize specific measures for implementation, and set the Jewish Community Center on a path to receive financial incentives. For this audit report, most measures have received a preliminary analysis of feasibility which identifies expected ranges of savings and costs. This level of analysis is considered sufficient to make “Go/No‐Go” decisions and to prioritize energy projects. Savings are based on the New Jersey Board of Public Utilities New Jersey Clean Energy Program Protocols to Measure Resource Savings dated March 17, 2014. Further analysis or investigation may be required to calculate more accurate savings to support any custom SmartStart, Pay for Performance, or Large Energy Users incentive applications. Financial incentives for the ECMs identified in this report were calculated based the NJ prescriptive SmartStart program. Depending on your implementation strategy, the project may be eligible for more lucrative incentives through other programs as identified in Section 7.
The following sections describe the evaluated measures.
4.1 Recommended ECMs
The measures were evaluated by the auditor and are recommended for implementation at the facility.
Figure 16 – Summary of Recommended ECMs
Please refer to Appendix A: Equipment Inventory & Recommendations for a detailed list of the locations
and equipment affected by the recommended ECMs.
Recommend?
Annual
Electric
Savings
(kWh)
Peak
Demand
Savings
(kW)
Annual
Natural Gas
Savings
(MMBtu)
Annual N/A
Savings
(MMBtu)
Annual N/A
Savings
(MMBtu)
Annual
Fuel
Savings
(MMBtu)
Annual
Energy Cost
Savings
($)
Estimated
Install Cost
($)
Estimated
Incentive
($)*
Estimated
Net Cost
($)
Simple
Payback
Period
(yrs)**
CO2e
Emissions
Reduction
(lbs)
104,493 14.3 0.0 0.0 0.0 0.0 $13,736.93 $44,936.93 $6,210.00 $38,726.93 2.82 105,224
ECM 1 Install LED Fix tures Yes 45,768 7.0 0.0 0.0 0.0 0.0 $6,016.83 $26,747.78 $3,945.00 $22,802.78 3.79 46,088
ECM 2 Retrofit Fix tures with LED Lamps Yes 56,692 7.2 0.0 0.0 0.0 0.0 $7,452.92 $15,070.06 $2,265.00 $12,805.06 1.72 57,089
ECM 3 Install LED Exit Signs Yes 2,032 0.2 0.0 0.0 0.0 0.0 $267.17 $3,119.10 $0.00 $3,119.10 11.67 2,047
7,434 0.9 0.0 0.0 0.0 0.0 $977.30 $2,088.00 $360.00 $1,728.00 1.77 7,486
ECM 4 Install Occupancy Sensor Lighting Controls Yes 7,434 0.9 0.0 0.0 0.0 0.0 $977.30 $2,088.00 $360.00 $1,728.00 1.77 7,486
452 0.3 0.0 0.0 0.0 0.0 $59.47 $2,177.52 $0.00 $2,177.52 36.61 456
ECM 5 Install High Efficiency Electric AC Yes 452 0.3 0.0 0.0 0.0 0.0 $59.47 $2,177.52 $0.00 $2,177.52 36.61 456
0 0.0 0.0 0.0 0.0 0.0 $0.00 $0.00 $0.00 $0.00 0.00 0
ECM 6 Install Dual Enthalpy Outside Economizer Control Yes 763 0.2 0.0 0.0 0.0 0.0 $100.26 $1,000.00 $500.00 $500.00 4.99 768
ECM 7 Install Low-Flow Domestic Hot Water Dev ices Yes 0 0.0 627.2 0.0 0.0 627.2 $3,178.16 $1,052.16 $0.00 $1,052.16 0.33 73,436
3,701 0.4 0.0 0.0 0.0 0.0 $486.60 $12,853.88 $925.00 $11,928.88 24.51 3,727
ECM 8 Dishwasher Replacement Yes 1,213 0.1 0.0 0.0 0.0 0.0 $159.44 $4,341.88 $400.00 $3,941.88 24.72 1,221
ECM 9 Replace Refrigeration Equipment Yes 2,489 0.3 0.0 0.0 0.0 0.0 $327.15 $8,512.00 $525.00 $7,987.00 24.41 2,506
1,209 0.0 0.0 0.0 0.0 0.0 $158.92 $2,156.40 $0.00 $2,156.40 13.57 1,217
ECM 10 Vending Machine Control Yes 1,209 0.0 0.0 0.0 0.0 0.0 $158.92 $2,156.40 $0.00 $2,156.40 13.57 1,217
0 0.0 0.0 0.0 0.0 0.0 $0.00 $0.00 $0.00 $0.00 0.00 0
118,052 16.1 627.2 0.0 0.0 627.2 $18,697.65 $66,264.89 $7,995.00 $58,269.89 3.12 192,314
* - All incentives presented in this table are based on NJ Smart Start Building equipment incentives and assume proposed equipment meets minimum performance criteria for that program.
** - Simple Payback Period is based on net measure costs (i.e. after incentives).
Energy Conservation Measure
Food Service Equipment & Refrigeration Measures
Plug Load Equipment Control - Vending Machine
Lighting Upgrades
Lighting Control Measures
Electric Unitary HVAC Measures
Electric Chiller Replacement
Custom Measures
TOTALS
LGEA: Energy Audit Report – Jewish Community Center Of Somerset, Main Building 21
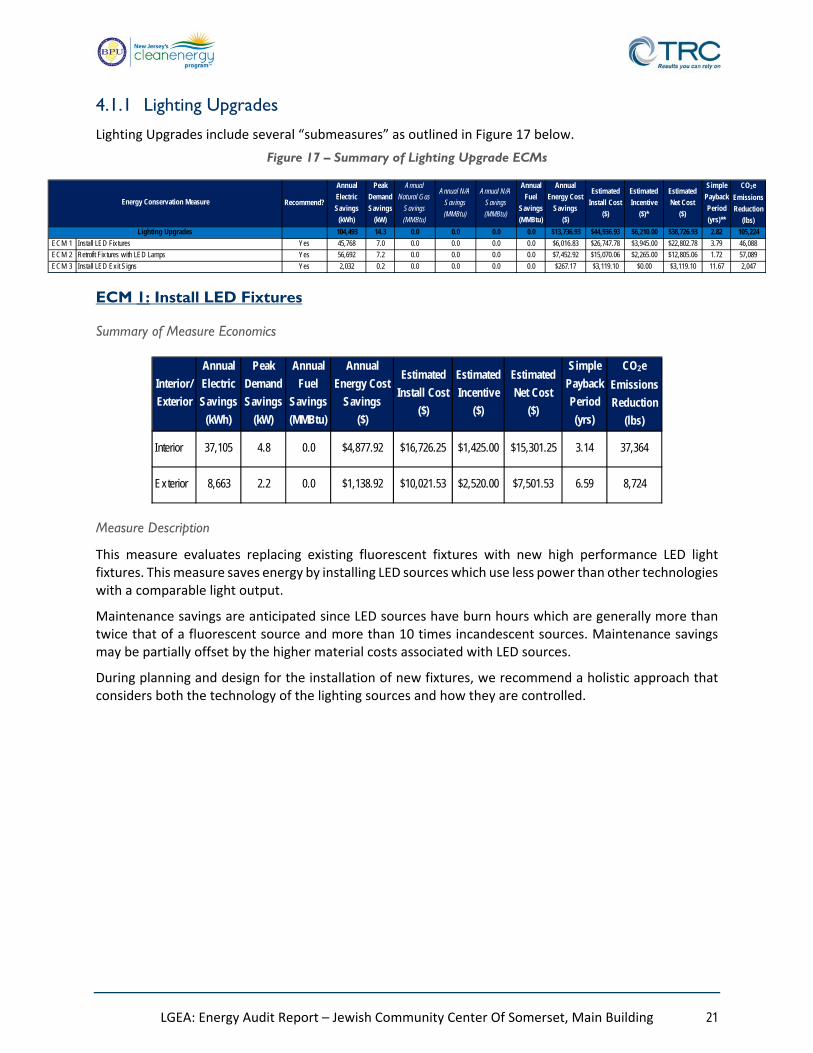
4.1.1 Lighting Upgrades
Lighting Upgrades include several “submeasures” as outlined in Figure 17 below.
Figure 17 – Summary of Lighting Upgrade ECMs
ECM 1: Install LED Fixtures
Summary of Measure Economics
Measure Description
This measure evaluates replacing existing fluorescent fixtures with new high performance LED light fixtures. This measure saves energy by installing LED sources which use less power than other technologies with a comparable light output.
Maintenance savings are anticipated since LED sources have burn hours which are generally more than twice that of a fluorescent source and more than 10 times incandescent sources. Maintenance savings may be partially offset by the higher material costs associated with LED sources.
During planning and design for the installation of new fixtures, we recommend a holistic approach that considers both the technology of the lighting sources and how they are controlled.
Recommend?
Annual
Electric
Savings
(kWh)
Peak
Demand
Savings
(kW)
Annual
Natural Gas
Savings
(MMBtu)
Annual N/A
Savings
(MMBtu)
Annual N/A
Savings
(MMBtu)
Annual
Fuel
Savings
(MMBtu)
Annual
Energy Cost
Savings
($)
Estimated
Install Cost
($)
Estimated
Incentive
($)*
Estimated
Net Cost
($)
Simple
Payback
Period
(yrs)**
CO2e
Emissions
Reduction
(lbs)
104,493 14.3 0.0 0.0 0.0 0.0 $13,736.93 $44,936.93 $6,210.00 $38,726.93 2.82 105,224
ECM 1 Install LED Fix tures Yes 45,768 7.0 0.0 0.0 0.0 0.0 $6,016.83 $26,747.78 $3,945.00 $22,802.78 3.79 46,088
ECM 2 Retrofit Fix tures with LED Lamps Yes 56,692 7.2 0.0 0.0 0.0 0.0 $7,452.92 $15,070.06 $2,265.00 $12,805.06 1.72 57,089
ECM 3 Install LED Exit Signs Yes 2,032 0.2 0.0 0.0 0.0 0.0 $267.17 $3,119.10 $0.00 $3,119.10 11.67 2,047
Energy Conservation Measure
Lighting Upgrades
Interior/
Exterior
Annual
Electric
Savings
(kWh)
Peak
Demand
Savings
(kW)
Annual
Fuel
Savings
(MMBtu)
Annual
Energy Cost
Savings
($)
Estimated
Install Cost
($)
Estimated
Incentive
($)
Estimated
Net Cost
($)
Simple
Payback
Period
(yrs)
CO2e
Emissions
Reduction
(lbs)
Interior 37,105 4.8 0.0 $4,877.92 $16,726.25 $1,425.00 $15,301.25 3.14 37,364
Exterior 8,663 2.2 0.0 $1,138.92 $10,021.53 $2,520.00 $7,501.53 6.59 8,724

LGEA: Energy Audit Report – Jewish Community Center Of Somerset, Main Building 22
ECM 2: Retrofit Fixtures with LED Lamps
Summary of Measure Economics
Measure Description
This measure evaluates replacing linear fluorescent lamps with LED tube lamps and replacing HID, incandescent and halogen screw‐in/plug‐in based lamps with LED lamps. Many LED tube lamps are direct replacements for existing fluorescent lamps and can be installed although there is a fluorescent fixture ballast in place. Other tube lamps require that fluorescent fixture ballasts be removed or replaced with LED drivers. Screw‐in/plug‐in LED lamps can be used as a direct replacement for most other screw‐in/plug‐in lamps. This measure saves energy by installing LED sources which use less power than other technologies with a comparable light output.
Maintenance savings are anticipated since LED sources have burn hours which are more than twice that of a fluorescent source and more than 10 times incandescent sources. LED lamps that use the existing fluorescent fixture ballast will be constrained by the remaining hours of the ballast. Maintenance savings may be partially offset by the higher material costs associated with LED sources.
During retrofit planning and design, we recommend a holistic approach that considers both the technology of the lighting sources and how they are controlled.
ECM 3: Install LED Exit Signs
Summary of Measure Economics
Measure Description
This measure evaluates replacing incandescent and compact fluorescent lighting in exit signs with LEDs. LED sources require virtually no maintenance and LED exit signs have a life expectancy of at least 20 years. Many manufacturers can provide retrofit kits that meet fire and safety code requirements. Retrofit kits are less expensive and simpler to install than replacement signs, however, new fixtures would have a longer useful life and are therefore recommended.
Interior/
Exterior
Annual
Electric
Savings
(kWh)
Peak
Demand
Savings
(kW)
Annual
Fuel
Savings
(MMBtu)
Annual
Energy Cost
Savings
($)
Estimated
Install Cost
($)
Estimated
Incentive
($)
Estimated
Net Cost
($)
Simple
Payback
Period
(yrs)
CO2e
Emissions
Reduction
(lbs)
Interior 56,692 7.2 0.0 $7,452.92 $15,070.06 $2,265.00 $12,805.06 1.72 57,089
Exterior 0 0.0 0.0 $0.00 $0.00 $0.00 $0.00 0.00 0
Interior/
Exterior
Annual
Electric
Savings
(kWh)
Peak
Demand
Savings
(kW)
Annual
Fuel
Savings
(MMBtu)
Annual
Energy Cost
Savings
($)
Estimated
Install Cost
($)
Estimated
Incentive
($)
Estimated
Net Cost
($)
Simple
Payback
Period
(yrs)
CO2e
Emissions
Reduction
(lbs)
Interior 2,032 0.2 0.0 $267.17 $3,119.10 $0.00 $3,119.10 11.67 2,047
Exterior 0 0.0 0.0 $0.00 $0.00 $0.00 $0.00 0.00 0
LGEA: Energy Audit Report – Jewish Community Center Of Somerset, Main Building 23
A reduction in maintenance costs will be realized with the proposed retrofit because lamps will not have to be replaced as frequently.
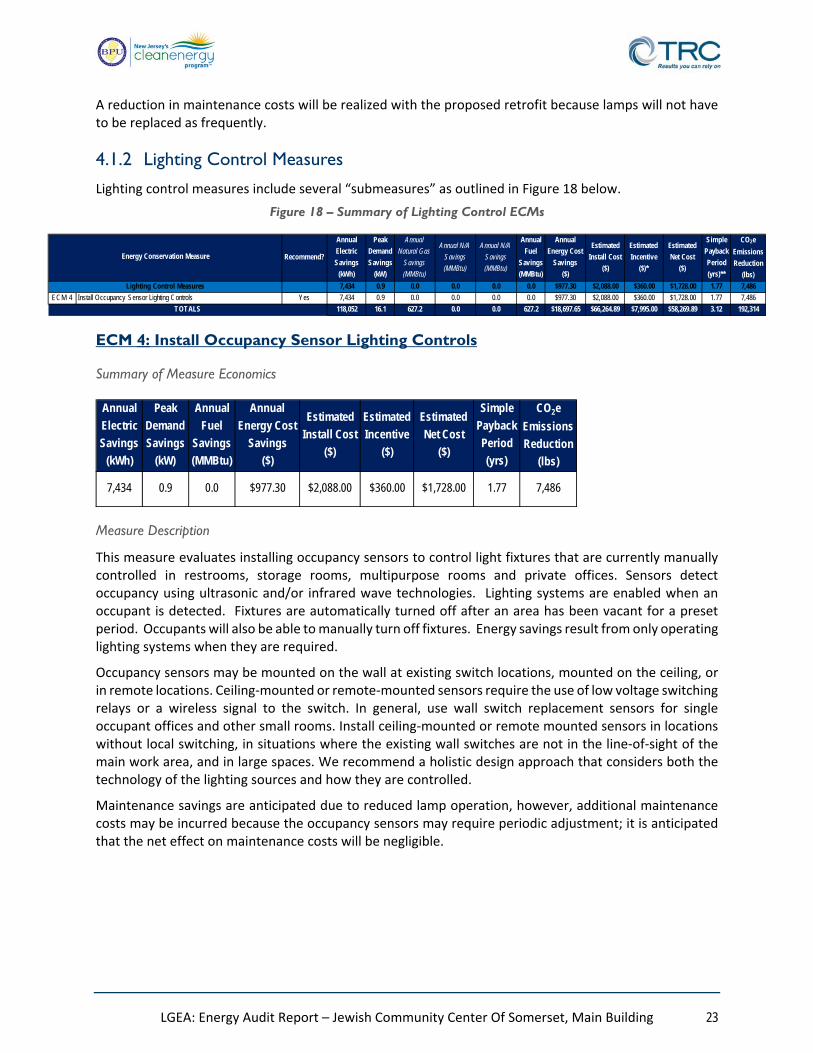
4.1.2 Lighting Control Measures
Lighting control measures include several “submeasures” as outlined in Figure 18 below.
Figure 18 – Summary of Lighting Control ECMs
ECM 4: Install Occupancy Sensor Lighting Controls
Summary of Measure Economics
Measure Description
This measure evaluates installing occupancy sensors to control light fixtures that are currently manually controlled in restrooms, storage rooms, multipurpose rooms and private offices. Sensors detect occupancy using ultrasonic and/or infrared wave technologies. Lighting systems are enabled when an occupant is detected. Fixtures are automatically turned off after an area has been vacant for a preset period. Occupants will also be able to manually turn off fixtures. Energy savings result from only operating lighting systems when they are required.
Occupancy sensors may be mounted on the wall at existing switch locations, mounted on the ceiling, or in remote locations. Ceiling‐mounted or remote‐mounted sensors require the use of low voltage switching relays or a wireless signal to the switch. In general, use wall switch replacement sensors for single occupant offices and other small rooms. Install ceiling‐mounted or remote mounted sensors in locations without local switching, in situations where the existing wall switches are not in the line‐of‐sight of the main work area, and in large spaces. We recommend a holistic design approach that considers both the technology of the lighting sources and how they are controlled.
Maintenance savings are anticipated due to reduced lamp operation, however, additional maintenance costs may be incurred because the occupancy sensors may require periodic adjustment; it is anticipated that the net effect on maintenance costs will be negligible.
Recommend?
Annual
Electric
Savings
(kWh)
Peak
Demand
Savings
(kW)
Annual
Natural Gas
Savings
(MMBtu)
Annual N/A
Savings
(MMBtu)
Annual N/A
Savings
(MMBtu)
Annual
Fuel
Savings
(MMBtu)
Annual
Energy Cost
Savings
($)
Estimated
Install Cost
($)
Estimated
Incentive
($)*
Estimated
Net Cost
($)
Simple
Payback
Period
(yrs)**
CO2e
Emissions
Reduction
(lbs)
7,434 0.9 0.0 0.0 0.0 0.0 $977.30 $2,088.00 $360.00 $1,728.00 1.77 7,486
ECM 4 Install Occupancy Sensor Lighting Controls Yes 7,434 0.9 0.0 0.0 0.0 0.0 $977.30 $2,088.00 $360.00 $1,728.00 1.77 7,486
118,052 16.1 627.2 0.0 0.0 627.2 $18,697.65 $66,264.89 $7,995.00 $58,269.89 3.12 192,314
Energy Conservation Measure
Lighting Control Measures
TOTALS
Annual
Electric
Savings
(kWh)
Peak
Demand
Savings
(kW)
Annual
Fuel
Savings
(MMBtu)
Annual
Energy Cost
Savings
($)
Estimated
Install Cost
($)
Estimated
Incentive
($)
Estimated
Net Cost
($)
Simple
Payback
Period
(yrs)
CO2e
Emissions
Reduction
(lbs)
7,434 0.9 0.0 $977.30 $2,088.00 $360.00 $1,728.00 1.77 7,486

LGEA: Energy Audit Report – Jewish Community Center Of Somerset, Main Building 24
4.1.3 Electric Unitary HVAC Measures
Unitary HVAC measures include several “submeasures” as outlined in Figure 19 below.
Figure 19 - Summary of Unitary HVAC ECMs
ECM 5: Install High Efficiency Electric AC
Summary of Measure Economics
Measure Description
This measure evaluates replacing package air conditioners with high efficiency package air conditioners. There have been significant improvements in both compressor and fan motor efficiencies in the past several years. Therefore, electricity savings can be achieved by replacing old units with new high efficiency units. A higher EER or SEER rating indicates a more efficient cooling system. The magnitude of energy savings for this measure depends on the relative efficiency of the old and new unit, the cooling load, and the annual operating hours.
Please refer to Appendix A: Equipment Inventory & Recommendations for more information about the
equipment affected by this measure.
4.1.4 HVAC System Improvements
HVAC system improvement measures include several “submeasures” as outlined in Figure 20 below.
Figure 20 - Summary of HVAC System Improvement ECMs
Recommend?
Annual
Electric
Savings
(kWh)
Peak
Demand
Savings
(kW)
Annual
Natural Gas
Savings
(MMBtu)
Annual N/A
Savings
(MMBtu)
Annual N/A
Savings
(MMBtu)
Annual
Fuel
Savings
(MMBtu)
Annual
Energy Cost
Savings
($)
Estimated
Install Cost
($)
Estimated
Incentive
($)*
Estimated
Net Cost
($)
Simple
Payback
Period
(yrs)**
CO2e
Emissions
Reduction
(lbs)
452 0.3 0.0 0.0 0.0 0.0 $59.47 $2,177.52 $0.00 $2,177.52 36.61 456
ECM 5 Install High Efficiency Electric AC Yes 452 0.3 0.0 0.0 0.0 0.0 $59.47 $2,177.52 $0.00 $2,177.52 36.61 456
118,052 16.1 627.2 0.0 0.0 627.2 $18,697.65 $66,264.89 $7,995.00 $58,269.89 3.12 192,314
Energy Conservation Measure
Electric Unitary HVAC Measures
TOTALS
Annual
Electric
Savings
(kWh)
Peak
Demand
Savings
(kW)
Annual
Fuel
Savings
(MMBtu)
Annual
Energy Cost
Savings
($)
Estimated
Install Cost
($)
Estimated
Incentive
($)
Estimated
Net Cost
($)
Simple
Payback
Period
(yrs)
CO2e
Emissions
Reduction
(lbs)
452 0.3 0.0 $59.47 $2,177.52 $0.00 $2,177.52 36.61 456
Recommend?
Annual
Electric
Savings
(kWh)
Peak
Demand
Savings
(kW)
Annual
Natural Gas
Savings
(MMBtu)
Annual N/A
Savings
(MMBtu)
Annual N/A
Savings
(MMBtu)
Annual
Fuel
Savings
(MMBtu)
Annual
Energy Cost
Savings
($)
Estimated
Install Cost
($)
Estimated
Incentive
($)*
Estimated
Net Cost
($)
Simple
Payback
Period
(yrs)**
CO2e
Emissions
Reduction
(lbs)
452 0.3 0.0 0.0 0.0 0.0 $59.47 $2,177.52 $0.00 $2,177.52 36.61 456
ECM 6 Install Dual Enthalpy Outside Economizer Control Yes 763 0.2 0.0 0.0 0.0 0.0 $100.26 $1,000.00 $500.00 $500.00 4.99 768
Energy Conservation Measure
Electric Unitary HVAC Measures
LGEA: Energy Audit Report – Jewish Community Center Of Somerset, Main Building 25
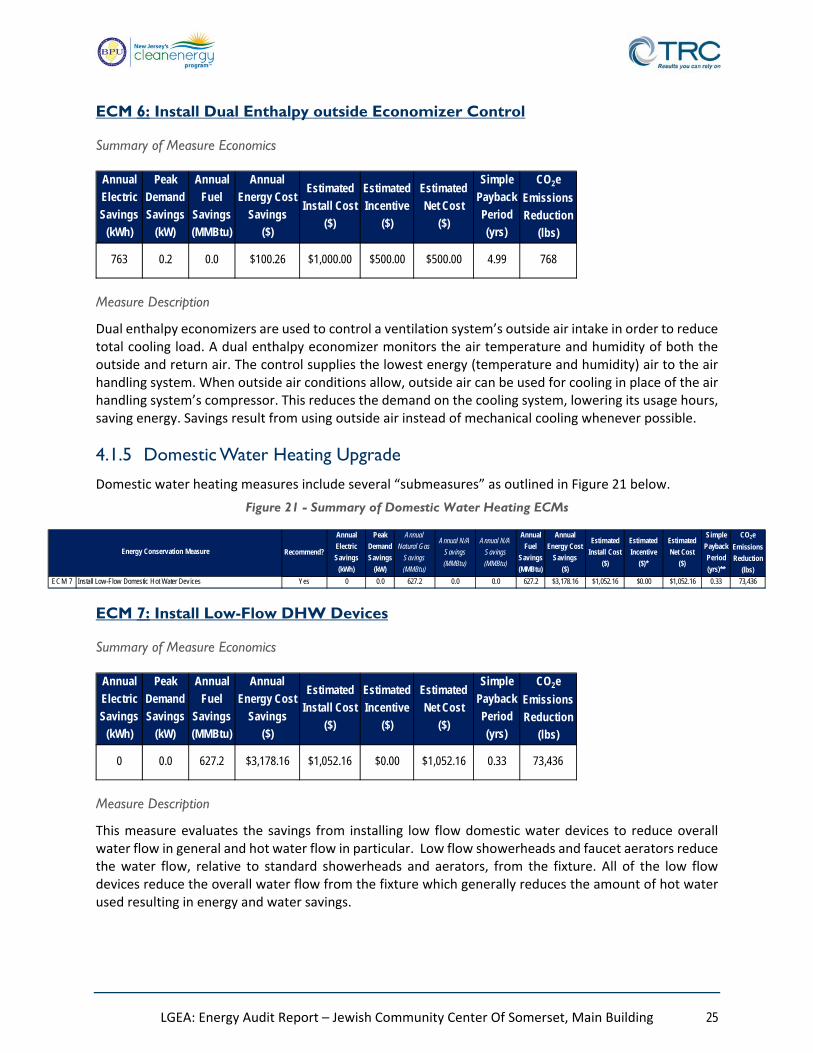
ECM 6: Install Dual Enthalpy outside Economizer Control
Summary of Measure Economics
Measure Description
Dual enthalpy economizers are used to control a ventilation system’s outside air intake in order to reduce total cooling load. A dual enthalpy economizer monitors the air temperature and humidity of both the outside and return air. The control supplies the lowest energy (temperature and humidity) air to the air handling system. When outside air conditions allow, outside air can be used for cooling in place of the air handling system’s compressor. This reduces the demand on the cooling system, lowering its usage hours, saving energy. Savings result from using outside air instead of mechanical cooling whenever possible.
4.1.5 Domestic Water Heating Upgrade
Domestic water heating measures include several “submeasures” as outlined in Figure 21 below.
Figure 21 - Summary of Domestic Water Heating ECMs
ECM 7: Install Low-Flow DHW Devices
Summary of Measure Economics
Measure Description
This measure evaluates the savings from installing low flow domestic water devices to reduce overall water flow in general and hot water flow in particular. Low flow showerheads and faucet aerators reduce the water flow, relative to standard showerheads and aerators, from the fixture. All of the low flow devices reduce the overall water flow from the fixture which generally reduces the amount of hot water used resulting in energy and water savings.
Annual
Electric
Savings
(kWh)
Peak
Demand
Savings
(kW)
Annual
Fuel
Savings
(MMBtu)
Annual
Energy Cost
Savings
($)
Estimated
Install Cost
($)
Estimated
Incentive
($)
Estimated
Net Cost
($)
Simple
Payback
Period
(yrs)
CO2e
Emissions
Reduction
(lbs)
763 0.2 0.0 $100.26 $1,000.00 $500.00 $500.00 4.99 768
Recommend?
Annual
Electric
Savings
(kWh)
Peak
Demand
Savings
(kW)
Annual
Natural Gas
Savings
(MMBtu)
Annual N/A
Savings
(MMBtu)
Annual N/A
Savings
(MMBtu)
Annual
Fuel
Savings
(MMBtu)
Annual
Energy Cost
Savings
($)
Estimated
Install Cost
($)
Estimated
Incentive
($)*
Estimated
Net Cost
($)
Simple
Payback
Period
(yrs)**
CO2e
Emissions
Reduction
(lbs)
ECM 7 Install Low-Flow Domestic Hot Water Dev ices Yes 0 0.0 627.2 0.0 0.0 627.2 $3,178.16 $1,052.16 $0.00 $1,052.16 0.33 73,436
Energy Conservation Measure
Annual
Electric
Savings
(kWh)
Peak
Demand
Savings
(kW)
Annual
Fuel
Savings
(MMBtu)
Annual
Energy Cost
Savings
($)
Estimated
Install Cost
($)
Estimated
Incentive
($)
Estimated
Net Cost
($)
Simple
Payback
Period
(yrs)
CO2e
Emissions
Reduction
(lbs)
0 0.0 627.2 $3,178.16 $1,052.16 $0.00 $1,052.16 0.33 73,436
LGEA: Energy Audit Report – Jewish Community Center Of Somerset, Main Building 26
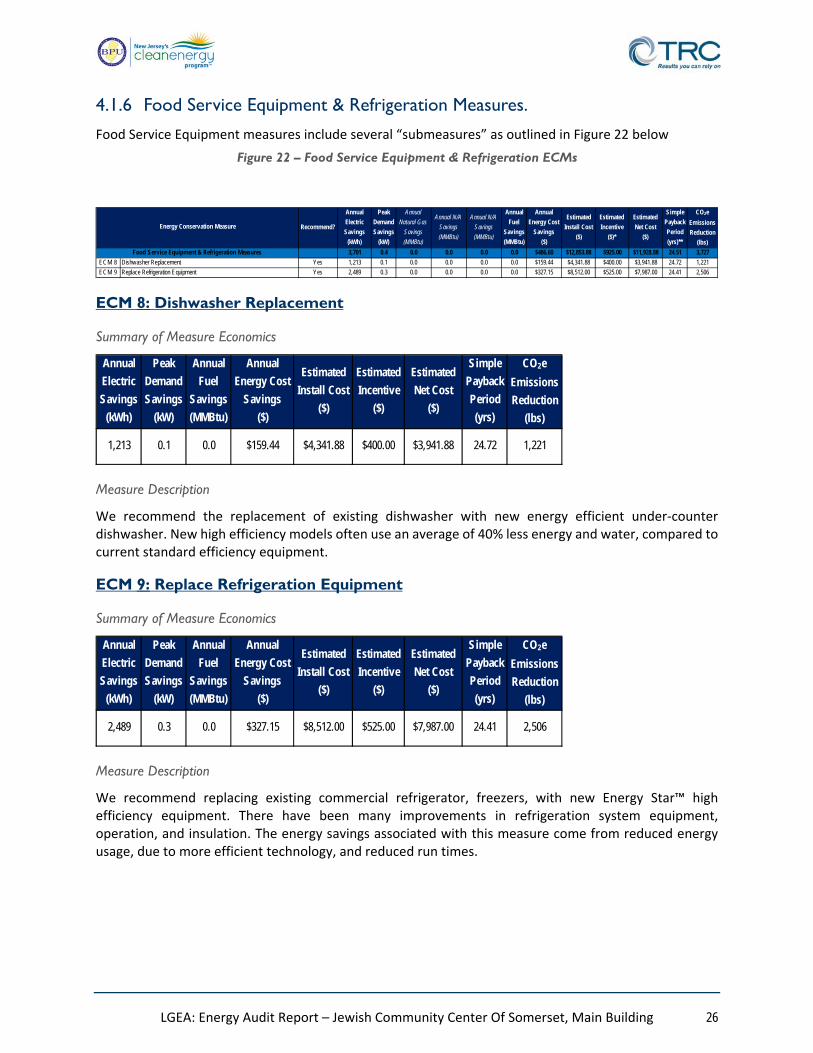
4.1.6 Food Service Equipment & Refrigeration Measures.
Food Service Equipment measures include several “submeasures” as outlined in Figure 22 below
Figure 22 – Food Service Equipment & Refrigeration ECMs
ECM 8: Dishwasher Replacement
Summary of Measure Economics
Measure Description
We recommend the replacement of existing dishwasher with new energy efficient under‐counter dishwasher. New high efficiency models often use an average of 40% less energy and water, compared to current standard efficiency equipment.
ECM 9: Replace Refrigeration Equipment
Summary of Measure Economics
Measure Description
We recommend replacing existing commercial refrigerator, freezers, with new Energy Star™ high efficiency equipment. There have been many improvements in refrigeration system equipment, operation, and insulation. The energy savings associated with this measure come from reduced energy usage, due to more efficient technology, and reduced run times.
Recommend?
Annual
Electric
Savings
(kWh)
Peak
Demand
Savings
(kW)
Annual
Natural Gas
Savings
(MMBtu)
Annual N/A
Savings
(MMBtu)
Annual N/A
Savings
(MMBtu)
Annual
Fuel
Savings
(MMBtu)
Annual
Energy Cost
Savings
($)
Estimated
Install Cost
($)
Estimated
Incentive
($)*
Estimated
Net Cost
($)
Simple
Payback
Period
(yrs)**
CO2e
Emissions
Reduction
(lbs)
3,701 0.4 0.0 0.0 0.0 0.0 $486.60 $12,853.88 $925.00 $11,928.88 24.51 3,727
ECM 8 Dishwasher Replacement Yes 1,213 0.1 0.0 0.0 0.0 0.0 $159.44 $4,341.88 $400.00 $3,941.88 24.72 1,221
ECM 9 Replace Refrigeration Equipment Yes 2,489 0.3 0.0 0.0 0.0 0.0 $327.15 $8,512.00 $525.00 $7,987.00 24.41 2,506
Energy Conservation Measure
Food Service Equipment & Refrigeration Measures
Annual
Electric
Savings
(kWh)
Peak
Demand
Savings
(kW)
Annual
Fuel
Savings
(MMBtu)
Annual
Energy Cost
Savings
($)
Estimated
Install Cost
($)
Estimated
Incentive
($)
Estimated
Net Cost
($)
Simple
Payback
Period
(yrs)
CO2e
Emissions
Reduction
(lbs)
1,213 0.1 0.0 $159.44 $4,341.88 $400.00 $3,941.88 24.72 1,221
Annual
Electric
Savings
(kWh)
Peak
Demand
Savings
(kW)
Annual
Fuel
Savings
(MMBtu)
Annual
Energy Cost
Savings
($)
Estimated
Install Cost
($)
Estimated
Incentive
($)
Estimated
Net Cost
($)
Simple
Payback
Period
(yrs)
CO2e
Emissions
Reduction
(lbs)
2,489 0.3 0.0 $327.15 $8,512.00 $525.00 $7,987.00 24.41 2,506

LGEA: Energy Audit Report – Jewish Community Center Of Somerset, Main Building 27
4.1.7 Plug Load Equipment Control - Vending Machine
ECM 10: Vending Machine Control
Summary of Measure Economics
Measure Description
Vending machines operate continuously, even during non‐business hours. It is recommended to install occupancy sensor based controls to reduce the energy use. These controls power down the machine when the surrounding area is vacant, then monitor the surrounding temperature and power up the cooling system at regular intervals to keep the product cool. Savings are a function of the activity level around the vending machine.
Annual
Electric
Savings
(kWh)
Peak
Demand
Savings
(kW)
Annual
Fuel
Savings
(MMBtu)
Annual
Energy Cost
Savings
($)
Estimated
Install Cost
($)
Estimated
Incentive
($)
Estimated
Net Cost
($)
Simple
Payback
Period
(yrs)
CO2e
Emissions
Reduction
(lbs)
1,209 0.0 0.0 $158.92 $2,156.40 $0.00 $2,156.40 13.57 1,217

LGEA: Energy Audit Report – Jewish Community Center Of Somerset, Main Building 28
5 ENERGY EFFICIENT PRACTICES In addition to the quantifiable savings estimated in Section 4, a facility’s energy performance can also be improved through application of low or no‐cost efficiency strategies. By employing certain behavioral and operational adjustments as well as performing routine maintenance on building systems, equipment lifetime can be extended; occupant comfort, health and safety can be improved; and annual energy, operation, and maintenance costs can be reduced. The recommendations below are provided as a framework for developing a whole building maintenance plan that is customized to your facility. Consult with qualified equipment specialists for details on proper maintenance and system operation.
Reduce Air Leakage
Air leakage, or infiltration, occurs when outside air enters a building uncontrollably through cracks and openings. Properly sealing such cracks and openings can significantly reduce heating and cooling costs, improve building durability, and create a healthier indoor environment. This includes caulking or installing weather stripping around leaky doors and windows allowing for better control of indoor air quality through controlled ventilation.
Close Doors and Windows
Ensure doors and windows are closed in conditioned spaces. Leaving doors and windows open leads to a significant increase in heat transfer between conditioned spaces and the outside air. Reducing a facility’s air changes per hour (ACH) can lead to increased occupant comfort as well as significant heating and cooling savings, especially when combined with proper HVAC controls and adequate ventilation.
Perform Proper Lighting Maintenance
In order to sustain optimal lighting levels, lighting fixtures should undergo routine maintenance. Light levels decrease over time due to lamp aging, lamp and ballast failure, and buildup of dirt and dust on lamps, fixtures and reflective surfaces. Together, these factors can reduce total illumination by 20% ‐ 60% or more, while operating fixtures continue drawing full power. To limit this reduction, lamps, reflectors and diffusers should be thoroughly cleaned of dirt, dust, oil, and smoke film buildup approximately every 6 – 12 months.
Develop a Lighting Maintenance Schedule
In addition to routine fixture cleaning, development of a maintenance schedule can both ensure maintenance is performed regularly and can reduce the overall cost of fixture re‐lamping and re‐ballasting. By re‐lamping and re‐ballasting fixtures in groups, lighting levels are better maintained and the number of site visits by a lighting technician or contractor can be minimized, decreasing the overall cost of maintenance.
Ensure Lighting Controls Are Operating Properly
Lighting controls are very cost effective energy efficient devices, when installed and operating correctly. As part of a lighting maintenance schedule, lighting controls should be tested annually to ensure proper functioning. For occupancy sensors, this requires triggering the sensor and verifying that the sensor’s timer settings are correct. For daylight sensors, maintenance involves cleaning of sensor lenses and confirming setpoints and sensitivity are appropriately configured.
LGEA: Energy Audit Report – Jewish Community Center Of Somerset, Main Building 29
Perform Routine Motor Maintenance
Motors consist of many moving parts whose collective degradation can contribute to a significant loss of motor efficiency. In order to prevent damage to motor components, routine maintenance should be performed. This maintenance consists of cleaning surfaces and ventilation openings on motors to prevent overheating, lubricating moving parts to reduce friction, inspecting belts and pulleys for wear and to ensure they are at proper alignment and tension, and cleaning and lubricating bearings. Consult a licensed technician to assess these and other motor maintenance strategies.
Use Fans to Reduce Cooling Load
Utilizing ceiling fans to supplement cooling is a low cost strategy to reduce cooling load considerably. Thermostat settings can be increased by 4°F with no change in overall occupant comfort when the wind chill effect of moving air is employed for cooling.
Practice Proper Use of Thermostat Schedules and Temperature Resets
Ensure thermostats are correctly set back. By employing proper set back temperatures and schedules, facility heating and cooling costs can be reduced dramatically during periods of low or no occupancy. As such, thermostats should be programmed for a setback of 5‐10 °F during low occupancy hours (reduce heating setpoints and increase cooling setpoints). Cooling load can be reduced further by increasing the facility’s occupied setpoint temperature. In general, during the cooling season, thermostats should be set as high as possible without sacrificing occupant comfort.
Clean Evaporator/Condenser Coils on AC Systems
Dirty evaporators and condensers coils cause a restriction to air flow and restrict heat transfer. This results in increased evaporator and condenser fan load and a decrease in cooling system performance. Keeping the coils clean allows the fans and cooling system to operate more efficiently.
Clean and/or Replace HVAC Filters
Air filters work to reduce the amount of indoor air pollution and increase occupant comfort. Over time, filters become less and less effective as particulate buildup increases. In addition to health concerns related to clogged filters, filters that have reached saturation also restrict air flow through the facility’s air conditioning or heat pump system, increasing the load on the distribution fans and decreasing occupant comfort levels. Filters should be checked monthly and cleaned or replaced when appropriate.
Check for and Seal Duct Leakage
Duct leakage in commercial buildings typically accounts for 5 to 25 percent of the supply airflow. In the case of rooftop air handlers, duct leakage can occur to the outside of the building, significantly increasing cooling and heating costs. By sealing sources of leakage, cooling, heating, and ventilation energy use can be reduced significantly, depending on the severity of air leakage.
Perform Proper Boiler Maintenance
Many boiler problems develop slowly over time, so regular inspection and maintenance is essential to retain proper functionality and efficiency of the heating system. Fuel burning equipment should undergo yearly tune‐ups to ensure they are operating as safely and efficiently as possible from a combustion standpoint. A tune‐up should include a combustion analysis to analyze the exhaust from the boilers and to ensure the boiler is operating safely. Buildup of dirt, dust, or deposits on the internal surfaces of a boiler can greatly affect its heat transfer efficiency. These deposits can accumulate on the water side or fire side
LGEA: Energy Audit Report – Jewish Community Center Of Somerset, Main Building 30
of the boiler. Boilers should be cleaned regularly according to the manufacturer’s instructions to remove this build up in order to sustain efficiency and equipment life.
Perform Proper Furnace Maintenance
Preventative furnace maintenance can extend the life of the system, maintain energy efficiency, and ensure safe operation. Following the manufacturer’s instructions, a yearly tune‐up should include tasks such as checking for gas / carbon monoxide leaks; changing the air and fuel filters; checking components for cracks, corrosion, dirt, or debris build‐up; ensuring the ignition system is working properly; testing and adjusting operation and safety controls; inspecting the electrical connections; and ensuring proper lubrication for motors and bearings.
Perform Proper Water Heater Maintenance
At least once a year, drain a few gallons out of the water heater using the drain valve. If there is a lot of sediment or debris, then a full flush is recommended. Turn the temperature down and then completely drain the tank. Once a year check for any leaks or heavy corrosion on the pipes and valves. For gas water heaters, check the draft hood and make sure it is placed properly, with a few inches of air space between the tank and where it connects to the vent. Look for any corrosion or wear on the gas line and on the piping. If you noticed any black residue, soot or charred metal, this is a sign you may be having combustion issues and you should have the unit serviced by a professional. For electric water heaters, look for any signs of leaking such as rust streaks or residue around the upper and lower panels covering the electrical components on the tank. For water heaters over three to four years old have a technician inspect the sacrificial anode annually.
Plug Load Controls
There are a variety of ways to limit the energy use of plug loads including increasing occupant awareness, removing under‐utilized equipment, installing hardware controls, and using software controls. Some control steps to take are to enable the most aggressive power settings on existing devices or install load sensing or occupancy sensing (advanced) power strips. For additional information refer to “Assessing and Reducing Plug and Process Loads in Office Buildings” http://www.nrel.gov/docs/fy13osti/54175.pdf, or “Plug Load Best Practices Guide” http://www.advancedbuildings.net/plug‐load‐best‐practices‐guide‐offices
Water Conservation
Installing low flow faucets or faucet aerators, low flow showerheads, and kitchen sink pre‐rinse spray valves saves both energy and water. These devices save energy by reducing the overall amount of hot water used hence reducing the energy used to heat the water. The flow ratings for EPA WaterSense (http://www3.epa.gov/watersense/products) labeled devices are 1.5 gpm for bathroom faucets, 2.0 gpm for showerheads, and 1.28 gpm for pre‐rinse spray valves.
Installing dual flush or low flow toilets and low flow or waterless urinals are additional ways to reduce the sites water use, however, these devices do not provide energy savings at the site level. Any reduction in water use does however ultimately reduce grid level electricity use since a significant amount of electricity is used to deliver water from reservoirs to end users. The EPA WaterSense ratings for urinals is 0.5 gallons per flush (gpf) and toilets that use as little as 1.28 gpf (this is lower than the current 1.6 gpf federal standard).
Refer to Section 4.1.5 for any low‐flow ECM recommendations.
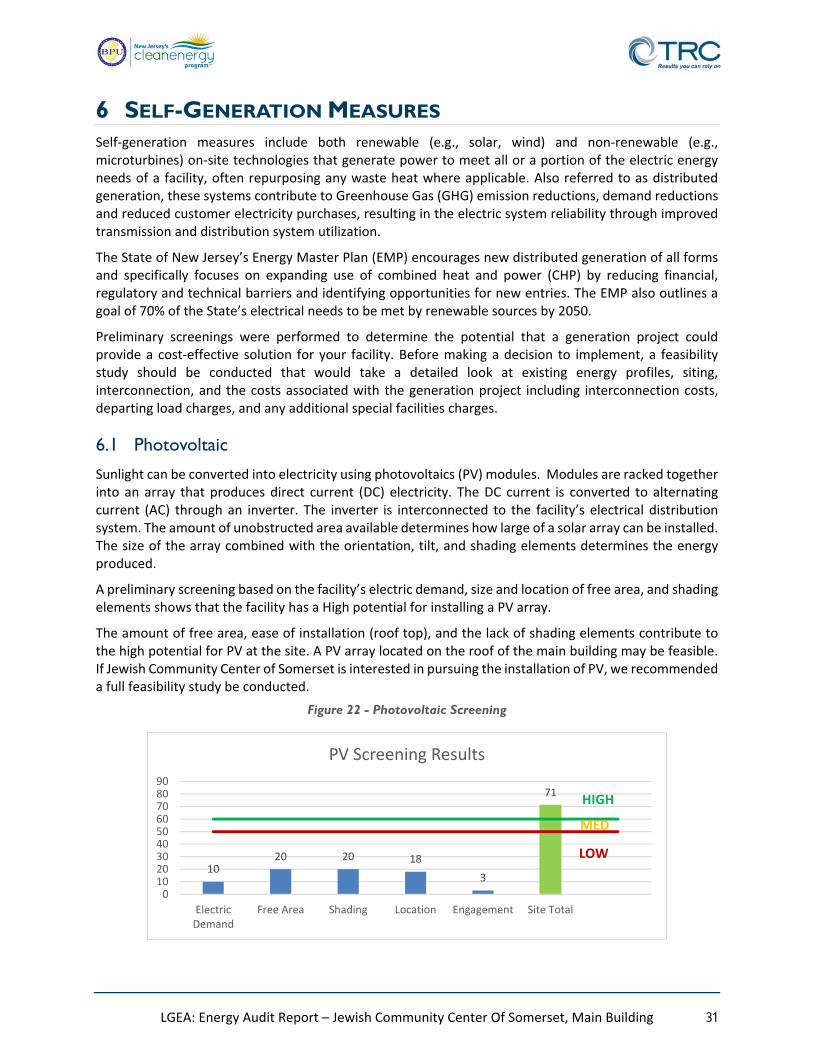
LGEA: Energy Audit Report – Jewish Community Center Of Somerset, Main Building 31
6 SELF-GENERATION MEASURES Self‐generation measures include both renewable (e.g., solar, wind) and non‐renewable (e.g., microturbines) on‐site technologies that generate power to meet all or a portion of the electric energy needs of a facility, often repurposing any waste heat where applicable. Also referred to as distributed generation, these systems contribute to Greenhouse Gas (GHG) emission reductions, demand reductions and reduced customer electricity purchases, resulting in the electric system reliability through improved transmission and distribution system utilization.
The State of New Jersey’s Energy Master Plan (EMP) encourages new distributed generation of all forms and specifically focuses on expanding use of combined heat and power (CHP) by reducing financial, regulatory and technical barriers and identifying opportunities for new entries. The EMP also outlines a goal of 70% of the State’s electrical needs to be met by renewable sources by 2050.
Preliminary screenings were performed to determine the potential that a generation project could provide a cost‐effective solution for your facility. Before making a decision to implement, a feasibility study should be conducted that would take a detailed look at existing energy profiles, siting, interconnection, and the costs associated with the generation project including interconnection costs, departing load charges, and any additional special facilities charges.
6.1 Photovoltaic
Sunlight can be converted into electricity using photovoltaics (PV) modules. Modules are racked together into an array that produces direct current (DC) electricity. The DC current is converted to alternating current (AC) through an inverter. The inverter is interconnected to the facility’s electrical distribution system. The amount of unobstructed area available determines how large of a solar array can be installed. The size of the array combined with the orientation, tilt, and shading elements determines the energy produced.
A preliminary screening based on the facility’s electric demand, size and location of free area, and shading elements shows that the facility has a High potential for installing a PV array.
The amount of free area, ease of installation (roof top), and the lack of shading elements contribute to the high potential for PV at the site. A PV array located on the roof of the main building may be feasible. If Jewish Community Center of Somerset is interested in pursuing the installation of PV, we recommended a full feasibility study be conducted.
Figure 22 - Photovoltaic Screening
1020 20 18
3
71
0102030405060708090
ElectricDemand
Free Area Shading Location Engagement Site Total
PV Screening Results
HIGH
MED
LOW

LGEA: Energy Audit Report – Jewish Community Center Of Somerset, Main Building 32
Rebates are not available for solar projects, but owners of solar projects MUST register their projects in the SREC Registration Program prior to the start of construction in order to establish the project’s eligibility to earn SRECs. Registration of the intent to participate in New Jersey's solar marketplace provides market participants with information about the pipeline of anticipated new solar capacity and insight into future SREC pricing. Refer to Section 8.6 for additional information.
For more information on solar PV technology and commercial solar markets in New Jersey, or to find a qualified solar installer, who can provide a more detailed assessment of the specific costs and benefits of solar develop of the site, please visit the following links below:
‐ Basic Info on Solar PV in NJ: http://www.njcleanenergy.com/whysolar ‐ NJ Solar Market FAQs: http://www.njcleanenergy.com/renewable‐energy/program‐updates‐
and‐background‐information/solar‐transition/solar‐market‐faqs ‐ Approved Solar Installers in the NJ Market: http://www.njcleanenergy.com/commercial‐
industrial/programs/nj‐smartstart‐buildings/tools‐and‐resources/tradeally/approved_vendorsearch/?id=60&start=1
6.2 Combined Heat and Power
In non‐industrial settings, combined heat and power (CHP) is the on‐site generation of electricity and recovery of heat which is put to beneficial use. Common prime movers in CHP applications include reciprocating engines, microturbines, fuel cells, and (at large facilities) gas turbines. Electricity is typically interconnected to the sites local distribution system. Heat is recovered from the exhaust stream and the ancillary cooling system and interconnected to the existing hot water (or steam) distribution system.
CHP systems are typically used to produce a portion of the electricity needed by a facility, with the balance of electric needs satisfied by purchase from the grid. The heat is used to supplement (or supplant) existing boilers for the purpose of space heating and/or domestic hot water heating. Waste heat can also be routed through absorption chillers for the purpose of space cooling. The key criteria used for screening, however, is the amount of time the system operates at full load and the facility’s ability to use the recovered heat. Facilities with continuous use for large quantities of waste heat are the best candidates for CHP.
A preliminary screening based on heating and electrical demand, siting, and interconnection shows that the facility has a Low potential for installing a cost‐effective CHP system.
Low or infrequent thermal load, and lack of space near the existing thermal generation are the most significant factors contributing to the low potential for CHP at the site. In our opinion, the facility does not appear to meet the minimum requirements for a cost‐effective CHP installation.
For a list of qualified firms in NJ specializing in commercial CHP cost assessment and installation, go to:
http://www.njcleanenergy.com/commercial‐industrial/programs/nj‐smartstart‐buildings/tools‐and‐resources/tradeally/approved_vendorsearch/
Figure 23 - Combined Heat and Power Screening
Potential High
System Potential 107 kW DC STC
Electric Generation 127,477 kWh/yr
Displaced Cost $11,090 /yr
Installed Cost $278,200

LGEA: Energy Audit Report – Jewish Community Center Of Somerset, Main Building 33
Refer to Section Error! Reference source not found. for additional information in the Combined Heat & Power and Fuel Cell Program.
10 12 16 150 0
0
20
40
60
80
100
120
140
Gas Service ThermalDemand
ElectricDemand
Location Engagement Site Total
CHP Screening Results
HIGH
MED
LOW
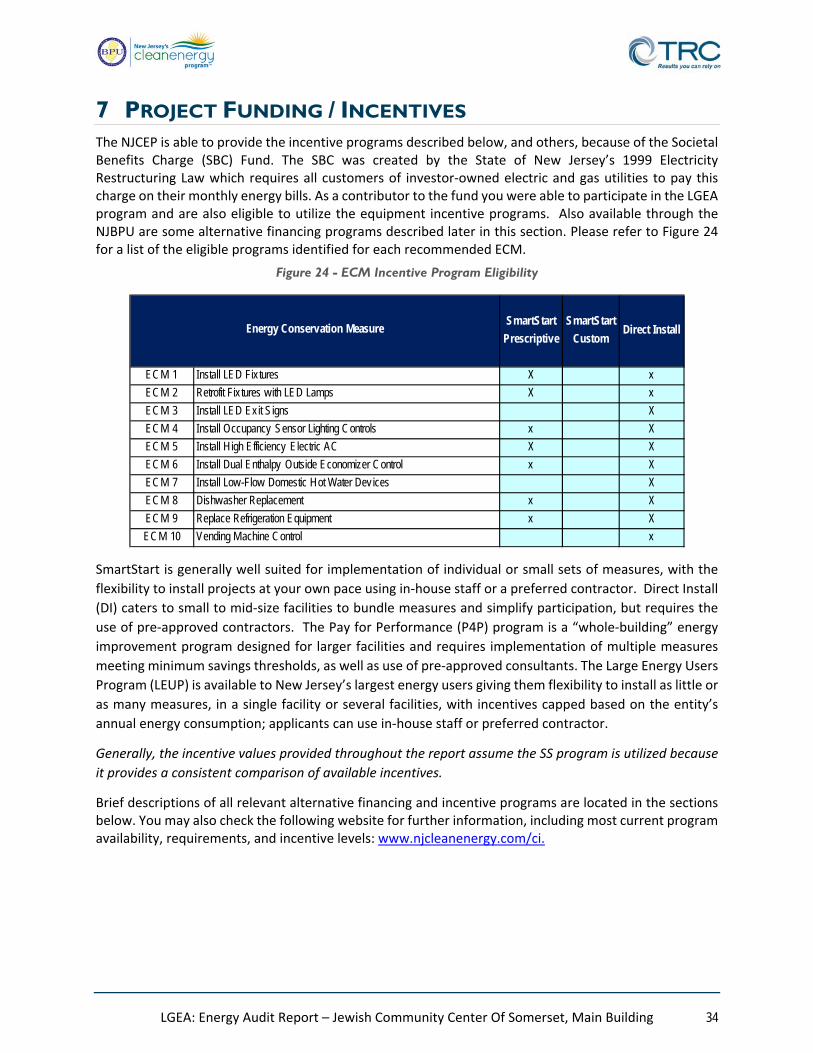
LGEA: Energy Audit Report – Jewish Community Center Of Somerset, Main Building 34
7 PROJECT FUNDING / INCENTIVES The NJCEP is able to provide the incentive programs described below, and others, because of the Societal Benefits Charge (SBC) Fund. The SBC was created by the State of New Jersey’s 1999 Electricity Restructuring Law which requires all customers of investor‐owned electric and gas utilities to pay this charge on their monthly energy bills. As a contributor to the fund you were able to participate in the LGEA program and are also eligible to utilize the equipment incentive programs. Also available through the NJBPU are some alternative financing programs described later in this section. Please refer to Figure 24 for a list of the eligible programs identified for each recommended ECM.
Figure 24 - ECM Incentive Program Eligibility
SmartStart is generally well suited for implementation of individual or small sets of measures, with the
flexibility to install projects at your own pace using in‐house staff or a preferred contractor. Direct Install
(DI) caters to small to mid‐size facilities to bundle measures and simplify participation, but requires the
use of pre‐approved contractors. The Pay for Performance (P4P) program is a “whole‐building” energy
improvement program designed for larger facilities and requires implementation of multiple measures
meeting minimum savings thresholds, as well as use of pre‐approved consultants. The Large Energy Users
Program (LEUP) is available to New Jersey’s largest energy users giving them flexibility to install as little or
as many measures, in a single facility or several facilities, with incentives capped based on the entity’s
annual energy consumption; applicants can use in‐house staff or preferred contractor.
Generally, the incentive values provided throughout the report assume the SS program is utilized because
it provides a consistent comparison of available incentives.
Brief descriptions of all relevant alternative financing and incentive programs are located in the sections below. You may also check the following website for further information, including most current program availability, requirements, and incentive levels: www.njcleanenergy.com/ci.
SmartStart
Prescriptive
SmartStart
CustomDirect Install
ECM 1 Install LED Fix tures X x
ECM 2 Retrofit Fix tures with LED Lamps X x
ECM 3 Install LED Exit Signs X
ECM 4 Install Occupancy Sensor Lighting Controls x X
ECM 5 Install High Efficiency Electric AC X X
ECM 6 Install Dual Enthalpy Outside Economizer Control x X
ECM 7 Install Low-Flow Domestic Hot Water Devices X
ECM 8 Dishwasher Replacement x X
ECM 9 Replace Refrigeration Equipment x X
ECM 10 Vending Machine Control x
Energy Conservation Measure

LGEA: Energy Audit Report – Jewish Community Center Of Somerset, Main Building 35
7.1 SmartStart
SmartStart is generally well‐suited for implementation of individual measures or small group of measures. It provides flexibility to install measures at your own pace using in‐house staff or a preferred contractor. SmartStart offers incentives for installing prescriptive and custom energy efficiency measures at your facility. Routinely the program adds, removes or modifies incentives from year to year for various energy efficiency equipment based on market trends and new technologies.
Equipment with Prescriptive Incentives Currently Available:
Electric Chillers Electric Unitary HVAC Gas Cooling Gas Heating Gas Water Heating Ground Source Heat Pumps Lighting
Lighting Controls Refrigeration Doors Refrigeration Controls Refrigerator/Freezer Motors Food Service Equipment Variable Frequency Drives
Most equipment sizes and types are served by this program. This program provides an effective mechanism for securing incentives for energy efficiency measures installed individually or as part of a package of energy upgrades.
Incentives
The SmartStart prescriptive incentive program provides fixed incentives for specific energy efficiency measures, whereas the custom SmartStart program provides incentives for more unique or specialized technologies or systems that are not addressed through prescriptive incentive offerings for specific devices.
Since your facility is an existing building, only the retrofit incentives have been applied in this report. Custom measure incentives are calculated at $0.16/kWh and $1.60/therm based on estimated annual savings, capped at 50% of the total installed incremental project cost, or a project cost buy down to a one year payback (whichever is less. Program incentives are capped at $500,000 per electric account and $500,000 per natural gas account, per fiscal year.
How to Participate
To participate in the SmartStart program you will need to submit an application for the specific equipment to be installed. Many applications are designed as rebates, although others require application approval prior to installation. Applicants may work with a contractor of their choosing and can also utilize internal personnel, which provides added flexibility to the program. Using internal personnel also helps improve the economics of the ECM by reducing the labor cost that is included in the tables in this report.
Detailed program descriptions, instructions for applying and applications can be found at: www.njcleanenergy.com/SSB.

LGEA: Energy Audit Report – Jewish Community Center Of Somerset, Main Building 36
7.2 Direct Install
Direct Install (DI) is a turnkey program available to existing small to mid‐sized facilities with a peak electric demand that did not exceed 200 kW in any of the preceding 12 months. You will work directly with a pre‐approved contractor who will perform a free energy assessment at your facility, identify specific eligible measures, and install those measures. Energy efficiency measures may include lighting and lighting controls, refrigeration, HVAC, motors, variable speed drives and controls.
Incentives
The program pays up to 70% of the total installed cost of eligible measures, up to $125,000 per project. Direct Install participants will also be held to a fiscal year cap of $250,000 per entity.
How to Participate
To participate in the DI program you will need to contact the participating contractor assigned to the county where your facility is located; a complete list is provided on the DI website identified below. The contractor will be paid the program incentive directly which will pass on to you in the form of reduced material and implementation costs. This means up to 70% of eligible costs are covered by the program, subject to program caps mentioned above, and the remaining 30% of the cost is your responsibility to the contractor.
Since DI offers a free assessment, LGEA applicants that do not meet the audit program eligibility requirements, but do meet the DI requirements, may be moved directly into this program.
Detailed program descriptions and applications can be found at: www.njcleanenergy.com/DI
LGEA: Energy Audit Report – Jewish Community Center Of Somerset, Main Building 37
8 ENERGY PURCHASING AND PROCUREMENT STRATEGIES
8.1 Retail Electric Supply Options
In 1999, New Jersey State Legislature passed the Electric Discount & Energy Competition Act (EDECA) to restructure the electric power industry in New Jersey. This law deregulated the retail electric markets, allowing all consumers to shop for service from competitive electric suppliers. The intent was to create a more competitive market for electric power supply in New Jersey. As a result, utilities were allowed to charge Cost of Service and customers were given the ability to choose a third party (i.e. non‐utility) energy supplier.
Energy deregulation in New Jersey has increased energy buyers’ options by separating the function of electricity distribution from that of electricity supply. So, though you may choose a different company from which to buy your electric power, responsibility for your facility’s interconnection to the grid and repair to local power distribution will still reside with the traditional utility company serving your region.
If your facility is not purchasing electricity from a third party supplier, consider shopping for a reduced rate from third party electric suppliers. If your facility is purchasing electricity from a third party supplier, review and compare prices at the end of the current contract or every couple years.
A list of third party electric suppliers, who are licensed by the state to provide service in New Jersey, can be found online at: www.state.nj.us/bpu/commercial/shopping.html.
8.2 Retail Natural Gas Supply Options
The natural gas market in New Jersey has also been deregulated. Most customers that remain with the utility for natural gas service pay rates that are market‐based and that fluctuate on a monthly basis. The utility provides basic gas supply service to customers who choose not to buy from a Third Party Supplier for natural gas commodity.
A customer’s decision about whether to buy natural gas from a retail supplier is typically dependent upon whether a customer seeks budget certainty and/or longer‐term rate stability. Customers can secure longer‐term fixed prices by signing up for service through a third party retail natural gas supplier. Many larger natural gas customers may seek the assistance of a professional consultant to assist in their procurement process.
If your facility is not purchasing natural gas from a third party supplier, consider shopping for a reduced rate from third party natural gas suppliers. If your facility is purchasing natural gas from a third party supplier, review and compare prices at the end of the current contract or every couple years.
A list of third party natural gas suppliers, who are licensed by the state to provide service in New Jersey, can be found online at: www.state.nj.us/bpu/commercial/shopping.html.
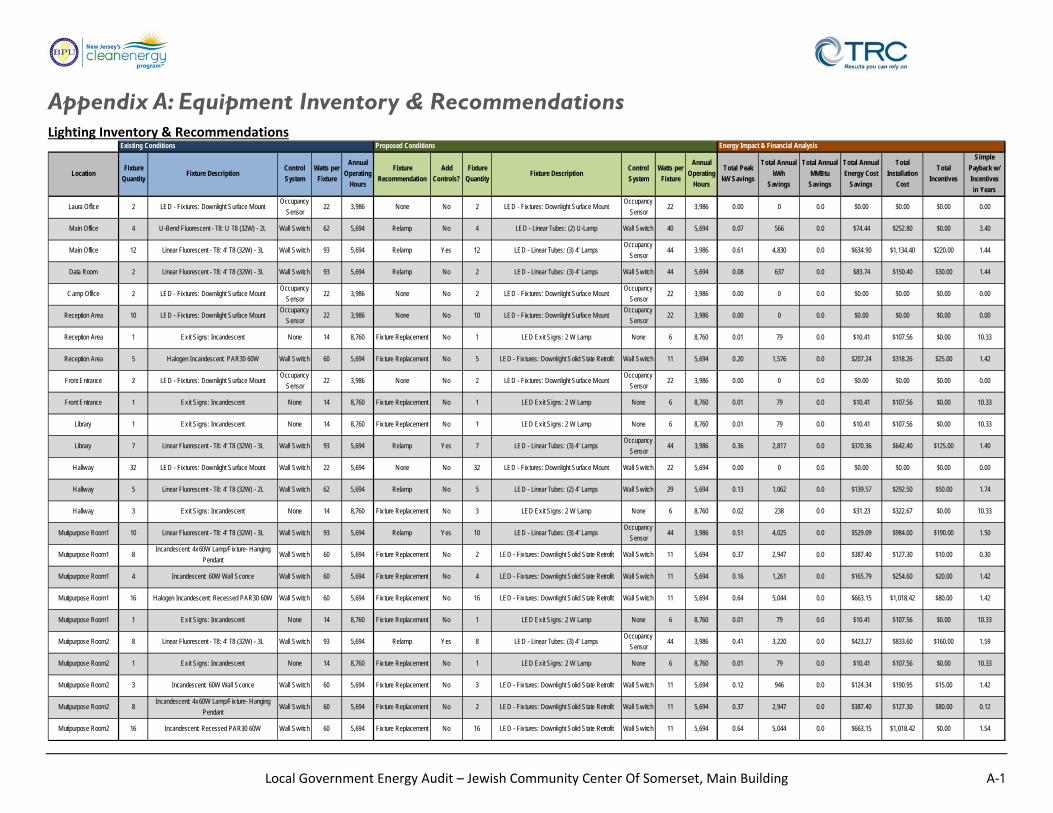
Local Government Energy Audit – Jewish Community Center Of Somerset, Main Building A‐1
Appendix A: Equipment Inventory & Recommendations Lighting Inventory & Recommendations
LocationFixture
QuantityFixture Description
Control
System
Watts per
Fixture
Annual
Operating
Hours
Fixture
Recommendation
Add
Controls?
Fixture
QuantityFixture Description
Control
System
Watts per
Fixture
Annual
Operating
Hours
Total Peak
kW Savings
Total Annual
kWh
Savings
Total Annual
MMBtu
Savings
Total Annual
Energy Cost
Savings
Total
Installation
Cost
Total
Incentives
Simple
Payback w/
Incentives
in Years
Laura Office 2 LED - Fixtures: Downlight Surface MountOccupancy
Sensor22 3,986 None No 2 LED - Fix tures: Downlight Surface Mount
Occupancy
Sensor22 3,986 0.00 0 0.0 $0.00 $0.00 $0.00 0.00
Main Office 4 U-Bend Fluorescent - T8: U T8 (32W) - 2L Wall Switch 62 5,694 Relamp No 4 LED - Linear Tubes: (2) U-Lamp Wall Switch 40 5,694 0.07 566 0.0 $74.44 $252.80 $0.00 3.40
Main Office 12 Linear Fluorescent - T8: 4' T8 (32W) - 3L Wall Switch 93 5,694 Relamp Yes 12 LED - Linear Tubes: (3) 4' LampsOccupancy
Sensor44 3,986 0.61 4,830 0.0 $634.90 $1,134.40 $220.00 1.44
Data Room 2 Linear Fluorescent - T8: 4' T8 (32W) - 3L Wall Switch 93 5,694 Relamp No 2 LED - Linear Tubes: (3) 4' Lamps Wall Switch 44 5,694 0.08 637 0.0 $83.74 $150.40 $30.00 1.44
Camp Office 2 LED - Fixtures: Downlight Surface MountOccupancy
Sensor22 3,986 None No 2 LED - Fix tures: Downlight Surface Mount
Occupancy
Sensor22 3,986 0.00 0 0.0 $0.00 $0.00 $0.00 0.00
Reception Area 10 LED - Fixtures: Downlight Surface MountOccupancy
Sensor22 3,986 None No 10 LED - Fix tures: Downlight Surface Mount
Occupancy
Sensor22 3,986 0.00 0 0.0 $0.00 $0.00 $0.00 0.00
Reception Area 1 Exit Signs: Incandescent None 14 8,760 Fix ture Replacement No 1 LED Exit Signs: 2 W Lamp None 6 8,760 0.01 79 0.0 $10.41 $107.56 $0.00 10.33
Reception Area 5 Halogen Incandescent: PAR30 60W Wall Switch 60 5,694 Fix ture Replacement No 5 LED - Fix tures: Downlight Solid State Retrofit Wall Switch 11 5,694 0.20 1,576 0.0 $207.24 $318.26 $25.00 1.42
Front Entrance 2 LED - Fixtures: Downlight Surface MountOccupancy
Sensor22 3,986 None No 2 LED - Fix tures: Downlight Surface Mount
Occupancy
Sensor22 3,986 0.00 0 0.0 $0.00 $0.00 $0.00 0.00
Front Entrance 1 Exit Signs: Incandescent None 14 8,760 Fix ture Replacement No 1 LED Exit Signs: 2 W Lamp None 6 8,760 0.01 79 0.0 $10.41 $107.56 $0.00 10.33
Library 1 Exit Signs: Incandescent None 14 8,760 Fix ture Replacement No 1 LED Exit Signs: 2 W Lamp None 6 8,760 0.01 79 0.0 $10.41 $107.56 $0.00 10.33
Library 7 Linear Fluorescent - T8: 4' T8 (32W) - 3L Wall Switch 93 5,694 Relamp Yes 7 LED - Linear Tubes: (3) 4' LampsOccupancy
Sensor44 3,986 0.36 2,817 0.0 $370.36 $642.40 $125.00 1.40
Hallway 32 LED - Fixtures: Downlight Surface Mount Wall Switch 22 5,694 None No 32 LED - Fix tures: Downlight Surface Mount Wall Switch 22 5,694 0.00 0 0.0 $0.00 $0.00 $0.00 0.00
Hallway 5 Linear Fluorescent - T8: 4' T8 (32W) - 2L Wall Switch 62 5,694 Relamp No 5 LED - Linear Tubes: (2) 4' Lamps Wall Switch 29 5,694 0.13 1,062 0.0 $139.57 $292.50 $50.00 1.74
Hallway 3 Exit Signs: Incandescent None 14 8,760 Fix ture Replacement No 3 LED Exit Signs: 2 W Lamp None 6 8,760 0.02 238 0.0 $31.23 $322.67 $0.00 10.33
Mutipurpose Room1 10 Linear Fluorescent - T8: 4' T8 (32W) - 3L Wall Switch 93 5,694 Relamp Yes 10 LED - Linear Tubes: (3) 4' LampsOccupancy
Sensor44 3,986 0.51 4,025 0.0 $529.09 $984.00 $190.00 1.50
Mutipurpose Room1 8Incandescent: 4x60W Lamp/Fixture- Hanging
PendantWall Switch 60 5,694 Fix ture Replacement No 2 LED - Fix tures: Downlight Solid State Retrofit Wall Switch 11 5,694 0.37 2,947 0.0 $387.40 $127.30 $10.00 0.30
Mutipurpose Room1 4 Incandescent: 60W Wall Sconce Wall Switch 60 5,694 Fix ture Replacement No 4 LED - Fix tures: Downlight Solid State Retrofit Wall Switch 11 5,694 0.16 1,261 0.0 $165.79 $254.60 $20.00 1.42
Mutipurpose Room1 16 Halogen Incandescent: Recessed PAR30 60W Wall Switch 60 5,694 Fix ture Replacement No 16 LED - Fix tures: Downlight Solid State Retrofit Wall Switch 11 5,694 0.64 5,044 0.0 $663.15 $1,018.42 $80.00 1.42
Mutipurpose Room1 1 Exit Signs: Incandescent None 14 8,760 Fix ture Replacement No 1 LED Exit Signs: 2 W Lamp None 6 8,760 0.01 79 0.0 $10.41 $107.56 $0.00 10.33
Mutipurpose Room2 8 Linear Fluorescent - T8: 4' T8 (32W) - 3L Wall Switch 93 5,694 Relamp Yes 8 LED - Linear Tubes: (3) 4' LampsOccupancy
Sensor44 3,986 0.41 3,220 0.0 $423.27 $833.60 $160.00 1.59
Mutipurpose Room2 1 Exit Signs: Incandescent None 14 8,760 Fix ture Replacement No 1 LED Exit Signs: 2 W Lamp None 6 8,760 0.01 79 0.0 $10.41 $107.56 $0.00 10.33
Mutipurpose Room2 3 Incandescent: 60W Wall Sconce Wall Switch 60 5,694 Fix ture Replacement No 3 LED - Fix tures: Downlight Solid State Retrofit Wall Switch 11 5,694 0.12 946 0.0 $124.34 $190.95 $15.00 1.42
Mutipurpose Room2 8Incandescent: 4x60W Lamp/Fixture- Hanging
PendantWall Switch 60 5,694 Fix ture Replacement No 2 LED - Fix tures: Downlight Solid State Retrofit Wall Switch 11 5,694 0.37 2,947 0.0 $387.40 $127.30 $80.00 0.12
Mutipurpose Room2 16 Incandescent: Recessed PAR30 60W Wall Switch 60 5,694 Fix ture Replacement No 16 LED - Fix tures: Downlight Solid State Retrofit Wall Switch 11 5,694 0.64 5,044 0.0 $663.15 $1,018.42 $0.00 1.54
Existing Conditions Proposed Conditions Energy Impact & Financial Analysis
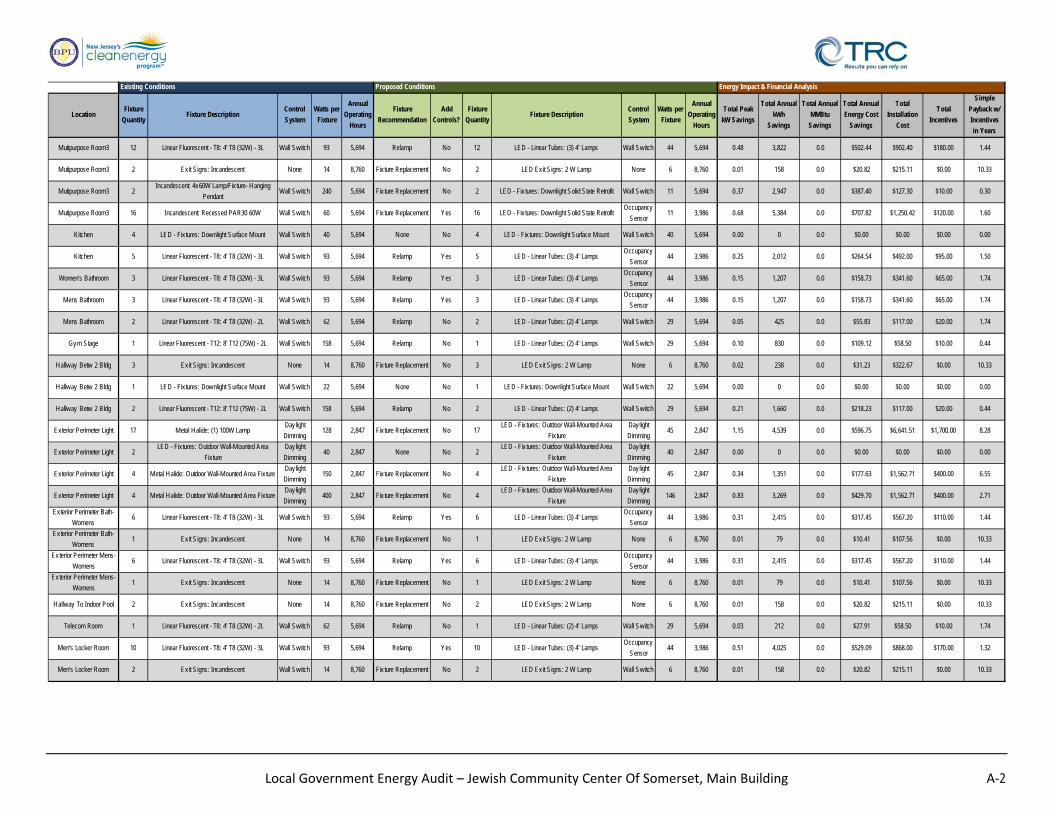
Local Government Energy Audit – Jewish Community Center Of Somerset, Main Building A‐2
LocationFixture
QuantityFixture Description
Control
System
Watts per
Fixture
Annual
Operating
Hours
Fixture
Recommendation
Add
Controls?
Fixture
QuantityFixture Description
Control
System
Watts per
Fixture
Annual
Operating
Hours
Total Peak
kW Savings
Total Annual
kWh
Savings
Total Annual
MMBtu
Savings
Total Annual
Energy Cost
Savings
Total
Installation
Cost
Total
Incentives
Simple
Payback w/
Incentives
in Years
Mutipurpose Room3 12 Linear Fluorescent - T8: 4' T8 (32W) - 3L Wall Switch 93 5,694 Relamp No 12 LED - Linear Tubes: (3) 4' Lamps Wall Switch 44 5,694 0.48 3,822 0.0 $502.44 $902.40 $180.00 1.44
Mutipurpose Room3 2 Exit Signs: Incandescent None 14 8,760 Fix ture Replacement No 2 LED Exit Signs: 2 W Lamp None 6 8,760 0.01 158 0.0 $20.82 $215.11 $0.00 10.33
Mutipurpose Room3 2Incandescent: 4x60W Lamp/Fixture- Hanging
PendantWall Switch 240 5,694 Fix ture Replacement No 2 LED - Fix tures: Downlight Solid State Retrofit Wall Switch 11 5,694 0.37 2,947 0.0 $387.40 $127.30 $10.00 0.30
Mutipurpose Room3 16 Incandescent: Recessed PAR30 60W Wall Switch 60 5,694 Fix ture Replacement Yes 16 LED - Fix tures: Downlight Solid State RetrofitOccupancy
Sensor11 3,986 0.68 5,384 0.0 $707.82 $1,250.42 $120.00 1.60
Kitchen 4 LED - Fixtures: Downlight Surface Mount Wall Switch 40 5,694 None No 4 LED - Fix tures: Downlight Surface Mount Wall Switch 40 5,694 0.00 0 0.0 $0.00 $0.00 $0.00 0.00
Kitchen 5 Linear Fluorescent - T8: 4' T8 (32W) - 3L Wall Switch 93 5,694 Relamp Yes 5 LED - Linear Tubes: (3) 4' LampsOccupancy
Sensor44 3,986 0.25 2,012 0.0 $264.54 $492.00 $95.00 1.50
Women's Bathroom 3 Linear Fluorescent - T8: 4' T8 (32W) - 3L Wall Switch 93 5,694 Relamp Yes 3 LED - Linear Tubes: (3) 4' LampsOccupancy
Sensor44 3,986 0.15 1,207 0.0 $158.73 $341.60 $65.00 1.74
Mens Bathroom 3 Linear Fluorescent - T8: 4' T8 (32W) - 3L Wall Switch 93 5,694 Relamp Yes 3 LED - Linear Tubes: (3) 4' LampsOccupancy
Sensor44 3,986 0.15 1,207 0.0 $158.73 $341.60 $65.00 1.74
Mens Bathroom 2 Linear Fluorescent - T8: 4' T8 (32W) - 2L Wall Switch 62 5,694 Relamp No 2 LED - Linear Tubes: (2) 4' Lamps Wall Switch 29 5,694 0.05 425 0.0 $55.83 $117.00 $20.00 1.74
Gym Stage 1 Linear Fluorescent - T12: 8' T12 (75W) - 2L Wall Switch 158 5,694 Relamp No 1 LED - Linear Tubes: (2) 4' Lamps Wall Switch 29 5,694 0.10 830 0.0 $109.12 $58.50 $10.00 0.44
Hallway Betw 2 Bldg 3 Exit Signs: Incandescent None 14 8,760 Fix ture Replacement No 3 LED Exit Signs: 2 W Lamp None 6 8,760 0.02 238 0.0 $31.23 $322.67 $0.00 10.33
Hallway Betw 2 Bldg 1 LED - Fixtures: Downlight Surface Mount Wall Switch 22 5,694 None No 1 LED - Fix tures: Downlight Surface Mount Wall Switch 22 5,694 0.00 0 0.0 $0.00 $0.00 $0.00 0.00
Hallway Betw 2 Bldg 2 Linear Fluorescent - T12: 8' T12 (75W) - 2L Wall Switch 158 5,694 Relamp No 2 LED - Linear Tubes: (2) 4' Lamps Wall Switch 29 5,694 0.21 1,660 0.0 $218.23 $117.00 $20.00 0.44
Exterior Perimeter Light 17 Metal Halide: (1) 100W LampDay light
Dimming128 2,847 Fix ture Replacement No 17
LED - Fix tures: Outdoor Wall-Mounted Area
Fixture
Daylight
Dimming45 2,847 1.15 4,539 0.0 $596.75 $6,641.51 $1,700.00 8.28
Exterior Perimeter Light 2LED - Fixtures: Outdoor Wall-Mounted Area
Fix ture
Day light
Dimming40 2,847 None No 2
LED - Fix tures: Outdoor Wall-Mounted Area
Fixture
Daylight
Dimming40 2,847 0.00 0 0.0 $0.00 $0.00 $0.00 0.00
Exterior Perimeter Light 4 Metal Halide: Outdoor Wall-Mounted Area Fix tureDay light
Dimming150 2,847 Fix ture Replacement No 4
LED - Fix tures: Outdoor Wall-Mounted Area
Fixture
Daylight
Dimming45 2,847 0.34 1,351 0.0 $177.63 $1,562.71 $400.00 6.55
Exterior Perimeter Light 4 Metal Halide: Outdoor Wall-Mounted Area Fix tureDay light
Dimming400 2,847 Fix ture Replacement No 4
LED - Fix tures: Outdoor Wall-Mounted Area
Fixture
Daylight
Dimming146 2,847 0.83 3,269 0.0 $429.70 $1,562.71 $400.00 2.71
Exterior Perimeter Bath-
Womens6 Linear Fluorescent - T8: 4' T8 (32W) - 3L Wall Switch 93 5,694 Relamp Yes 6 LED - Linear Tubes: (3) 4' Lamps
Occupancy
Sensor44 3,986 0.31 2,415 0.0 $317.45 $567.20 $110.00 1.44
Exterior Perimeter Bath-
Womens1 Exit Signs: Incandescent None 14 8,760 Fix ture Replacement No 1 LED Exit Signs: 2 W Lamp None 6 8,760 0.01 79 0.0 $10.41 $107.56 $0.00 10.33
Exterior Perimeter Mens-
Womens6 Linear Fluorescent - T8: 4' T8 (32W) - 3L Wall Switch 93 5,694 Relamp Yes 6 LED - Linear Tubes: (3) 4' Lamps
Occupancy
Sensor44 3,986 0.31 2,415 0.0 $317.45 $567.20 $110.00 1.44
Exterior Perimeter Mens-
Womens1 Exit Signs: Incandescent None 14 8,760 Fix ture Replacement No 1 LED Exit Signs: 2 W Lamp None 6 8,760 0.01 79 0.0 $10.41 $107.56 $0.00 10.33
Hallway To Indoor Pool 2 Exit Signs: Incandescent None 14 8,760 Fix ture Replacement No 2 LED Exit Signs: 2 W Lamp None 6 8,760 0.01 158 0.0 $20.82 $215.11 $0.00 10.33
Telecom Room 1 Linear Fluorescent - T8: 4' T8 (32W) - 2L Wall Switch 62 5,694 Relamp No 1 LED - Linear Tubes: (2) 4' Lamps Wall Switch 29 5,694 0.03 212 0.0 $27.91 $58.50 $10.00 1.74
Men's Locker Room 10 Linear Fluorescent - T8: 4' T8 (32W) - 3L Wall Switch 93 5,694 Relamp Yes 10 LED - Linear Tubes: (3) 4' LampsOccupancy
Sensor44 3,986 0.51 4,025 0.0 $529.09 $868.00 $170.00 1.32
Men's Locker Room 2 Exit Signs: Incandescent Wall Switch 14 8,760 Fix ture Replacement No 2 LED Exit Signs: 2 W Lamp Wall Switch 6 8,760 0.01 158 0.0 $20.82 $215.11 $0.00 10.33
Existing Conditions Proposed Conditions Energy Impact & Financial Analysis

Local Government Energy Audit – Jewish Community Center Of Somerset, Main Building A‐3
LocationFixture
QuantityFixture Description
Control
System
Watts per
Fixture
Annual
Operating
Hours
Fixture
Recommendation
Add
Controls?
Fixture
QuantityFixture Description
Control
System
Watts per
Fixture
Annual
Operating
Hours
Total Peak
kW Savings
Total Annual
kWh
Savings
Total Annual
MMBtu
Savings
Total Annual
Energy Cost
Savings
Total
Installation
Cost
Total
Incentives
Simple
Payback w/
Incentives
in Years
Men's Locker Room 1 Linear Fluorescent - T5: 2' T5 (14W) - 2L Wall Switch 20 5,694 Relamp No 1 LED - Linear Tubes: (2) 2' Lamps Wall Switch 17 5,694 0.00 19 0.0 $2.54 $48.20 $10.00 15.05
Men's Locker Room 1Halogen Incandescent: Ceiling Mounted CFL
26WWall Switch 26 5,694 Fix ture Replacement No 1 LED - Fix tures: Downlight Solid State Retrofit Wall Switch 13 5,694 0.01 84 0.0 $11.00 $63.65 $5.00 5.33
Director Office 2 Linear Fluorescent - T8: 4' T8 (32W) - 3L Wall Switch 93 5,694 Relamp Yes 2 LED - Linear Tubes: (3) 4' LampsOccupancy
Sensor44 3,986 0.10 805 0.0 $105.82 $266.40 $50.00 2.05
Fitness Room 18 Linear Fluorescent - T8: 4' T8 (32W) - 3L Wall Switch 93 5,694 Relamp No 18 LED - Linear Tubes: (3) 4' Lamps Wall Switch 44 5,694 0.72 5,733 0.0 $753.66 $1,353.60 $270.00 1.44
Fitness Room 2 Exit Signs: Incandescent None 14 8,760 Fix ture Replacement No 2 LED Exit Signs: 2 W Lamp None 6 8,760 0.01 158 0.0 $20.82 $215.11 $0.00 10.33
Mechanical Room 11 Linear Fluorescent - T8: 4' T8 (32W) - 2L Wall Switch 62 5,694 Relamp No 11 LED - Linear Tubes: (2) 4' Lamps Wall Switch 29 5,694 0.30 2,336 0.0 $307.05 $643.50 $110.00 1.74
Spin Studio 20 Linear Fluorescent - T8: 4' T8 (32W) - 3L Wall Switch 93 5,694 Relamp Yes 20 LED - Linear Tubes: (3) 4' LampsOccupancy
Sensor44 3,986 1.02 8,049 0.0 $1,058.17 $1,620.00 $320.00 1.23
Spin Studio 2 Exit Signs: Incandescent Wall Switch 14 8,760 Fix ture Replacement No 2 LED Exit Signs: 2 W Lamp Wall Switch 6 8,760 0.01 158 0.0 $20.82 $215.11 $0.00 10.33
Closet 1 Linear Fluorescent - T8: 4' T8 (32W) - 3L Wall Switch 93 5,694 Relamp No 1 LED - Linear Tubes: (3) 4' Lamps Wall Switch 44 5,694 0.04 318 0.0 $41.87 $75.20 $15.00 1.44
Gymnasium 24 Linear Fluorescent - T8: 4' T8 (32W) - 6L Wall Switch 176 5,694 Relamp No 24 LED - Linear Tubes: (6) 4' Lamps Wall Switch 87 5,694 1.74 13,743 0.0 $1,806.76 $3,221.36 $0.00 1.78
Gymnasium 3 Exit Signs: Incandescent None 14 8,760 Fix ture Replacement No 3 LED Exit Signs: 2 W Lamp None 6 8,760 0.02 238 0.0 $31.23 $322.67 $0.00 10.33
Gym Spin Studio 1 Linear Fluorescent - T8: 4' T8 (32W) - 3L Wall Switch 93 5,694 Relamp No 1 LED - Linear Tubes: (3) 4' Lamps Wall Switch 44 5,694 0.04 318 0.0 $41.87 $75.20 $15.00 1.44
Snack Bar 4 Linear Fluorescent - T8: 4' T8 (32W) - 3L Wall Switch 93 5,694 Relamp Yes 4 LED - Linear Tubes: (3) 4' LampsOccupancy
Sensor44 3,986 0.20 1,610 0.0 $211.63 $416.80 $80.00 1.59
Snack Bar 1 Linear Fluorescent - T8: 4' T8 (32W) - 2L Wall Switch 62 5,694 Relamp No 1 LED - Linear Tubes: (2) 4' Lamps Wall Switch 29 5,694 0.03 212 0.0 $27.91 $58.50 $10.00 1.74
Storage Room2 2 Linear Fluorescent - T8: 4' T8 (32W) - 2L Wall Switch 62 5,694 Relamp No 2 LED - Linear Tubes: (2) 4' Lamps Wall Switch 29 5,694 0.05 425 0.0 $55.83 $117.00 $20.00 1.74
Storage Room1 2 Linear Fluorescent - T8: 4' T8 (32W) - 2L Wall Switch 62 5,694 Relamp No 2 LED - Linear Tubes: (2) 4' Lamps Wall Switch 29 5,694 0.05 425 0.0 $55.83 $117.00 $20.00 1.74
Indoor Pool 8 Metal Halide: (1) 400W Lamp Hanging Pendant Wall Switch 400 5,694 Fix ture Replacement No 8 LED - Fix tures: Parking Garage Fixture Wall Switch 146 5,694 1.65 13,074 0.0 $1,718.79 $11,289.60 $800.00 6.10
Indoor Pool 3 Exit Signs: Incandescent None 14 8,760 Fix ture Replacement No 3 LED Exit Signs: 2 W Lamp None 6 8,760 0.02 238 0.0 $31.23 $322.67 $0.00 10.33
Staff Room 1 Linear Fluorescent - T8: 4' T8 (32W) - 3L Wall Switch 93 5,694 Relamp No 1 LED - Linear Tubes: (3) 4' Lamps Wall Switch 44 5,694 0.04 318 0.0 $41.87 $75.20 $15.00 1.44
Indoor Pool Ext. Light 3 Metal Halide: (1) 150W Lamp Wall PackDay light
Dimming150 2,847 Fix ture Replacement No 3
LED - Fix tures: Outdoor Wall-Mounted Area
Fixture
Daylight
Dimming45 2,847 0.26 1,013 0.0 $133.22 $1,172.03 $300.00 6.55
Pump Room 2 Linear Fluorescent - T8: 4' T8 (32W) - 2L Wall Switch 62 5,694 Relamp No 2 LED - Linear Tubes: (2) 4' Lamps Wall Switch 29 5,694 0.05 425 0.0 $55.83 $117.00 $20.00 1.74
Roof Top Light 4 Incandescent: Pole Lighting 60WDaylight
Dimming60 2,847 Fix ture Replacement No 4 LED - Fix tures: Downlight Solid State Retrofit
Daylight
Dimming11 2,847 0.16 631 0.0 $82.89 $254.60 $20.00 2.83
Existing Conditions Proposed Conditions Energy Impact & Financial Analysis
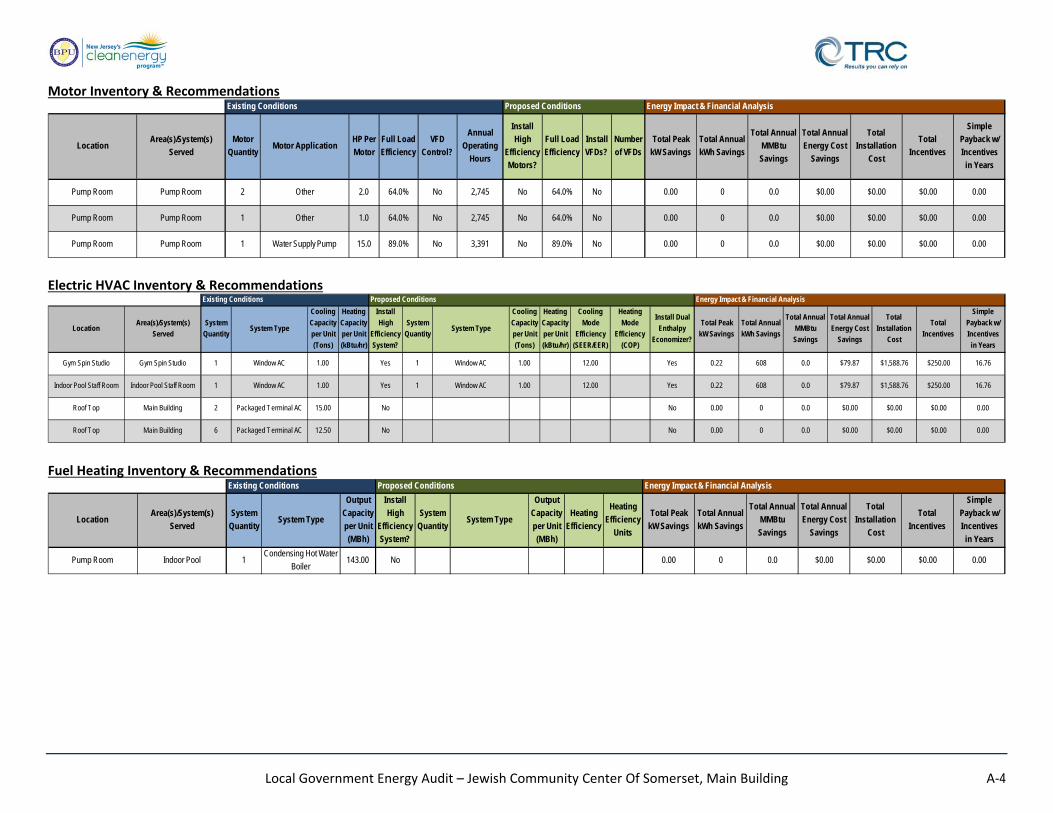
Local Government Energy Audit – Jewish Community Center Of Somerset, Main Building A‐4
Motor Inventory & Recommendations
Electric HVAC Inventory & Recommendations
Fuel Heating Inventory & Recommendations
LocationArea(s)/System(s)
Served
Motor
QuantityMotor Application
HP Per
Motor
Full Load
Efficiency
VFD
Control?
Annual
Operating
Hours
Install
High
Efficiency
Motors?
Full Load
Efficiency
Install
VFDs?
Number
of VFDs
Total Peak
kW Savings
Total Annual
kWh Savings
Total Annual
MMBtu
Savings
Total Annual
Energy Cost
Savings
Total
Installation
Cost
Total
Incentives
Simple
Payback w/
Incentives
in Years
Pump Room Pump Room 2 Other 2.0 64.0% No 2,745 No 64.0% No 0.00 0 0.0 $0.00 $0.00 $0.00 0.00
Pump Room Pump Room 1 Other 1.0 64.0% No 2,745 No 64.0% No 0.00 0 0.0 $0.00 $0.00 $0.00 0.00
Pump Room Pump Room 1 Water Supply Pump 15.0 89.0% No 3,391 No 89.0% No 0.00 0 0.0 $0.00 $0.00 $0.00 0.00
Existing Conditions Proposed Conditions Energy Impact & Financial Analysis
LocationArea(s)/System(s)
Served
System
QuantitySystem Type
Cooling
Capacity
per Unit
(Tons)
Heating
Capacity
per Unit
(kBtu/hr)
Install
High
Efficiency
System?
System
QuantitySystem Type
Cooling
Capacity
per Unit
(Tons)
Heating
Capacity
per Unit
(kBtu/hr)
Cooling
Mode
Efficiency
(SEER/EER)
Heating
Mode
Efficiency
(COP)
Install Dual
Enthalpy
Economizer?
Total Peak
kW Savings
Total Annual
kWh Savings
Total Annual
MMBtu
Savings
Total Annual
Energy Cost
Savings
Total
Installation
Cost
Total
Incentives
Simple
Payback w/
Incentives
in Years
Gym Spin Studio Gym Spin Studio 1 Window AC 1.00 Yes 1 Window AC 1.00 12.00 Yes 0.22 608 0.0 $79.87 $1,588.76 $250.00 16.76
Indoor Pool Staff Room Indoor Pool Staff Room 1 Window AC 1.00 Yes 1 Window AC 1.00 12.00 Yes 0.22 608 0.0 $79.87 $1,588.76 $250.00 16.76
Roof Top Main Building 2 Packaged Terminal AC 15.00 No No 0.00 0 0.0 $0.00 $0.00 $0.00 0.00
Roof Top Main Building 6 Packaged Terminal AC 12.50 No No 0.00 0 0.0 $0.00 $0.00 $0.00 0.00
Existing Conditions Proposed Conditions Energy Impact & Financial Analysis
LocationArea(s)/System(s)
Served
System
QuantitySystem Type
Output
Capacity
per Unit
(MBh)
Install
High
Efficiency
System?
System
QuantitySystem Type
Output
Capacity
per Unit
(MBh)
Heating
Efficiency
Heating
Efficiency
Units
Total Peak
kW Savings
Total Annual
kWh Savings
Total Annual
MMBtu
Savings
Total Annual
Energy Cost
Savings
Total
Installation
Cost
Total
Incentives
Simple
Payback w/
Incentives
in Years
Pump Room Indoor Pool 1Condensing Hot Water
Boiler143.00 No 0.00 0 0.0 $0.00 $0.00 $0.00 0.00
Existing Conditions Proposed Conditions Energy Impact & Financial Analysis
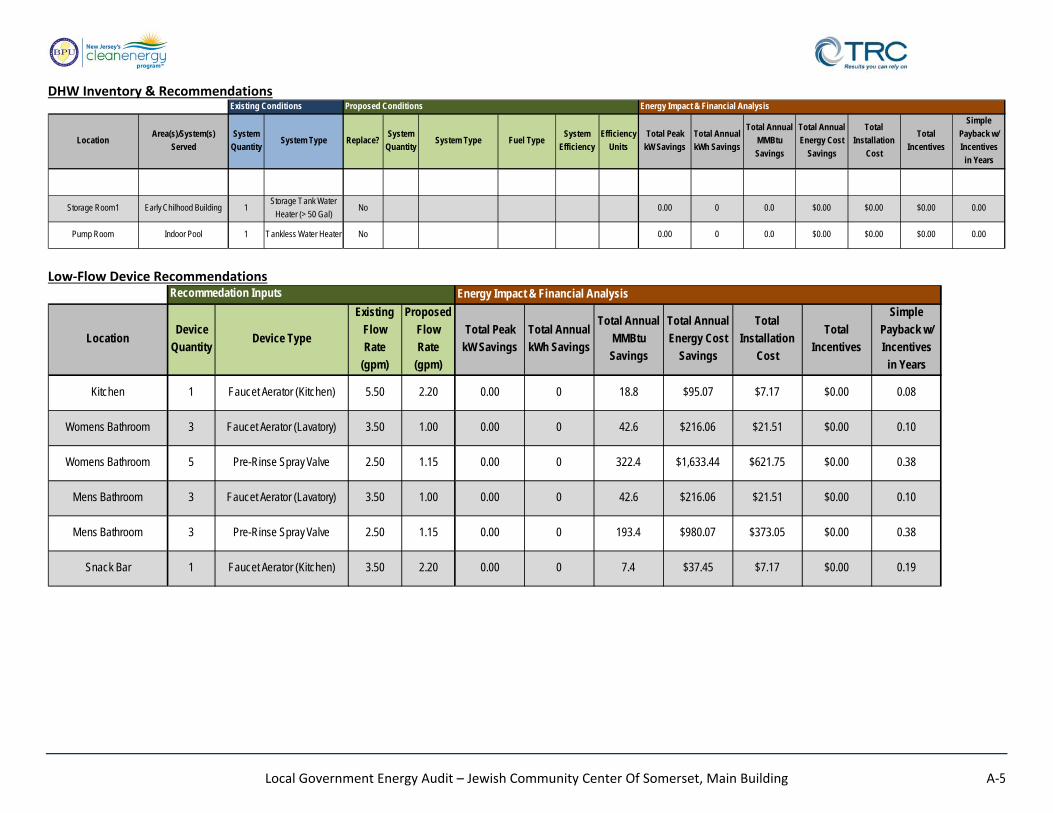
Local Government Energy Audit – Jewish Community Center Of Somerset, Main Building A‐5
DHW Inventory & Recommendations
Low‐Flow Device Recommendations
LocationArea(s)/System(s)
Served
System
QuantitySystem Type Replace?
System
QuantitySystem Type Fuel Type
System
Efficiency
Efficiency
Units
Total Peak
kW Savings
Total Annual
kWh Savings
Total Annual
MMBtu
Savings
Total Annual
Energy Cost
Savings
Total
Installation
Cost
Total
Incentives
Simple
Payback w/
Incentives
in Years
Storage Room1 Early Chilhood Building 1Storage Tank Water
Heater (> 50 Gal)No 0.00 0 0.0 $0.00 $0.00 $0.00 0.00
Pump Room Indoor Pool 1 Tankless Water Heater No 0.00 0 0.0 $0.00 $0.00 $0.00 0.00
Proposed Conditions Energy Impact & Financial AnalysisExisting Conditions
LocationDevice
QuantityDevice Type
Existing
Flow
Rate
(gpm)
Proposed
Flow
Rate
(gpm)
Total Peak
kW Savings
Total Annual
kWh Savings
Total Annual
MMBtu
Savings
Total Annual
Energy Cost
Savings
Total
Installation
Cost
Total
Incentives
Simple
Payback w/
Incentives
in Years
Kitchen 1 Faucet Aerator (Kitchen) 5.50 2.20 0.00 0 18.8 $95.07 $7.17 $0.00 0.08
Womens Bathroom 3 Faucet Aerator (Lavatory) 3.50 1.00 0.00 0 42.6 $216.06 $21.51 $0.00 0.10
Womens Bathroom 5 Pre-Rinse Spray Valve 2.50 1.15 0.00 0 322.4 $1,633.44 $621.75 $0.00 0.38
Mens Bathroom 3 Faucet Aerator (Lavatory) 3.50 1.00 0.00 0 42.6 $216.06 $21.51 $0.00 0.10
Mens Bathroom 3 Pre-Rinse Spray Valve 2.50 1.15 0.00 0 193.4 $980.07 $373.05 $0.00 0.38
Snack Bar 1 Faucet Aerator (Kitchen) 3.50 2.20 0.00 0 7.4 $37.45 $7.17 $0.00 0.19
Recommedation Inputs Energy Impact & Financial Analysis
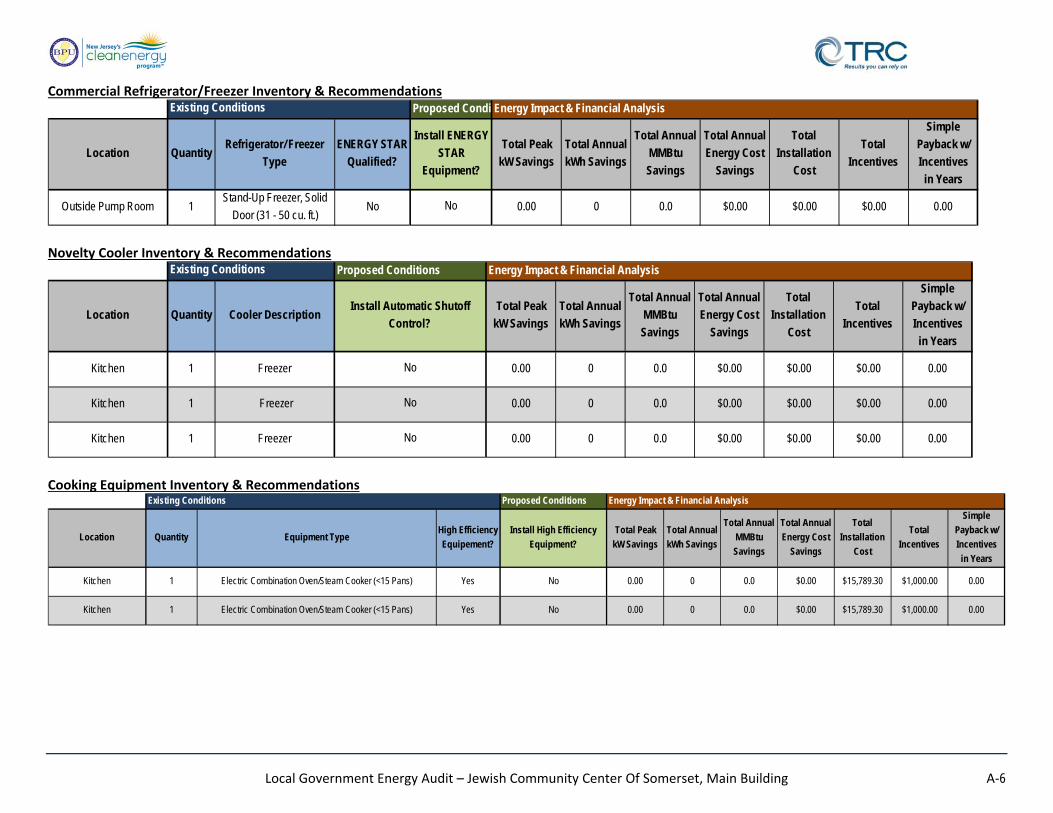
Local Government Energy Audit – Jewish Community Center Of Somerset, Main Building A‐6
Commercial Refrigerator/Freezer Inventory & Recommendations
Novelty Cooler Inventory & Recommendations
Cooking Equipment Inventory & Recommendations
Location QuantityRefrigerator/ Freezer
Type
ENERGY STAR
Qualified?
Total Peak
kW Savings
Total Annual
kWh Savings
Total Annual
MMBtu
Savings
Total Annual
Energy Cost
Savings
Total
Installation
Cost
Total
Incentives
Simple
Payback w/
Incentives
in Years
Outside Pump Room 1Stand-Up Freezer, Solid
Door (31 - 50 cu. ft.)No 0.00 0 0.0 $0.00 $0.00 $0.00 0.00
Existing Conditions Proposed Condi Energy Impact & Financial Analysis
Install ENERGY
STAR
Equipment?
No
Energy Impact & Financial Analysis
Location Quantity Cooler DescriptionTotal Peak
kW Savings
Total Annual
kWh Savings
Total Annual
MMBtu
Savings
Total Annual
Energy Cost
Savings
Total
Installation
Cost
Total
Incentives
Simple
Payback w/
Incentives
in Years
Kitchen 1 Freezer 0.00 0 0.0 $0.00 $0.00 $0.00 0.00
Kitchen 1 Freezer 0.00 0 0.0 $0.00 $0.00 $0.00 0.00
Kitchen 1 Freezer 0.00 0 0.0 $0.00 $0.00 $0.00 0.00
Existing Conditions Proposed Conditions
Install Automatic Shutoff
Control?
No
No
No
Existing Conditions Proposed Conditions
Location Quantity Equipment TypeHigh Efficiency
Equipement?
Install High Efficiency
Equipment?
Total Peak
kW Savings
Total Annual
kWh Savings
Total Annual
MMBtu
Savings
Total Annual
Energy Cost
Savings
Total
Installation
Cost
Total
Incentives
Simple
Payback w/
Incentives
in Years
Kitchen 1 Electric Combination Oven/Steam Cooker (<15 Pans) Yes No 0.00 0 0.0 $0.00 $15,789.30 $1,000.00 0.00
Kitchen 1 Electric Combination Oven/Steam Cooker (<15 Pans) Yes No 0.00 0 0.0 $0.00 $15,789.30 $1,000.00 0.00
Energy Impact & Financial Analysis
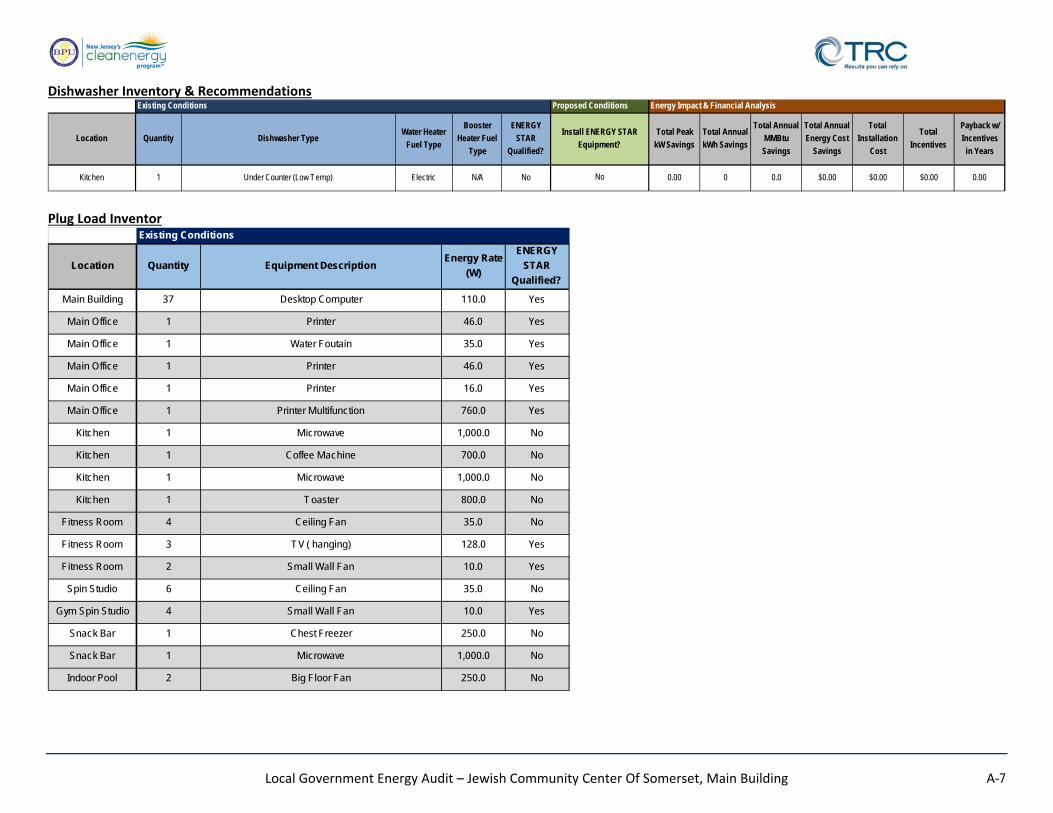
Local Government Energy Audit – Jewish Community Center Of Somerset, Main Building A‐7
Dishwasher Inventory & Recommendations
Plug Load Inventor
Energy Impact & Financial Analysis
Location Quantity Dishwasher TypeWater Heater
Fuel Type
Booster
Heater Fuel
Type
ENERGY
STAR
Qualified?
Total Peak
kW Savings
Total Annual
kWh Savings
Total Annual
MMBtu
Savings
Total Annual
Energy Cost
Savings
Total
Installation
Cost
Total
Incentives
Payback w/
Incentives
in Years
Kitchen 1 Under Counter (Low Temp) Electric N/A No 0.00 0 0.0 $0.00 $0.00 $0.00 0.00No
Existing Conditions Proposed Conditions
Install ENERGY STAR
Equipment?
Location Quantity Equipment DescriptionEnergy Rate
(W)
ENERGY
STAR
Qualified?
Main Building 37 Desktop Computer 110.0 Yes
Main Office 1 Printer 46.0 Yes
Main Office 1 Water Foutain 35.0 Yes
Main Office 1 Printer 46.0 Yes
Main Office 1 Printer 16.0 Yes
Main Office 1 Printer Multifunction 760.0 Yes
Kitchen 1 Microwave 1,000.0 No
Kitchen 1 Coffee Machine 700.0 No
Kitchen 1 Microwave 1,000.0 No
Kitchen 1 Toaster 800.0 No
Fitness Room 4 Ceiling Fan 35.0 No
Fitness Room 3 TV ( hanging) 128.0 Yes
Fitness Room 2 Small Wall Fan 10.0 Yes
Spin Studio 6 Ceiling Fan 35.0 No
Gym Spin Studio 4 Small Wall Fan 10.0 Yes
Snack Bar 1 Chest Freezer 250.0 No
Snack Bar 1 Microwave 1,000.0 No
Indoor Pool 2 Big Floor Fan 250.0 No
Existing Conditions
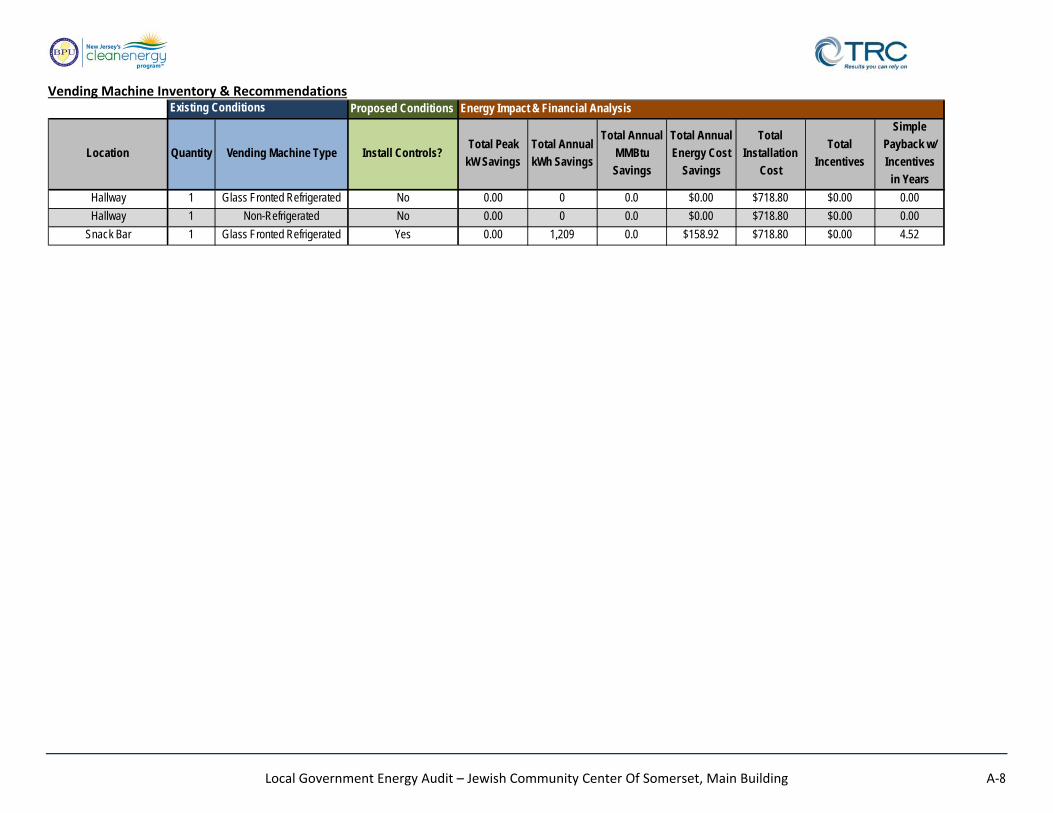
Local Government Energy Audit – Jewish Community Center Of Somerset, Main Building A‐8
Vending Machine Inventory & Recommendations Proposed Conditions
Location Quantity Vending Machine Type Install Controls?Total Peak
kW Savings
Total Annual
kWh Savings
Total Annual
MMBtu
Savings
Total Annual
Energy Cost
Savings
Total
Installation
Cost
Total
Incentives
Simple
Payback w/
Incentives
in Years
Hallway 1 Glass Fronted Refrigerated No 0.00 0 0.0 $0.00 $718.80 $0.00 0.00
Hallway 1 Non-Refrigerated No 0.00 0 0.0 $0.00 $718.80 $0.00 0.00
Snack Bar 1 Glass Fronted Refrigerated Yes 0.00 1,209 0.0 $158.92 $718.80 $0.00 4.52
Existing Conditions Energy Impact & Financial Analysis

Local Government Energy Audit – Jewish Community Center Of Somerset B‐1
Appendix B: ENERGY STAR® Statement of Energy Performance
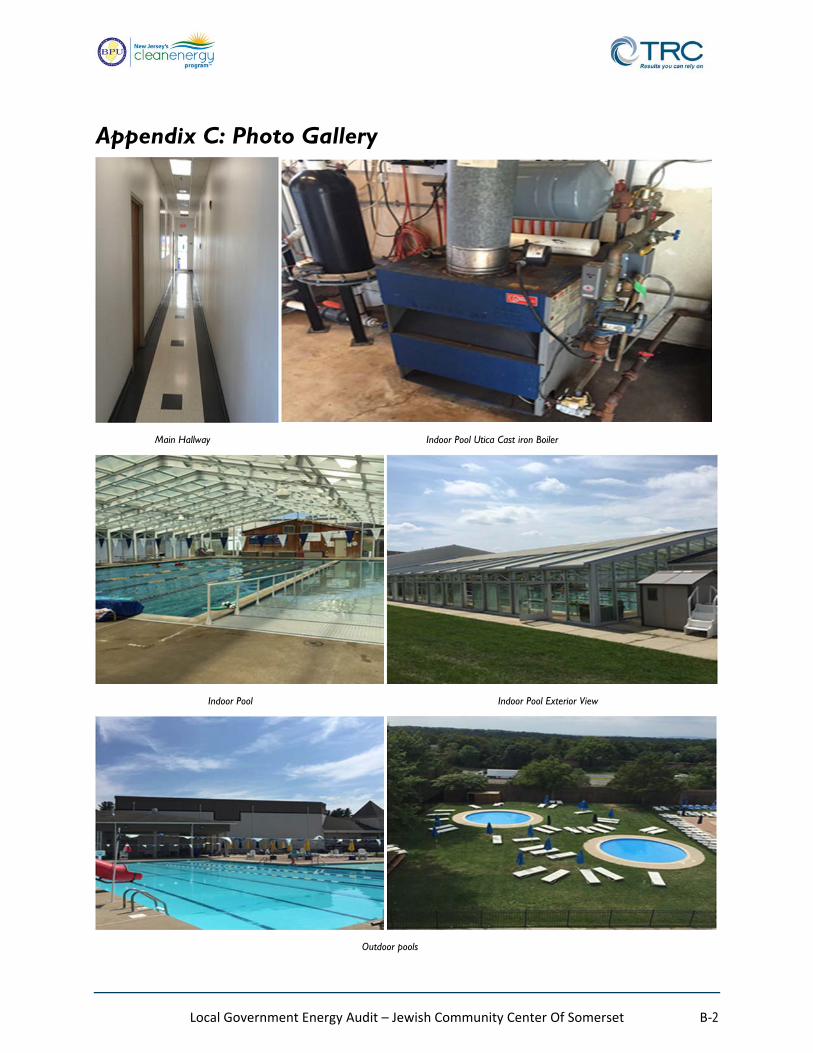
Local Government Energy Audit – Jewish Community Center Of Somerset B‐2
Appendix C: Photo Gallery
Main Hallway Indoor Pool Utica Cast iron Boiler
Indoor Pool Indoor Pool Exterior View
Outdoor pools
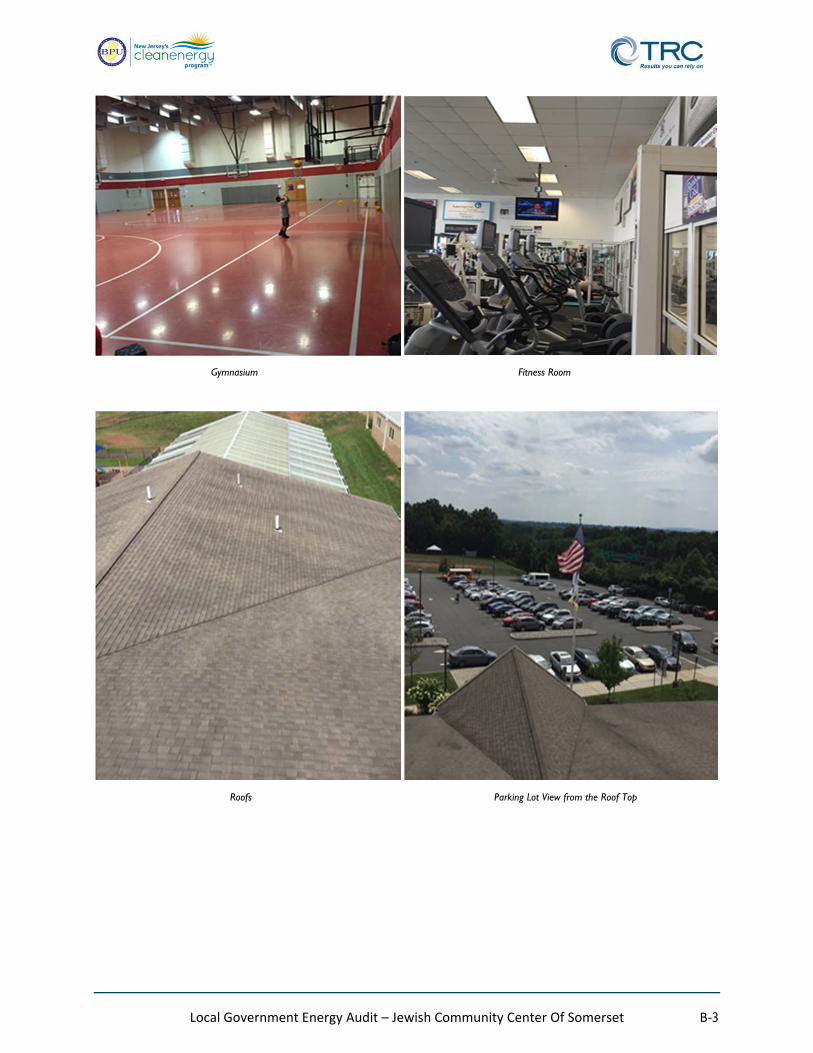
Local Government Energy Audit – Jewish Community Center Of Somerset B‐3
Gymnasium Fitness Room
Roofs Parking Lot View from the Roof Top