Embed Size (px)
Citation preview

Local Government Capability and Public Spending Efficacy:
Evidence from a Decentralized Government Transfer Program in Indonesiaψψψψ
Daniel Suryadarma Chikako Yamauchi∗∗∗∗ Australian National University Graduate Institute of Policy Studies &
Australian National University
July 2011
Abstract This paper investigates the size of grants from the central government that is actually delivered to intended beneficiaries. Combining administrative data and household survey datasets, we show that only 78 percent of the grants under the Inpres Desa Tertinggal (IDT)-Indonesia's poverty alleviation program-were received by intended beneficiaries. We find that pre-existing administrative and organizational skills of village governments are positively associated with the share of funds reaching beneficiaries. We also provide the first evidence linking the literature on targeting and the literature on the delivery of public spending, by demonstrating that failing to taking into account missing public resources could produce a misleading conclusion on the nature of the distribution of anti-poverty program resources.
Key words: public spending, local government, corruption, capture, decentralization
JEL codes: H11, H53, O17
ψ We thank Shulamit Kahn, Kevin Lang and seminar participants at 2009 Australian Development Economics Workshop, Hitotsubashi University, Institute of Developing Economics, Monash University, National Graduate Institute for Policy Studies, Sophia University, University of New South Wales, University of Tsukuba for their useful comments. We are also grateful for Jack Molyneaux for providing the IDT administrative records. ∗ Suryadarma: Coombs Bldg., Australian National University, Canberra, ACT 0200 Australia, email: [email protected]. Yamauchi: National Graduate Institute for Policy Studies, 7-22-1 Roppongi, Minato-ku, Tokyo 106-8677, email: [email protected].

1
1 Introduction
A loss of public resources due to corruption or mismanagement directly diminishes
targeting performance. It also hampers public spending efficacy by reducing any
possible effect on the welfare of intended beneficiaries. Recent empirical studies
suggest that the magnitude of such a loss is significant in developing countries.
Reinikka and Svensson (2004) and Olken (2006) report that only 20 percent and 82
percent of public resources reached intended beneficiaries in Uganda and Indonesia,
respectively.
The two studies above suggest that local agents played a crucial role in determining
the amount of public funds that were captured. Indeed, the quality of local
government is becoming more important as a decentralized, community-level public
resource distribution scheme is increasingly used in poor countries.1 While it is
expected that utilization of local institutions, such as local government, enhances the
accuracy of distribution, previous theoretical and anecdotal evidence suggests that
local elites who may not be intended beneficiaries could capture public resources
(Bardhan and Mookhejee, 2000, 2005, Conning and Kevane, 2002, and Crook and
Manor, 1998). Limited administrative skills of community leaders have also been
suggested as a factor that could offset possible benefits of decentralized distribution
system (Coady, Grosh, and Hoddinott, 2004, Conning and Kevane, 2002). Therefore,
it is crucial to investigate the characteristics of local government that are associated
with efficient public service delivery.
1 More broadly, Community-Based Development or Community-Driven Development schemes aim to involve local residents in the processes of program implementation such as the choice and design of development projects and selection of beneficiaries. See Mansuri and Rao (2004) for example.

2
In addition, there is a gap in the literature which examines the size of missing public
resources and the literature on targeting. The targeting problem concerns whether
relatively poor households receive more public resource compared to non-poor
households. A common method to compute this measure often relies only on the
distribution of benefits reported in a household survey, ignoring possibly missing
funds which are not claimed by any intended beneficiary.
This paper provides the first evidence to fill the gap in the two strands of literature by
demonstrating that failing to taking into account missing public resources could
produce a misleading conclusion on the nature of the distribution of anti-poverty
program resources. We also provides the first evidence that explicitly links pre-
existing local government’s capabilities and a direct measure of its performance in
public resource delivery–the share of entitled public funds that reached intended
beneficiaries in one of Indonesia’s anti-poverty programs, Inpres Desa Tertinggal
(IDT).
Results show that only 78 percent of IDT funds were received by households in
designated communities. Without taking into account this loss, conventional targeting
measures suggest pro-poor distribution. When the loss is included, however, realistic
assumptions on who received the missing public funds lead to indicate pro-rich
distribution. The results also show that the share of receipt was high in districts where
many of the communities had a relatively well-organized government before the
launch of the program, where organized governments are self-assessed to have the
capabilities to “keep reports in order” and “conduct development projects using
contributions of community members.”

3
These findings, together with the seminal work by Reinikka and Svensson (2004) and
Olken (2006), underscore the importance of direct quantitative evidence of leakage in
public spending.2 While perception-based corruption indicators are likely to be
correlated with the quality of distribution system, Olken (2009) shows that individuals
may underestimate the level of corruption. While we compute the outcome variable in
an analogous manner to Reinikka and Svensson (2004) and Olken (2006), our
analysis on the relationship between pre-existing local conditions and the share of
receipt departs from Olken (2006), who shows the contemporaneous correlates of
corruption based on a cross-sectional analysis, and Reinikka and Svensson (2004),
who measure the correlation between changes in the degree of corruption and changes
in the consumption level.
The rest of the paper is organized as follows. The next section provides more details
on the program, followed by the explanation of the data used in the paper and the
construction of main variables. Section 4 illustrates the empirical strategy, and
Section 5 discusses the results. The penultimate section calculates IDT’s targeting
performance once the amount of leakage is taken into account. Finally, Section 7
concludes.
2 Background
2.1 Indonesia and IDT
2 This in turn links to a broader literature on corruption and public spending efficacy. For example, the loss in public spending in the distribution system provides an explanation for why the size of public spending is not as correlated with development outcomes as one might expect (Barro, 1991, Landau 1986, and Filmer and Prichett, 1999). It also renders insight into why countries that are perceived to be corrupt tend to have worse development outcomes (Mauro, 1995 and Azfar and Gurgur, 2007), and why the effects of public expenditures on related outcomes are hampered in places with more corruption (Rajkumar and Swaroop, 2008 and Suryadarma, 2008).

4
It is widely accepted that Indonesia is one of the most corrupt countries in the world.
For example, according to Transparency International’s Corruption Perception Index
(CPI), Indonesia was ranked 126th out of 180 countries in 2008, a ranking which was
tied with countries such as Ethiopia, Honduras, and Uganda. This international status
has not changed much since the 1990s. The 1995 CPI assigned Indonesia as one of the
most corrupt countries among 41 countries in the survey.
The IDT program provides an opportunity to examine how much public spending
reaches intended beneficiaries in such a corrupt country. Under IDT, the government
provided selected poor communities (or villages) with lump-sum grants designated for
small business loans.3 These selected communities were instructed to allocate loans to
relatively poor households based on community-level meetings. In a selected village,
the village head and a local government agency called Lembaga Ketahanan
Masyarakat Desa (LKMD, Village Community Resilience Board) were assigned to
facilitate these community meetings and the selection of poor households.4 The
selected households were formed into groups (Pokmas) containing about 20
households, and each group elected a head (chairman), a secretary, and a treasurer.
The treasurer then received funds from local branches of banks or other government-
appointed financial institutions. These Pokmas leaders were also responsible for
managing loan activities within their group (BPS, 1994).
3 See Alatas (2000) for details of the selection criteria. In this paper, our population of interest is households in selected communities, and we examine the relationship between pre-existing local conditions and the share of entitled funds that were actually received by those households. 4 Providing non-poor households with eligibility could contribute to (unhidden) leakage of program funds. However, based on reported receipt and households’ relative poverty status, Yamauchi (forthcoming) shows that relatively poor households were indeed more likely to be beneficiaries. In this paper, we take the selection of poor households as given, and focus on whether total receipt matches total disbursement.

5
The way program funds were channelled from the national government to designated
villages, shown in Figure 1, suggests only limited scope for regional governments to
siphon off IDT funds. The flow of money shows that program funds did not go
through layers of regional government officials. Instead, they were directly transferred
from the central government to local branches of government-appointed financial
institutions.
However, Figure 1 indicates that the distribution system is likely to have left ample
room for village leaders (such as group heads, secretaries and treasurers as well as
village government officials) to steal part of the program funds. The flow of forms
indicates that each Pokmas provided the village head and subdistrict government with
a loan proposal, which contained information on the names of members, their projects,
and requested loan sizes. When the proposal was certified, the treasurer of each group
was able to exchange the certificate with the requested amount of funds according to
the proposal. Thus, if IDT funds were not entirely received by residents, the loss is
likely to have occurred at the village-level, after money left bank branches.
For example, Soeradji, Budi and Mubyarto (1998) note that probable corruption
actors were Pokmas heads. In one of their research sites, they document that a Pokmas
head handed out the IDT funds to other parties including those who were ineligible
for the funds. There are also concerns that unprofitable projects were approved simply
because of the pressure from the sub-district government (Kimura, 1999). This could
have made it easier for corrupt village officials and group treasurers to siphon off
some of IDT resources. Another possibility is that since each group was allowed to

6
have its own rule (Kimura, 1999), some of the funds might have been retained as
compulsory savings by group treasurers or village officials.5
While it is theoretically possible that low demand for credit could have resulted in a
situation where part of IDT funds were left in bank branches at the subdistrict level
(Figure 1), this was not the case as take-up rates from bank branches were very high.
Table 1 shows that on average, 99 percent of entitled funds were withdrawn from
these branches in the first two years (Bappenas, 1998). This is consistent with
anecdotal evidence that suggests that there was a pressure from the sub-district
governments to use up all the entitled funds (Kimura, 1999).
In sum, the implementation procedure for IDT implies that major allocation decisions
were made at the village level. Thus, the main outcome variable in this paper, the
share of public funds received as benefits by households in designated communities,
is likely to reflect the loss of public money which occurred at the village level.
2.2 Scope of IDT
IDT provided a large amount of public money to communities regarded as relatively
poor. Between 1994 and 1997, 41.2 percent of communities in rural and urban areas
were funded at least once.6 Each of the communities received a lump-sum grant of
5 Our measure of the gap between disbursement and receipt reflects such possible theft of program funds by village leaders, which is unlikely to have been spent on activities that benefit poor households. For, if it were used in such a way, the SUSENAS is likely to have recorded its value as benefits. That is, if IDT funds were explicitly retained by Pokmas (possibly for the purpose of purchasing goods for the members), the SUSENAS recorded the value of funds divided by the number of members. Thus, the value of such funds is included in our measure of receipt. If it diverges from the value of disbursement, the gap is unlikely to have benefited the eligible. 6 Based on communities observed in the IDT administrative data and the 1993 Village Potential Statistics. In each year, approximately 30 percent of communities were funded. A small proportion of communities were dropped out of the funding list, while additional communities were designated for funding in later years. The total grant values are in 1995 prices.

7
Rp20 million per annum. The total grant value through 1994-97 amounted to an
average of Rp45 million in funded communities. For unscrupulous local officials, this
was a large sum of money that could be worthwhile stealing. For example, the median
and 90th percentile of the annual per capita expenditure in funded villages was Rp514
thousand and Rp999 thousand, respectively.7
For households in these villages, IDT provided an opportunity to obtain a loan of a
non-trivial amount, in comparison to their standard of living. By January of 1997,
28.3 percent of households in Indonesia were eligible for a loan, and most of the
eligible received at least one loan. In communities covered by IDT at least once, the
1994-96 cumulative grant value (divided by the number of households as of 1993)
was Rp135 thousand. This was 29.2 percent of annual household per capita
expenditure of Rp462 thousand. Because the government’s guideline of targeting
relatively poor households was generally followed within the selected communities
(Yamauchi, forthcoming), the average cumulative loan size of Rp373 thousand was
even more significant among the recipients, amounting to 80.8 percent of their annual
household per capita expenditure. The average annual loan size was Rp124.3
thousand, or 26.9 percent of annual household per capita expenditure.
3 Data
3.1 Data sources
We use the following three datasets to provide information on pre-existing local
characteristics associated with successful distribution of public resources. The first is
the 1993 and 1997 National Socioeconomic Household Survey (Survei Sosial
7 Based on the 1997 SUSENAS. The per capita expenditure values are in 1995 prices.

8
Ekonomi Nasional, or SUSENAS), which is a nationally representative, annually
repeated cross-section data in Indonesia. We use the 1997 SUSENAS to calculate the
value of IDT funds received by households in each district.8 The 1993 SUSENAS
provides information on the pre-existing characteristics, such as the proportion of
adults reading newspapers and the average years of education within each district.
The second data source is an administrative record indicating which villages received
IDT between 1994 and 1996. The final source, meanwhile, is the Village Potential
Statistics (Potensi Desa, or PODES, 1993), which is a village census dataset that
contains information on village government and population.9
3.2 The measures of successful distribution of public resources
The overview of how we construct the main outcome variable, the share of IDT funds
received as benefits, is as follows. First, we compute the value of disbursed grants in a
given district and year (1994/95, 1995/96, and 1996/97) as the number of funded
villages in each district and year (available in the IDT administrative data), multiplied
by the grant value, which was Rp20 million per annum for all selected villages.
Second, we use the 1997 SUSENAS to estimate the total amount of IDT funds
received by households in each district and year. We use nominal values to facilitate
the comparison of disbursement and receipt. Third, we calculate the district-level
share of received funds by dividing the value received by households by the value
8 District is the most disaggregated level in which the SUSENAS is still representative. 9 The 1997 Hundred Villages Survey (Survei Seratus Desa, or SSD) also contains information on households’ IDT receipt. However, the small sample precludes the use of the data in this paper. The number of villages covered under IDT is 55 out of the 100 villages in the data. A further two villages cannot be matched with the 1993 SUSENAS, which is the source of covariates. Coupled with this small sample size, the fact that the SSD was collected from a set of villages selected in an ad hoc manner from different regions of Indonesia suggests that it would be difficult to compare the estimates between this data and the SUSENAS.

9
disbursed by the national government. Therefore, our outcome variable takes the
value of zero to indicate a complete loss of entitled public funds and one to indicate
full receipt of households. The rest of this subsection provides the details of the
computation of the value of receipt.
Specifically, we gather the value of received funds from the following information in
the 1997 SUSENAS: whether a household received an IDT loan, the year in which a
recipient household obtained a loan, the total annual loan size, and the source of the
loan for each retrospective year of 1994, 1995, and 1996.10 Other than cases of
corruption or mismanagement, it is unlikely that households had any incentive to
distort their responses to these questions for the following two reasons. First, their
responses were not used by the central government to decide the funding status of the
community in the coming years.11 Second, the repayment rate, as low as 19 percent,
suggests that households did not perceive strong repayment obligation.12 Thus, they
are also unlikely to have had an incentive to pretend that their loans (and thus
repayment obligation) were small.
Our measure of receipt reflects possible local capture in the communities. For
example, if ineligible households captured IDT funds, and they (correctly) answered
that they were not a pokmas member, the capture is not included in the measure of
10 All the households answered the following question: ‘has the head or member of a household ever been a member of community group (Pokmas) in IDT program?’, and households which answered ‘yes’ to this question were further asked the following: ‘have you ever received IDT fund?’ Those who answered ‘yes’ to this question were asked to specify ‘Amount of fund and source’ by the year of loan receipt. Household enumeration was conducted in January for 1996 and 1997 SUSENAS (Central Bureau of Statistics, Enumerator Core Module, Manual IIIA, National Socio-economic Survey for each year) 11 The government instead used the village-level survey, which focused on village infrastructure and general living standard. 12 Based on calculation from the 1998 SUSENAS. It is the share of households that had repaid a loan as in the beginning of 1998 among those receiving a loan in 1996.

10
receipt because the household was not asked about whether it received an IDT loan or
how much it was. In the case where a pokmas leader captured some of IDT funds, but
also received a loan from the remaining IDT funds, whatever he answered as his
benefit value is included in the measure of receipt. Thus, if he hid the capture, it
creates a gap between our measures of disbursement and receipt.
We also take into account the fact that the source of loans included direct funds,
rotated funds, and unknown sources. In order to avoid double accounting of funds that
were repaid and then lent to another household, we only include non-rotating loans.
For a small proportion of households that received loans from multiple sources per
year–either direct and rotated sources or direct and unknown sources–we make two
types of assumptions and create upper and lower bounds for the outcome variable.13
Both assumptions result in similar levels of outcome variables and qualitatively
consistent findings. Thus, we report the regression results based on the upper bounds.
We then create the district-level value of received funds as the weighted sum of the
household-level IDT benefits.14 We further adjust the district-level value of receipt for
the fact that the reference period for benefit receipt does not perfectly match the
official period of disbursement. IDT funds for a certain fiscal year were disbursed
between April of that year and March of the next year. However, the SUSENAS
13 See Data Appendix for more details. 14 Instead of the weights provided in the 1997 SUSENAS, we compute our own weights that take into account the fact that only households in villages funded under IDT are used in the estimation of the district-level value of received funds. Our weights are created as the number of households in designated villages that were surveyed in the 1997 SUSENAS, divided by the total number of households in designated villages as in 1993 (obtained from the 1993 PODES) – or the reciprocal of the probability of being selected for the 1997 SUSENAS given being in a village funded under IDT. We compute weights for each district and year for the panel analysis. For the analysis of the overall share of received funds, we use the number of households living in villages that were funded at least once under IDT. The estimate of the share of received funds based on our weights is somewhat smaller than the estimate based on the weight provided by the SUSENAS. However, regression results are qualitatively unchanged.

11
provides information on the size of loans received in a calendar year. For example, the
initial reference period was January through December of 1994, while the initial
disbursement period was from April of 1994 to March of 1995. In order to account for
this, we assume that the allocation of IDT funds within a fiscal year followed the
pattern observed for a related project called Village Infrastructure Project (VIP,
1995/96-1996/97). Under VIP, a subset of IDT villages received additional grants
specifically for infrastructure. The allocation pattern of VIP funds suggests that 90
(97) percent of funds were spent by the end of December in the first (second) program
year. We assume that the allocation of IDT loans followed the same pattern. An
alternative assumption is the equal allocation across quarters.15 We show the
estimated share of receipt based on these different assumptions.
Finally, we also adjust the value of disbursement by reducing the value for districts
included in provinces where the take-up rate was less than 100 percent (Table 1), in
order to focus on the loss which occurred after IDT funds were withdrawn from
government-appointed financial institutions.16 Finally, in order to create the overall
share of received funds, we aggregate the adjusted yearly values of disbursement and
receipt over the three-year program period.
15 Suppose that the true (unknown) value of allocation within IDT villages in the fiscal years of 1994/95, 1995/96, and 1996/97 are R94, R95, and R96. The (known) value of allocation in the calendar years of 1994, 1995, and 1996 are r94, r95, and r96. If the pattern of allocation under VIP holds for IDT loans, it suggests the following: 0.9* R94 = r94, 0.1* R94 + 0.97 * R95 = r95, and 0.03* R95 + 0.97 * R96 = r96. Solving these three equations provide the estimate for R94, R95, and R96 as a function of the known values of r94, r95, and r96. Under the alternative assumption, for 1994, we use the sum over the 1994 receipt value and a quarter of the 1995 receipt value; for 1995, we use the sum over three-quarters of the 1995 receipt value and a quarter of the 1996 receipt value; and for 1996, we use the original value. The adjustment for the last year implicitly assumes that the receipt for the first quarter of 1997 followed the same pattern as that observed in 1996. 16 The 1996 disbursement value was not adjusted because information on the final take-up rate is unavailable.

12
Table 2 shows the resulting estimates for the share of funds received as benefits,
based on the two assumptions.17 According to the upper bound estimate, the mean
overall share of received funds was 78 percent. The difference between the upper and
lower bounds are very small, reflecting the fact that most households stated loan
sources that did not require differential assumptions (see Appendix Table 1.1). The
upper bound estimate, for example, suggests that 22 percent of public spending went
missing. This falls between the case in Uganda, where 80 percent of public funds
were lost to corruption (Reinikka and Svensson, 2004), and the case for Indonesia’s
Operasi Pasar Khusus (OPK) or subsidized rice program, where at least 18 percent of
subsidized rice went missing (Olken, 2006). It is worthwhile to note that similar
estimates are obtained using the same method for the proportion of missing public
resources under OPK and IDT–the two programs conducted in Indonesia that were
both managed by community leaders. Meanwhile, the yearly estimates indicate a
fluctuation over time. The upper bound estimate first decreased from 83 percent
(1994) to 72 percent (1995), and then increased to 84 percent (1996).
Figure 2 shows the distribution of the overall share of receipt. It shows that receipt
was larger than disbursement, or the share exceeds the value of one, in 19 percent of
the district. This is not surprising given that the value of received funds is an estimate,
which could contain measurement errors.18 However, since these are measurement
errors in the outcome variable, they do not bias the estimates in the regression
17 The number of observations for the overall share is larger because it is based on all the districts which had at least one village receiving a grant at least once over the three year period, while the share of received funds in a particular year excludes districts which did not have a treated village in that year. 18 Districts whose overall share of received funds is larger than one are not significantly different from the other districts in terms of observable characteristics. While they have smaller populations and fewer villages with a bank, other characteristics are not significantly different. These characteristics include all the explanatory variables used in the regression analysis and also other variables that measure income inequality, heterogeneity in religion and citizenship, road infrastructure, average village density and characteristics of the village heads.

13
analysis, to the extent that they are of classical type. While there is one extreme case
with the share of received funds close to 10, we find that the regression results with
and without this outlier are qualitatively consistent.19 For brevity, we report the results
based on all the observations. Finally, we check the robustness of the regression
results by using the logarithm of the share of received funds, whose distribution is
shown in Figure 4.20
4 Targeting Performance
The large size of missing public funds has significant implications for the targeting
performance of IDT. In the literature of targeting, a commonly used measure of
targeting performance is the proportion of public resources provided to the poor. This
is often computed from a household survey, where individuals report whether they
received benefits and how much the benefits were. In this method, the value of
benefits received by the poor (the bottom quartile in terms of per capita household
expenditure, for example), divided by the sum of the value of benefits, is used as a
targeting measure. However, this method does not take into account for a possibility
that some public funds could be lost without being claimed by intended beneficiaries.
As a result, it might be misleading to draw a conclusion on the nature of the
distribution of benefits based solely on the abovementioned method.
In the case of IDT, the within-community distribution has been shown to be pro-poor
(Yamauchi, 2010); however, the method used in this analysis does not take into
19 While Figure 2 indicates that there is one outlier with a particularly large value, this does not change the mean share of receipt very much. Without this district, the upper and lower bounds are 74 and 72 percent. The distribution without the outlier is shown in Figure 3. 20 We use the log of 25 instead of the log of 0.25. For districts which indicate zero receipt, we assign the value of zero for the log of the share of received funds, and include the dummy variable indicating these observations in the regression analysis.

14
account the fact that 22 percent of IDT funds were not claimed by anyone in
designated districts. It is possible that Yamauchi (2010) has found the pro-poor
distribution because unscrupulous community leaders took a share of the IDT funds
first, and then distributed the rest in a pro-poor manner. Thus, it is unclear whether the
overall targeting performance including the missing funds still indicates the pro-poor
distribution.
In this section, we calculate the targeting measure explicitly taking into account the 22
percent loss in disbursement. The results reveal that even qualitative conclusion on
the distributive nature could be misleading if one fails to take into account the missing
money. In this exercise, we use the same measure used in Yamauchi (2010); i.e., the
proportion of IDT funds provided to the poor, which is defined as households which
fall into the bottom quintile in terms of the predicted level of per capita household
expenditure.21 Note that the present analysis defines the poor within each district, not
within each village as in Yamauchi (2010). Thus, the revised value of the targeting
measure is not comparable with that shown in Yamauchi (2010). Our aim here is to
examine how taking into account the missing money changes the district-level
targeting measure.
The calculation of the revised value requires the knowledge on how missing money
was distributed, which is unavailable. Thus, we consider two extreme scenarios,
between which the reality is likely to lie. In the first, we assume that the missing
21 The predicted value is used because receiving IDT funds may shift a household’s place in the distribution. The predicted value is constructed as follows: first, the OLS estimates are obtained from regressing per capita household expenditure on a number of household characteristics using data from 1993 and 1994 (before IDT started). Second, those coefficients and data from 1997 are used to derive the predicted level of per capita household expenditure as in 2007. See Yamauchi (forthcoming) for more details.

15
money was distributed equally among benefit recipients in each district. In other
words, we assume that participating households in the poorest quintile in a district
received 20 percent of the missing money in that district. This might be plausible if all
the missing money were lost due to negligent mismanagement by local officials. On
the other hand, in the second scenario, we assume that none of the missing money
went to the households in the bottom quintile. This would make more sense if
community leaders siphoned off the IDT funds based on dishonest motives. The
reality might lie somewhere between these two scenarios. In that case, the revised
estimates provide the upper and lower bounds for the share of benefits accruing to the
poorest.
The results are shown in Table 7. Column 1 shows the targeting measure when we
estimate the total value of disbursement as the sum of funds that were received by
households (that is, the common method in the literature). The figures in that column
suggest that, although its targeting performance varied over the three years, IDT
consistently exhibited a pro-poor targeting. For example, for the overall distribution,
the measure is 25 percent. This indicates that 25 percent of IDT funds went to the
poorest 20 percent of the households in districts which had at least one IDT village.
Therefore, the value accruing to the bottom quintile was 25 percent ((25-20)/20)
larger under IDT compared to the universal distribution.
However, once we take the missing money into account, IDT’s targeting performance
becomes less pro-poor. When we assume that the missing money was distributed
equally to every recipient household in the district (Scenario 1), the figures in Column
2 indicate that the overall share accruing to the bottom quintile was one percentage

16
point lower.22 The relative improvement over the universal distribution is now 20
percent, down from 25 percent. If we assume that all the missing money went to
households outside the bottom quintile (Scenario 2), IDT turned out to have been not
pro-poor at all. As shown in Column 3, households in the bottom quintile only
received between 16 percent of IDT funds overall. This implies that, even though IDT
was supposed to target the poor, its targeting performance was worse than the
universal distribution.
Taking our results to a broader context, it appears that the pro-poor nature of the
targeting performance of a poverty alleviation program could be drastically reduced
once one takes into account the amount of funds that were diverted before they
arrived at eligible households.
5 Empirical Strategy
5.1 Specifications
First, we investigate characteristics of districts correlated with the overall share of
funds received as benefits. Then, we exploit the longitudinal nature of the dataset to
further explore at which stages of the program period those correlations become
particularly pronounced. The analysis of overall corruption is based on the regression
of Yi, which is the cumulative measure of successful distribution of public resources
(either the overall share of funds received between 1994 and 1996 or the log of that
share) in district i in island j, on Xij (a vector of pre-existing conditions in the district
22 The share of funds received in 1996 is larger under Scenario 1 compared to the baseline. This is because some districts have negative values for the amount of missing funds (that is, the value of receipt exceeded the disbursement). As discussed in the section on data, this is not surprising given that the amount of receipt is an estimate and some districts could have fully disbursed IDT funds. Since only a small number of districts have such negative values, the overall share of funds received, as well as the share for the other years, is smaller under Scenario 1 than the baseline.

17
as in 1993) and Dj (a vector of island dummies).23 The coefficient on Xij indicates the
correlation between pre-existing conditions and the overall share of received funds,
while controlling for possible differences in the outcome due to unobserved, across-
island heterogeneity, such as awareness of citizens against corruption. We use the
Tobit framework to take into account the censoring at zero in the outcome variable,
which affects six percent of the sample. We also estimate this based on the OLS
(island fixed effects) model to check for robustness of the results. While the linear
model does not explicitly account for the censoring in the outcome variable, it allows
for a straightforward interpretation for the fixed effects as additive differences. In
both specifications, the error term, uij, is assumed to be independent across districts.
In addition, several districts, particularly poorer ones, have a larger number of
households, presumably because more villages within each province were selected for
grants under IDT. These districts provide a more accurate estimate for the total value
of receipt. Therefore, in order to place a higher weight on those observations, we
conduct a weighted regression analysis using the number of sample households in
each district as the weight.
Next, we extend this analysis to allow the correlation to differ across program years,
1994/95, 1995/96, and 1996/97.24 The outcome variable, Yijt, is the yearly share of
received funds, or the log of the share, in district i in province j in year t. The dummy
variables indicating observations in the second and third years of the program period
are interacted with the vector of pre-determined covariates, Xij, and the island
dummies, Dj. We estimate this extended model using both the Tobit and OLS models. 23 The island dummies distinguish districts in six broad regions: Sumatera, Jawa, Sulawesi, Kalimantan, the group of Bali and Nusa Tenggara islands, and the group of Eastern islands. 24 We indicate the fiscal years of 1994/95, 1995/96, and 1996/97 using the superscript of 94, 95 and 96.

18
The year effect on the degree of corruption is measured by the coefficient for the
dummy variables for the second and third years; and island-specific trends are
captured by the interaction between the island dummies and the year dummies. In this
specification, the coefficients for the interaction between Xij and the year dummies
test whether a district with a certain pre-existing characteristic, say a high share of
organized village governments, experiences a particularly significant change in the
share of receipt over time. On the other hand, if a characteristic is associated with a
permanently high or low share of received funds, then significant estimates are found
only in the coefficients for the uninteracted Xij ’s. Since Xij ’s do not change over time,
this exercise is equivalent to doing separate regressions for each program year.
Finally, we exploit the panel structure of our data by replacing the island-level fixed
effects with the district-level fixed effects in the linear estimation framework. In this
specification, the baseline correlation in 1994 cannot be estimated. However, changes
in the correlation between the share of received funds and pre-existing characteristics
can be estimated, controlling for the average yearly change, island-specific trends, and
unobserved heterogeneity at the district-level. Thus, the final specification serves as
the rigorous check of the results obtained from the second specification.
5.2 Pre-existing characteristics of districts
The summary statistics of the district-level initial conditions, Xij, are depicted in Table
3. They are all measured in 1993, before the start of IDT.25 We include three sets of
25 The median per capital household expenditure, mean year of education, and the share of adults listening to a radio and reading a newspaper are computed from the 1993 SUSENAS, while the other variables are extracted from the 1993 PODES. Villages or households in villages that were funded under IDT are used for this computation. For the panel dataset, different sets of funded villages are used according to their funding history in order to compute the district-level characteristics for each year.

19
variables that are likely to affect the efficiency of public resource delivery: the
capability of local political institutions, residents’ general awareness of transparency,
and their exposure to information.
First, the capability of local political institutions is likely to play an important role in a
decentralized resource distribution scheme like IDT which relies on local leaders’
discretion. We use self-reported information on capabilities of village government
(LKMD) to separate governments into relatively organized and less organized villages.
As we mentioned above, LKMD is a national institution operating at the village level.
It was created in the early 1980s as a vehicle to implement national programs for
villages. Its members are usually local residents, appointed by the village head
(Antlov, 2003). The PODES asks whether the LKMD in each village (1) does not
exist, (2) only exists in very basic form, (3) exists and is able to develop and conduct
work projects utilizing grants from the national government matched with
contributions of community members, or (4) exists and forms village development
plans, keeps reports in order, and has well-functioning sections. In order to reduce the
effect of subjective evaluation, we define a village in (3) or (4) as an organized village
with relative technical competence. We then use the share of villages with organized
government as a district-level indicator for local governance.26
Second, we also include three variables to proxy for general awareness of the
importance of government accountability and exposure to information on social
policies including IDT: the average year of education for adults aged 20-60, the share
of adults who listened to a radio, and the share of adults who read newspapers in the 26 The PODES also provide information on characteristics of village heads (such as their age, education, and the number of years in which he had been in the position). However, these characteristics did not indicate significant correlation with the degree of corruption. Thus, they are not included in the analysis.

20
seven days previous to the interview. Reinikka and Svensson (2006) find that a
newspaper campaign helped school teachers to deter the diversion of public funds for
schools in Uganda. If more educated and informed citizens are more likely to better
monitor local government officials, this could function as a deterrent of corruption or
mismanagement, resulting in a higher share of grant receipt.
Third, we use the log of the median per capita expenditure (PCE) as an indicator for
level of development. Previous cross-country studies find that a high level of
economic activity is correlated with a lower level of subjective corruption. However,
studies that exploit within-country variation in the direct measure of public spending
receipt provide mixed evidence. While Reinikka and Svensson (2004) find a positive
correlation between changes in the level of average consumption and changes in the
share of receipt, Olken (2006) finds no significant relationship between median
household expenditure and the amount of missing subsidized rice. Lastly, we include
the average village population size because the competition for an IDT loan is likely
to have been tighter in districts with large village population, or a lower value of IDT
funds per capita.27
6 Results
27 While the share of receipt could have been affected by the demand for credit, we find no significant relationship between the outcome and the following indicators for the availability of other credit sources and access to credit sources outside the community: the share of villages which had a bank at the onset of IDT, the share of villages which received other public credit programs in 1992, and the share of villages which have good inter-village roads. While Olken (2006) finds that population density was correlated with the amount of missing rice under the subsidized rice program, we find that the average village density is not significantly associated with the amount of ‘missing funds’ under IDT. Also, previous studies show that ethnic fragmentation and a high proportion of Muslim population are correlated with corruption. However, we find that Hehfindahl indices of religion and citizenship homogeneity (created from the 1990 census) as well as the district-level inequality (the ratio of the 90th and 10th percentiles of per capita household expenditure) are uncorrelated with the share of funds received as benefits. Information on ethnicity is unavailable in the census.

21
6.1 Overall efficiency of the distribution of public resources
Table 4 indicates the result of estimating Equation 1 for the share of funds received as
IDT benefits using a Tobit model (Column 1) and a linear model with island fixed
effects (Column 2). Equivalent results are shown for the log of the share of funds
received as benefits in Columns 4 and 5. The results between the Tobit and linear
specifications are qualitatively similar, suggesting that the findings are robust to
differential treatment of the censoring in the outcome variable. Based on this
observation, we mainly discuss the results based on the linear fixed effects model.
The first finding is that districts where a higher share of villages had an organized
government at the onset of the program tend to show a higher share of IDT funds
distributed to resident households. Column 2 shows that a one standard deviation
increase in the share of villages with organized government is associated with a 17-
percentage point increase in the share of funds received as benefits. Compared to the
overall mean of 78 percent, this amounts to a 22-percent increase or improvement in
the outcome. The results based on the log-linear specification, in Column 5, imply
correlation of a similar size. A one standard deviation in the share of organized village
governments is associated with a 19-percent increase in the share of funds delivered
to households.
A possible explanation for the results is that an organized local government facilitated
transparent management of program resources. While village government was not
necessarily responsible for loan management after the selection of beneficiaries under
IDT, some of the government officials could have been group treasurers themselves
or assisted villagers in managing program funds. While the empirical evidence does

22
not show a mechanism through which the correlation emerged, possible factors which
enable officials of organized village governments to mitigate theft of funds and
negligent mismanagement may include basic skills to organize villagers and keep
records on beneficiaries and loan activities.
The second major finding is that districts where a higher share of adults had read a
newspaper before the launch of IDT were subsequently more likely to have a higher
share of funds delivered to households as benefits. The results based on the share of
funds received as benefits, in Column 2, imply that a one standard deviation increase
in the proportion of newspaper readers is associated with a 17-percentage point
increase in the outcome, equivalent to a 23-percent increase. The results based on the
log-linear specification suggest weaker, yet similar results. When we use the principal
component of the two variables, shares of adults listening to a radio and of adults
reading newspapers, the results as shown in Columns 3 and 6 indicate that more
information exposure is associated with more efficient distribution of public resources.
These results are consistent with the hypothesis that information enables citizens to
monitor the distribution of public funds and to mitigate the prospect of village
government officials and group treasurers to steal the funds. This is in line with the
evidence on the impact of the newspaper campaign in Uganda (Reinikka and
Svensson, 2006).
The third finding is that the log of median PCE is negatively associated with the share
of funds received as benefits. Note that this is not due to the fact that wealthier
districts were given a smaller value of grants under IDT, as this is already taken into

23
account by the use of the share of grant value received as benefits. While this is
inconsistent with cross-country evidence, which suggests negative association
between corruption and GDP, and between corruption and educational attainment
(Svensson, 2005), there are discrepancies across studies focusing on within-country
variation in the degree of successful distribution of public resources.28 A possible
explanation for the current results might be that wealthier individuals did not monitor
the management of IDT funds by village officials as much as poorer individuals, as
wealthy individuals were much less likely to be benefit from IDT.
We also find a negative correlation between the share of receipt and the average
village population size. This indicates that possibly tougher competition towards
program funds in more populated districts did not result in more monitoring by
residents. This correlation is unlikely to be due to large monitoring costs in villages
with large populations because density, which is more likely to be related to
monitoring difficulty, shows no significant correlation with the outcome when we
include it in the regression.
6.2 Yearly efficiency of the distribution of public resources
Table 5 shows the results of estimating Equation 2 based on the Tobit model
(Columns 1-3) and the linear island fixed effects model (Columns 4-6). The results of
estimating Equation 3, the district fixed effects model, are in Columns 7 and 8.
Equivalent regression results are summarised in Table 6 for the log of the share. The
28 While a reduction in theft in Uganda’s public school system was associated with an increase in the average community expenditure (Reinikka and Svensson, 2004), neither the median per capita expenditure (PCE) nor mean years of education was correlated with corruption in Indonesia (Olken, 2006).

24
results provide several interesting findings, which shed light on how the overall
relationship in the previous section emerged.
First, the results suggest that the pre-existence of organized village government did
not matter much for the outcome in the initial year, as indicated by statistically
insignificant 1994 benchmark coefficient (Columns 1 and 4, in Tables 5 and 6).
However, districts which initially had a higher share of organized village governments
exhibited a higher share of funds received as benefits towards the end of the program
period. That is, the estimates for β295and β2
96 of the proportion of villages with
organized government are both positive, with the latter having stronger statistical
significance than the former. For instance, the results based on the linear island fixed
effects model indicate that districts which had had a one standard deviation higher
share of organized village governments experienced 11- and 27-percentage points
higher increases in the outcome between 1994 and 1995 (Column 5) and between
1994 and 1996 (Column 6), respectively. This amounts to 13 and 35 percent
proportional increase relative to the overall average share of entitled funds received
by households.
We also obtain qualitatively consistent results based on the log-linear specification
(Table 6) and when district-level fixed effects are controlled (Columns 7 and 8). For
example, the district fixed effects model results for the log of the share of receipt
suggest 17 and 26 percent increases in the share of receipt between 1994 and 1995 as
well as between 1994 and 1996, respectively. A possible explanation for these results
might be that inaccurate or corrupt procedures increased as more funding became
available, which was mitigated in villages with organized local government.

25
Second, there is weak evidence that exposure to information through newspaper is
associated with a larger increase in the share of funds delivered to resident households
between 1994 and 1996 (Column 3, Table 5). The results based on the linear fixed
effects models indicate a statistically insignificant, yet similar, pattern (Columns 6
and 8). On the other hand, the results based on the log of the share do not indicate a
consistent association between an increase in the outcome in 1996 and the proportion
of newspaper readers (Table 6). This difference might arise due to differential
distributions of the level and log of the share of receipt, shown in Figures 2-4. The
results based on the share of receipt might indicate that exposure to information
through newspaper helped beneficiaries to be aware of problems associated with
village officials and group treasurers, and induced more monitoring behavior.
However, to the extent the differential results reflect different parts of the distribution,
this finding may not be applicable generally.
Third, results for other factors show statistically significant correlations only
sporadically or in one of the two specifications. For example, the results for the share
of receipt indicate that the average number of years of education among adults is
correlated with a decline in the share of receipt between 1994 and 1996 (Table 5).
However, the results for the log of the share show that a significant decline associated
with the average number of years of education is found only in one specification,
between 1994 and 1995 (Table 6).
Similarly, the results for the log of the share of receipt suggest that the negative
association between the share of receipt and the median per capita expenditure found

26
in the cross-sectional analysis (Table 4) emerged because wealthier districts exhibited
a lower share of receipt in 1994 (Table 6). This negative correlation became weaker
towards the end of the program. On the other hand, the results for the share of receipt
show the coefficients of the same sign but of marginal statistical significance. While
these results may not be generalized, they might be taken as weak evidence
suggesting that wealthier districts took more time in organizing meetings with
residents in the initial year, and that more educated residents became less involved in
monitoring towards the end of the program.
Lastly, while the results for the share of receipt indicate that the average village
population size is associated with a decline in the outcome between 1994 and 1996
(Table 5), the results for the log of the share of receipt do not show a systematic
pattern across different specifications (Table 6). In particular, the district fixed effects
indicate an opposite, positive correlation between pre-existing population size and a
subsequent change in the share of receipt. These results suggest that the association
between the village population size and the share of successful distribution of public
funds is inconclusive.
7 Conclusion
It has been shown that a loss in public spending in the distribution system is a
significant obstacle in efforts to alleviate poverty and enhance development. We have
investigated the relationship between pre-existing local conditions and the share of
public spending that actually reached intended beneficiaries using IDT, a large-scale
poverty alleviation program in Indonesia. Combining administrative records on
disbursement from the central government and the survey data on benefit received by

27
households, we have shown that 22 percent of public funds designated for poverty
alleviation went missing. The mechanism through which public funds were
channelled, which involved community leaders such as group treasurers and village
officials, indicates that the loss occurred after these leaders received program funds
and before the funds reached households in designated communities. The magnitude
of the loss is comparable to previous evidence in the literature. We also provide
evidence that a seemingly pro-poor poverty alleviation program could turn out to be
pro-rich once the amount of missing money is taken into account in calculating the
program’s targeting performance.
Our major finding is that having organized village governments at the start of the
program is correlated with higher share of funds received as benefits by households in
designated communities. The results of our panel analysis further provide evidence
that the pre-existing administrative capability of local government becomes important
in later years of the program period. The definition of organized village suggests that
officials of such villages were able to mitigate inaccurate or corrupt management of
program funds using their skills to organize residents and keep records on
beneficiaries and distribution of the funds. Other characteristics of village heads such
as educational attainment and the duration of time in the position are not found to be
associated with the share of funds reaching intended beneficiaries.
To the extent that these findings reflect a causal relationship, they imply that local
government officials with basic administrative capabilities are likely to mitigate a loss
of public resources and enhance public spending efficacy. While the results do not
clearly distinguish a loss due to dishonest behaviour and mismanagement, both are

28
likely to be important in improving public spending efficacy. For example, a previous
study by Olken (2007) has shown that dishonest behaviour plays a role. That is, he
finds that auditing locally managed expenditure on infrastructure projects reduces part
of corruption, but not all. While this could be related to the low probability of severe
punishment as he explains, it might be indicative that some public resources are lost
simply due to limited capabilities of local government officials. These implications
provide support for the growing emphasis that is being placed on strengthening
policymakers’ accountability (World Bank, 2004), both discouraging dishonest
behaviour and promoting human capital, as a means to ensure the productivity of
service delivery to the poor. It is likely to be fruitful for future research to examine
whether and how much different types of training programs have an impact on local
government officials’ handling of public funds.

29
References Alatas, V., 2000, Evaluating the Left Behind Villages Program in Indonesia: exploiting rules to identify effects on employment and expenditures, Princeton University, mimeo. Antlov, H., 2003, Village Government and Rural Development in Indonesia: The New Democratic Framework, Bulletin of Indonesian Economic Studies, 39, 193-214. Azfar, O. and T. Gurgur, 2008, Does Corruption Affect Health Outcomes in the Philippines? Economics of Governance, 9(3), 197-244. Badan Pusat Statistik (BPS), 1994, IDT Program Implementation Guidance Jakarta: National Development Planning Agency, Ministry of Home Affairs. Bappenas, 1998, Pemihakan dan Pemberdayaan Masyarakat: Pengalaman dari Pelaksanaan Program IDT. Jakarta: Bappenas. Bardhan, P. and D. Mookhejee, 2000, Capture and Governance at Local and National Levels, American Economic Review, 90(2), 135-39. Bardhan, P. and D. Mookhejee, 2005, Decentralizing Antipoverty Program Delivery in Developing Countries, Journal of Public Economics, 89, 675-704. Barro, R., 1991, Economic Growth in a Cross Section of Countries, Quarterly Journal of Economics, CVI, 407-43. Coady, D., M. Grosh, and J. Hoddinott, 2004, Targeting Outcomes Redux, World Bank Research Observer, 19(1), 61-85. Conning, J. and M. Kevane, 2002, Community-based Targeting Mechanisms for Social Safety Nets: A Critical Review, World Development, 30(3), 375-94. Crook, R. and J. Manor, 1998, Democracy and Decentralisation in South Asia and West Africa: Participation, Accountability and Performance. Cambridge: Cambridge University Press. Filmer, D. and L. Pritchett, 1999, The Impact of Public Spending on Health: Does Money Matter?, Social Science and Medicine, 49, 1309-23. Kimura, H., 1999, Microcredit from above: Lessons of IDT (Instruction to Isolated Villages) in Indonesia, Forum for International Development Studies, 12, 153-170, (in Japanese). Landau, D., 1986, Government and Economic Growth in Less Developed Countries: an Empirical Study, Economic Development and Cultural Change, 35(1) 35-75. Mansuri, G. and V. Rao, 2004, Community-based and-driven Development: A Critical Review, World Bank Research Observer, 19(1), 1-39.

30
Mauro, P., 1995, Corruption and Growth, Quarterly Journal of Economics, 110(3) 681-712. Olken, B., 2006, Corruption and the Costs of Redistribution: Micro Evidence from Indonesia, Journal of Public Economics, 90, 853-870. Olken, B., 2006, Monitoring Corruption: Evidence from a Field Experiment in Indonesia, Journal of Political Economy, 115(2), 200-249. Olken, B., 2008, Corruption Perceptions vs. Corruption Reality, Journal of Public Economics, 93, 950-64. Rajkumar, A. and V. Swaroop, 2008, Public Spending and Outcomes: Does Governance Matter?, Journal of Development Economics, 96(1) 91-111. Reinikka R. and J. Svensson, 2004, Local Capture: Evidence from a Central Government Transfer Program in Uganda, Quarterly Journal of Economics, 119(2) 679-705. Reinikka R. and J. Svensson, 2006, The Power of Information: Evidence from a Newspaper Campaign to Reduce Capture of Public Funds, Institute of International Economic Studies Working Paper. Soeradji, B. and Mubyarto (ed.) 1998, Gerakan Penanggulangan Kemiskinan: Laporan Penelitian di Daerah-daerah. Yogyakarta: Aditya Media. Suryadarma, D., 2008, Corruption, Public Spending, and Education Outcomes: Evidence from Indonesia, mimeo., Australian National University. World Bank, 2004, World development report 2004: making services work for poor people. Yamauchi, C., 2010, Community-based Targeting and Initial Local Conditions: Evidence from Indonesia's IDT Program, Economic Development and Cultural Change, forthcoming.

31
Figure 1: Channels of IDT funds distribution Level
National National Development
Planning Agency
BRI Head Office
Ministry of Finance
Province BRI Regional Office
Province Head
District BRI Branch Office
District Head
Subdistrict BRI Unit/ Other Financial
Institutions
Subdistrict Head
PMD Section Head
Village
Community Group
Village Head as LKMD Head
Legends:
Document flow
Funds flow
PMD = Village Community Development
BRI = Bank Rakyat Indonesia
Fund Channels Fund Clearance
Source: Badan Pusat Statistik (BPS), 1994.
32
Figure 2: Distribution of overall (1994-1996) share of entitled funds that were actually received by households in designated communities
0.0
5.1
.15
Fra
ctio
n
0 1 2 3 4 5 6 7 8 9 10 11Overall share of funds received as IDT benefits (1994-96)
Sources: the 1997 SUSENAS and IDT administrative data Notes:
- The horizontal axis indicates the share of entitled IDT grants that were actually received by households in communities that were designated for funding during the program period of 1994-96.
- The value of disbursement is based on the administrative data, and the value of receipt is estimated from survey responses in the 1997 SUSENAS.
- The sample consists of districts with at least one community which was funded under IDT and surveyed in the 1997 SUSENAS.
- The distribution for each year shows a similar pattern. Figure 3: Distribution of overall (1994-1996) share of entitled funds that were actually received by households in designated communities, without an outlier
0.0
5.1
.15
Fra
ctio
n
0 1 2 3 4 5Overall share of funds received as IDT benefits (1994-96) without an outlier
Sources: the 1997 SUSENAS and IDT administrative data Notes: See the notes for Fig. 1.

33
Figure 4: Distribution of log of overall (1994-1996) share of entitled funds that were actually received by households in designated communities
0.0
2.0
4.0
6.0
8
Fra
ctio
n
0 2 4 6 8Log of overall share of funds received as IDT benefits (1994-96)
Sources: the 1997 SUSENAS and IDT administrative data Notes:
- The horizontal axis indicates the log of the share of entitled IDT grants that were actually received by households in communities that were designated for funding during the program period of 1994-96.
- See the notes for Fig. 1

34
Table 1: Take-up rates under IDT Province 1994 1995
Aceh 100.00 92.40
Sumatera Utara 100.00 100.00
Sumatera Barat 100.00 100.00 Riau 100.00 100.00
Jambi 100.00 100.00
Sumatera Selatan 100.00 99.10
Bengkulu 100.00 100.00 Lampung 100.00 100.00
DKI Jakarta 100.00 100.00
Jawa Barat 100.00 100.00
Jawa Tengah 100.00 100.00 Yogyakarta 100.00 100.00
Jawa Timur 100.00 100.00
Kalimantan Selatan 100.00 100.00
Kalimantan Barat 100.00 100.00 Kalimantan Tengah 100.00 100.00
Kalimantan Timur 100.00 100.00
Sulawesi Selatan 100.00 92.42
Sulawesi Utara 100.00 92.47 Sulawesi Tengah 100.00 100.00
Sulawesi Tenggara 100.00 100.00
Bali 100.00 100.00
NTB 100.00 100.00 NTT 100.00 100.00
Timor Timur 100.00 99.73
Maluku 100.00 100.00
Irian Jaya 99.71 71.38
Average 99.99 98.06
Source: Bappenas, 1998. Note: the take-up rate indicates the share of IDT funds that were withdrawn by group treasurers from financial institutions appointed by the central government.
Table 2: Share of entitled funds actually received by households in designated communities (%)
Upper Bound Lower Bound Number of observations
Data source = 1997 SUSENAS
Overall share in 1994-1996 78.11 76.29 248
Share of funds received in 1994 82.93 65.41 241
Share of funds received in 1995 71.68 57.99 244
Share of funds received in 1996 84.01 81.58 248
Sources: the 1997 SUSENAS and IDT data

35
Table 3: Summary statistics for dependent variables N Mean Std Dev
Share of villages with advanced LKMD* 248 0.71 0.30
Log of average village population 248 0.71 0.74
Log of median PCE (in thousand Rp) 248 3.38 0.28 Average year of education among adults aged 20-60* 248 4.77 1.19
Share of adults aged 20-60 who listened to the radio in the week before the survey* 248 0.40 0.19
Share of adults aged 20-60 who read a newspaper in the week before the survey* 248 0.10 0.09
1 if the overall share of received funds is zero 248 0.06 0.23
Sources: the 1997 SUSENAS, the 1993 PODES, the 1990 Census and IDT data Notes:
- The share of received funds in a certain year is the value of funds reported to have been received by households between April of that year and March of the next year (corresponding to one fiscal year), divided by the value of funds disbursed by the national government during the same period. See Data Appendix for the adjustment for the discrepancy in the reference period between disbursement and receipt information.
- The overall share of received funds is the value of funds reported to have been received by households between April of 1994 and March of 1997, divided by the value of funds disbursed by the government during the same period. See Data Appendix for more details.
- LKMD is a village government, which is categorized into relatively organized and less organized based on self-reported evaluation. See section 4.2 for details.
- The number of years of education is calculated using information on an individual’s last education level and grade completed.
- Share of villages with organized village government (LKMD) and the average village population are based on the 1993 PODES. Other covariates are based on the 1993 SUSENAS.
- Variables indicated by * were standardized before being included in regressions.

36
Table 4: Overall share of entitled funds received as benefits and pre-existing local conditions in Indonesian districts covered under IDT (1994-96), Tobit model and island fixed effects model Outcome = Overall (1994-96) share of funds received as benefits (1) (2) (3) (4) (5) (6)
OR log of the overall share Share of received funds Log of the overall share
Tobit Island FE Island FE Tobit Island FE Island FE
Share of villages with organized village government [standardized] 0.191** 0.174* 0.172* 0.259** 0.186* 0.184*
(0.073) (0.072) (0.072) (0.088) (0.076) (0.076)
Log of average village population -0.293** -0.250** -0.248** -0.444*** -0.248* -0.247*
(0.097) (0.095) (0.095) (0.116) (0.102) (0.102)
Log of median PCE (in thousand Rp) -0.502+ -0.465+ -0.453+ -1.125*** -0.949** -0.934** (0.276) (0.271) (0.269) (0.331) (0.286) (0.284)
Average year of education among adults aged 20-60 [standardized] -0.068 -0.065 -0.054 0.011 0.021 0.035
(0.085) (0.084) (0.080) (0.102) (0.088) (0.085)
Share of adults aged 20-60 who listened to radio in a week previous to the survey 0.104 0.100 0.109 0.073 [standardized] (0.081) (0.080) (0.098) (0.084)
Share of adults aged 20-60 who read newspaper in a week previous to the survey 0.138 0.165+ 0.045 0.156
[standardized] (0.098) (0.096) (0.118) (0.102)
Principal component of education, exposure to radio, and exposure to newspaper 0.179* 0.152+ [standardized] (0.084) (0.088)
1 if the overall share of received funds is zero -3.741*** -3.709***
(0.469) (0.466)
Number of observations (districts) 248 248 248 248 248 248
Number of districts censored at zero 14 - - 15 - - Chi-squared 31.42 - - 40.12 - -
F-statistic - 3.01 3.29 - 9.74 10.63
Sources: the 1997 SUSENAS, the 1993 PODES and IDT administrative data Notes:
- The sample consists of districts which included at least one community receiving an IDT grant at least once between 1994 and 1996. - Columns 1 and 3 show the results of estimating a Tobit model with island dummy variables; Columns 2, 3, 5, and 6 show the results of estimating the island-level
fixed effects model. - The set of island dummy variables classify the sample districts into six regions: Sumatera, Java, Kalimantan, Sulawesi, a group of Bali and Nusa Tenggara islands,
and a group of Eastern islands. - For the Tobit models, the estimated marginal effects are shown, which were computed by evaluating the probability of being uncensored at the mean of covariates. - Standard errors in parentheses. + p<0.10, * p<0.05, ** p<0.01, *** p<0.001.

37
Table 5: Changes in the correlation between the yearly share of entitled funds received as benefits and pre-existing local conditions in Indonesian districts covered under IDT (1994-96), Tobit model, island fixed effects model, and district fixed effects model
Outcome = yearly share of funds received as benefits Tobit Island FE District FE
Change in coeff between Change in coeff between Change in coeff between
94 bench-
mark 94 & 95 94 & 96 94 bench-
mark 94 & 95 94 & 96 94 & 95 94 & 96
(1) (2) (3) (4) (5) (6) (7) (8)
Share of villages with organized village government [standardized] 0.021 0.124 0.296* 0.015 0.105+ 0.273** 0.084 0.250*
(0.103) (0.139) (0.131) (0.062) (0.062) (0.097) (0.067) (0.109)
Log of average village population -0.177 -0.074 -0.513** -0.101 -0.047 -0.485** -0.004 -0.281
(0.130) (0.179) (0.181) (0.074) (0.077) (0.184) (0.082) (0.204)
Log of median PCE (in thousand Rp) -0.573 0.247 0.229 -0.505 0.220 0.201 0.524 0.389
(0.358) (0.489) (0.468) (0.499) (0.307) (0.399) (0.361) (0.409)
Average year of education among adults aged 20-60 [standardized] 0.139 -0.232 -0.335* 0.137 -0.179* -0.327* -0.107 -0.278+
(0.114) (0.154) (0.148) (0.090) (0.080) (0.151) (0.098) (0.148)
Share of adults aged 20-60 who listened to radio in a week previous to the survey 0.057 -0.011 0.105 0.037 0.002 0.121 -0.015 0.089
[standardized] (0.111) (0.150) (0.145) (0.082) (0.069) (0.142) (0.086) (0.145)
Share of adults aged 20-60 who read newspaper in a week previous to the survey -0.029 0.160 0.307+ 0.018 0.095 0.281 0.007 0.222
[standardized] (0.136) (0.184) (0.174) (0.079) (0.082) (0.173) (0.105) (0.216)
Year dummy -2.599 -1.876 -2.245 -1.618 -5.521 -3.716
(5.016) (4.812) (2.997) (4.103) (3.688) (4.199)
Number of observations (district*years) 733 733 733
Number of district*years censored at zero 53 - -
Chi-squared 118.61 - -
F-statistic - 2.61 1.56
Sources: the 1997 SUSENAS, the 1993 PODES and IDT administrative data Notes:
- See Notes for Table 2 for the definitions of the sample, the set of island dummy variables, and the marginal effect estimates for the Tobit model. - Columns 1 through 3 show the results of aTobit model estimation with the island-level dummies; Columns 4 through 6 show the results of the island-level fixed
effects model estimation, and Columns 7 and 8 show the district-level fixed effects model estimation. - Standard errors are clustered at the district level, and shown in parentheses. + p<0.10, * p<0.05, ** p<0.01.

38
Table 6: Average share of IDT funds received by households in the bottom quintile, taking the missing money into account (%)
Number of Districts
Baseline: from the pool of actual
received funds
Scenario 1: baseline + equal distribution of missing money
Scenario 2: baseline + no
missing money went to the
bottom quintile
(1) (2) (3)
Overall share in 1994-1996 202 24.53 23.5 16.29
Share of funds received in 1994 184 29.32 22.82 12.82
Share of funds received in 1995 186 24.94 24.12 14.06
Share of funds received in 1996 190 23.25 23.71 22.52
Sources: the 1997 SUSENAS, the 1993 PODES and IDT administrative data Notes:
- The sample is a subset of the one in Table 2. To fix the number of observations across scenarios, we only consider districts that report a positive amount received. In some districts, there is no sample household that participated in IDT even though the districts received an IDT grant. For these districts, we cannot estimate the baseline targeting measure, which uses the sum of benefits reported in a household survey as the denominator.
- The amount of money missing used is the upper bound.
39
Data Appendix Appendix 1: Estimation of the share of received funds The value of funds received by households is computed based on survey responses from households about the value of loan(s) received in a certain year and the source of the loan(s). First, before we conducted a computation, we corrected the following two obvious reporting errors in the 1997 SUSENAS. One was that we converted loan sizes such as ‘9999999’ into an imputed value using the village-level mean loan size. Out of 54471 households in the dataset, seven households were affected by this adjustment. The other issue was that 327 households which received loans have no information on loan source. We found that the loan size of the majority of these households ended with ‘1.’ This was a clear deviation from the distribution of the last digit of loan size, which was usually ‘0’ or ‘5’ for the majority of the rest of participating households. Since the response to loan size was followed by the response to loan source on the questionnaire sheet, it is likely that the value indicating loan source was typed in as the last digit of loan size. We corrected these cases. Second, we adjusted loan size depending on how the loan was obtained. A recipient answered the source of loans to be direct funds, rotated funds, unknown, the mixture of direct and rotated funds, or the mixture of direct and unknown sources. Appendix Table 1.1 shows that most recipients answered only one loan source. Not surprisingly, the share of loans from the direct source declined over time. Appendix Table 1.1: Distribution of loan source among IDT participants
1997 SUSENAS
1994 1995 1996
Direct 85.33 73.88 73.21
Rotated 13.77 23.86 23.64
DK 0.81 2.12 2.20
Direct & Rotated 0.08 0.13 0.95
Direct & DK 0.00 0.02 0.00
Rotate & DK 0.00 0.00 0.00
Source: the 1997 SUSENAS. If a loan was directly extended from IDT grants, it was included in the amount of received funds. If a loan was extended from rotated (repaid) funds, in order to avoid double-counting, we converted the size of these loans into zero. For the rest of the cases, we made two types of assumptions and created the upper and lower bounds for the share of received grants. If a household received some of the loans directly from IDT grants and other loans from rotated funds, we divided the total value of the loans by two for the upper bound. This assumes that half of the loans were from rotated funds. On the other hand, we divided the total value of loans by three to create the lower bound. This includes the possibility that the first loan was smaller than loans received later. Similar adjustments were made for cases where some of the loans were
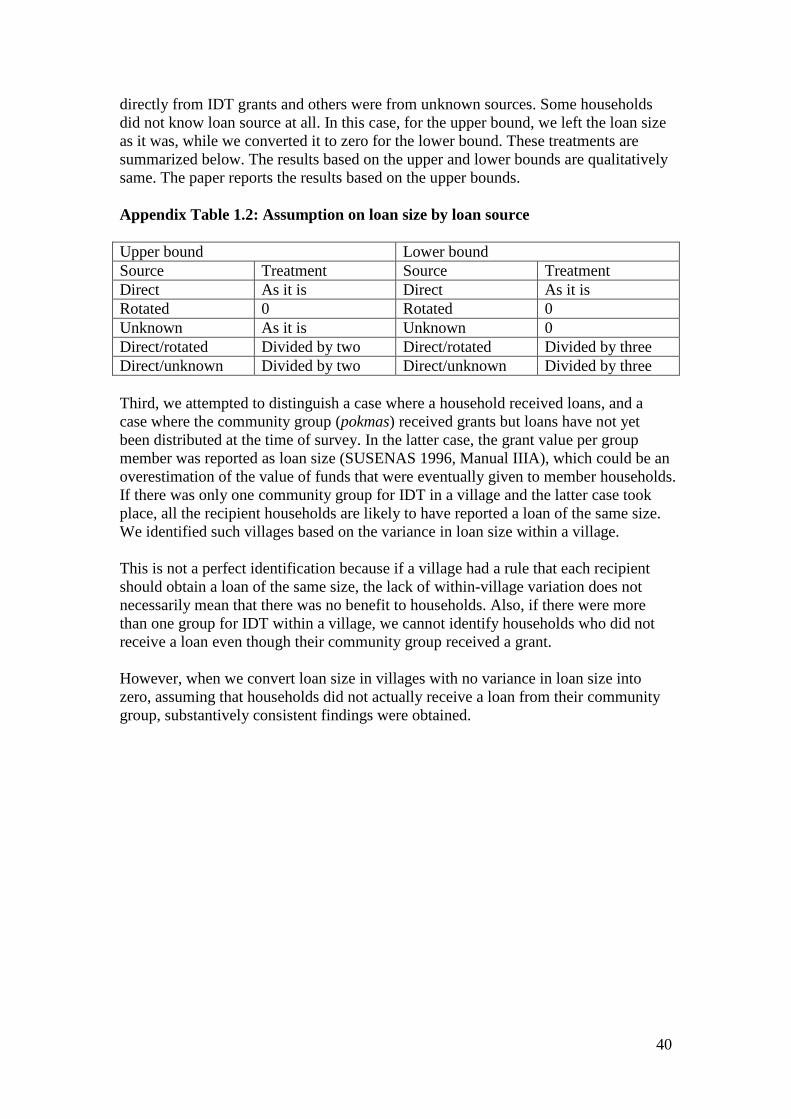
40
directly from IDT grants and others were from unknown sources. Some households did not know loan source at all. In this case, for the upper bound, we left the loan size as it was, while we converted it to zero for the lower bound. These treatments are summarized below. The results based on the upper and lower bounds are qualitatively same. The paper reports the results based on the upper bounds. Appendix Table 1.2: Assumption on loan size by loan source Upper bound Lower bound Source Treatment Source Treatment Direct As it is Direct As it is Rotated 0 Rotated 0 Unknown As it is Unknown 0 Direct/rotated Divided by two Direct/rotated Divided by three Direct/unknown Divided by two Direct/unknown Divided by three Third, we attempted to distinguish a case where a household received loans, and a case where the community group (pokmas) received grants but loans have not yet been distributed at the time of survey. In the latter case, the grant value per group member was reported as loan size (SUSENAS 1996, Manual IIIA), which could be an overestimation of the value of funds that were eventually given to member households. If there was only one community group for IDT in a village and the latter case took place, all the recipient households are likely to have reported a loan of the same size. We identified such villages based on the variance in loan size within a village. This is not a perfect identification because if a village had a rule that each recipient should obtain a loan of the same size, the lack of within-village variation does not necessarily mean that there was no benefit to households. Also, if there were more than one group for IDT within a village, we cannot identify households who did not receive a loan even though their community group received a grant. However, when we convert loan size in villages with no variance in loan size into zero, assuming that households did not actually receive a loan from their community group, substantively consistent findings were obtained.


![The Identification of EGFR Mutation Based on the …segmentation based on MR images [3]. They compared the capability and efficacy of two different feature sets – Gabor wavelets](https://img.pdfslide.us/doc/110x75/5f976ead4de7e27a895ec43b/the-identification-of-egfr-mutation-based-on-the-segmentation-based-on-mr-images.jpg)