Embed Size (px)
Citation preview
Local Food Aid Procurement in Ethiopia A case study report for EC-PREP (UK Department for International
Development)
September 2005
David J Walker* and Tiago Wandschneider Natural Resources Institute University of Greenwich Chatham Maritime Kent ME4 4TB UK
Corresponding author: email [email protected]

ii

Executive summary
Background
This report focused on Ethiopia as part of a research project that aims to develop good
practice guidelines for maximising the developmental impact of local and regional
food aid procurement. The findings will also inform a position paper, which will
furthermore draw upon insights from a similar study in Uganda and a literature review.
Local and regional procurement activities
Ethiopia is the largest regular recipient of food aid in the in Africa. The annual
quantity is tending to increase over time, and the average for 2000 to 2004 exceeded
900,000 tonnes.
Local procurement started with the activities of the Relief Society of Tigray (REST),
in 1983, but became a major activity in other areas of Ethiopia in 1996, the year when
the EC begun supporting the activity. Since then, around a quarter of Ethiopia’s food
aid has been procured locally in the form of maize, wheat and sorghum, and the
volume is on average equivalent to about 12% of Ethiopia’s marketed surplus for these
crops.
The main procurement agencies are the Ethiopian Government’s Disaster Preparedness
and Prevention Commission (DPPC), the World Food Programme (WFP) and
EURONAID, all of which use some sort of tendering procedure, and purchase in lots
of not less than 500 tonnes. These agencies regularly conduct annual cereal
availability studies with a view to targeting their procurement over time and space, and
protecting the market from adverse effects. However the quality of statistics is poor,
there is limited co-ordination between the agencies concerned, and there are various
procedural sources of delay.
Local procurement is cheaper than aid tied to donor country sources, and the food aid
agencies estimate the saving at 25 to 30% of the landed cost of imports. Nevertheless,
various donors, including the leading donor (USA), continue to tie their aid to home
supplies.
iii

Donors and Government are currently working on the implementation of a ‘Productive
Safety Net Programme’ which involves a shift from food to cash distribution, and this
may result in some reduction in the volume of food aid, or a reduction in the rate of
increase. However, various geographical, logistical, climatic and security factors are
likely to limit the extent to which the programme can be implemented, and in the light
of this, it is concluded that food aid, including local procurement, will remain very
important to Ethiopia in the foreseeable future.
Impact of local food aid procurement
The evidence base is very thin because food aid agencies have not, generally,
conducted development impact assessments in the supplying economies. However, it
is possible to draw several conclusions.
Local procurement has had an overall positive impact on rural welfare in Ethiopia, by
supporting producer prices, creating employment through the value chain, and
multiplier effects within the economy at large.
It provides a wider range of cereal grains for distribution to beneficiaries. Imported
grain is predominantly wheat, but local grains include maize and sorghum, which are
strongly preferred in some areas. Local procurement also has the advantage of
creating extra demand for maize, a commodity that Ethiopia can regularly produce in
excess over local market requirements, but due to logistical constraints, can rarely be
exported.
However there is little evidence that local procurement has contributed to price
stability between years; indeed this has not been an explicit objective. To achieve
price stability, volumes procured would need to be closely related to the state of local
harvests and rely on imported food in years of deficit. This is turn would require a
high level of co-ordination between the leading donors (EU and USA), considerable
delegation to their Addis Ababa offices, and very strong institutional arrangements to
prevent the price stabilisation function becoming a hostage to short-term political
pressures and, thereby, financially unsustainable.
iv
The developmental impact of local procurement has been weakened by bureaucratic
and procedural constraints, particularly donor rules preventing the multi-annual
programming of funds, and the timing of crop assessments. The existence of the
Ethiopia Food Security Reserve Administration’s food aid pipeline and lending facility
have greatly mitigated these problems, allowing procurement to be undertaken in a
more programmed and market sensitive manner.
Local purchase has resulted in the development of an effective but narrow procurement
channel, whose players are skilled in meeting strict delivery schedules and
specifications for food aid commodities. With the exception of certain smaller
agencies that have established relatively decentralised operations, there is no evidence
that local purchase has led to changes in practices in the regular wholesale-retail trade.
In contrast to this situation, local purchase has the potential to kick-start massive
improvements in local grain trading practices, which directly addressing weaknesses in
the areas of product specification, warehousing capacity, trade financing, contract
enforcement and price transparency. There are already plans to establish these
institutions and the piloting of the warehouse receipt system is imminent. These
initiatives enjoy a very high level of government support, but there is a risk that the
level of direct state involvement will diminish their effectiveness.
Local procurement is largely responsible for the existence of a blended food industry,
and this has had positive knock-on effects on suppliers of raw materials and packaging.
Recommendations
Impact Assessment
Donors and relief agencies should undertake assessments of the development impact of
procurement in supplying economies.
Information Date base
Donors and relief agencies should strive to improve the food aid information basis,
specifically to include all local and regional procurement.
v
Work with donors towards multi-annual cash commitments
Relief agencies should work with donors with a view to implementing a system of
multi-annual, rather than annual, resource allocations for local procurement. This
would eliminate the problems arising from occasional delays in the release of
committed funds while allowing for medium-term planning and the scaling of local
purchases in accordance with local production. Multi-annual cash contributions would
also enable implementing agencies to provide producers, traders, and processors with a
clearer indication of their future purchasing intentions with regards to quantities and
timing, thereby reducing production and marketing risks.
Investigate the scope for using local procurement to develop more efficient domestic marketing institutions Food aid agencies and donors supporting them should likewise study the opportunity
for using local procurement to develop more efficient domestic marketing institutions,
and be prepared to support if conditions are ripe for success. Support for these
institutions will require substantial changes to donor regulations and procedures. For
example, delivery of stocks should be in the form of warehouse receipts, and it could
be required that bonds are posted in this form. Procurement through commodity
exchanges means being able to dispense with the open tendering system.
Investigate the scope for more explicitly linking food aid procurement and price stabilisation Food aid agencies and the donors supporting them should study the opportunity for
more explicitly linking local food aid procurement and price stabilisation, but in a way
that avoids the negative outcomes widely associated with price stabilisation
interventions in Africa and elsewhere.
Training of private sector trading enterprises
Food aid agencies should consider sponsoring training initiatives targeting private
sector traders and covering subjects such as warehouse management, pest and quality
control, procurement systems, accounting and costing. This could contribute to
broadening their supply base and ensuring compliance with contract specifications.
vi
Contents
Executive summary iii Abbreviations and acronyms viii Acknowledgements viii 1. Introduction 9 2. Ethiopian Grain Market 12 2.1 Background 12 2.2 The grain marketing chain 13 2.3 Market participants 14 2.4 Market information 16 2.5 Current grain market situation 17 3. The Emergency Food Security Reserve Administration 21 4. Local Food Aid Procurement in Ethiopia 23 4.1 Food aid needs and trends 23 4.2 Rationale for local food aid procurement 28 4.3 Agencies involved in local procurement and co-ordination 30 4.4 Types of locally procured food aid 34 4.5 Trends in local food aid procurement 36 4.6 Regional procurement 37 4.7 Local procurement procedures 38 4.8 Quality standards for locally procured grain 42 4.9 Local suppliers of food aid 43
5. Impact of local food aid procurement in Ethiopia 47 5.1 Impact assessment 47 5.2 Grain price stability ` 47 5.3 Development of grain marketing systems 52 5.4 Development of agro-industries 54 5.5 Increase in cereal production 55 5.6 Crop diversification 55 5.7 Improving food quality 55 5.8 Stimulating regional trade 55
6. Conclusions 56 7. Recommendations 59 References 61 Appendices 1. Organisations visited and people met 2. Extracts from 2005 Crop Assessment Survey
vii

Abbreviations and Acronyms
AMC Agricultural Marketing Corporation DFID Department for International Development (UK) DPPC Disaster Prevention and Preparedness Commission EC European Commission EC-LFSU European Commission Local Food Security Unit EFSRA Emergency Food Security Reserve Administration EGTE Ethiopian Grain Trading Enterprise EU European Union GMRP Grain Marketing Research Project GTZ Deutsche Gesellschaft für Technische Zusammenarbeit (Germany) ICRC International Committee of the Red Cross IFPRI International Food Policy Research Institute MIS Market Information System NGO Non Government Organisation NRI Natural Resources Institute of the University of Greenwich, UK QSAE Quality and Standards Authority of Ethiopia REST Relief Society of Tigray SIDA Swedish International Development Agency Tonne Metric tonne TPLF Tigray People's Liberation Front USA United States of America WFP World Food Programme (United Nations)
Acknowledgements
We are very grateful to all those who have helped us in gathering data and to those who have kindly commented on drafts of this report. Special thanks are due in Ethiopia to Pascal Joannes (EC), Georgia Shaver and Roberto Marchetti (WFP), Kassaye Chemeda (EuronAid), Maria Strintzos (REST) and Aschenaki Gebrehiwot, and at NRI in the UK, Rick Hodges, Jonathan Coulter and Robin Boxall. This research project is one of 23 projects funded by EC-PREP, a programme of research sponsored by the UK Department for International Development. All EC-PREP research studies relate to one or more of the six focal areas of EC’s development policy in the context of their link to poverty eradication. EC-PREP produces findings and policy recommendations that aim to contribute to improving the effectiveness of the EC’s development assistance. For more information about EC-PREP and any of the other research studies produced under the programme, please visit the website www.ec-prep.org.
viii
1. Introduction This case study was undertaken as part of a research project that aims to develop good
practice guidelines for maximising the developmental impact of local and regional
food aid procurement. The project is funded under the EC-PREP research programme
of the United Kingdom’s Department for International Development (DFID) and is
designed to enhance the pro-poor elements of the European Union’s development
activities. It is also expected to increase the impact of development assistance on
poverty in developing countries and its contribution to achieving the International
Development Goal of halving the number of people living in extreme poverty by 2015.
Efficient and effective provision of food aid is recognised as an important element in
achieving this goal.
Food aid has become a smaller component of aid, with its share of overseas
development assistance falling from 22% in 1965 to 1 to 3% percent in the late 1990s
(Abdulai et al., 2004). Nevertheless, global food aid commodity flows over the past
four years averaged 9.6 million tonnes per annum (World Food Programme, 2005).
Many developing countries, especially in Sub-Saharan Africa, continue to receive
large amounts of food aid and this situation is unlikely to change significantly in the
foreseeable future due to low and often declining per capita food production and the
emergency needs arising from man-made and natural disasters. Ethiopia is perhaps the
most well known example. Annual food aid flows to Sub-Saharan Africa typically
vary between 2 and 4 million tonnes; having peaked at over 6 million tonnes in the
early 1990s (Abdulai et al., 2004).1 Managing food aid provision in ways that
contribute to the development of the recipient countries’ economies and minimise the
much publicised disruptive effects of food aid should therefore constitute a priority for
all agencies and governments involved. This report seeks to inform this debate.
Over the past decade, significant achievements have been made in increasing the
proportion of food aid, mainly grain, procured in the recipient country or within
neighbouring countries. These efforts reflect the widely held perception that local and
regional purchases provide a more efficient and effective means of meeting emergency
1 Leading food aid recipient countries in the region include Angola, Eritrea, Ethiopia, Kenya, Mozambique and Sudan.
9

and non-emergency food aid requirements than the alternative of importing food aid
from distant, and often, donor countries. The potential advantages of local or regional
procurement are often stated as lower purchasing, transport and handling costs,
reduced delivery time, and the provision of more appropriate and more acceptable
types of food to the beneficiaries. In addition, local and regional procurement may
have other advantages that are less well documented in that they could contribute to
agricultural and wider economic growth, a more transparent and efficient domestic
marketing system, especially for grain, and reduced food aid dependency in the
countries concerned.
However, these latter perceptions are not based on any systematic and critical review
or analysis of the role that local and regional food aid procurement is playing and in
particular, whether it is fulfilling its potential as a development tool in the areas where
it is sourced. These are topics to be addressed by the EC-PREP research project.
More specifically, answers to the following questions are being sought through a
review of published and grey literature, and comparative case studies in Ethiopia and
Uganda, countries with very different agricultural sectors and food aid procurement
and delivery systems:
• Does local procurement of food aid give producers more sustainable futures in
market-oriented production, or is it just creating dependency on unsustainable
publicly funded purchases?
• Should food aid agencies procure through conventional tender systems, or should
they deal more with small-scale producers and traders, either directly or through
intermediaries such as NGOs?
• Can food aid procurement do more to stimulate development of local marketing
systems through direct and indirect impacts on issues such as quality assurance and
grading of produce, contracting, contract dispute settlement, market information,
warehouse receipts and commodity exchanges?
• Which donor regulations and procedures are in most need of change in order to
maximise the development impact of local and regional procurement, and how
should this be achieved?
10

• What key indicators, if any, can be used to guide decisions on whether or not food
aid commodities, and grain in particular, should be procured locally or regionally?
This case study focuses on Ethiopia, where we test the hypothesis that “local or
regional procurement of food aid can make a much larger contribution to the
economies of developing countries, and poor people in particular, and polices can be
put in place to increase such benefits”. Insights from the two case studies and the
review of the literature will inform a final position paper on good practice for
maximising the impact of local and regional food aid purchases on the economies of
developing countries generally, and of Uganda and Ethiopia in particular.’
The authors of this report spent two weeks in Ethiopia in January 2005 gathering
relevant documentation and data, and discussing local food aid procurement and its
impact with key stakeholders and informants. Location of additional documentary
information and discussions with informants continued until June 2005. The report
focuses on cereals and cereal products, and a range of food aid purchasing agencies in
Ethiopia.
Following this introduction, the next chapter provides an overview of the Ethiopia
grain marketing system whilst the subsequent chapter provides information on local
food aid procurement in Ethiopia. Chapter four describes the impact of local
procurement on grain production and local markets. Some key conclusions of the
study are presented in chapter five, and chapter six provides some recommendations
on potential good practice in the prevailing situation of Ethiopia.
Note: It was noticeable, when collecting data, that there were sometimes significant
differences and discrepancies within and between different information sources in
Ethiopia. The authors have attempted to resolve some of these discrepancies.
However, the reader should note that the quality of the data is not as good as should be
expected from a major food aid recipient country such as Ethiopia.
11

2. Grain Marketing in Ethiopia 2.1 Background
Between 1980 and 1990, the formal grain trade was monopolised by the Agricultural
Marketing Corporation (AMC), which purchased large volumes of grain from peasant
farmers. The strict and rigorously enforced regulatory measures implemented by the
AMC had far reaching effects on the welfare of market participants and on the
performance of the whole economy. Private initiative to invest in productive activities
was effectively stifled.
The grain market was liberalised in 1991, and this led to an increased number of
participants in private sector grain trading and reportedly an improvement in the
efficiency of grain marketing as a whole. Nevertheless, Ethiopian grain markets
remain poorly integrated and are characterised by significant price volatility (Negassa
and Jayne, 1997; Jayne et al., 1998; Gabre-Madhin, 2001). During years of good
harvest, grain markets in surplus producing areas are characterised by excessive
supplies and abrupt price declines. The situation can be particularly serious during the
period January to April, since farmers generally lack access to credit, thus being forced
to sell their surplus soon after harvest in order to meet consumption needs, purchase
production inputs, pay taxes, and fulfil social obligations.2. Difficulties in accessing
formal credit by traders, who typically lack the scale and collateral to secure bank
loans, exacerbate the problem by inhibiting stock building. Paradoxically, excessive
supplies in surplus production areas are often accompanied by food scarcities and
significant price rises in regions experiencing failed harvests.
During the process of market liberalisation, AMC was reorganised into a new
Ethiopian Grain Trading Enterprise (EGTE), which was expected to focus on price
stabilisation and to operate on a competitive basis in the grain market. In 1994-95,
EGTE was mandated to stabilise markets and grain prices but in fact it has played only
a minor role in these areas. EGTE is now involved in commercial operations and
competes with other large grain trading companies and in common with such
companies its trade in cereals is almost entirely for the domestic market although it has
2 The main cereal harvest (meher) is during November and December, with the peak marketing season extending from January to March. There is a secondary harvest (belg) in April and May.
12
occasionally exported relatively small quantities of grains pulses and oilseeds. In 1996
and 1997, it provided more than 30% of the locally procured food aid grain. The
EGTE, with its Head Office in Addis Ababa, has significant advantages over private
traders since it has 17 branches with large warehouses located in the major producing
areas and important urban market centres. Moreover, it has its own transport fleet and
also operates a large number of temporary purchasing depots in production areas
during the peak buying seasons.
2.2 The grain marketing chain
The grain marketing chain in Ethiopia is relatively short, primarily due to the low level
of commercial grain processing and a lack of specialisation of grain wholesalers, who
are often engaged in retail and other types of trade.
The system varies from one part of the country to another depending on whether the
area is a surplus or deficit one. However, the market chain flowing from surplus to
deficit areas is generally structured so that grain moves from producers to rural
assemblers and regional wholesalers, then on through central market brokers, e.g. in
Addis Ababa) to regional wholesalers (buyers), retailers, and finally to consumers
(Fig. 2.1).
13

Figure 2.1 Grain market flows in Ethiopia
Producers
Farmers State/Commercial Farms
Assemblers
Inter-Regional Traders
Private traders EGTE Private Companies
Wholesalers/Brokers in Terminal Markets
Processors
Private Public
Retailers
Consumers
2.3 Market participants
Farmers
As mentioned above, farmers tend to sell large quantities of grain during and soon
after the main (meher) harvest, but further sales may occur as they off-load grain
stocks to avoid damage and loss caused by storage pests. It has been estimated that as
much as 80% of annual farmers’ sales occur before March.
Farmers may take grain to the nearest market themselves, often in single bags, where it
is sold to wholesalers. They also sell small quantities to rural assemblers (often larger-
scale farmers) who assemble grain from many sources and transport it to regional
markets. Farmers may also have an opportunity to sell grain directly to retailers in
regional market towns, to wholesalers in a regional market or to itinerant regional
traders.
14

Rural assemblers
Rural assemblers, small traders and often farmer-traders, buy grain from farmers with
a view to reselling to consumers or regional wholesalers. They typically operate
independently, although they may sometimes act as agents for wholesalers on a fixed-
fee or commission basis.
Regional wholesalers (sellers)
At the regional market level, wholesalers purchase grain and usually re-bag it after
checking the quality and may store it for several weeks. These traders may specialise
in certain types of grain. Their four major market outlets are: Addis Ababa central
market or another terminal market, nearby mills, retail shops and direct sales to
consumers.
Central market brokers
Grain brokers typically operate in Addis Ababa, and in some of the emerging market
hubs such as Nazareth. They check the grain for quality, determine the market-
clearing price, and then sell it on behalf of their client. Sales may be made to other
traders, mills, hotels or restaurants, government agencies or NGOs. Grain brokers
typically deal with other brokers representing buyers. If there is no immediate buyer,
the grain may be stored in the broker’s warehouse until one can be found. However,
costs of transfer and storage are the seller’s responsibility; hence such intermediate
storage is unusual.
Regional wholesalers (buyers)
In deficit areas, regional wholesalers purchase grain from regional sellers, usually via a
broker. Regional wholesalers have several market outlets including: retailers, hotels,
or consumers, but large quantities are often sold to local relief agencies.
Retailers
Retailers in regional markets of deficit areas or in urban centres purchase grain in
relatively small quantities (less than a tonne) from regional wholesalers. They may
also purchase directly from farmers or from the central market, perhaps using the
services of a broker.
Urban markets
The type and number of participants in urban markets is determined by whether a
particular market is a surplus, deficit or terminal market.
15

In the main terminal market in Addis Ababa, the dominant participants are regional
wholesalers from surplus and deficit areas, brokers, institutional buyers, retailers and
consumers and the local traders. In surplus areas, the main participants are farmers,
assemblers, wholesalers, retailers and consumers. In deficit regions the main
participants are wholesalers bringing grain from surplus areas, wholesalers stationed in
the market of the deficit area (and who receive supplies for surplus areas), retailers and
consumers.
2.4 Market iformation
Market information at the farm gate level is non-existent and there is no formal system
for determining the domestic price of grain. The farmers’ primary source of market
information appears to be the marketplace itself, and conversations with neighbours
and traders.
The main sources of information on grain prices in Addis Ababa central market are
individual contacts with agents, brokers, traders/merchants and transporters from
different regions. Prices are set according to the sources of information.
Larger companies and medium to large scale grain traders obtain information from
several sources including their own out-stationed staff, networks of traders, prevailing
prices in the Addis Ababa central market and their regular client suppliers.
The Central Statistics Authority has been collecting producer and retail prices of a
range of goods, including cereal grains for an increasing number of locations since
1996. Producer prices are collected from around 400 rural markets and retail prices
from more than 25 urban centres. Data are presented as monthly price averages for
each commodity and reports should be issued quarterly, although there have been
some delays publishing the information.
The EGTE operates a market information system (MIS), with information on who is
holding stocks and where, the quantities available at different locations, and spot prices.
Data are updated weekly. The MIS was established originally under a Grain
Marketing Research Project (GMRP)3. The information, initially derived from 26
markets, was made available commercially through grain market bulletins and some
3 A collaborative project between the Ministry of Economic Development and Co-operation (MEDAC), Michigan State University and USAID.
16

information was published in newspapers and broadcast on local radio. The
information was of particular value to the European Commission Local Food Security
Unit (EC-LFSU) in its local procurement exercises. When the GMRP closed, the EC-
LFSU entered into an agreement with EGTE whereby it would continue to support the
MIS, although access to the data is limited to the two organisations.
2.5 Current grain market situation
Ethiopian grain markets are poorly integrated in comparison with many African
countries. This can be attributed to a combination of factors, including: long distances
between surplus and deficit regions; difficult terrain; poor security; inadequate
transport infrastructure and services; limited access to market information; the
predominance of small and weakly capitalised grain trading enterprises; the lack of
purchasing power in destination markets, and the impact of food aid distribution.
These factors inhibit inter-regional trade in Ethiopia and lead to significant price
spreads between surplus and deficit areas4.
A study by the World Bank (in press) shows that there has been a steady, albeit uneven,
improvement in the performance of markets, in terms of spatial and seasonal margins.
However, it found that short-term price volatility posed a major challenge to all players,
reducing incentives for both spatial and temporal arbitrage. Markets in surplus areas
are functioning reasonably well but there is limited or weak integration between
surplus and deficit areas, attributable to lack of effective demand and the distribution
of food aid, which displaces demand and causes trading opportunities to be missed.
The authors find this conclusion to be credible and consistent with earlier findings of
the International Food Policy Research Institute (IFPRI) in (Gabre-Madhin, 2001).
Certain inefficiencies can be attributed to private sector practices and the condition of
market infrastructure. Wholesale trade through the Addis Mercato consists of brokers
who marry the needs of traders in deficit areas to those with surpluses to offer, and is
in some ways highly sophisticated. However, with no standardised weights, measures
and grades, and no public forum for price discovery, the system is highly dependent on
personal relationships and trust between traders in outlying areas and Addis brokers.
Produce needs to be inspected visually and there is little forward contracting. Under
4 Using IFPRI data, Deloitte Emerging Markets and NRI (2003) calculated average returns on simple arbitrage for maize between Nekempte and Addis, an all-weather route, at above 10% for 18 of the 48 months ending in October 2003.
17

such circumstances, potential trading opportunities are missed and there is
considerable inefficiency, of kinds that might be overcome through innovations in
marketing institutions, e.g. formal grading standards, efficient systems of contract
enforcement, market information systems, warehouse receipts and a trading floor5.
In Ethiopia, there are widespread perceptions that traders are profiteers, and this
largely explains the strong official support for marketing co-operatives. However,
there is no evidence that grain traders operating in regular commercial channels are, on
average, able to realise abnormal profits. Marketing and search costs typically account
for a large share of gross margins, and grain marketing entails significant risks and
generates occasional losses to the agents involved (Gabre-Madhin, 2001).
Ethiopia’s landlocked position and its poor integration in the Horn of Africa and other
international markets are also important causes of intra- and inter-annual cereal price
variability, particularly for maize, a commodity that the country is capable of regularly
producing in surplus. Moving food into and out of Ethiopia is very expensive due to
the long distances from the Red Sea ports and the inadequate transport logistics and
commodity handling systems. Deloitte Emerging Markets and NRI (2003) found that
there was a difference of approximately US $180 per tonne between import parity
prices (wholesale Addis Ababa) and export parity prices (farm gate East Shewa). A
further constraint to cross border trade is the bureaucracy surrounding vehicle
registration, quality and phytosanitary regulations, taxes and tariffs. Consequently,
Ethiopia is seldom in a position whereby commercial imports of cereals are viable,
even when local supplies are scarce and prices are high.
The country is generally unable to channel some of its surplus abroad during bumper
crop years when local prices are unduly depressed. While Ethiopia often produces
maize in excess of domestic requirements, it only managed to export significant
quantities of this cereal between February 2002 and January 2003, through the EGTE.6
This was a period of atypically high prices in the world and regional markets presented
Ethiopia with a rare opportunity.
5 Gabre-Madhin (2001) discusses possible innovations. 6 During this period, EGTE is reported to have exported 20,000 tonnes of maize to southern Africa through Dar-es-Salaam.
18

Weaknesses in the marketing system increase the risks and depress the returns from
cereal production, discouraging the adoption of yield enhancing technologies and
agricultural growth, and adversely affect food security, especially in deficit areas.
Inter annual price volatility contributes to farmers’ problems. They respond to long
periods of high prices by scaling up production, but this eventually results in a collapse
of market prices leading to major readjustment of production levels and another period
of acute food scarcities. The presence of imported food aid brings forward the time
when prices collapse since, even where not the object of monetisation, beneficiaries
normally sell a portion back onto the market to meet their non-food needs7.
Figure 2.2 illustrates the problem of grain prices collapsing periodically in Ethiopia.
In 2001 and 2002, prices for both maize and wheat fell to unremunerative levels in
many key surplus areas, and many farmers defaulted on their production loans.
In some ways the fall in the wheat price was more alarming than that for maize. For
the latter crop, price crashes may be seen as a painful but necessary signal for
producers to adjust production in line with demand. However, wheat is a crop for
which Ethiopia is a high cost producer relative to major cereal producing countries,
and demand generally outstrips domestic supply. The price fall in 2001 can be
attributed in part to competition from imported food aid wheat, which beneficiaries sell
back on to the market. Indeed as a relatively high value cereal, food aid recipients tend
to value wheat as a source of cash revenue with which they can meet necessities in
clothing, medicine, etc. that are not met by food aid packages.
7 It is difficult to know exactly how much is sold back in this way. Based on a survey carried out in Ethiopia, Manfred Metz estimated that about 25 to 30% of relief rations, and 30 to 50% of food-for-work wages were monetised by the recipients (Thomson and Metz, 1999).
19
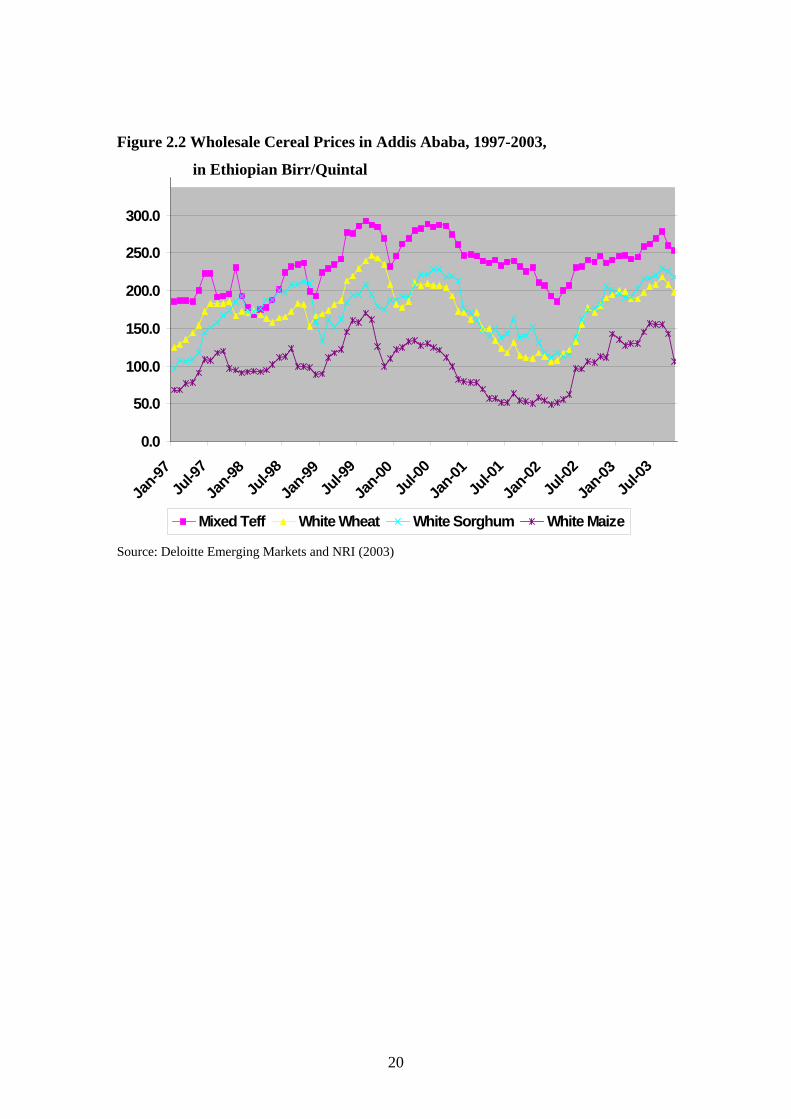
Figure 2.2 Wholesale Cereal Prices in Addis Ababa, 1997-2003,
in Ethiopian Birr/Quintal
0.0
50.0
100.0
150.0
200.0
250.0
300.0
Jan-9
7Ju
l-97
Jan-9
8Ju
l-98
Jan-9
9Ju
l-99
Jan-00
Jul-0
0
Jan-0
1Ju
l-01
Jan-0
2Ju
l-02
Jan-03
Jul-0
3
Mixed Teff White Wheat White Sorghum White Maize Source: Deloitte Emerging Markets and NRI (2003)
20
3. The Emergency Food Security Reserve Administration The management of Ethiopia’s food security reserve, originally created in the 1970s,
became the responsibility of an autonomous unit of government, the Emergency Food
Security Reserve Administration (EFSRA) in the late 1980s. The creation of the
EFSRA was widely supported by the Ethiopian government, donor agencies and
NGOs involved in the distribution of food aid to relief and development projects
throughout the country. Over the past 20 or so years and after a number of reviews of
the reserve’s structure and function, its capacity has steadily increased from around
180,000mt to 307,000mt in the early 1990s to the current level of just over 400,000 mt.
The EFSRA with headquarters in Addis Ababa is responsible for large bag warehouse
storage facilities at seven locations: Dire Dawa, Kombolcha, Mekelle, Nazareth,
Shashemane, Wereta, Woliyta and Sodo.
Currently, the EFSRA, despite its title, has less to do with dealing with emergencies
but is more concerned with smoothing the flow of food aid to relief and development
projects. Effective response to emergencies must be prompt and immediate, yet food
aid deliveries may take some considerable time to organise. EFSRA stocks have
therefore provided a convenient and necessary means of bridging the time between
government and donor responses to emergencies and the arrival of consignments of
food aid. Agencies can draw stocks from the reserve against pledges to repay similar
quantities of food grain within an agreed time.
The reserve was initially established entirely with stocks of imported grain. However,
since the mid-1990s the quantity of domestically produced grain, especially maize and
sorghum, entering the reserve has been increasing steadily. Food aid agencies may
distribute locally procured grain direct to beneficiaries but most of the grain is
delivered to the reserve to repay loans. The arrangement is not without problems.
When stock levels in the reserve are high and warehouse space is at a premium this
may lead to extended delivery routes and high transport costs for locally procured
grain. For example, the only available warehouse space for maize procured in the
south of the country may be at an EFSRA site in the north of the country.
Raising the level of locally produced grains in the reserve increases the risk of
quantitative and qualitative loss. Fortunately, the EFSRA has received considerable
donor support (technical assistance, training and equipment) and is able to maintain
21
stocks in satisfactory condition for human consumption over extended storage periods.
It is widely acknowledged that the EFSRA maintains a high standard of storage
management and that losses due to pests and spillage are contained below 1% annually.
Grain held in the reserve is intended for use within Ethiopia, but there would seem to
be no reason why it should not be made available for use within the region, by
agencies such as the EC or WFP. The arrangement would mirror that in which the
Sudan reserve loaned sorghum for EC operations in Ethiopia, and the EC subsequently
repaid by procuring locally within Sudan (Walker and Boxall, 2004). In exactly the
same way, EFSRA could loan grain for use in, say, Sudan, Somalia or northern Kenya.
The above-mentioned bureaucratic constraints to cross-border trade in grain are likely
to pose problems, but the Sudan/Ethiopia sorghum operation shows that these are not
insurmountable.
22
4. Local Food Aid Procurement in Ethiopia
4.1 Food aid needs and trends
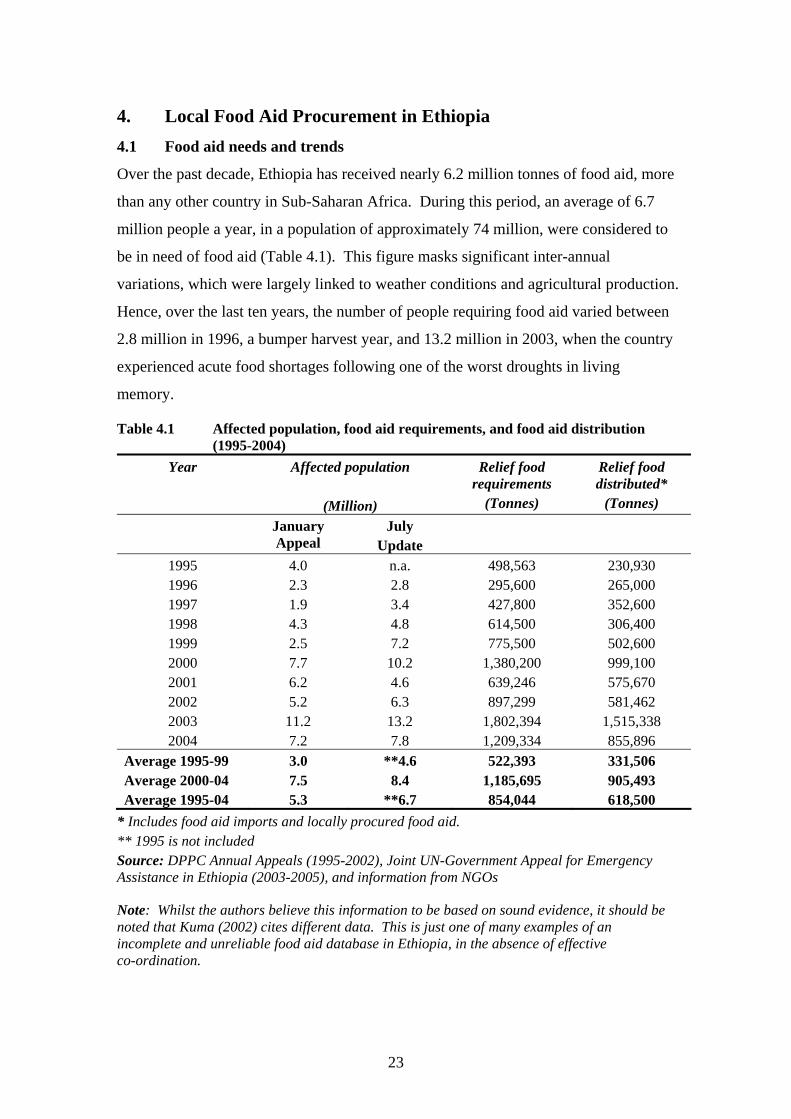
Over the past decade, Ethiopia has received nearly 6.2 million tonnes of food aid, more
than any other country in Sub-Saharan Africa. During this period, an average of 6.7
million people a year, in a population of approximately 74 million, were considered to
be in need of food aid (Table 4.1). This figure masks significant inter-annual
variations, which were largely linked to weather conditions and agricultural production.
Hence, over the last ten years, the number of people requiring food aid varied between
2.8 million in 1996, a bumper harvest year, and 13.2 million in 2003, when the country
experienced acute food shortages following one of the worst droughts in living
memory.
Table 4.1 Affected population, food aid requirements, and food aid distribution (1995-2004)
Year Affected population
(Million)
Relief food requirements
(Tonnes)
Relief food distributed*
(Tonnes) January
Appeal July
Update
1995 4.0 n.a. 498,563 230,930 1996 2.3 2.8 295,600 265,000 1997 1.9 3.4 427,800 352,600 1998 4.3 4.8 614,500 306,400 1999 2.5 7.2 775,500 502,600 2000 7.7 10.2 1,380,200 999,100 2001 6.2 4.6 639,246 575,670 2002 5.2 6.3 897,299 581,462 2003 11.2 13.2 1,802,394 1,515,338 2004 7.2 7.8 1,209,334 855,896
Average 1995-99 3.0 **4.6 522,393 331,506 Average 2000-04 7.5 8.4 1,185,695 905,493 Average 1995-04 5.3 **6.7 854,044 618,500
* Includes food aid imports and locally procured food aid. ** 1995 is not included Source: DPPC Annual Appeals (1995-2002), Joint UN-Government Appeal for Emergency Assistance in Ethiopia (2003-2005), and information from NGOs
Note: Whilst the authors believe this information to be based on sound evidence, it should be noted that Kuma (2002) cites different data. This is just one of many examples of an incomplete and unreliable food aid database in Ethiopia, in the absence of effective co-ordination.
23

Recently, there has been an increase in Ethiopia’s food aid dependency, both in terms
of the population in need of assistance and the amount of relief food distributed. Over
the past five years, the number of people requiring relief food averaged 8.4 million per
annum, compared to 4.6 million between 1996 and 1999. The increase in food aid
flows was even more pronounced, jumping from an average of 331,506 tonnes per
annum during 1995-1999 to 905,493 tonnes per annum during 2000-2004 (Table 4.1).
These trends are not significantly changed if one excludes 2003, which was an
abnormal year in terms of the intensity of the drought. The fact that in 2004 nearly 8
million people were unable to feed themselves without relief assistance, despite the
good cereal harvest, illustrates the extent of Ethiopia’s food aid dependency.
Recurrent droughts have been a major factor behind increased levels of household food
insecurity in Ethiopia. Droughts not only have an immediate negative impact on food
production in affected areas, but also erode the ability of households to earn income in
subsequent years and endure further shocks. The most obvious impacts of drought are
reduction in household food production and income, localised food shortages and rises
in local food prices. In order to cope with such events and minimise their effect on
present consumption levels, the most vulnerable groups have to sell key assets, such as
livestock, and reduce investments in human capital, such as education and health.
These groups have therefore experienced an erosion of their already limited asset base
and income earning capacity.
The effects of drought have been compounded by increased population pressure,
especially in the highlands, where land degradation and declining farm size have
emerged as major causes of household poverty and vulnerability. More recently,
depressed coffee prices have resulted in a decline in one of the main sources of cash
income and employment for the rural population in southern and western Ethiopia (EC
and WFP, 2002; Robinson, 2003).
The increase in food aid dependency is partly linked to the long-term decline in per
capita food production. Very slow adoption of yield-enhancing technologies has
meant that domestic food production has failed to keep pace with a rapidly growing
population. It is commonly believed that Ethiopia cannot grow enough food to feed its
population and lacks the foreign exchange to meet the shortfall through commercial
imports, thereby having to rely on external in-kind donations (Table 4.2). However, in
24

exceptional years, cereal assessment surveys have shown that food aid requirements
might be met entirely from local procurement. Ethiopia’s landlocked position further
exacerbates the problem by inflating the cost of imported food. Commercial imports
of cereals are normally not viable since import parity prices tend to exceed local
wholesale prices (Deloitte Emerging Markets and NRI, 2003).
However, to understand the growing levels of food aid dependency in Ethiopia, it is
important to go beyond an analysis of domestic food production and demand trends
and take into consideration the inability of large segments of the population to access
food. According to recent estimates, half of Ethiopians are considered poor and nearly
15 percent have a high probability of falling into poverty in the event of a single large
shock (World Bank, 2004a). Poverty is particularly acute in rural areas, where many
households can neither grow sufficient food nor earn the required cash income to meet
their consumption needs through market purchases. Lack of purchasing power and
effective demand amongst the poor explain in part why high levels of chronic food
insecurity in deficit regions often coexist with grain market gluts in surplus producing
areas. Other factors that contribute to this market disconnection include lack of
effective market information, poor road systems, geographical barriers, and concerns
about physical security in some regions.
25

Table 4.2: Food Balance Sheet for Ethiopia 1995 - 2004
1995 1996 1997 1998 1999 2000 2001 2002 2003 2004
Gross Domestic Production of Grain (in MT) 7,633,784 10,481,874 10,409,353 8,249,374 10,079,011 8,933,623 10,505,842 10,372,304 7,263,481 11,646,187
Net Domestic Food Supply (in MT, CE) 6,315,190 8,664,865 8,608,739 6,821,534 8,336,333 7,388,008 8,681,680 8,569,907 5,992,512 9,613,647
Imported Food Aid (in MT, CE) 351,694 312,143 321,887 523,006 610,786 1,140,621 660,574 294,668 1,664,079 623,608
Commercial import (in MT, CE) 82,143 72,619 98,684 75,124 120,495 100,432 59,620 85,017 76,973 73,870
Commercial export (in MT, CE) 70,379 67,788 81,586 98,749 70,744 62,410 179,277 183,478 141,722 129,676
Contraband Food estimate (in MT, CE) 11,344 11,344 11,344 11,344 11,344 11,344 11,344 13,045 8,479 4,240
Food Available for Domestic Consumption (in MT, CE) 6,689,991 8,993,183 8,959,068 7,332,260 9,008,214 8,577,994 9,233,941 8,779,159 7,600,321 10,185,687
Total Population Estimate (in 000) 54,649.0 56,372.0 58,117.0 59,882.0 61,672.0 63,495.0 65,344.0 67,220.0 69,127.0 71,132.9
Food Requirement (in MT, CE) 8,761,656 9,037,897 9,317,666 9,600,642 9,887,625 10,179,899 10,476,342 10,777,114 11,082,855 11,404,451
Total food aid (imported and local purchase (in MT, CE) 424,206 439,359 593,559 734,181 1,375,709 911,789 454,527 1,886,048 839,765
Total food aid (imported and local purchase) as % of Food Requirement 4.7 4.7 6.2 7.4 13.5 8.7 4.2 17.0 7.4
Imported food aid (excluding local purchase) as % of Food Requirement 3.5 3.5 5.4 6.2 11.2 6.3 2.7 15.0 5.5
Local purchase (in MT, CE) 111,293.0 117,146.0 69,745.0 122,625.0 234,311.4 250,675.0 159,459.0 221,478.0 215,343.0
Local purchase as % of net Domestic Production 1.3 1.4 1.0 1.5 3.2 2.9 1.9 3.7 2.2
Net Domestic Production as % of Requirement 72.1 95.9 92.4 71.1 84.3 72.6 82.9 79.5 54.1 84.3
Notes: 1. Quantities of edible oil have been multiplied by 2.618 to convert them to cereal equivalent quantities (CE) 2. Net domestic production is assumed to be 83% of gross production 3. Domestic production (Source: CSA), Population (Source: CSA), Food aid and commercial imports (Source: WFP shipping bulletins) 4. The above analysis assumes zero stock change
Source: Agridev Consult, Addis Ababa
26

The main food deficit areas in Ethiopia are located in the southeast, east and northeast.
Consequently, over the years these regions have experienced the greatest levels of food
aid dependency. Around 75% of relief food distributed in Ethiopia is imported, with
the remainder being procured locally or in neighbouring countries. The USA remains
the leading donor of imported food aid, while the EC is the main agency funding local
and regional purchases. The food aid basket comprises a large number of commodities,
including wheat, pulses, fortified blended foods, edible oil, dried fruit, sugar and salt.
Between 1995 and 2002 wheat grain comprised 76% of food grain imports, while
maize and sorghum contributed 7% each (World Bank, 2003).
Until now, food aid has been distributed to Ethiopian households mostly through food-
for-work and other relief schemes. This situation is likely to change in the coming
years, as the country attempts to move away from relief interventions in the context of
annual emergency appeals, to more development-oriented, multi-annual cash-based
safety net programmes aimed at addressing the needs of the chronically food insecure.8
Some agencies, such as the German technical agency (GTZ), the Netherlands Embassy,
and Save the Children (UK), have already moved in this direction. The Government of
Ethiopia intends to scale-up this approach through a cash-based Productive Safety Net
Programme that is currently being developed in partnership with bilateral and
multilateral donors (World Bank, 2004b).
It is hoped that a shift from food to cash distributions will enable beneficiaries to
purchase inputs, food and other items according to their own preferences and thereby
stimulate local market development. An injection of purchasing power into affected
areas will not only generate demand and encourage inflow of goods through market
channels, rather than relief channels, but at the same time will reduce the disincentive
effects for agricultural producers that are associated with in-kind imports.
Nevertheless, creating local purchasing power may not be sufficient to overcome
constraints to commodity movements based on geographical, logistical, climatic and
security constraints issues.
However, it remains to be seen whether the ambitious time-scale for implementation of
the Productive Safety Net Programme will enable a smooth transition towards cash
8 Vulnerable households outside the safety net will continue to be assisted under the existing annual emergency food aid appeal system.
27

transfers. This is an area of concern due to fears that the programme may place an
undue burden on existing management capacity at the lower levels of government. It
remains to be seen how well food markets in the different target areas will cope with
significant injections of purchasing power, and how far it is possible to avoid scenarios
of major price increases and food scarcities. In any case, food aid is certain to
continue playing a significant role until Ethiopia is in a position to meet its food
consumption needs through domestic production and commercial imports.
4.2 Rationale for local food aid procurement
Successive Ethiopian governments have requested donors to change from in-kind
donations to cash contributions and local purchases since the mid 1980s. While some
NGOs and donors have been involved in local and regional procurement of relief food
since the early 1980s9, the major food aid agencies only started moving in that
direction in 1996 and then only after a further request from the government. This
move was prompted by fears that continued high levels of food aid imports following
the 1995/96 bumper harvest would unduly depress local grain prices and discourage
farmers from future investments in cereal production, thus undermining on-going
efforts by the government and development partners to achieve national food security.
The negative impacts of food aid imports are felt disproportionately in surplus
producing regions. Many high-potential agricultural areas in Ethiopia frequently
produce in excess of their own consumption needs even during drought years.10
Continuing cereal price volatility in surplus producing areas is a serious concern.
Significant wheat imports by food aid agencies not only depress the prices paid to
cereal producers in these regions, but at the same time contribute nothing to bridging
the gap between surplus and deficit areas within the country.
9 Examples include Australian Agency for International Development, FARM Africa, GTZ, the Netherlands, Norway, Save the Children and REST. 10 Major sorghum surplus producing areas include Homera in Deloitte Emerging Markets and NRI; North Gondar, North Shoa and South Wollo in Amhara; and West Shoa, West Wellega and West Hararghe in Oromyia. Gojam in Amhara is a major producer of maize and teff. Agewawie in Amhara and Jimma, West and East Shoa, and Arssi in Oromyia are other very significant maize surplus growing regions. East Gojam, North Shoa, North Gondar, and South Wollo in Amhara; West and East Shoa and Arssi in Oromyia; and Hadiya in SNNPR are major wheat supplying regions.
28

The review of the 1996 local purchase programme demonstrated that the average costs
of locally procured grain were below landed import costs. It was also concluded that
costs could have been further reduced (Wolday Amha et al., 1997). More recently,
other local procurement activities, by EuronAid in particular, have demonstrated that
the costs of local purchase in such a poorly integrated market can still be less than the
costs of inter-continental supply. The accepted view of those agencies involved in
local procurement is that cost savings of around 25 to 30% can be expected when
compared to landed costs of imports.
Over the last 20 years, local procurement has developed as a cost-effective means of
sourcing a range of appropriate types of food, being both cheaper and faster than the
alternative of importing food aid commodities from donor countries and the
international market. Its potential to provide some degree of support to cereal prices
and stimulate agricultural development is also widely recognised, e.g. Anon (1999),
SIDA et al., (2004 and 2005). However, it is necessary to recognise that the timing of
announcements of local procurement is important: too early and it could lead to rapid
or immediate price rises; too late and it may be difficult to find enough grain.
Local procurement in Ethiopia has been particularly successful because donors and
relief agencies have been able to draw down their immediate requirements from
government reserve stocks against a commitment to replay and this has invariably been
from subsequent local purchase. Hence, the maintenance of an emergency food
security reserve in Ethiopia has greatly facilitated the implementation of local and
regional purchases. Since 1992 the reserve has been managed by EFSRA. Food aid
agencies can borrow in-kind from the reserve at short notice, and are therefore able to
initiate grain distributions before organising replacement supplies through local and
regional procurement contracts. This support from the EFSRA allows the subsequent
procurement exercises to be undertaken in a programmed and market sensitive manner.
The EFSRA requires borrowers to pledge repayments within an agreed time. The fact
that the EC previously defaulted on repayment of loans for around 18-24 months
meant that the EFSRA faced a real crisis during a recent drought and there was a huge
outcry from the donor community (including the EC) about the near failure of the
reserve. The ability to borrow from the very efficient EFSRA has largely, offset the
consequences of the complicated bureaucratic procedures of donor agencies, which are
partly linked to the fact that cash allocations are made on an annual rather than multi-
29
annual basis, and are a common source of delays in tendering processes. This problem
was particularly evident in the case of the EC, the main donor agency funding local
procurement operations in Ethiopia.
Additionally, there are various procedural sources of delay: donors’ slow and
centralised procurement procedures (WFP requires tenders over a certain size to be
approved in Rome, EuronAid in Brussels. These delays are frequently countered by
the availability of food aid reserve stocks held and managed by the Ethiopian Food
Reserve Administration.
All strategic grain reserve managers need to ensure that their stocks remain in good
condition. Quality assurance becomes progressively more difficult as grain stocks age.
Replacing old stock with newly harvested grain can have cost and logistical
implications. Therefore, managers of reserve stocks normally respond positively to
requests for loans of grain because it assists in the rotation of the stock. Nevertheless,
it is necessary for the EFSRA to ensure that the grain received as loan repayment is of
a satisfactory quality for long-term storage. This is a key point because some relief
agencies do not have adequately trained food aid commodity procurement specialists
with technical understanding of grain quality issues and there have been many
instances of poor quality food aid grain being purchased. Repayments of grain that are
refused by the EFSRA can only be accepted after further drying and/or cleaning and
fumigation at cost to the relief agency.
The repayment of loans to EFSRA may not always be straightforward. Loan stocks
may be drawn down for local use from warehouses in, say, Kombolcha and repayment
would normally be expected at the same EFSRA warehouse. However, local
purchases may eventually be made in the south of the country thus involving long
transport routes (though admittedly not as long as with imported stocks). Similarly, if
EFSRA warehouse space is at a premium when agencies are procuring locally to repay
loans this may lead to extended delivery routes and higher than expected transport
costs.
4.3 Agencies involved in local procurement and co-ordination
In Appendix 2, we provide a short history of local procurement in Ethiopia. The early
activities, and much of the associated learning process, is tied up with the activities of
REST which, starting in 1983, bought food in food surplus areas of Tigray to feed
people in deficit areas (Smith, 1983). A crop assessment system was developed to
30

assist in planning of purchases. After two decades of experience, REST claims to have
developed good relations and purchasing networks with producers and mid-level grain
traders and this has assisted the smooth implementation of procurement activities.
The first half of the 1990s saw Australia and New Zealand supporting REST’s
activities, with a deliberate agenda of using local procurement as a development tool.
In 1996, in response to government appeals to donors, the EC initiated a local
procurement programme. In subsequent years a more widespread programme was
introduced through its Ethiopia Food Security Unit and through EuronAid11. Since
then the EU and its member states have made increased financial resources available
for local purchases of relief food. The Ethiopian Government, through the Disaster
Preparedness and Prevention Commission (DPPC), the World Food Programme (WFP)
and EuronAid are the main parties making these purchases on a regular basis. DPPC is
now the leading agency, accounting for 37% of all cereal purchases since 1996 while
WFP and EuronAid accounted for 26 and 17% respectively. Other agencies such as
GTZ and Save the Children (UK) have also procured food locally for their relief
activities, albeit on a more infrequent basis (Table 4.3).
The EU (including member states) is the leading financial contributor accounting for
48% of the total quantity purchased in the country since 1996, and 56% in 2004.
Significantly, food aid procurers are the largest buyers of grain in Ethiopia in what can
be a very thin market (World Bank, 2003). It is understood that even in good years
only 28% of the grain harvest is marketed.
The agencies involved in local procurement are conscious of the need to avoid
purchasing excessive quantities for fear of inflating source prices and distorting
markets. To this end an annual Cereal Availability Study, based on the REST model,
was initiated in the late 1990s, and is now implemented every year to inform decisions
regarding the quantity and type of grains available to be purchased locally. This
assessment is currently sponsored by the EC, WFP and the Swedish International
Development Agency (SIDA). Extracts from the most recent Cereal Availability
Study are shown in Appendix 3.
31

Co-ordination amongst the concerned agencies is critical to ensure timely and smooth
delivery of locally produced commodities, minimise undue disruption of local markets,
and contract default by suppliers. Co-ordination used to be carried out under a Local
Procurement Steering Committee that involved all major stakeholders, but this forum
was disbanded in 2002, apparently due to changed priorities by DPPC, which has the
mandate to lead local procurement operations. As a result, co-ordination is now
undertaken in a more ad hoc and less structured manner, through WFP’s logistics and
procurement co-ordination meetings and bilateral meetings. The absence of formal co-
ordination is almost certainly one of the contributory reasons for the poor quality of
some of the available data. However, it does not fully explain why different parts of
one of the large food aid agencies can issue conflicting information on types and
volumes of food aid distributed in Ethiopia.
11 EuronAid is an association owned and controlled by European NGOs active in the field of food aid and food security. It facilitates access by NGOs to institutional donors, mainly the EC, and provides a forum for exchanging information and sharing experiences.
32
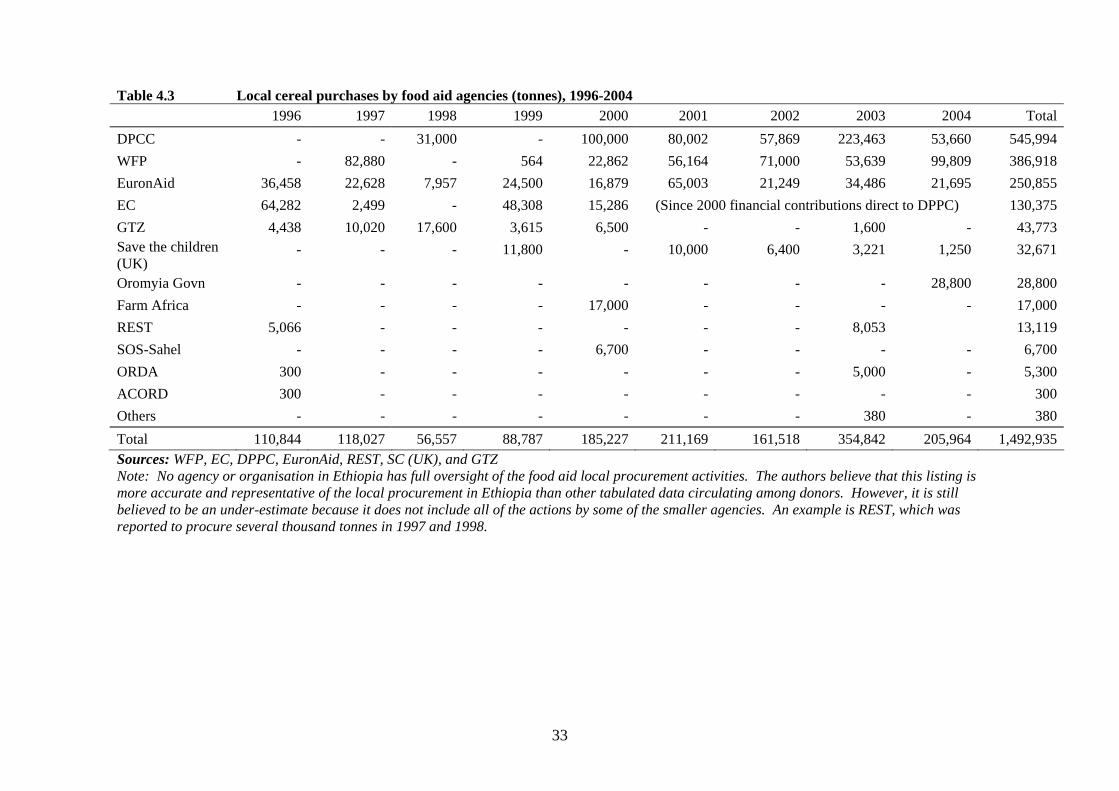
Table 4.3 Local cereal purchases by food aid agencies (tonnes), 1996-2004 1996 1997 1998 1999 2000 2001 2002 2003 2004 TotalDPCC - - 31,000 - 100,000 80,002 57,869 223,463 53,660 545,994WFP
- 82,880 - 564 22,862 56,164 71,000 53,639 99,809 386,918EuronAid 36,458 22,628 7,957 24,500 16,879 65,003 21,249 34,486 21,695 250,855EC 64,282 2,499 - 48,308 15,286 (Since 2000 financial contributions direct to DPPC) 130,375 GTZ 4,438 10,020 17,600 3,615 6,500 - - 1,600 - 43,773Save the children (UK)
- - - 11,800 - 10,000 6,400 3,221 1,250 32,671
Oromyia Govn - - - - - - - - 28,800 28,800 Farm Africa - - - - 17,000 - - - - 17,000 REST 5,066 - - - - - - 8,053 13,119SOS-Sahel - - - - 6,700 - - - - 6,700ORDA 300 - - - - - - 5,000 - 5,300ACORD 300 - - - - - - - - 300Others - - - - - - - 380 - 380Total 110,844 118,027 56,557 88,787 185,227 211,169 161,518 354,842 205,964 1,492,935Sources: WFP, EC, DPPC, EuronAid, REST, SC (UK), and GTZ Note: No agency or organisation in Ethiopia has full oversight of the food aid local procurement activities. The authors believe that this listing is more accurate and representative of the local procurement in Ethiopia than other tabulated data circulating among donors. However, it is still believed to be an under-estimate because it does not include all of the actions by some of the smaller agencies. An example is REST, which was reported to procure several thousand tonnes in 1997 and 1998.
33

4.4 Types of locally procured food aid
Local food aid purchases in Ethiopia comprise mostly cereals, blended cereal foods
known locally as faffa and famix, beans, salt and fortified biscuits (Table 4.4). Maize,
wheat and sorghum are the focus of local procurement, accounting for more than 90
percent of total tonnage. This not only reflects the importance of cereals in the local
diet and the availability of marketable surpluses in many parts of the country, but is
also a consequence of product characteristics, namely affordability, familiarity and
storability. Maize is much cheaper than wheat or sorghum and accounts for
approximately 55 percent of total cereal purchases. Some agencies such as WFP and
ICRC decide on which varieties of commodities, such as beans, to procure depending
on prevailing market price.
The availability of sorghum and maize from local procurement, as opposed to the
wheat, which comprises most of the grain imports, provides the opportunity to target
grain types that are most preferred by beneficiaries.
Teff (Eragrostis tef) is traditionally a very important staple cereal in Ethiopia, but cost
considerations have generally led relief agencies to exclude it from the locally
procured commodity basket, although GTZ was able to procure 7,225 tonnes during
1998-2000 in South Gondar, Amhara Region. Fortified blended foods and beans are
procured because of their rich nutritional content and the contributions they can make
to a balanced diet.
34
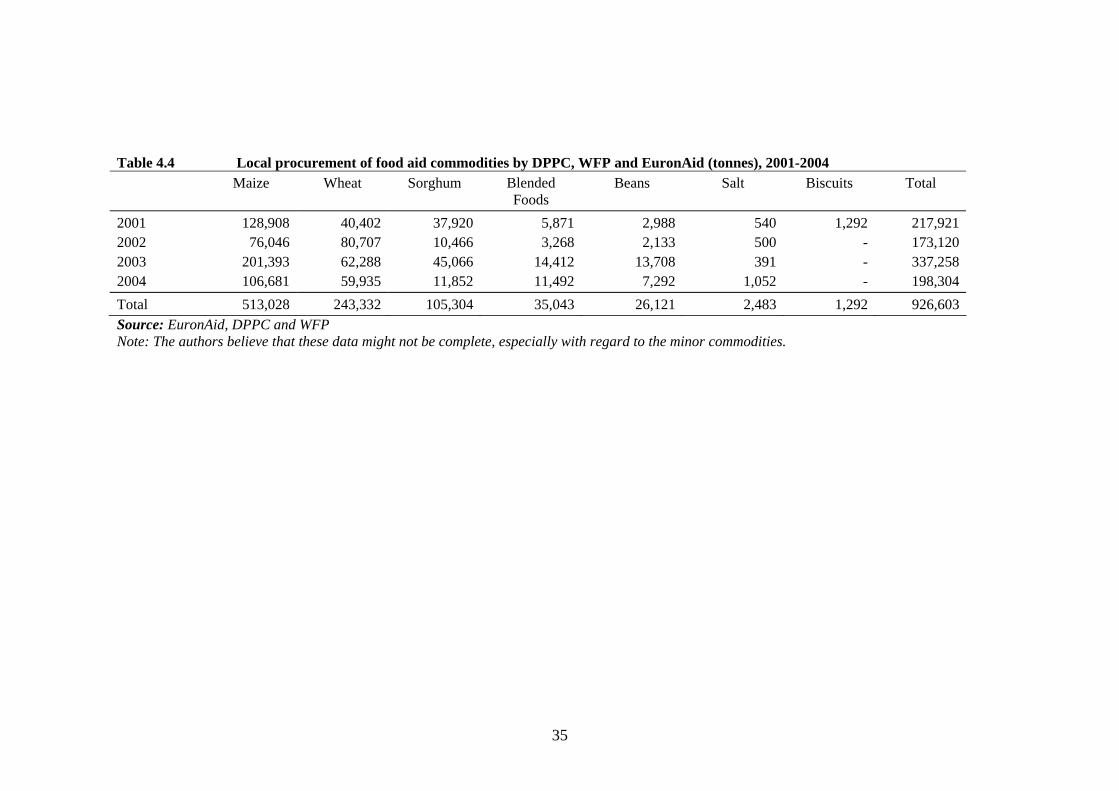
Table 4.4 Local procurement of food aid commodities by DPPC, WFP and EuronAid (tonnes), 2001-2004 Maize Wheat Sorghum Blended
Foods Beans Salt Biscuits Total
2001 128,908 40,402 37,920 5,871 2,988 540 1,292 217,9212002
76,046 80,707 10,466 3,268 2,133 500 - 173,1202003 201,393 62,288 45,066 14,412 13,708 391 - 337,2582004 106,681 59,935 11,852 11,492 7,292 1,052 - 198,304Total 513,028 243,332 105,304 35,043 26,121 2,483 1,292 926,603Source: EuronAid, DPPC and WFP Note: The authors believe that these data might not be complete, especially with regard to the minor commodities.
35
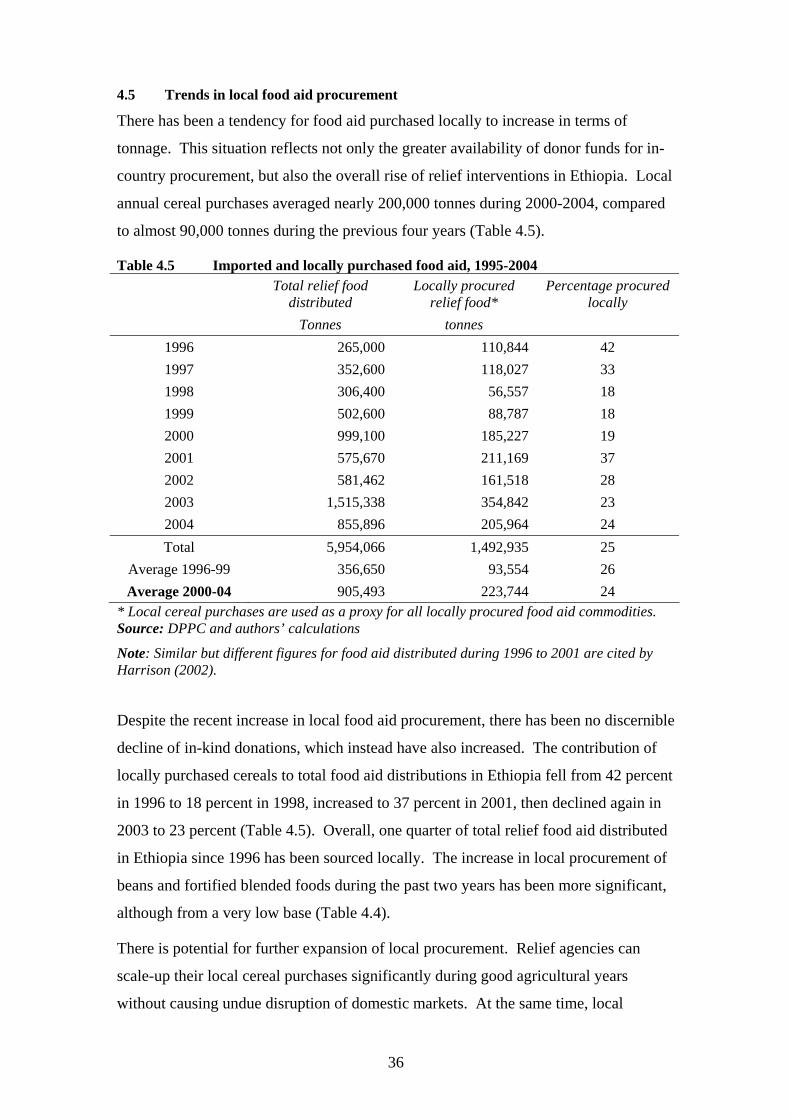
4.5 Trends in local food aid procurement
There has been a tendency for food aid purchased locally to increase in terms of
tonnage. This situation reflects not only the greater availability of donor funds for in-
country procurement, but also the overall rise of relief interventions in Ethiopia. Local
annual cereal purchases averaged nearly 200,000 tonnes during 2000-2004, compared
to almost 90,000 tonnes during the previous four years (Table 4.5).
Table 4.5 Imported and locally purchased food aid, 1995-2004 Total relief food
distributed Tonnes
Locally procured relief food*
tonnes
Percentage procured locally
1996 265,000 110,844 42 1997 352,600 118,027 33 1998 306,400 56,557 18 1999 502,600 88,787 18 2000 999,100 185,227 19 2001 575,670 211,169 37 2002 581,462 161,518 28 2003 1,515,338 354,842 23 2004 855,896 205,964 24 Total 5,954,066 1,492,935 25
Average 1996-99 356,650 93,554 26 Average 2000-04 905,493 223,744 24
* Local cereal purchases are used as a proxy for all locally procured food aid commodities. Source: DPPC and authors’ calculations
Note: Similar but different figures for food aid distributed during 1996 to 2001 are cited by Harrison (2002).
Despite the recent increase in local food aid procurement, there has been no discernible
decline of in-kind donations, which instead have also increased. The contribution of
locally purchased cereals to total food aid distributions in Ethiopia fell from 42 percent
in 1996 to 18 percent in 1998, increased to 37 percent in 2001, then declined again in
2003 to 23 percent (Table 4.5). Overall, one quarter of total relief food aid distributed
in Ethiopia since 1996 has been sourced locally. The increase in local procurement of
beans and fortified blended foods during the past two years has been more significant,
although from a very low base (Table 4.4).
There is potential for further expansion of local procurement. Relief agencies can
scale-up their local cereal purchases significantly during good agricultural years
without causing undue disruption of domestic markets. At the same time, local
36

blended food manufacturers have considerable spare capacity and could easily supply
larger tonnages to relief agencies. Between 2001 and 2003, local purchases of blended
foods accounted for only 15 percent of international donations (Table 4.6). Greater
reliance on local sourcing would enable Ethiopian suppliers to exploit economies of
scale and would provide an incentive for further investment in processing industries to
take increased advantage of opportunities for regional procurement of blended foods.
Table 4.6 Imported and locally purchased blended food, 2001-2003 Year Blended food
donations tonnes
Locally procured blended foods*
tonnes
Percentage locally procured
2001 40,536 5,871 14.5% 2002 11,502 3,268 28.4% 2003 105,711 14,412 13.6% Total 157,749 23,551 15.0%
*Only includes purchases by WFP and EuronAid. Source: WFP and EuronAid
4.6 Regional procurement
Local procurement can be accomplished by national NGOs. However, they are not
well placed to undertake regional procurement, which requires larger organisations
such as WFP and EuronAid with representations and political connections in the
country of procurement and the country of delivery.
The improved political relationship between Ethiopia and Sudan has been conducive to
food aid commodities procured in Sudan being supplied to Ethiopia and vice versa. In
2003, there was a need for sorghum food aid to be distributed in north western
Ethiopia. A joint initiative by the EU and EuronAid delegations in Khartoum and
Addis Ababa resulted in over 24,000 tonnes of white sorghum being borrowed from
national reserves in Gedaref in eastern Sudan and moved over a newly constructed
road to Woretta in Ethiopia. Between May and September 2003, there were a total of
1,144 truck movements over a distance of 445 km (Smalbruch and Walker (2004).
The sorghum loan was subsequently repaid following an EU funded local procurement
exercise in Sudan. This initiative by the EU and EuronAid was the most significant
cross border movement of food aid between these two countries since 1991 when
REST had a cross border operation to supply Tigray with 79,496 tonnes of food aid.
37

Similar operations might be possible by drawing on stocks from EFSRA for supply to
Sudan. There have been significant movements of locally procured food aid out of
Ethiopia. Information on regional procurement in Ethiopia is poorly documented, but
it is reported by manufacturers that a quantity of fortified blended food was sent from
Addis Ababa to Rwanda and Burundi in the 1990s. In late 2004, WFP co-ordinated a
significant movement of food aid to Sudan. A total of 4,000 tonnes of fortified
blended food was purchased from the three manufacturers in Addis Ababa and air
freighted to Darfur in western Sudan. The improved political relationship between
Ethiopia and Sudan could pave the way for further regional procurement. It is also
understood that WFP procured 2,000 tonnes of beans to supply Kenya through Moyale
in 2004. In the same year, the ICRC tendered in Ethiopia for the supply of 600 tonnes
of beans to Sudan, and in 2005 it tendered for the supply of 6,100 tonnes of sorghum
for Darfur.
4.7 Local procurement procedures
Food aid agencies normally procure using a tendering procedure, the details of which
are often dependent on the source of the funding. The details differ between agencies
but commonly the main activities include advertising, tendering against specific
quality and packaging criteria, submission of bid bonds, and submission of
performance bonds.
At least six donor organisations are involved in local food aid procurement in any
given year. Nearly all tenders are placed with medium or large traders. In principle,
both WFP and EuronAid would favour procuring from co-operatives but in practice,
such organisations have limited capacity, have trouble in putting up the bid and
performance bonds, and tend to lack experience in making stock available to schedule.
Some co-operatives submit uncompetitive bids, perhaps because they are not familiar
with reading the market conditions.
Experience on contractual default varies. EuronAid and Save the Children (UK) have
never needed to cash a bid bond. ICRC has only once had to call in a performance
bond in its last 60 contracts, and has only twice invoked penalty clauses in the contract.
However, WFP reports that it has cashed many performance bonds.
Transport of the grain is the subject of a separate tendering procedure.
38

WFP
WFP makes ready use of stocks drawn from EFSRA for immediate distribution and
then later repays the loans by local/regional procurement or international import. The
quantities of commodities procured by WFP are reported differently depending on the
sources in Ethiopia, but using the figures in Table 4.3, they have averaged over 60,000
tonnes annually over the past five years. This quantity is testimony to the fact that
local procurement is cheaper than importation, WFP reports that it only purchases
locally when costs are less than the landed price of imports at Djibouti. Although,
there are exceptions where time is of the essence, this is good proof of the cost
advantages of local purchase of cereals and beans in Ethiopia. There are always
surpluses in Ethiopia with potential suppliers constantly looking to supply WFP.
The WFP procures locally by issuing tenders that invite bids from a restricted list of
around 25 pre-qualified suppliers, of which 8 are reported to be of a reasonably small,
but undefined size. The tender will normally indicate type of commodity required,
quantity, quality specifications, packing and marking, and place of delivery for the
whole consignment or sub lots. Minimum lots sizes could be as little as 500 tonnes.
Whilst bids are not necessarily required to be from a stock position, the required
response times can be minimal. For example, the tender inviting bids for the supply of
white haricot beans issued on 27 December 2004 required bids to be received at the
WFP office Addis Ababa by 4 January 2005. Bidders were not invited to the opening
ceremony but were required to sign contracts within three days of notification of their
bids being accepted. Delivery of the beans was expected to begin on 21 January 2005.
Bids are required to be valid for 30 days and should be accompanied by a bid bond for
3% of the contract value, valid for 60 days after the closing date of the tender. Should
the successful bidders fail to sign the contract within seven days of being notified of
the acceptance of their offer, or should the bidder withdraw from the bid process, WFP
will be entitled to collect the amount of the bid bond. When signing the contract the
bidder is required to submit a performance bond valued at 5% of the contract value.
WFP Addis Ababa has reported few problems with quality, other than occasional
insect infestation. The main issue with suppliers tend to be contractual over timing,
packaging and markings.
39

EuronAid
EuronAid procurement, normally following a draw down and distribution from the
EFSRA, is by open tender, i.e. anyone can make a bid without having first been put on
an approved list. The tender is advertised locally in Ethiopian newspapers and on the
main EuronAid website approximately two weeks prior to the closing date. Terms and
conditions are similar to those operated by WFP except that the bid bond is for 5% of
the contract value, and the performance bond is for 10% of the contract value.
Additionally, the EuronAid contract stipulates the penalty for late delivery for reasons
other than force majeure as 1/1000 (one per thousand) per day of the value of the
goods supplied after the due date. If commodities narrowly fail to meet quality
specifications, for moisture content and other quality criteria, then penalties rather than
rejection may apply. Minimum lot sizes are commonly around 400/500 tonnes to
encourage small suppliers, but with little success. The opinion of the EC delegation in
Addis Ababa was that procurement lots should be no smaller than 500 tonnes so as not
to disrupt the trade pyramid. Bids are opened by an EU committee in the presence of
candidate suppliers. The necessity of obtaining approval from The Hague at various
stages in the process can result in unavoidable delays.
A physical check is made on the stock position of the preferred tender; the supplier
must have 100% or sometimes 75% of the grain in stock. Grain dealers reported that
delivery is a major business risk and that, because of logistical and infrastructural
problems, they sometimes incur a financial loss. Quality is checked at the time of
loading by representatives of EuronAid and then again by EFSRA staff at arrival at the
reserve warehouses.
ICRC
The ICRC tenders against a list of registered grain dealers. In January 2005 there were
12 companies on the list. ICRC report that they do not use public tenders because of
the additional staff time needed to process them. There is a preference to split large
tenders into lots of around 2,500 to 3,000 tonnes. A few contracts have been offered in
lots of 700 tonnes but this is done with reluctance because of the increased
administrative workload. Potential bidders have two weeks to respond to invitations
and are required to submit physical grain samples with their bid. Presumably, ICRC
has procedures in place that prevent the presentation of exceptionally good samples
40

followed by the delivery of poorer quality stocks. The performance bond ranges from
2 to 4% depending on the size of the contract. The ICRC calculates that local
procurement is around 25% cheaper than imported food aid. Transport is sometimes
undertaken by ICRC trucks. ICRC has the advantage over other food aid procurers in
that it has in-country funds. Hence, it does not suffer from the funding related delays
experienced by WFP and EuronAid.
Save the Children (UK)
Borrows from the EFSRA. Both open and restricted tenders are used for minimum
lots of 1,000 to 2,000 tonnes. It considers this size is supportive to small suppliers and
also makes the management of contracts more realistic. It procures from a 100% stock
position and uses cargo superintendents to monitor the quality and delivery
performance. The bid bond is 2% and the performance bond is 6%.
GTZ
GTZ began procuring small lots of 10 and 20 tonnes in 1994 in western Tigray. At
that time it was difficult to find any large producers or active traders. In 1995, when
requirements increased to 3,000 tonnes it was necessary to procure using traders based
in Addis Ababa and Nazareth. Lot sizes ranged from 50 to 100 tonnes and up to 60
traders and 5 co-operatives were involved. Many of them did not know how to tender.
Staff of GTZ admitted that the administration of these small contracts was demanding
but they witnessed the growth and development of the traders concerned and
considered that good development impact had been achieved.
REST
REST encourages small to medium traders by inviting a relatively large number of
merchants to supply at the lowest price quoted for the area, provided this does not
conflict with competitive pricing or efficiency. Small lot sizes are also stipulated to
promote the entry of smaller traders in the grain market.
41

4.8 Quality standards for locally procured grain
It is understood that there were problems with the quality of grain procured in Ethiopia
in the 1990s, particularly for the EC. However, the consensus of opinion is that these
difficulties have been overcome and most procurements now conform to the quality
standards set out in the tender contracts.
Grain traders check the quality of grain and assess whether it is dry enough by simply
looking at and handling the grain. They are confident that they are able to determine
correctly the quality of any type of grain offered, based on their experience. They
commonly identify the following as important quality characteristics: moisture content,
damaged shrivelled and wrinkled grains, and foreign matter. These are in fact the
characteristics used in grading of grain by the EFSRA and are perhaps an indication
that they have been involved in the supply of grain to the reserve (through local
procurement programmes).
EGTE has its own quality guidelines for purchasing grain, loosely based on standards
set by the old Ethiopian Standards Authority (now the Quality and Standards Authority
of Ethiopia, QSAE). EGTE commonly uses purchase specification as follows:
Moisture content 12.0% max. Foreign matter 1.0% max. Damaged, shrunken, weevilled and broken grains 3.0 - 5.0% max. Contrasting classes (Other coloured grains) 3.0% max.
These limits might be relaxed if there is a danger that the specification would result in
an insufficient volume of grain being purchased. The limits for damaged, shrunken,
weevilled and broken grains varies according to the type of grain, the year of
production and the season in which grain are purchased. Similarly, the limit for
contrasting classes might be relaxed if the main concern was to purchase a large
quantity of grain. For example, it was suggested that grain destined for food aid within
Ethiopia would not need to have a restriction for contrasting classes (i.e. other
coloured grains).
Some major companies involved in the grain trade are reported to have their own
quality specialists, equipped with moisture meters and testing equipment. They have
their own quality standards, again based loosely on the old national standards.
42

However, in reality the assessment of quality is on often undertaken with criteria
similar to those used by EGTE.
Food aid quality specifications used by WFP and EC-LFSU, although reportedly
derived from early European standards, are more likely to have their origins in the
standards used by EGTE and EFSRA. The ICRC is understood to procure to quality
standards similar to those set by the Ethiopian Bureau of Standards.
The QSAE has recently published new standards for maize, wheat and sorghum but
their existence is not widely known. These standards set limits for a wider range of
quality factors but are generally comparable to the specifications used by WFP and
EFSRA (see Appendix 3 for details and comment).
4.9 Local suppliers of food aid
Grain
The number of grain suppliers selected annually through local procurement tenders of
DPPC, WFP, EuronAid and Save the Children (UK) has averaged about 12 in three of
the past four years, although the average increased to 17.3 in 2002 (Table 4.10). There
is a lot of variation in the annual share of the business handled by the three largest
suppliers. For the WFP and EuronAid tenders it averaged 61 to 62%. Whilst for
DPPC it was much lower, typically 30 to 30% with a low of 11%.
Table 4.10 .Number of grain suppliers and levels of concentration, 2001-2004 2001 2002 2003 2004 Number of suppliers DPPC WFP EuronAid Save the Children (UK) (Mean)
12 11 21 8
(13.0)
35 8
22 4
(17.3)
20 15 13 2
(12.5)
14 21 12 1
(12.0) % Share of the three largest suppliers DPPC WFP EuronAid Save the Children (UK)
35 66 53 40
39 76 59 94
11 49 63 -
32 58 68 -
Sources: DPPC, WFP and EuronAid.
43

Interestingly, most local companies supplying food aid agencies have limited
involvement in the day-to-day grain trade. Their focus is on the local food aid market,
although some may also supply wheat to flour mills as part of a diversified business
portfolio, which may include activities such as commercial farming (Deloitte
Emerging Markets and NRI, 2003). This suggests that the barriers to participation in
food aid tenders are too high for the typical grain wholesaler, who generally lacks the
size and organisation to comply with the minimum tonnage requirements, the strict
delivery schedules, the product specifications of relief agencies and the contractual
terminology. The possibility of financial losses due to adverse price movements and
the imposition of financial penalties in case of non-compliance with contract clauses
may also act as deterrents.
Blended foods
The production of blended cereal foods in Ethiopia began in 1960, at a small SIDA-
funded unit in the Princess Tsehai Hospital, Addis Ababa, as dietary supplements for
children with nutritional deficiencies. The unit developed into a government owned
commercial unit known as Faffa around the time of the 1973 famine when it was
expanded and moved to its present industrial site in Addis Ababa. The original
production was evenly balanced between standard baby food compounds for retail sale
and the supply to the relief agencies of specially compounded emergency relief
blended food. Currently, the company produces around 90% for food aid and 10% for
standard baby food outlets.
The Faffa Company produces two products for the relief agencies, i.e. faffa, which is
based on wheat, and famix, which is based on maize. The former is more expensive
and preferred in the highlands; the latter is cheaper and preferred in the lowlands. A
typical composition of faffa is 57% wheat flour, 18% defatted soya, 10% chickpea, 8%
sugar, 5% dried skimmed milk, 1% iodised salt, 1% vitamins and minerals. The
powdered milk and vitamins are imported. All the other components are procured
locally by open tender in the newspapers. Recently Faffa has started negotiating with
emergent co-operatives for the supply of raw commodities. There is a strong emphasis
on quality; to which the local suppliers are understood to have responded satisfactorily.
Soya is not a common crop in Ethiopia and it is probable that the production of
blended food for relief programmes has had a significant impact in increasing and
44

sustaining annual production. According to FAOSTAT, production grew from 21,000
tonnes in 1994 to 27,000 tonnes in 2004.
Faffa employs around 300 staff for both food aid and baby food production. Average
annual production of relief food exceeds 7,000 tonnes at a reported value of around US
$3 million (Table 4.11). The emphasis on food aid causes the annual volume of
business to vary widely.
Table 4.11 Sales of blended food aid commodities by Faffa Food S.C., Addis Ababa, Ethiopia
1999-2000 2000-2001 2001-2002 2002-2003 2003-2004
Product Type
Tonnes Value (‘000 Birr)
Tonnes Value (‘000 Birr)
Tonnes Value (‘000 Birr)
Tonnes Value (‘000 Birr)
Tonnes Value (‘000 Birr)
Famix 7,947 27,811 7,092 27,589 3,517 10,778 9,232 36,560 5,887 22,399Faffa 1,575 8,734 - - 4 22 920 5,011 133 782Total 9,522 36,545 7,092 27,589 3,521 10,800 10,152 41,571 6,020 23,181 Source: Faffa Foods S.C. Note: Dates are conversions from the original Ethiopian calendar, e.g. July 2003-July 2004 approximates to Ethiopian calendar year 1996. Exchange rate: US $1.00 = Ethiopian Birr 9.0422 on 3 March 2005
The other large producer of blended food aid is the private East African Group (Eth)
Ltd, which began to produce baby food in 2001 and started to produce Unimix in
October 2002. Unimix constituents vary, but in Ethiopia it is typically based on maize
and soya, with a nutritional profile claimed to contain 10-12% protein, 6-8% fat and
68-70% carbohydrate (somewhat similar to corn soya blend). The formula for WFP
contains no sugar; other purchasers commonly request 5% sugar. As with Faffa, this
company sources most of its commodities from local farmers and traders, often using
its own vehicles. It has supplied over 15,000 tonnes to the food aid sector in Ethiopia
during 2003 and 2004. The company has produced high-energy food aid biscuits since
1999 and reports sales of 8,200 tonnes to WFP in 1999-2000, and 25,000 tonnes to the
wider relief sector in 2003-2004. Kaliti Food Co. also supplied WFP with biscuits;
production levels have been modest but since they were first produced in 1998,
approximately 1,400 tonnes were supplied annually at least until 2000. East Africa
Group (Eth) Ltd is in contact with a Norwegian church agency to supply Sudan via
Djibouti. Unimix is processed to order having a stated shelf life of 6 months. The
biscuits are understood to have a shelf life of 9 months. Owing to the relatively short
45

shelf life of these blended foods, the manufacturers tend not to carry much stock and
produce to order.
At times of heavy demand in Ethiopia, Faffa and the other manufacturers work at full
capacity. At other times there is spare capacity, so all four companies would be
interested in supplying regional markets. Total national production capacity is
reported to be 200 tonnes per day (Government of Ethiopia and Humanitarian Partners,
2004), although it is doubtful that information on all local production of blended foods
and high-energy biscuits is fully reported in centralised statistics on food aid in
Ethiopia.
46

5 Impact of Local Food Aid Procurement in Ethiopia 5.1 Impact assessment
It should be noted that whilst the major food aid agencies recognise the need for
assessing the impact of food aid supplied to beneficiary communities, they do not
appear to have recognised the need for impact assessment in the local or regional
source markets. Exceptions to this deficiency in Ethiopia are REST and possibly one
or two other NGOs. The absence of such impact assessments represents a significant
inefficiency in the management of food aid systems and needs to be addressed if the
development impacts are to be fully measured, understood and monitored.
5.2 Grain price stability
Since 1996, local food aid procurement has injected extra purchasing power into rural
food markets, equivalent on average, to 12% of total marketed surplus for the three
leading cereal crops, i.e. maize, sorghum and wheat. There can be little doubt that this
has had an overall positive impact on rural welfare in Ethiopia, by supporting producer
prices, creating employment through the value chain, and multiplier effects within the
economy at large.
The figures in Table 5.1 suggest that local purchase may not have contributed to the
stability of prices between years, since there has been no clear relationship between the
level of local purchase and estimated marketed surpluses of the above-mentioned crops.
Indeed local purchase was by far the highest in the year with the lowest surplus (2003).
The high level of procurement in the latter year suggests food aid donors may have
reacted in a delayed and untimely fashion to the low and unremunerative prices of
2001 and 2002.
If procurement is well timed and quantities are inversely related to the marketable
surplus situation, local purchase will contribute to the stability of prices in the country
(see reasoning in Box 1). However for this to happen, local procurement needs to be
scaled right down in years of deficit and the country should rely on imported food.
This finding is supported by work for the World Bank by Harrison (2002). Using a
simple spreadsheet model to simulate the impact of grain price stabilisation, he found
that in a bumper year, 100,000 tonnes of locally procured food aid would increase
wholesale prices by 4% and farm gate prices by 9%.

It would clearly be most beneficial if local purchases were greater in years with large
surpluses. Such a purchasing pattern would in effect be a form of public price
stabilisation and could, if sufficient funding were available, ultimately involve a
degree of stockpiling or pre-positioning. The EFSRA provides an effective and well
managed mechanism for holding reserve stocks. However, although there has been
some debate within Ethiopia and EFSRA in particular about EFSRA becoming a price
stabilisation agency, this has so far been resisted.
48

Table 5.1 Local cereal purchases in Ethiopia and their share of domestic production and marketed surplus 1996-2004
Year Production of maize, sorghum
and wheat*
‘000 tonnes
Estimated marketed surplus**
‘000 tonnes
Share of local purchases in relation to production
%
Share of local purchases in relation to
marketed surplus
% 1996 5,485 1,536 2.0 7.1 1997 5,619 1,573 2.1 7.4 1998 5,105 1,429 1.1 4.0 1999 4,809 1,347 2.0 7.0 2000 4,919 1,377 3.8 13.5 2001 6,247 1,749 3.4 12.1 2002 5,791 1,621 2.7 9.7 2003 3,900 1,092 8.9 31.8 2004 6,942 1,944 3.0 10.6
* Annual production in Ethiopia falls across two calendar years, as the main harvest occurs in November and December and the secondary harvest in April and May. Because most production is marketed and consumed in the second year, we take this as the reference year. For example, 1996 is used as the production year for the 1995/96 harvest. Over the past nine years, maize has averaged 47% of production of these three crops, sorghum 28% and wheat 25%. ** Based on analysis of the 1998 data, it is assumed that 28% of the maize, sorghum and wheat crops are sold in the market. In reality, the marketed share varies between years and across cereal commodities. Source: DPPC and authors’ calculations
BOX 1: HOW LOCAL PURCHASE CAN CONTRIBUTE TO PRICE STABILITY
Short-run supply elasticities are very low, notably in Ethiopia (Abrar, 2001). Surplus producing smallholders prioritise their own food security and are reluctant to sell more than a part of their harvest. State or commercial farms sell nearly all they produce within the next marketing season. The response of farm prices to individual local tenders will depend mainly on the level of short term demand elasticity, which for staple crops, even in very poor countries, is also known to be low. The effect of local purchase is to increase prices, which, in the view of the low elasticities is likely to be more than proportionate to the level of procurement. Given that this has ranged between 4% and 32% of Ethiopia’s estimated cereal surplus (Table 5.1), we conclude that local purchase can contribute materially to price stability.
Of course, in the long run supply elasticities are considerably higher, even for the smallholders who dominate production in Ethiopia. Farmers in areas with favourable resources will intensify production in response to the more stable and remunerative price regime resulting from local procurement operations, and this may eventually lead to price collapses and generally lower price levels, particularly for maize, a crop which Ethiopia can easily produce in excess of domestic demand. However, even under these circumstances, local purchase can mitigate the level of inter-annual price fluctuation, albeit around a lower equilibrium level.
49
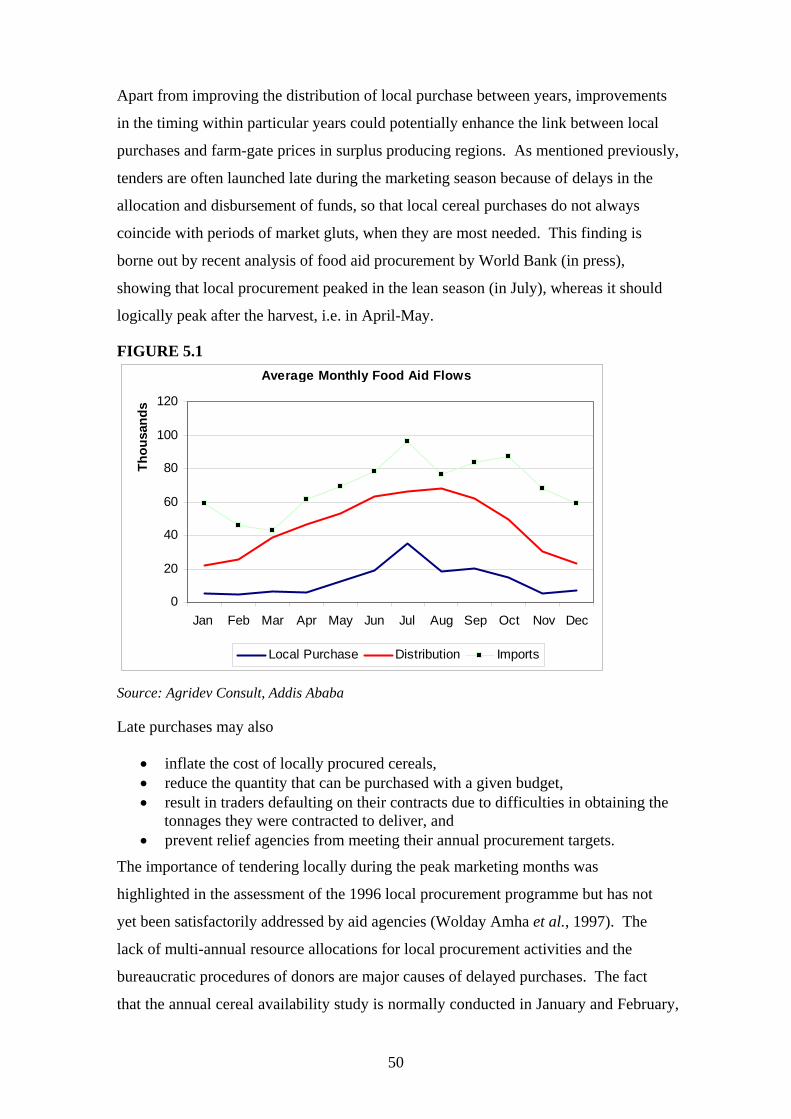
Apart from improving the distribution of local purchase between years, improvements
in the timing within particular years could potentially enhance the link between local
purchases and farm-gate prices in surplus producing regions. As mentioned previously,
tenders are often launched late during the marketing season because of delays in the
allocation and disbursement of funds, so that local cereal purchases do not always
coincide with periods of market gluts, when they are most needed. This finding is
borne out by recent analysis of food aid procurement by World Bank (in press),
showing that local procurement peaked in the lean season (in July), whereas it should
logically peak after the harvest, i.e. in April-May.
FIGURE 5.1 Average Monthly Food Aid Flows
0
20
40
60
80
100
120
Jan Feb Mar Apr May Jun Jul Aug Sep Oct Nov Dec
Thou
sand
s
Local Purchase Distribution Imports
Source: Agridev Consult, Addis Ababa
Late purchases may also
• inflate the cost of locally procured cereals, • reduce the quantity that can be purchased with a given budget, • result in traders defaulting on their contracts due to difficulties in obtaining the
tonnages they were contracted to deliver, and • prevent relief agencies from meeting their annual procurement targets.
The importance of tendering locally during the peak marketing months was
highlighted in the assessment of the 1996 local procurement programme but has not
yet been satisfactorily addressed by aid agencies (Wolday Amha et al., 1997). The
lack of multi-annual resource allocations for local procurement activities and the
bureaucratic procedures of donors are major causes of delayed purchases. The fact
that the annual cereal availability study is normally conducted in January and February,
50

and published in March, well into the peak marketing season, is another contributing
factor. While this allows for a more accurate estimate of the quantities of cereal
available for local purchase, an argument can be made for surveying in November and
December, during the harvesting season. Estimating the availability of cereals based
on evidence from the farm, rather than the stock in the hands of farmers and traders,
may not be ideal from a methodological perspective but would enable food aid
agencies to plan and implement their local procurement activities one or two months
earlier.
The subject of price stabilisation needs to be approached cautiously, since we know
from international experience, that price support and buffer stock mechanisms tend to
become hostage to political pressures, and consequently costly and unsustainable.
While this has been observed in Europe and other wealthy countries, the problem has
proved particularly intractable in developing countries, notably in Africa. Largely
because of the high cost and financial unsustainability of these operations, most
countries are now left with small food security reserves without any role in stabilising
prices (Coulter and Poulton, 2001). An equal problem with public reserves is that of
‘overhang’, whereby the existence of public grain stocks, and/or knowledge of
government intentions to intervene in the market acts as a major disincentive to storage
by private parties. Elsewhere in Africa, private players typically express considerable
uncertainty as to how government will respond. Will it suddenly reduce import duties,
import in its own right, and/or sell stocks at subsidised prices? These hypothetical
events, which reflect the underlying political sensitivity of grain markets, make it
particularly risky for private players to engage in long-term storage. Furthermore, it is
a serious problem, which tends to defeat the object of price stabilisation, given that the
failure of private players to participate in storage exacerbates price instability.
Difficulties of this kind are the norm in many African countries, and should be
considered before attempting to give EFSRA a price stabilisation function in Ethiopia.
One of the reasons why EFSRA has ‘bucked the trend’ and performed well is that it
has served as a politically uncontentious food aid pipeline and not had an explicit role
in price stabilisation. At the same time, success may also be attributed to the effective
management and operation of the organisation. Indeed this feature suggests that it may
be possible to find ways of insulating it from short-term political pressures that could
weaken its operation in a price stabilisation role.
51

Donor policies probably pose a greater constraint to the development of local purchase
as a price stabilisation mechanism. There would need to be funds available for local
purchase at the critical times of the year and strict co-ordination of support for local
purchases and food aid imports; multi annual funding would help. To achieve this
there would need to be thorough reform of food aid management, in particular close
co-operation between the EC and USAID, and major delegation of authority to their
respective offices in Addis Ababa.
5.3 Development of grain marketing systems
With the exception of local food aid procurement and assistance with road and
communications infrastructure, donors have so far not made significant investment in
the development of agricultural markets in Ethiopia. This raises the question: has local
procurement improved the performance of Ethiopian grain markets beyond the food
aid ambit, i.e. in regular procurement, wholesale, processing and retail activities?
There was little evidence of widespread impact arising from local purchase and this
study confirmed the finding of Deloitte Emerging Markets and NRI (2003), who
interviewed seven traders participating in local tenders, and found that they had very
limited involvement in the day-to-day grain trade. Some of them had a sideline in
supplying mills but none acted as regular grain wholesalers.
GTZ and REST claim a gain in the number, size, and efficiency of grain traders in the
locality of their procurement activities, but these pioneering organisations now account
for a small percentage of total volumes procured, and their approach to procurement is
atypical12. The lessons learned by REST and GTZ should be studied by the larger
agencies. For the main part, it is evident that local purchases have developed a
relatively small number of firms skilled at meeting strict delivery schedules and quality
specifications for food aid commodities. Smaller traders supplying these firms have
doubtless benefited from their involvement in the food-aid pipeline, but there was no
direct evidence that this large-scale activity had led to changes in practices in the
regular wholesale-retail trade.
12 Unpublished studies by REST in surplus producing areas in Tigray, undertaken between 1993 and 1996, suggest the number of small traders and trader grain stores had increased significantly.
52

Potentially, local procurement can be used as a tool to bring about, at little cost, major
institutional changes that enhance the efficiency of domestic food marketing systems.
Indeed the volume of local purchase is so large that food aid agencies can, simply by
amending their contractual terms, provide the necessary demand to ensure the
successful take-off of the country’s planned warehouse receipt system and a
commodity exchange. It is truly a case of “he who pays the piper, calls the tune”.
A warehouse receipt system is about to be piloted with maize and wheat, with eight
warehouses (all owned by EGTE) and the Commercial Bank of Ethiopia providing the
finance. A new Warehouse Receipts Proclamation has been passed and a regulatory
function has been established at the Ministry of Agriculture and Rural Development.
A commodity exchange has been under discussion for some time and has been actively
promoted by IFPRI.
Grading standards will be implemented through the pilot warehouses, and the same
entities can be called upon to guarantee the performance of contracts involving grain
stored in those warehouses. If the pilot proves successful, other warehouses could be
licensed to issue warehouse receipts, including EFSRA and private warehouses. Once
the commodity exchange is established, it could register some of these warehouses as
delivery locations for grain sold through the exchange.
Establishing these institutions is no easy task in a country like Ethiopia where the
regular grain trade is fragmented to the point of being atomistic in nature. However,
the food aid agencies have major procurement muscle and are in a position to kick-
start their development. By so doing, they can potentially make major inroads in
addressing weaknesses of domestic markets mentioned earlier, i.e. lack of product
standardisation, lack of systems of contract enforcement, lack of efficient financing
mechanisms, and lack of price discovery. This would be greatly preferable to the
present situation where food aid procurement is developing a narrow, and arguably
efficient, channel dedicated almost exclusively to the food aid business.
Grain stored in warehouses licensed under the new system would become a fungible
commodity, in the sense of having various possible destinations, i.e. food aid, local
trade, milling and feed milling. When traders store grain in anticipation of a food aid
53
tender, other private buyers can bid for them, in the knowledge that they can continue
holding the stocks in the same warehouses, obtain bank financing against them and
draw them down gradually as they need them.
The food aid agencies can have major leverage over the development of these
institutions, and take steps to ensure that they perform as required. However, they will
need to work in partnership with Government and private stakeholders to make the
system a success. Here it is necessary to recognise some uncertainties. Looking at
experience elsewhere in the world, successful initiatives in these areas usually arise
from initiative in commercial farming sectors, trade and the banks. In Ethiopia's case,
Government is providing most of the drive, and it is possible that this could constrain
private players. Notably the players in the warehouse receipt pilot (EGTE and
Commercial Bank of Ethiopia) are both from the public sector, and it is difficult for
private players to acquire land to build warehouses. Moreover, it is possible that the
high level of public sector involvement will result in political and bureaucratic criteria
prevailing over the autonomy of the fledgling institutional framework.
As in the case of price stabilisation discussed above, the food aid agencies should
adopt a cautious but positive approach to the development of marketing institutions,
study the situation as it develops, and be ready to provide support if they find
conditions are ripe for success.
5.4 Development of agro-industries
There is no doubt that the production industries for blended commodities such as faffa,
famix and Unimix owe their existence to food aid procurement for distribution in
Ethiopia and in surrounding countries. The four companies involved have diversified
from baby food production to be largely suppliers to the food aid sector. For one of
these companies, this business alone is worth around US $3 million/annum.
Production of blended foods generates additional employment. The companies
employ many hundreds of employees, albeit some are casual staff due the variable
nature of food aid demand.
54
Local procurement generates extensive business for grain handlers and transporters in
the rural regions, which would otherwise have been used to finance large freight
companies based in the major cities or at the port of Djibouti.
5.5 Increase in cereal production
As indicated in Box 1, Ethiopian farming responds in aggregate to price incentives by
increasing production over the medium to long term, so there can be no doubt that
local procurement has contributed to increased production. The Australian Agency for
International Development (1996) states that purchases in Tigre by REST have clearly
increased market demand and contributed to an expansion in production in the Sheraro
area as there has been an expansion in land cultivated and a marked increase in the use
of fertiliser. Large-scale farms are growing in number, as is the use of heavy
equipment for ploughing and cultivation.
5.6 Crop diversification
Soya is not a common crop in Ethiopia and whilst there is a limited market for soya as
a constituent of poultry feed and as an export commodity it appears that its main use is
in blended food-aid products. Both Faffa and East Africa Group, another blended food
manufacturer, believe that their supply of the local and regional procurement markets
have initiated significant increases in soya bean production in Ethiopia.
5.7 Improving food quality
The enforcement of strict quality procurement standards has undoubtedly raised the
quality of grain offered for food aid local purchase. It will undoubtedly have raised the
awareness and competence of those traders concerned.
5.8 Stimulating regional trade
The growth of the blended food sector has created the market potential for Ethiopian
companies to supply neighbouring countries. Having met recent production demands
to fulfil food orders for Sudan, there can be little doubt that the companies concerned
will be looking for repeat business.
55

6. Conclusions 6.1 Although Ethiopia receives large quantities of food aid, both imported, and
purchased locally and regionally, the data available on the locally procured
commodities is fragmented, incomplete and often inconsistent. However, the
data in Table 3.3 offers the best possible summary of local cereal purchases.
Nevertheless, it is most probably an underestimation, because records appear to
be based on incomplete data.
6.2 The lack of sound and consistent data possibly reflects the current lack of full
co-ordination of the food aid sector in Ethiopia.
6.3 The Productive Safety Net Programme will result in a shift from food to cash
distributions, and this may result in some reduction in food aid, or at least a
reduction in the rate of increase. However, implementation is likely to be
constrained by geographical, logistical, climatic and security factors. Hence,
food aid, including local procurement, will remain very important to Ethiopia
in the foreseeable future. In the light of this, we conclude that local purchase is
sustainable, in the sense that donors are likely to sustain it over the medium to
long-term.
6.4 Around a quarter of Ethiopia’s food aid is procured locally, and this translates
into between 4% and 32% of Ethiopia’s estimated cereal production surplus.
The authors conclude that this has had an overall positive impact on rural
welfare in Ethiopia, by supporting producer prices, creating employment
through the value chain, and multiplier effects within the economy at large.
6.5 The food aid agencies regularly conduct annual cereal availability studies with
a view to protecting the market from adverse effects. However, due to funding
and procedural delays, tenders are often launched late and this diminishes their
cost-effectiveness and beneficial impact on the local economy.
6.6 All local procurement agencies use the classical tendering procedures, albeit
with differences, e.g. between open and closed systems. Attempts to procure
from farmer groups and other small suppliers have been largely ineffective.
6.7 The EFSRA has contributed greatly to the success of local procurement.
Flexible replenishment arrangements allow subsequent procurement to be
undertaken in a more programmed and market sensitive manner, while
56

EFSRA’s lending facility has largely offset the adverse effects of complicated
donor procedures of donor agencies, particularly the provision of funding on an
annual basis.
6.8 The accepted view of development agencies is that local procurement can yield
cost savings of around 25 to 30% compared to the landed costs of imports, and
this is supported by recent findings by the Organisation for Economic Co-
operation and Development.
6.9 Local procurement provides a wider range of cereal grains for distribution to
beneficiaries. Imported grain is predominantly wheat, but local grains include
maize and sorghum, which are strongly preferred in some areas. Local
procurement is also faster than the alternative of importing food aid
commodities from donor countries and the international market, although
bureaucratic and funding delays often erode this advantage.
6.10 There is little evidence that local procurement has contributed to price stability
between years, but if the volumes procured were related to the state of local
harvests and the country relied on imported food in years of deficit, it could
fulfil this function. However this would require a high level of co-ordination
between the leading donors (EU and USA), considerable delegation to their
Addis Ababa offices and very strong effective institutional arrangements to
prevent the price stabilisation function becoming a hostage to local political
pressures and, thereby, financially unsustainable.
6.11 Local purchase has resulted in the development of a somewhat narrow
procurement channel, whose players are skilled in meeting strict delivery
schedules and specifications for food aid commodities – clearly a beneficial
outcome. However, with the exception of certain smaller agencies, which have
established relatively decentralised operations, there was no evidence that local
purchase had led to changes in practices in the regular wholesale-retail trade.
6.12 Whilst the food aid sector cannot be expected to make good the deficiencies in
the Ethiopian grain marketing sector, it does have potential to support the
introduction of warehouse recent systems and a commodity exchange. In turn,
the introduction of these initiatives would create opportunities for a more
efficient and transparent procurement system, not based on a tendering system.
57

6.13 The blended food industry owes much of its existence and continued
development to local procurement for food aid use. The demands of this
industry will also affect suppliers of raw materials and packaging.
6.14 While recognising the development benefits associated with some smaller
procurement operations, we broadly accept the EC’s argument in favour of
larger tenders (“procurement lots should not be less than 500 tonnes in order
not to disrupt the trade pyramid”), given that the economies of scale in grain
procurement and the high level of institutional overheads which can be
occasioned by small tenders. However if Ethiopia could develop an effective
commodity exchange, this would provide an efficient means of downscaling
procurement operations, and a transparent alternative to procuring all their
grain through open tenders. Indeed, food aid agencies can test the system by
placing relatively small bids through the exchange.
6.15 The above conclusions support the hypothesis that “local or regional
procurement of food aid can make a much larger contribution to the economies
of developing countries, and poor people in particular, and policies can be put
in place to increase such benefits”. They also show that the realisation of this
potential depends upon local circumstances and the skill of government and
donor officials in providing the policies and supporting the development of
institutional frameworks.
58

7. Recommendations
7.1 Impact Assessment
Donors and relief agencies should undertake assessments of the development
impact of procurement in supplying economies.
7.2 Information Date base
Donors and relief agencies should strive to improve the food aid information
base, specifically to include all local and regional procurement.
7.3 Work with donors towards multi-annual cash commitments
Relief agencies should work with donors with a view to implementing a system
of multi-annual, rather than annual, resource allocations for local procurement.
This would eliminate the problems arising from occasional delays in the release
of committed funds while allowing for medium-term planning and the scaling
of local purchases in accordance with local production. Multi-annual cash
contributions would also enable implementing agencies to provide producers,
traders, and processors with a clearer indication of their future purchasing
intentions with regards to quantities and timing, thereby reducing production
and marketing risks.
7.4 Investigate the scope for using local procurement to develop more efficient
domestic marketing institutions
Food aid agencies and donors supporting them should likewise study the
opportunity for using local procurement to develop more efficient domestic
marketing institutions, and be prepared to support if conditions are ripe for
success. Support for these institutions will require substantial changes to donor
regulations and procedures. For example, delivery of stocks should be in the
form of warehouse receipts, and it could be required that bonds are posted in
this form. Procurement through commodity exchanges means being able to
dispense with the open tendering system.
59

7.5 Investigate the scope for more explicitly linking food aid procurement and
price stabilisation
Food aid agencies and the donors supporting them should study the opportunity
for more explicitly linking local food aid procurement and price stabilisation,
but in a way that avoids the negative outcomes widely associated with price
stabilisation interventions in Africa and elsewhere.
7.6 Training of private sector trading enterprises
Food aid agencies should consider sponsoring training initiatives targeting
private sector traders and covering subjects such as warehouse management,
pest and quality control, procurement systems, accounting and costing. This
could contribute to broadening their supply base and ensuring compliance with
contract specifications.
60

References
Abdulai, A., Barrett, C.B. and Hazell, P. (2004) Food aid for market development in Sub-Saharan Africa, DSGD Discussion Paper No. 5, International Food Policy Research Institute, Washington D.C., USA
Abrar S. (2001) Duality, choice of functional form and peasant supply response in Ethiopia. Centre for Research in Economic Development and International Trade, University of Nottingham, UK. www.nottingham.ac.uk/economics/credit/research/papers/CP.01.20.pdf accessed 23 August 2005
Anon (1999) Donors’ local food aid purchase: an evaluation of impact and performance. Unpublished report of grain market research project and EU local food security unit. January 1999, Addis Ababa, Ethiopia
Australian Agency for International Development (1996) Community aid abroad, Emergency and rehabilitation assistance in Ethiopia, Oxfam in Australia
Australian Agency for International Development (1997) Community aid abroad, Internal purchase of food and agricultural rehabilitation project, Ethiopia, Oxfam in Australia
Coulter, J.P. and Poulton, C. (2001) Cereal market liberalisation in Africa, Chapter 6 in: Commodity Market Reform: Lessons of Two Decades, edited by T. Akiyama, J. Baffes, D. Larson and P. Varangis. Washington: World Bank EC Local Food Security Unit and WFP (2002) Availability of Maize, Sorghum and Wheat in 2002 for Local Purchase by Donors, Addis Ababa, Ethiopia April 2002
Delegation of the EC to Ethiopia, WFP and SIDA (2003) Cereal Availability Study: Availability of Maize, Sorghum and Wheat for Local Purchase of Food Aid in 2003, Addis Ababa, Ethiopia May 2003
Deloitte Emerging Markets and NRI (2003) Vulnerability, Access and Market Price Stabilisation in Ethiopia, Joint consultancy report by Deloitte Emerging Markets and NRI for USAID and the Netherlands Embassy, Addis Ababa, Ethiopia
Gabre-Madhin, E.Z. (2001) Market Institutions, Transaction Costs, and Social Capital in the Ethiopian Grain Market. Research Report No.124, International Food Research Institute, Washington D.C., USA
Government of Ethiopia and Humanitarian Partners (2004) 2005 Humanitarian appeal for Ethiopia, 23 December 2004, Addis Ababa, Ethiopia
Harrison (2002) Cited in Ethiopia: Country economic memorandum. Can agriculture lead growth in Ethiopia? The importance of linkages, markets and tradability. Unpublished background report of the World Bank, April 2004. Addis Ababa, Ethiopia
Jayne, T.S., Negassa, A. and Myers, R. (1998) The effect of liberalisation on grain prices and marketing margins in Ethiopia. International Development Working Paper No.68, Grain Marketing Research Project, Michigan State University, East Lansing, USA
Kuma (2002) Cited in Ethiopia: Country economic memorandum. Can agriculture lead growth in Ethiopia? The importance of linkages, markets and tradability. Unpublished background report of the World Bank, April 2004. Addis Ababa, Ethiopia
Negassa, A. and Jayne, T.S. (1997) The response of Ethiopian grain markets to liberalisation. Working Paper No.6, Grain Marketing Research Project, Michigan State University, Addis Ababa, Ethiopia
REST (1992) Relief Society of Tigray, 1991/1992 report, Mekelle, Ethiopia
REST (1994) Relief Society of Tigray, 1993/1994 report, Mekelle, Ethiopia
61

REST (2003) Relief Society of Tigray, 2003 annual report, Mekelle, Ethiopia
Robinson, C. (2003) Nothing to fall back on: Why Ethiopians are still short of food and cash, a report of Christian Aid, Addis Ababa, Ethiopia
SIDA, WFP and Delegation of the EC to Ethiopia (2004) Availability of cereals for local purchase in 2004, Addis Ababa, Ethiopia
SIDA, WFP and Delegation of the EC to Ethiopia (2005) Report on the cereal availability study 2004/05: Availability of maize, sorghum and wheat for local purchase of food aid in 2005, Addis Ababa, Ethiopia. March 2005
Smalbruch, G and Walker D.J. (2004) Fewer adverse side effects. D+C Development and Co-operation, 31, June, pp 239-241 Smith, G.E. (1983) Counting quintals. Report on a field monitoring visit to Tigray, northern Ethiopia. Stichting Oecumenishe Hulp (Dutch Interchurch Aid), Utrecht, The Netherlands
Thomson, A. and Metz, M. (1999) Implications of Economic Policy for Food Security: a Training Manual. FAO Training Manual for Agricultural Planning. Rome: FAO. http://www.fao.org/documents/show_cdr.asp?url_file=/DOCREP/004/X3936E/X3936E00.HTM
Walker, D.J. and Boxall, R.A. (2004). Contributions to rural development by local and regional procurement of food aid. Natural Resources Institute (UK) and EuronAid (Netherlands). EuronAid, The Hague. 70pp
Wolday Amha, Stepanek, S., Jayne, T.S. and Asfaw Negassa (1997) Meeting food aid and price stabilisation objectives through local grain purchase: A review of the 1996 experience. Working paper 7, Grain Market Research Project, Ministry of Economic Development and Co-operation, Addis Ababa
World Bank (2003) Ethiopia rural development policy note. Unpublished report, Addis Ababa, Ethiopia
World Bank (2004a) Productive safety net project in support of the first phase of the productive safety bet programme. Report No. 29767-ET, Addis Ababa, Ethiopia
World Bank (2004b) Ethiopia rural development review. Draft concept note, Addis Ababa, Ethiopia
World Bank (in press) Ethiopia: Policy Options for Pro-Poor: Agricultural Growth. Mimeo World Food Programme (2005) Annual report 2004, World Food Programme, Rome, Italy
62
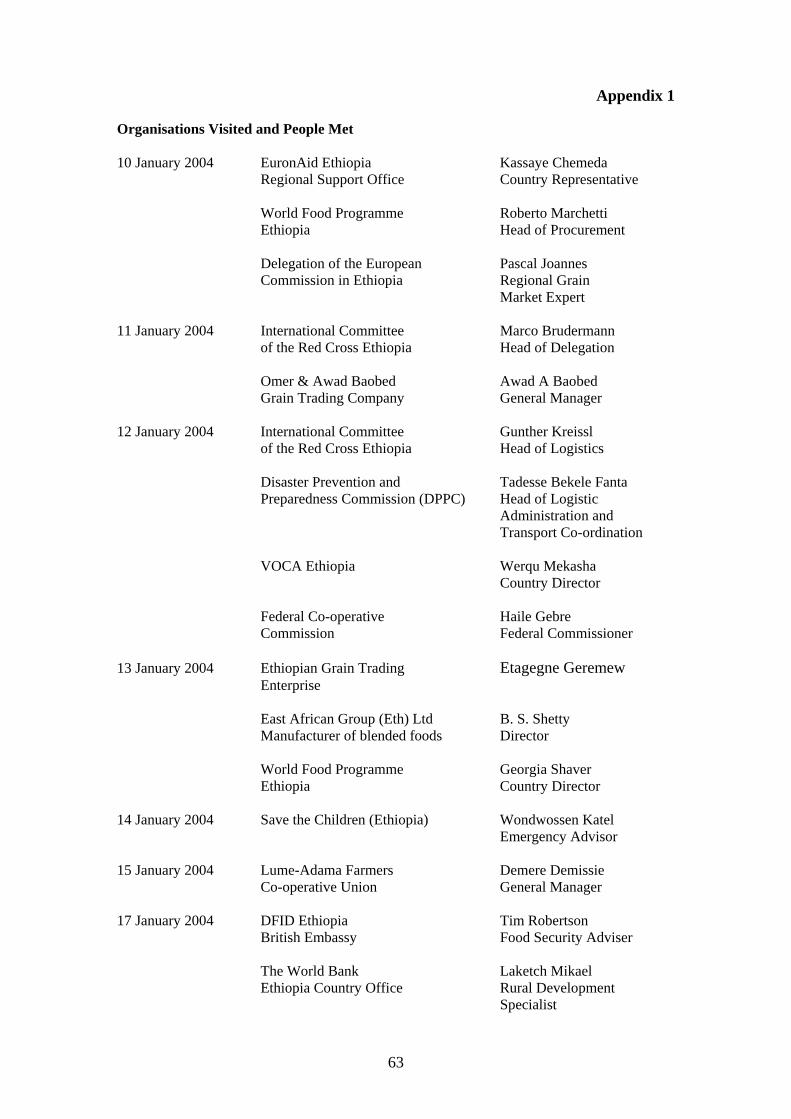
Appendix 1
Organisations Visited and People Met 10 January 2004 EuronAid Ethiopia Kassaye Chemeda Regional Support Office Country Representative World Food Programme Roberto Marchetti Ethiopia Head of Procurement Delegation of the European Pascal Joannes Commission in Ethiopia Regional Grain Market Expert 11 January 2004 International Committee Marco Brudermann of the Red Cross Ethiopia Head of Delegation Omer & Awad Baobed Awad A Baobed Grain Trading Company General Manager 12 January 2004 International Committee Gunther Kreissl of the Red Cross Ethiopia Head of Logistics Disaster Prevention and Tadesse Bekele Fanta Preparedness Commission (DPPC) Head of Logistic
Administration and Transport Co-ordination
VOCA Ethiopia Werqu Mekasha Country Director Federal Co-operative Haile Gebre Commission Federal Commissioner 13 January 2004 Ethiopian Grain Trading Etagegne Geremew Enterprise East African Group (Eth) Ltd B. S. Shetty Manufacturer of blended foods Director World Food Programme Georgia Shaver Ethiopia Country Director 14 January 2004 Save the Children (Ethiopia) Wondwossen Katel Emergency Advisor 15 January 2004 Lume-Adama Farmers Demere Demissie Co-operative Union General Manager 17 January 2004 DFID Ethiopia Tim Robertson British Embassy Food Security Adviser The World Bank Laketch Mikael
Ethiopia Country Office Rural Development Specialist
63

Japan International Kimiaki Jin Co-operation Agency Deputy Resident Representative GTZ German Development Winfried Zarges Co-operation Programme Co-ordinator 18 January 2004 Embassy of Kingdom Hans Raadschilders of Netherlands First Secretary Rural Economic
Development Faffa Food Share Company Derese Kassu Manufacturer of blended foods General Manager World Food Programme Ioannis Katsaros Ethiopia Senior Logistics Officer International Food Policy Eleni Z Gabre-Madhin Research Institute (Ethiopia) Programme Leader 19 January 2004 Trader Kabir Hussain 20 January 2004 Hawas Agribusiness PVT Ltd Co Bulbula Tulle Managing Director
64
APPENDIX 2 THE HISTORY OF LOCAL PROCUREMENT IN ETHIOPIA The origin of local food aid procurement can be traced to 1983 when food aid sorghum was purchased by European NGOs in eastern Sudan for transport to Ethiopia to feed drought migrants in western Tigray (Smith, 1983). The success of this mobilisation was limited because the Relief Society of Tigray (REST) had insufficient trucks for the quantities of grain involved and the summer rains were making the river crossings from Sudan impassable. The alternative was to purchase from areas of Tigray, such as the Shire and Wolkeit districts, which are traditionally surplus grain producing areas. At the request of church agencies, several donors released a total of US $200,000 for this purpose. In mid-1983, REST undertook a crop assessment exercise that showed a surplus in western Tigray of 8,000 tonnes from the 1982-83 harvest (October to January). However, the Economics Department of the Tigray People's Liberation Front (TPLF) determined that only 3,000 tonnes could be purchased for food aid without disrupting normal economic patterns, notwithstanding the planned procedure of purchasing in lots of 80 tonnes so as to distribute the cash between merchants and lessen localised market impact. Funding constraints subsequently limited REST’s procurement to around 585 tonnes. An impact assessment indicated that the procurement did not disrupt economic patterns, but purchases were judged to be sufficient to encourage farmers in surplus areas to increase production in the knowledge that there would be a market for their grain. REST formalised its Internal Purchase Programme in 1986. The objective was to purchase food from surplus areas for distribution in food deficit areas. According to REST (1992), the stated advantages were that:
• it allows for a faster response and delivery time • locally procured food is more familiar and culturally acceptable than imported food aid • when funds arrive in time it is more economic • it assists the long-term development process by increasing producer incentives and
stimulating local markets REST continued its crop assessment exercises to support the distribution of imported food aid and to underpin its substantial local procurement operations in Tigray with purchases of 40,446 tonnes of grain (1991), 3,831 tonnes (1992), 20,091 tonnes (1993), 11,116 tonnes (1994), 4,941 tonnes (1995), 5,066 tonnes (1996), and 8,053 in 2003 (REST 1992, REST 1994, Australian Agency for International Development 1996, Australian Agency for International Development 1997, and REST, 2003). The financial support of the Australian Government was the first recorded example in Ethiopia of an international food aid donor with a development agenda to improve local productivity by using local grain purchases. There was also financial support in 1994 from New Zealand. After two decades of experience in conducting local purchases, REST claims to have developed good relations and purchasing networks with producers and mid-level grain traders and this has assisted the smooth implementation of procurement activities. REST maintains one major store in the western zone of Tigray to transact food purchases, receive commodities from traders, provide storage as required and, using private transporters, to dispatch directly to distribution sites following public tender.
65

In 1996, in response to Government appeals to donors, the European Commission (EC) initiated a local procurement programme. In subsequent years a more widespread programme was introduced through its Ethiopia Food Security Unit and through EuronAid13. The objectives were as follows (Anon 1999):
• to procure food aid (locally/regionally) as part of a more general policy support linking food aid with market development
• to improve food aid targeting through diversifying grain types
• to support domestic prices during years of good harvest in order to provide production incentives to farmers
• to encourage entry and expansion of the domestic grain trade by familiarising farmers with more formal contract arrangements and help integrate food aid activities into the broader domestic grain marketing system
Since then the EC and its member states have made increased financial resources available for local purchases of relief food. These purchases are now made on a regular basis by the Ethiopian Government through the Disaster Preparedness and Prevention Commission (DPPC), and by the World Food Programme (WFP) and EuronAid. Other agencies such as GTZ and Save the Children (UK) have also procured food locally for their relief activities, albeit on a more infrequent basis (see Table 4.3 in the main text).
DPPC has recently become the leading local food aid procurement agency, having made 37 per cent of all cereal purchases since 1996 while WFP and EuronAid accounted for 26 and 17 per cent respectively (Table 3.3). The Ethiopia Food Security Unit of the EC was directly involved in local procurement until 2000 but it has since ceased to act as a purchasing agency, opting instead to focus on the co-ordination and management of EC financial allocations to DPPC, EuronAid and WFP. The EC funding contribution to the local purchase operation of 2004 represents 56% of total procurement in this year, and 48% of the funding for the total quantity purchased in the country since 1996.
Most of the larger food aid organisations distribute imported food aid in addition to their local procurement activities. However, GTZ, which has procured over 43,000 tonnes over the past nine years, does not distribute any imported food aid on principle. GTZ believes that local procurement is a foundation for rural development.
Significantly, food aid procurers are the largest buyers of grain in Ethiopia in what can be a very thin market (World Bank, 2003). It is understood that even in good years only 28% of the grain harvest is marketed.
The agencies involved in local procurement are conscious of the need to avoid purchasing excessive quantities in the market for fear of inflating source prices and distorting markets. To this end an annual Cereal Availability Study, based on the REST model, was initiated in the late 1990s and is now implemented to inform decisions regarding the quantity and type of grains available to be purchased locally for relief purposes. This assessment is currently sponsored by the EC, WFP and the Swedish International Development Agency (SIDA), e.g. Delegation of the EC to Ethiopia et al. (2003), SIDA et al. (2004), and SIDA et al. (2005). Extracts from the most recent Cereal Availability Study are shown in Appendix 3.
13 EuronAid is an association owned and controlled by European NGOs active in the field of food aid and food security. It facilitates access by NGOs to institutional donors, mainly the EC, provides a forum for exchanging information and sharing experiences.
66

Appendix 3 Extracts from 2005 Cereal Availability Study
Maize - potential availability for local purchase from selected surplus zones in 2005 (in tonnes)
Production Marketable Potentially Carryover Stock Available Amount from Demand from Net Potentially Surplus Available State & Comm. Farms Flour Mills Available Maize AMHARA EAST GOJAM 76,023 11,403 1,711 1,711 WEST GOJAM 206,087 80,374 20,093 17,848 37,941 AGEWAWIE 64,737 20,068 4,014 18,852 22,866 NORTH GONDER 62,010 11,162 1,674 1,674 NORTH SHOA 0 0 0 SOUTH WOLLO 0 0 0 AMHARA TOTAL 408,857 123,008 27,492 36,700 64,192TIGRAY Houmera 0 0 0OROMIYA EAST WELLEGA 166,374 26,620 4,259 12,712 16,971 ILLUBABOR 141,725 7,086 354 354 JIMMA 256,172 87,099 21,775 21,775 WEST SHOA 134,505 22,866 3,887 3,887 ARSSI 74,811 29,176 2,188 2,188 WEST WELLEGA 255,930 23,034 2,303 2,303 WEST HARARGHE 32,724 10,144 0 0 BALE 8,421 1,263 189 189 EAST SHOA 124,076 38,464 7,693 7,693 OROMIYA TOTAL 1,194,738 245,752 42,649 12,712 55,361SNNPR HADIYA 37,376 1,121 34 34 KEMBATA A.T. 0 SIDAMA 40,134 9,231 2,123 11,706 13,829 SNNPR TOTAL 77,510 10,352 2,157 11,706 13,863ADDIS ABABA 30,800 5,000 25,800Grand Total (tonnes) 1,681,105 379,111 72,298 30,800 61,118 5,000 159,216
67

Wheat - potential availability for local purchase from selected surplus zones in 2005 (in tonnes) Production Marketable Potentially Carryover Stock Available Amount from Net Demand from Net Potentially Surplus Available State & comm. Farms Flour Mills Available Wheat AMHARA EAST GOJAM 98,720 22,706 5,222 5,222 WEST GOJAM 27,774 6,388 1,469 9,155 -7,686 AGEWAWIE 8,162 3,183 732 732 NORTH GONDAR 45,304 30,807 15,403 2,135.5 13,268 NORTH SHOA 0 0 0 SOUTH WOLLO 0 0 0 AMHARA TOTAL 179,960 63,084 22,827 0 11,291 11,537TIGRAY Houmera 0 0 0OROMIYA EAST WELLEGA 45,311 5,437 652 652 ILLUBABOR 5,133 462 42 42 JIMMA 30,656 8,584 1,717 1,717 WEST SHOA 213,947 57,766 17,330 3,880 13,450 ARSSI 547,294 93,040 27,912 25,414 2,647 50,679 WEST Wellega 16,522 6,278 942 942 WEST HARARGHE 7,251 3,408 682 682 BALE 153,901 36,936 11,081 50,485 1,600 59,966 EAST SHOA 191,949 90,216 27,065 22,241 4,824 OROMIYA total 1,211,964 302,127 87,421 75,899 30,368 132,952 SNNPR HADIYA 104,551 47,048 21,172 5,500 15,672 KEMBATA A.T. 400 -400 SIDAMA 7,505 1,426 271 1,000 -729 SNNPR TOTAL 112,056 48,474 21,443 6,900 14,543ADDIS ABABA 1,500 28,588.6 -27,089 Grand Total (tonnes) 1,503,980 413,685 131,691 1,500 75,899 77,147 131,943
68

Sorghum - potential availability for local purchase from selected surplus zones in 2005 (in tonnes)
Production Marketable Potentially Carryover Stock Available Amount from Net Demand from Net Potentially Surplus Available State & comm. Farms Flour Mills Available Sorghum AMHARA EAST GOJAM 23,432 5,155 825 825 WEST GOJAM 4,333 1,300 260 260 AGEWAWIE 8,564 1,370 219 365 584 NORTH GONDAR 197,082 35,475 10,642 25,558 36,200 NORTH SHOA 0 0 0 SOUTH WOLLO 0 0 0 AMHARA TOTAL 233,411 43,300 11,946 25,923 37,869TIGRAY Houmera 34,084 22,155 14,401 14,401OROMIYA EAST WELLEGA 48,740 10,723 1,608 326 1,934 ILLUBABOR 51,846 2,592 0 0 JIMMA 77,908 20,256 3,038 3,038 WEST SHOA 95,400 20,988 4,198 4,198 ARSSI 33,032 1,321 0 0 WEST WELLEGA 140,648 19,691 1,969 1,969 WEST HARARGHE 77,341 13,921 0 0 BALE 9,421 2,167 217 217 EAST SHOA 0 0 0 0 OROMYIA Total 534,337 91,660 11,030 326 11,356SNNPR HADIYA 7,674 767 77 77 KEMBATA A.T. 0 SIDAMA 0 0 0 SNNPR TOTAL 7,674 767 77 77ADDIS ABABA 170 170Grand Total (tonnes) 809,506 157,882 37,454 170 26,249 63,873
69
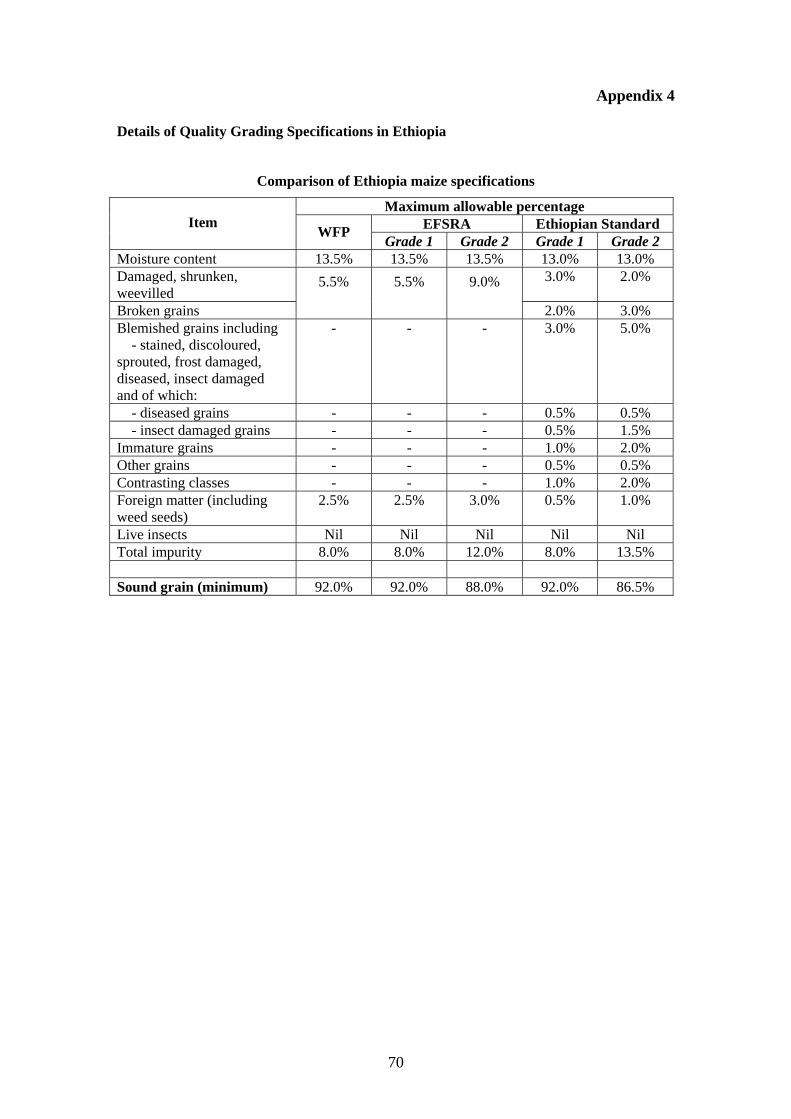
Appendix 4 Details of Quality Grading Specifications in Ethiopia
Comparison of Ethiopia maize specifications
Maximum allowable percentage EFSRA Ethiopian Standard Item WFP Grade 1 Grade 2 Grade 1 Grade 2
Moisture content 13.5% 13.5% 13.5% 13.0% 13.0% Damaged, shrunken, weevilled
3.0% 2.0%
Broken grains
5.5% 5.5% 9.0%
2.0% 3.0% Blemished grains including - stained, discoloured, sprouted, frost damaged, diseased, insect damaged and of which:
- - - 3.0% 5.0%
- diseased grains - - - 0.5% 0.5% - insect damaged grains - - - 0.5% 1.5% Immature grains - - - 1.0% 2.0% Other grains - - - 0.5% 0.5% Contrasting classes - - - 1.0% 2.0% Foreign matter (including weed seeds)
2.5% 2.5% 3.0% 0.5% 1.0%
Live insects Nil Nil Nil Nil Nil Total impurity 8.0% 8.0% 12.0% 8.0% 13.5% Sound grain (minimum) 92.0% 92.0% 88.0% 92.0% 86.5%
70

Comparison of Ethiopia wheat specifications
Maximum allowable percentage EFSRA Ethiopian Standard Item WFP Grade 1 Grade 2 Grade 1 Grade 2
Moisture content 13.5% 13.5% 13.5% 13.0% 13.0% Damaged, shrunken, weevilled, broken grains
3.5% 2.8% 5.6% - -
Defective grains (total) Of which:
6.0% 9.0%
- Broken grains - - - 1.0% 2.0% - Shrivelled grains 3.0% - Unsound grains - - - 1.0% 0.5% - Sprouted grain 1.0% - Grains attacked by pests - - - 1.0% 1.5% - Other cereals 1.0% Contrasting classes - - - 0.5% 2.0% Foreign matter (including weed seeds)
2.5% 3.2% 4.9% - -
Organic extraneous matter - - - 1.5% 1.5% Inorganic extraneous matter 1.0% - - 0.5% 0.5% Stones 0.1% 0.2% Live insects Nil Nil Nil Nil Nil Total impurity 6.0% 6.0% 10.5% 8.6% 13.2% Sound grain (minimum) 94.0% 94.0 89.5% 91.4% 86.7%
71
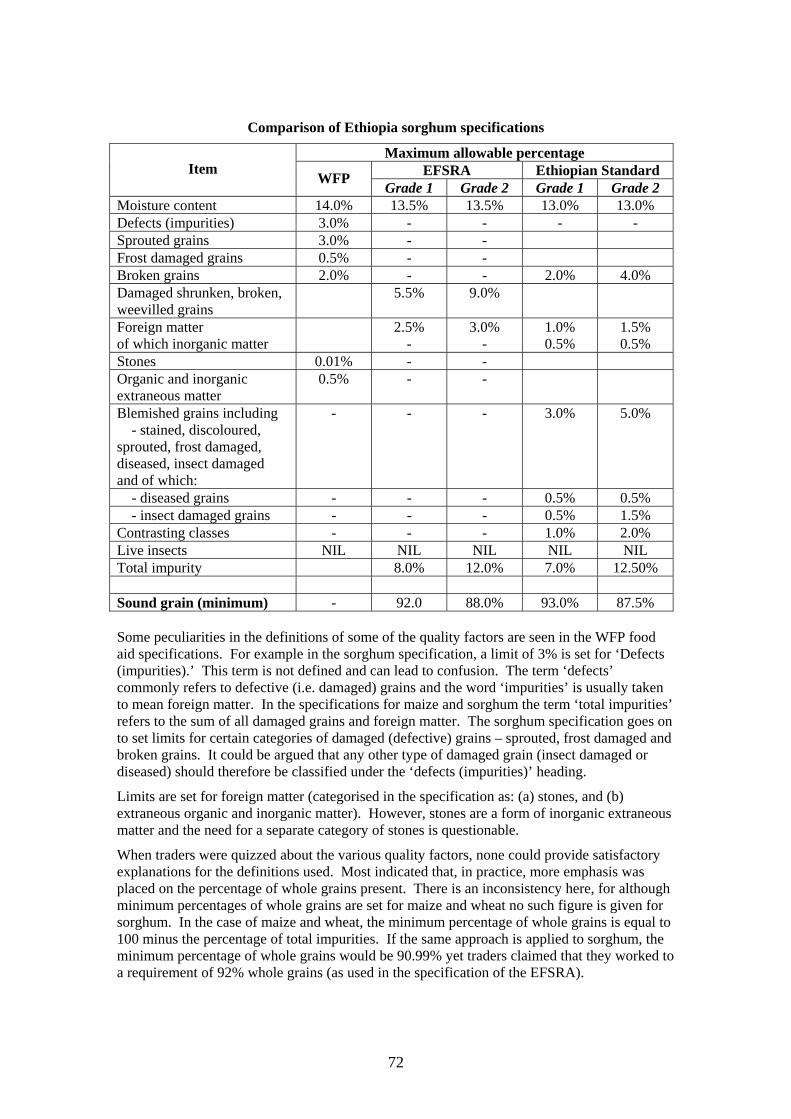
Comparison of Ethiopia sorghum specifications
Maximum allowable percentage EFSRA Ethiopian Standard Item WFP Grade 1 Grade 2 Grade 1 Grade 2
Moisture content 14.0% 13.5% 13.5% 13.0% 13.0% Defects (impurities) 3.0% - - - - Sprouted grains 3.0% - - Frost damaged grains 0.5% - - Broken grains 2.0% - - 2.0% 4.0% Damaged shrunken, broken, weevilled grains
5.5% 9.0%
Foreign matter of which inorganic matter
2.5% -
3.0% -
1.0% 0.5%
1.5% 0.5%
Stones 0.01% - - Organic and inorganic extraneous matter
0.5% - -
Blemished grains including - stained, discoloured, sprouted, frost damaged, diseased, insect damaged and of which:
- - - 3.0% 5.0%
- diseased grains - - - 0.5% 0.5% - insect damaged grains - - - 0.5% 1.5% Contrasting classes - - - 1.0% 2.0% Live insects NIL NIL NIL NIL NIL Total impurity 8.0% 12.0% 7.0% 12.50% Sound grain (minimum) - 92.0 88.0% 93.0% 87.5% Some peculiarities in the definitions of some of the quality factors are seen in the WFP food aid specifications. For example in the sorghum specification, a limit of 3% is set for ‘Defects (impurities).’ This term is not defined and can lead to confusion. The term ‘defects’ commonly refers to defective (i.e. damaged) grains and the word ‘impurities’ is usually taken to mean foreign matter. In the specifications for maize and sorghum the term ‘total impurities’ refers to the sum of all damaged grains and foreign matter. The sorghum specification goes on to set limits for certain categories of damaged (defective) grains – sprouted, frost damaged and broken grains. It could be argued that any other type of damaged grain (insect damaged or diseased) should therefore be classified under the ‘defects (impurities)’ heading.
Limits are set for foreign matter (categorised in the specification as: (a) stones, and (b) extraneous organic and inorganic matter). However, stones are a form of inorganic extraneous matter and the need for a separate category of stones is questionable.
When traders were quizzed about the various quality factors, none could provide satisfactory explanations for the definitions used. Most indicated that, in practice, more emphasis was placed on the percentage of whole grains present. There is an inconsistency here, for although minimum percentages of whole grains are set for maize and wheat no such figure is given for sorghum. In the case of maize and wheat, the minimum percentage of whole grains is equal to 100 minus the percentage of total impurities. If the same approach is applied to sorghum, the minimum percentage of whole grains would be 90.99% yet traders claimed that they worked to a requirement of 92% whole grains (as used in the specification of the EFSRA).
72