Embed Size (px)
Citation preview
Local E-Government Trends
Evaluating the Adoption and Sophistication of Kentucky City Websites
Kevin Klosterboer Public Administration Capstone
Martin School of Public Policy and Administration
University of Kentucky
April 15, 2011
2
Table of Contents
Executive Summary ................................................................................... 3
Introduction .............................................................................................. 4
Research Question .................................................................................... 5
Literature Review ...................................................................................... 5
Data and Methodology ........................................................................... 10
Empirical Analysis ................................................................................... 13
Discussion ............................................................................................... 21
References .............................................................................................. 24
Appendix A: Methodology for Determining Website Stage ................... 27
Appendix B: Website Examples by Stage of Sophistication .................... 28
Appendix C: List of Cities with Websites ................................................. 30
3
Executive Summary
With the prevalence of internet technologies and e-commerce, citizens’ expectations for online
e-government services are growing. Numerous studies have been conducted on the worldwide
adoption and sophistication of national governments’ e-government websites and state websites in the
United States, but previous studies of local governments have been limited to looking at nationwide
samples of the largest cities. By presenting a statewide analysis of all Kentucky city websites, I expect
that my findings will provide valuable information about how cities of all sizes are using web-
technologies to provide services to their citizens. I examine which types of cities, organized along several
demographic variables, have implemented websites of any kind, and which of these cities have invested
in sophisticated websites that enable two-way communication and facilitate online transactions.
The findings show that less than 35% of Kentucky cities have websites at this time. Cities with
websites have, on average, larger populations. The cities with websites also have lower median ages;
lower percentages of whites, English-only speakers, home ownership, and registered Democrats; and
higher city revenues and per capita revenues. Cities with even larger populations and city revenues to
provide more sophisticated websites through online communication and transaction capabilities than
smaller cities that provide basic websites. Lack of Internet connectivity in smaller cities also impedes the
ability of citizens to use on-line services.
Multivariate regression analyses were conducted to determine the effect of several
demographic characteristics on e-government adoption and sophistication for Kentucky cities. Not
surprisingly, statistically significant indicators for both adoption and sophistication include the city
manager and mayor-council forms of government, internet availability, median age, and per capita
revenue. City population was a significant indicator only for sophistication. More surprisingly, holding
all other variables constant, the proportion of registered voters who are Democrats was found to have
substantial impacts on both adoption and sophistication. Previous literature does little to address why
this may be so.
4
Introduction
The Internet and web-based technologies continue to expand and evolve, as thousands of
companies invest billions of dollars to figure out the new best way to market their products and services
to hundreds of millions of consumers who surf the web each day. Connected to the World Wide Web,
consumers can make purchases online: selecting from billions of products from millions of possible
vendors; people can stay in touch with family and friends, listen to music, watch television and videos,
and engage in political debate all from anywhere in the world. It is clear that more businesses are
turning to web applications to tap into the growing online customer base. Universities are using
websites to reach prospective students, serve current students, and advance research. Nonprofit
organizations are using websites to reach prospective donors and to serve their clients. But why are
governments using websites and how are they using sophisticated web-based technologies to serve
their citizens? An estimated 213.6 million US citizens use the internet an average of 32.6 hours each
month so it makes sense that governments would want to develop web-based applications to reach
their citizens where their citizens are: the World Wide Web1. In this age where web-technologies
abound it is important to understand how and why governments use websites.
With the pervasiveness of Internet technologies and the prevalence of online shopping,
expectations for online transactions with governments are growing (Blackstone, Boganna & Hakim
2005). Numerous studies have shown that national governments around the world are successfully
implementing websites that allow their citizens to interact with various federal offices and departments
online (i.e. Graafland-Essers & Ettedgui 2003; United Nations 2005, 2008; West 2008a). Similarly,
previous research has found that all state governments have websites where citizens can find
information and complete online transactions (i.e. Gant & Gant 2002; McNeal, Tolbert, Mossberger &
Dotterweich 2003; West 2008b). For local governments, however, the few previous studies have mainly
1 These statistics are taken from estimates prepared by comScore Metrix, July 2010. http://www.comscore.com.
5
focused on nationwide or international samples of the largest cities, which as expected all offer
sophisticated e-government websites (i.e. Kaylor et. al. 2001; Urban, F. 2002; Kaylor 2005). I expect that
by presenting a statewide analysis of Kentucky city websites, my findings will provide valuable
information about how cities of all sizes are using web-technologies to provide services to their citizens.
In this paper, I investigate which demographics of municipalities in Kentucky make them likely to
turn to web-based technologies to provide online services to their citizens. I summarize the
demographics that make a municipality likely to invest in implementing web-based service provision. I
also look at the sophistication of these web services: which municipalities have sophisticated e-
government capabilities that allow online financial and serve transactions, and which do not. Using
regression analysis, l then link these results to demographic differences between communities. This is
an important first step in answering the larger question of whether or not there is room for more
municipalities to utilize sophisticated e-government services to improve service provision to their
citizens.
Research Question
Surveying Kentucky city websites can provide valuable insight into how various types of cities
are using web-based e-government technologies to serve their citizens. In this paper I examine which
types of cities, organized along several demographic variables, have implemented websites of any kind,
and which of these cities have invested in sophisticated websites that enable two-way communication
and facilitate online transactions.
Literature Review
Electronic government, or “E-Government,” has been a rising topic for public administrators
since Internet technologies exploded into the 1990s. The Internet is not the first communications
technology to have a drastic impact on the workings of government, but Internet technologies have
6
been adopted much more quickly than the telephone, radio, and television technologies of the past.
Attempting to theorize the changes that e-government has had and will continue to have on
governments, several dichotomies have been drawn between the traditional models of public
administration and the new customer-service models driven by online service provision (Ho 2002;
Melitski 2003; Musso, Weare & Hale 1999).
Melitski (2003) outlines two competing paradigms that frame how governments operate their e-
government service: the Information Technology (IT) paradigm and the public administration (PA)
paradigm. The IT paradigm arose during the 1980s and early 1990s. During this time, before the
advancement of the Internet, governments’ IT functions were limited to a few large mainframe
computers which could be used only by technically trained IT managers. Since these IT managers were
the sole users of the government technologies, they planned, designed and implemented technologies
based on their preferences and technical abilities alone. The newer PA paradigm, on the other hand,
arose with the widespread adoption of the Internet in the late 1990s into the twenty-first century. As
more and more people began using the World Wide Web, technical knowledge grew among
government employees and citizens. As employees and citizens became familiar with technologies, they
began demanding increased e-government services.
Though these two distinct paradigms developed decades ago, they both still remain in conflict
today. In the IT paradigm, sophisticated technologies provided through e-government are rationally
analyzed for efficiency and effectiveness in delivering services to the citizens. Technologies are
evaluated based upon cost, upon how they will help the government streamline processes, and upon
whether the IT managers have the skills and abilities to develop. The new PA paradigm, on the other
hand, focuses new technologies on the demand from the citizens, placing less emphasis on rational
analysis. Research from other authors has continued to focus on the new customer-service centered
7
approach that many governments have adopted. The “e-government paradigm” (Ho 2002) and the
“entrepreneurial model” (Musso, Weare & Hale 1999) offer similar explanations of how governments
have become more focused on serving their citizens as customers as they have begun implementing
emerging e-government technologies.
Governments which provide online transaction capabilities for their citizens are utilizing the
same technologies that businesses use to connect to their customers through e-commerce. Similarly, as
e-commerce continues to expand, it is likely that citizens will expect similar types of online services from
their local governments, as asserted by Kratz (2005):
“The Internet has enabled consumers to shop, obtain information, and conduct business
24-hours a day at their convenience. These experiences have led citizens to expect the
same convenience and cost-effective delivery of government services. For the
government willing to embrace the digital economy, the results can be very beneficial.”
(Kratz 2005, 207).
Defining E-Government
An important step in understanding how governments are using e-government services is to
define “e-government” for the purpose of this paper. Several definitions exist, each emphasizing
different aspects of different technologies that governments use to reach the public. Some authors
include internal networking and file-sharing capabilities as a part of the e-government provision (Moon
2002). Brown & Brudney (2004) include in their definition that e-government specifically targets
“citizens, business partners, employees and other government entities.” For the purpose of my paper,
however, I prefer a broad-based Internet specific definition of e-government like that of West (2004):
8
“E-government refers to the delivery of government information and services online
through the Internet…Unlike traditional structures, which are hierarchical, linear, and
one-way, internet delivery systems are nonhierarchical, nonlinear, two-way, and
available 24 hours a day, seven days a week.” (West 2004, 16).
Previous Studies of Local E-Government
Surprisingly, though e-government has been researched since the turn of the century, there
have been relatively few surveys of e-government at the local level. In 2000, ICMA (International
City/County Management Association) partnered with Public Technology, Inc, (PTI) to complete the
2000 Electronic Government Survey. Their survey gathered data from nearly 1,900 local governments,
with populations of 10,000 or larger, from across the nation regarding the “extent to which local
governments…were engaged in e-government, including such things as having sites on the World Wide
Web and providing information and delivering services electronically” (Holden, Norris & Fletcher 2003,
332-3). Holden and his associates (2003) analyzed the survey results and found that 83.6% of
responding governments had websites. Wanting to go beyond website adoption, the authors also
assessed website sophistication. Less than 3% of responding local governments reported that their
websites allowed online transactions, though 49% of those without these services responded that such
features were in planning or development.
My methodology for studying the city websites in Kentucky will be similar to Musso, Weare, and
Hale’s (1999) study of 270 municipal websites in California. They evaluated the presence and
sophistication of e-government websites for Californian cities. A city website was defined in their study
to be “any site, either public or privately provided, that includes information about a municipality”
(Musso, Weare & Hale 1999, 8). This wide definition of a city website may have been suitable for 1999
when websites were relatively new and sparse, but in my study I will limit a city website to an “official”
9
city website offered by the city itself. By comparing the sophistication of the websites with various city
characteristics, the authors report several findings:
Cities with websites have larger populations, higher levels of government expenditures and
revenues, and higher levels of voter registration;
Residents of cities with websites are slightly older and of higher socio-economic status, as
indicated by higher median income and higher percentage with college education
Evaluating E-Government Sophistication
Two general methods exist for evaluating varying levels of sophistication of e-government
websites: the stage method and the function method. The stage method is widely used to describe e-
government sophistication by a series of progressive stages of communication (Layne & Lee 2001, Moon
2002, West 2004). Layne & Lee (2001) were among the first to develop a stage-based framework for
evaluating e-government websites. The four stages they used are cataloguing, transaction, vertical
integration, and horizontal integration. Cataloguing refers to the use of a government’s website as an
online catalogue presenting information that can be accessed online. Transaction builds upon the
catalogue approach and enables web-users to conduct financial or service transactions via a web-based
form. The higher stages of vertical and horizontal integration connect the user to opportunities to
conduct transactions with higher levels of government or other municipal governments’ websites.
Through vertical and horizontal integration, citizens are able to access complete “one-stop-shopping,”
performing all of their e-government transactions, via one government websites.
While integration is the highest stage of sophistication as outlined by Layne & Lee, other authors
place online services enabling political participation as the highest stage (Moon 2002; West 2004). E-
voting, despite several failed attempts, remains plagued by security threats. Fear of hacking, especially
hacking that might remain undetected, to change the outcome of elections remains a major detriment
10
to the development of e-voting technologies. While e-voting may not be currently feasible with the
fears involving protecting sensitive information, it is likely that one day we could see these sophisticated
uses of government websites.
Characteristics of Internet Users
Cities with more web users will likely have a higher demand for e-government services.
Similarly, cities with many web users will likely see greater benefits from implementing sophisticated
websites than cities without many web users. To understand the sophistication of city websites, then, it
is important to know which demographics of a population make citizens of that community likely to use
the internet.3
While investigating American Internet users, Horrigan (2010) found that 78% of adults in the
United States regularly use the Internet. Those adults most likely to use the internet are those with a
college degree and high incomes, who are not senior citizens, and who are white. Low levels of
education or income, being a minority, and being 65 years old or older were found as significant
indicators of low levels of internet usage. City-wide demographics which other authors have found
significant are type of government structure, total population, percent of the population speaking only
English, government revenues, home-ownership rates, and voter registration rates (Holden, Norris &
Fletcher 2003; Moon 2002; West 2003).
Data and Methodology
The 414 Kentucky cities analyzed in this report were drawn from the online membership
directory of the Kentucky League of Cities2. These cities and their websites were investigated by the
2 There are actually 419 cities in Kentucky. Five incorporated cities are not included in Kentucky League of Cities’
online membership directory and where thus not included in the sample when the author analyzed the websites.
11
author during October/November 2010. For those cities with websites, the web content was analyzed
according to Moon’s five stages of e-government sophistication (Moon 2002). Moon uses a stage
method to classify e-government sophistication into five distinct stages. Stage One involves a one-way
information exchange, with the government using its website as a virtual bulletin board: a place to post
information and distribute it to citizens and visitors. Stage Two involves a two-way information
exchange, with the website allowing communication between the government and the user, utilizing
chat rooms, contact forms or email technologies. Stage Three is when a web user can complete
financial or service transactions online. Examples of Stage Three capabilities would be paying utility bills
or scheduling service appointments through web-based applications. Stage Four moves beyond
completing transactions with one municipality and incorporates vertical and horizontal integration, with
the website becoming a one-stop shop that allows citizens to complete transactions with different
governments at once. Finally, Stage Five e-government capabilities involve the ability to complete
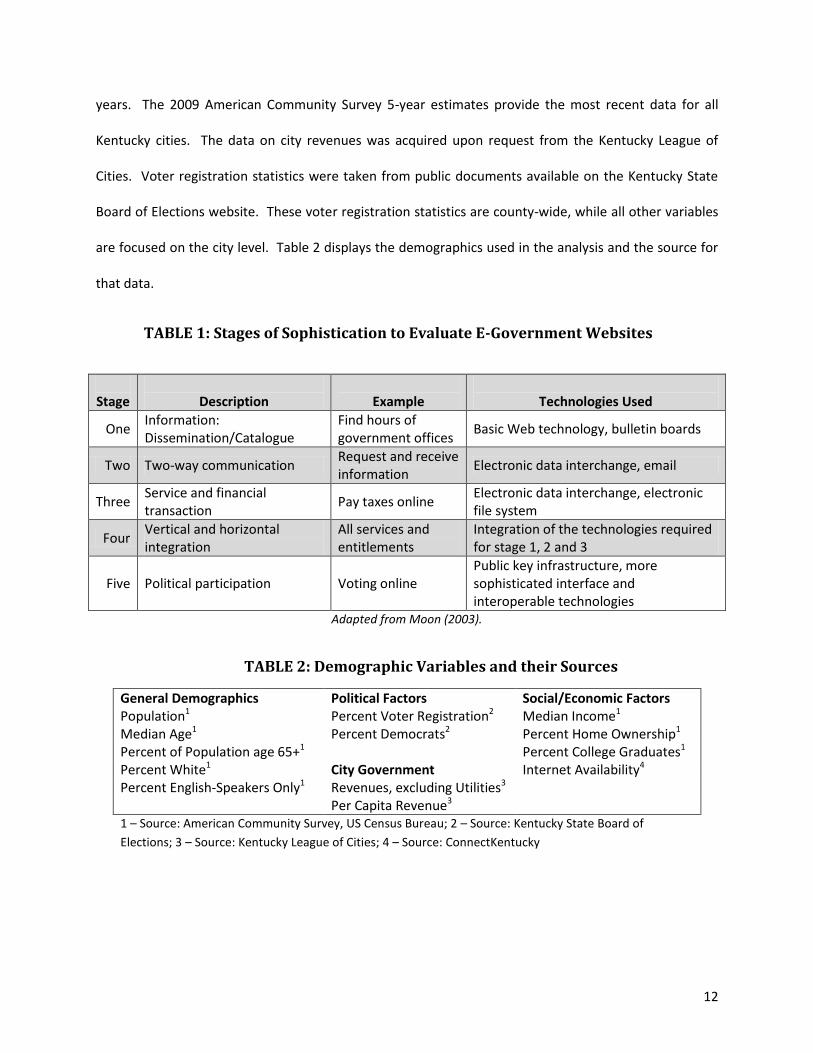
democratic activities over the internet, such as voting or signing petitions. The precise methodology for
determining stage of sophistication is presented in Appendix A. Table 1 provides examples of each stage
and describes the technologies required to implement the service.
The main data source for the analysis presented here is the 2009 American Community Survey
5-year Estimates from the US Census Bureau. This data provides the recent data covering all Kentucky
cities. The annual one-year estimates of the American Community Survey only include large cities.
While the decennial census data is the most precise data available, the 2010 census results were not yet
available at the city level at the time of analysis and the 2000 census data is too outdated. Recent data
is very important for this study because websites are relatively new technologies and most of the
Kentucky cities with websites have likely implemented their web-based e-government in the last few
Rather than analyze these five cities’ websites at a separate time from the main sample, they were just left out. These five omitted cities are Bellemeade, Lone Oak, Wheatcroft, Whitley City, and Woodbury.
12
years. The 2009 American Community Survey 5-year estimates provide the most recent data for all
Kentucky cities. The data on city revenues was acquired upon request from the Kentucky League of
Cities. Voter registration statistics were taken from public documents available on the Kentucky State
Board of Elections website. These voter registration statistics are county-wide, while all other variables
are focused on the city level. Table 2 displays the demographics used in the analysis and the source for
that data.
TABLE 1: Stages of Sophistication to Evaluate E-Government Websites
Stage
Description
Example
Technologies Used
One Information: Dissemination/Catalogue
Find hours of government offices
Basic Web technology, bulletin boards
Two Two-way communication Request and receive information
Electronic data interchange, email
Three Service and financial transaction
Pay taxes online Electronic data interchange, electronic file system
Four Vertical and horizontal integration
All services and entitlements
Integration of the technologies required for stage 1, 2 and 3
Five Political participation Voting online Public key infrastructure, more sophisticated interface and interoperable technologies
Adapted from Moon (2003).
TABLE 2: Demographic Variables and their Sources
General Demographics Political Factors Social/Economic Factors Population1 Percent Voter Registration2 Median Income1
Median Age1 Percent Democrats2 Percent Home Ownership1
Percent of Population age 65+1 Percent College Graduates1
Percent White1 City Government Internet Availability4
Percent English-Speakers Only1 Revenues, excluding Utilities3 Per Capita Revenue3 1 – Source: American Community Survey, US Census Bureau; 2 – Source: Kentucky State Board of
Elections; 3 – Source: Kentucky League of Cities; 4 – Source: ConnectKentucky
13
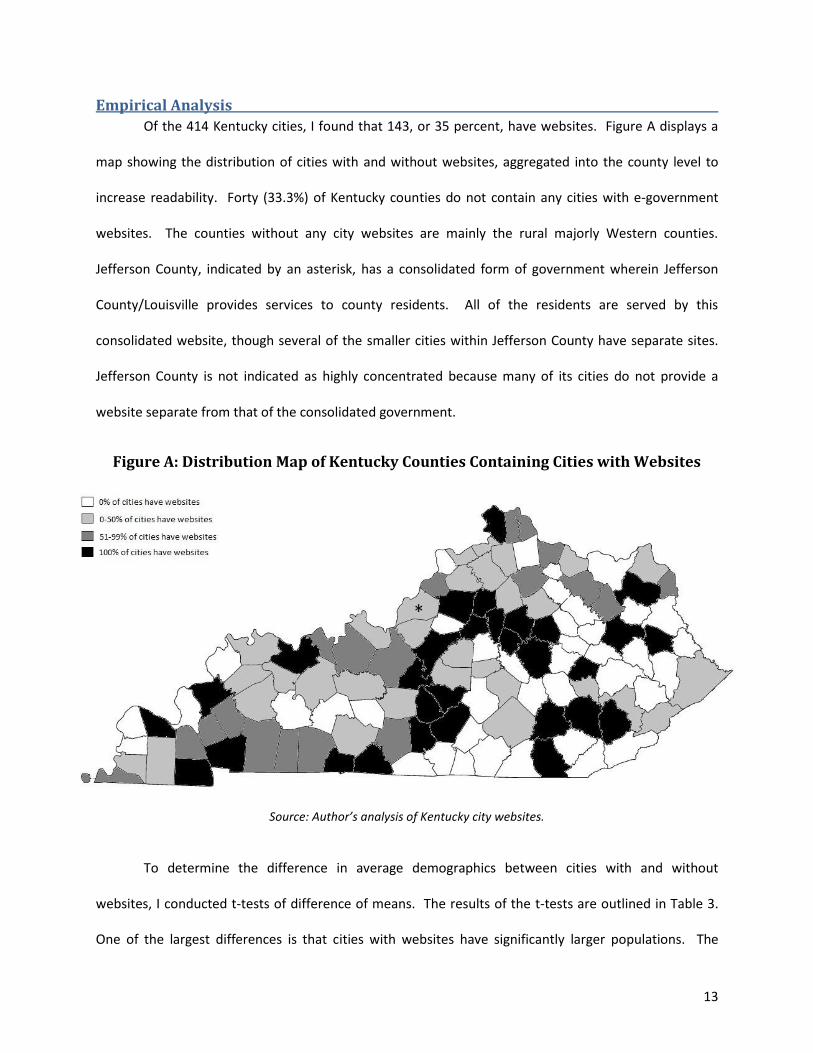
Empirical Analysis
Of the 414 Kentucky cities, I found that 143, or 35 percent, have websites. Figure A displays a
map showing the distribution of cities with and without websites, aggregated into the county level to
increase readability. Forty (33.3%) of Kentucky counties do not contain any cities with e-government
websites. The counties without any city websites are mainly the rural majorly Western counties.
Jefferson County, indicated by an asterisk, has a consolidated form of government wherein Jefferson
County/Louisville provides services to county residents. All of the residents are served by this
consolidated website, though several of the smaller cities within Jefferson County have separate sites.
Jefferson County is not indicated as highly concentrated because many of its cities do not provide a
website separate from that of the consolidated government.
Figure A: Distribution Map of Kentucky Counties Containing Cities with Websites
Source: Author’s analysis of Kentucky city websites.
To determine the difference in average demographics between cities with and without
websites, I conducted t-tests of difference of means. The results of the t-tests are outlined in Table 3.
One of the largest differences is that cities with websites have significantly larger populations. The
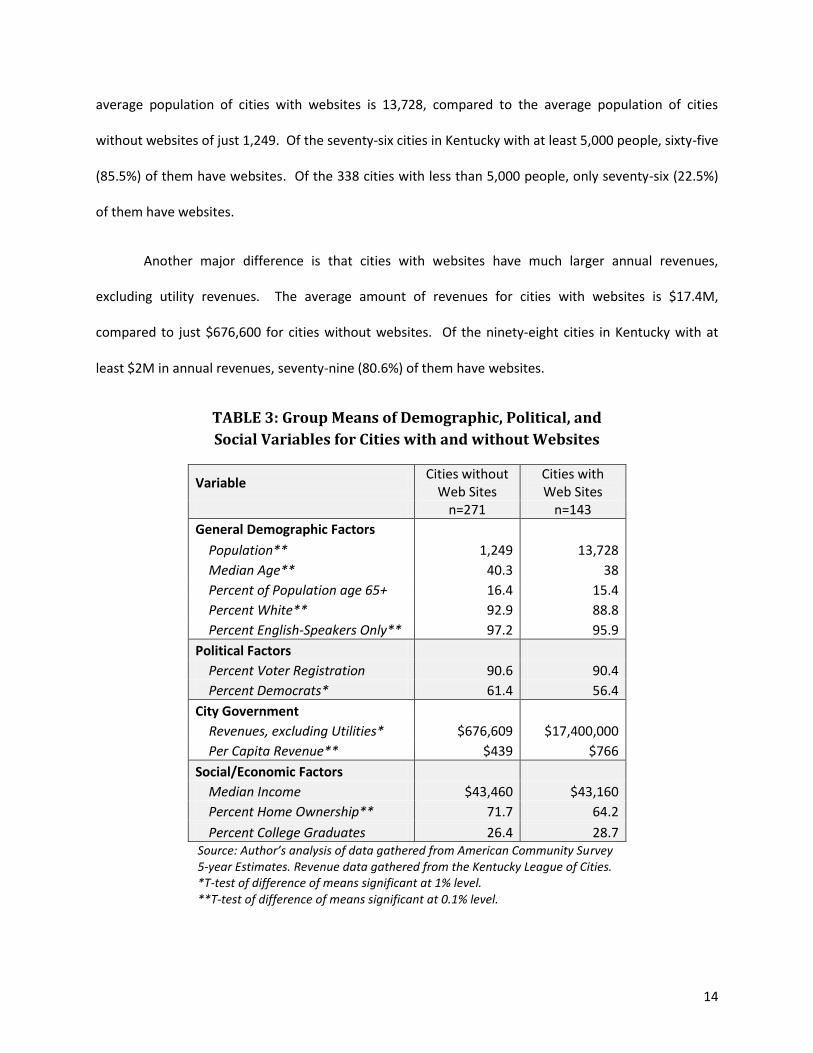
14
average population of cities with websites is 13,728, compared to the average population of cities
without websites of just 1,249. Of the seventy-six cities in Kentucky with at least 5,000 people, sixty-five
(85.5%) of them have websites. Of the 338 cities with less than 5,000 people, only seventy-six (22.5%)
of them have websites.
Another major difference is that cities with websites have much larger annual revenues,
excluding utility revenues. The average amount of revenues for cities with websites is $17.4M,
compared to just $676,600 for cities without websites. Of the ninety-eight cities in Kentucky with at
least $2M in annual revenues, seventy-nine (80.6%) of them have websites.
TABLE 3: Group Means of Demographic, Political, and
Social Variables for Cities with and without Websites
Variable Cities without
Web Sites Cities with Web Sites
n=271 n=143
General Demographic Factors
Population** 1,249 13,728
Median Age** 40.3 38
Percent of Population age 65+ 16.4 15.4
Percent White** 92.9 88.8
Percent English-Speakers Only** 97.2 95.9
Political Factors
Percent Voter Registration 90.6 90.4
Percent Democrats* 61.4 56.4
City Government
Revenues, excluding Utilities* $676,609 $17,400,000
Per Capita Revenue** $439 $766
Social/Economic Factors
Median Income $43,460 $43,160
Percent Home Ownership** 71.7 64.2
Percent College Graduates 26.4 28.7 Source: Author’s analysis of data gathered from American Community Survey 5-year Estimates. Revenue data gathered from the Kentucky League of Cities. *T-test of difference of means significant at 1% level. **T-test of difference of means significant at 0.1% level.
15
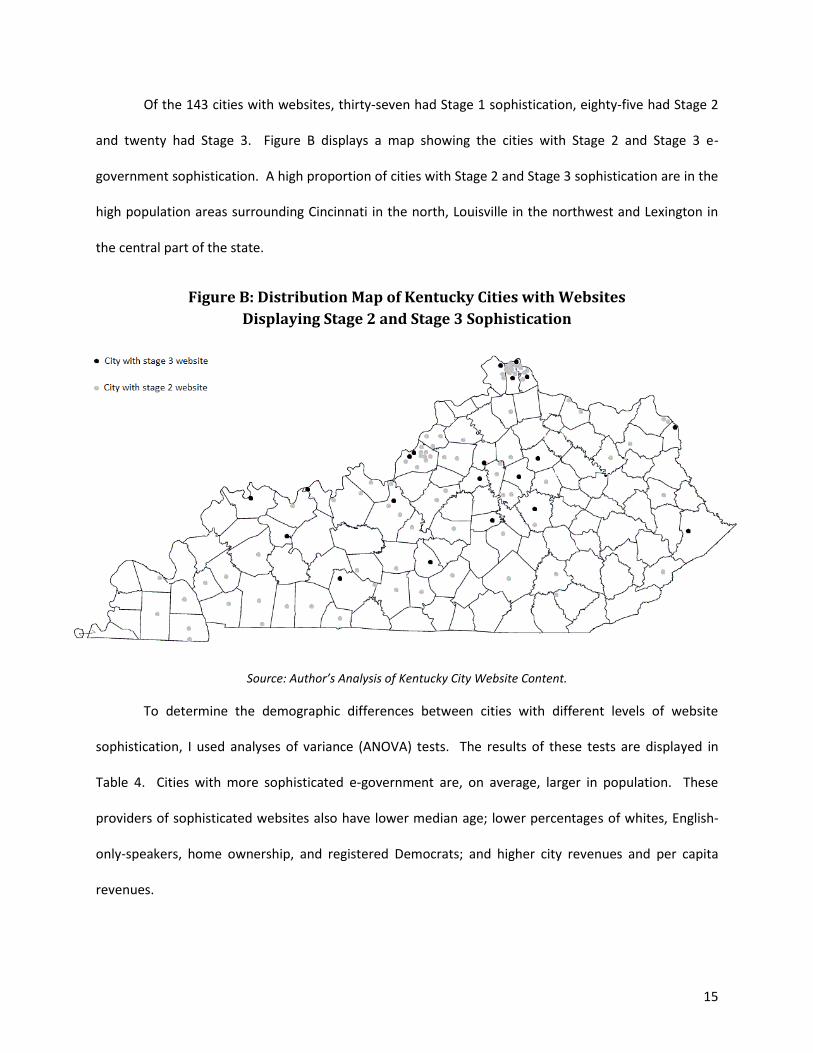
Of the 143 cities with websites, thirty-seven had Stage 1 sophistication, eighty-five had Stage 2
and twenty had Stage 3. Figure B displays a map showing the cities with Stage 2 and Stage 3 e-
government sophistication. A high proportion of cities with Stage 2 and Stage 3 sophistication are in the
high population areas surrounding Cincinnati in the north, Louisville in the northwest and Lexington in
the central part of the state.
Figure B: Distribution Map of Kentucky Cities with Websites
Displaying Stage 2 and Stage 3 Sophistication
Source: Author’s Analysis of Kentucky City Website Content.
To determine the demographic differences between cities with different levels of website
sophistication, I used analyses of variance (ANOVA) tests. The results of these tests are displayed in
Table 4. Cities with more sophisticated e-government are, on average, larger in population. These
providers of sophisticated websites also have lower median age; lower percentages of whites, English-
only-speakers, home ownership, and registered Democrats; and higher city revenues and per capita
revenues.
16
TABLE 4: Group Means of Demographic, Political and Social Variables for Cities with Various Stages of Website Sophistication
Variable No Website Stage 1 Stage 2 Stage 3
n=272 n=37 n=85 n=20
General Demographic Factors
Population** 1,248 2,815 8,590 58,913
Median Age** 40.4 38.9 37.7 36.7
Percent of Population age 65+ 16.4 16.4 15.2 13.9
Percent White** 92.9 91.7 87.7 87.4
Percent English-Speakers Only** 97.2 96.8 95.6 94.9
Political Factors
Percent Voter Registration 90.5 90.2 90.8 89.6
Percent Democrats* 61.4 58.3 54.9 58.8
City Government
Revenues, excluding Utilities** $677,074 $2,175,699 $8,425,413 $87,100,000
Per Capita Revenue** $439 $710 $765 $887
Social/Economic Factors
Median Income $43,530 $33,600 $46,822 $44,185
Percent Home Ownership** 72.0 61.9 64.9 61.5
Percent College Degree 26.5 21.1 31.1 31.5 Source: Author’s analysis of data gathered from American Community Survey 5-year Estimates. Revenue data received from Kentucky League of Cities. *ANOVA test of difference of means significant at 1% level. **ANOVA test of difference of means significant at 0.1% level.
The two variables with the clearest relationship with e-government sophistication are city
revenues and population. When these variables are cross tabulated with stage of sophistication, the
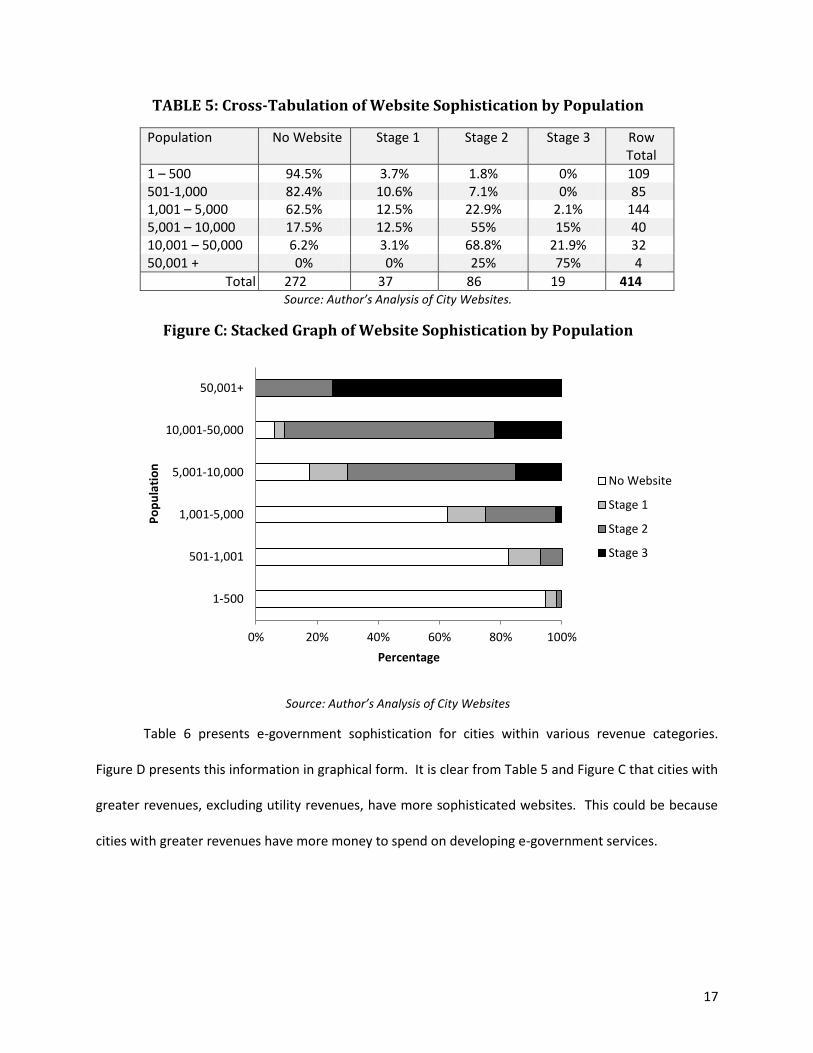
relationships are easy to see. Table 5 presents e-government sophistication for cities within different
categories of population. Figure C presents the same information in a graphical form. It is clear from
Table 5 and Figure C that cities with larger populations have more sophisticated websites. This seems
reasonable since, as discussed above, a larger population can be interpreted as increased demand for e-
government services.
17
TABLE 5: Cross-Tabulation of Website Sophistication by Population
Population No Website Stage 1 Stage 2 Stage 3 Row Total
1 – 500 94.5% 3.7% 1.8% 0% 109 501-1,000 82.4% 10.6% 7.1% 0% 85 1,001 – 5,000 62.5% 12.5% 22.9% 2.1% 144 5,001 – 10,000 17.5% 12.5% 55% 15% 40 10,001 – 50,000 6.2% 3.1% 68.8% 21.9% 32 50,001 + 0% 0% 25% 75% 4
Total 272 37 86 19 414 Source: Author’s Analysis of City Websites.
Figure C: Stacked Graph of Website Sophistication by Population
Source: Author’s Analysis of City Websites
Table 6 presents e-government sophistication for cities within various revenue categories.
Figure D presents this information in graphical form. It is clear from Table 5 and Figure C that cities with
greater revenues, excluding utility revenues, have more sophisticated websites. This could be because
cities with greater revenues have more money to spend on developing e-government services.
0% 20% 40% 60% 80% 100%
1-500
501-1,001
1,001-5,000
5,001-10,000
10,001-50,000
50,001+
Percentage
Po
pu
lati
on
No Website
Stage 1
Stage 2
Stage 3
18
TABLE 6: Cross-Tabulation of Website Sophistication by Revenues, Excluding Utility Revenues
Revenues, Excluding Utility Revenues
No Website Stage 1 Stage 2 Stage 3 Row Total
$1 - $50,000 97.4% 2.6% 0% 0% 39 $50,001 - $100,000 90.9% 5.2% 3.9% 0% 25 $100,001 - $500,000 86% 7.3% 5.5% 0.9% 109 $500K - $1M 65.9% 13.6% 18.2% 2.2% 44 $1M - $5M 44.9% 15.7% 34.8% 4.5% 89 $5M - $10M 13.0% 21.7% 52.2% 13.0% 23 $10M - $50M 0 0 73.9% 26.1% 23 $50M + 0 0 40% 60% 5
Total 225 36 78 18 357 Source: Author’s analysis of data obtained from the Kentucky League of Cities.
Figure D: Stacked Graph of Website Sophistication by Revenues, Excluding Utility Revenues
Source: Author’s Analysis of City Websites.
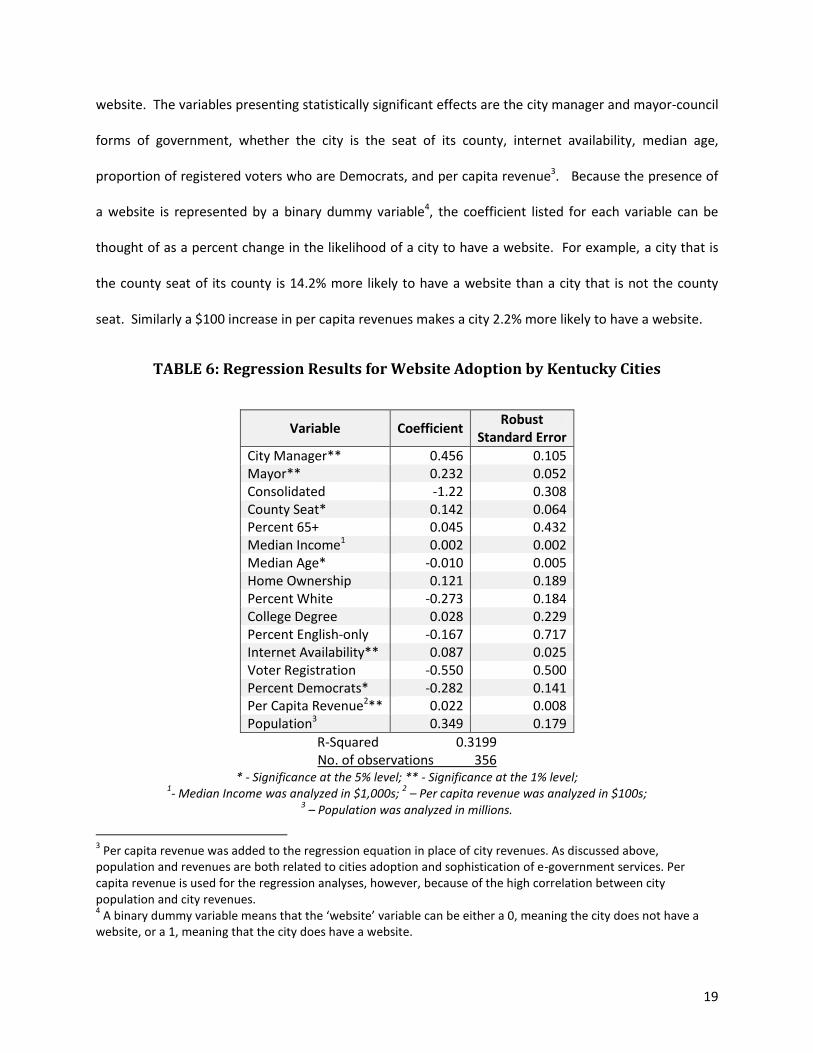
To determine the effect the variables have upon the adoption of websites, holding all other
variables constant, I conducted a multivariate regression analysis. Table 6 shows the output from this
analysis. This test determines the impact that each of the variables has upon whether or not a city has a
0% 20% 40% 60% 80% 100%
$1-$50K
$50K-$100K
$100K-$500K
$500K-$1M
$1M-$5M
$5M-$10M
$10M-$50M
$50M+
Percentage
Re
ven
ue
s, E
xclu
din
g U
tilit
y R
eve
nu
es
No Website
Stage 1
Stage 2
Stage 3
19
website. The variables presenting statistically significant effects are the city manager and mayor-council
forms of government, whether the city is the seat of its county, internet availability, median age,
proportion of registered voters who are Democrats, and per capita revenue3. Because the presence of
a website is represented by a binary dummy variable4, the coefficient listed for each variable can be
thought of as a percent change in the likelihood of a city to have a website. For example, a city that is
the county seat of its county is 14.2% more likely to have a website than a city that is not the county
seat. Similarly a $100 increase in per capita revenues makes a city 2.2% more likely to have a website.
TABLE 6: Regression Results for Website Adoption by Kentucky Cities
Variable Coefficient Robust
Standard Error
City Manager** 0.456 0.105 Mayor** 0.232 0.052 Consolidated -1.22 0.308 County Seat* 0.142 0.064 Percent 65+ 0.045 0.432 Median Income1 0.002 0.002 Median Age* -0.010 0.005 Home Ownership 0.121 0.189 Percent White -0.273 0.184 College Degree 0.028 0.229 Percent English-only -0.167 0.717 Internet Availability** 0.087 0.025 Voter Registration -0.550 0.500 Percent Democrats* -0.282 0.141 Per Capita Revenue2** 0.022 0.008 Population3 0.349 0.179
R-Squared 0.3199 No. of observations 356
* - Significance at the 5% level; ** - Significance at the 1% level; 1- Median Income was analyzed in $1,000s;
2 – Per capita revenue was analyzed in $100s;
3 – Population was analyzed in millions.
3 Per capita revenue was added to the regression equation in place of city revenues. As discussed above,
population and revenues are both related to cities adoption and sophistication of e-government services. Per capita revenue is used for the regression analyses, however, because of the high correlation between city population and city revenues. 4 A binary dummy variable means that the ‘website’ variable can be either a 0, meaning the city does not have a
website, or a 1, meaning that the city does have a website.
20
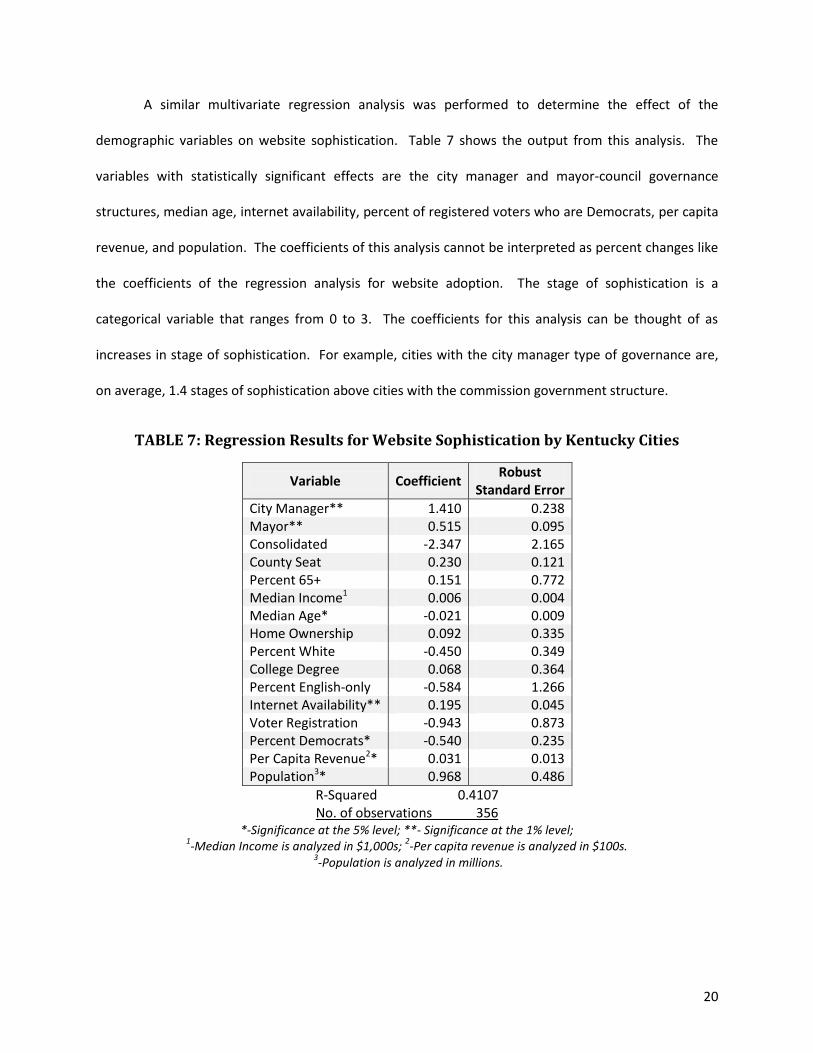
A similar multivariate regression analysis was performed to determine the effect of the
demographic variables on website sophistication. Table 7 shows the output from this analysis. The
variables with statistically significant effects are the city manager and mayor-council governance
structures, median age, internet availability, percent of registered voters who are Democrats, per capita
revenue, and population. The coefficients of this analysis cannot be interpreted as percent changes like
the coefficients of the regression analysis for website adoption. The stage of sophistication is a
categorical variable that ranges from 0 to 3. The coefficients for this analysis can be thought of as
increases in stage of sophistication. For example, cities with the city manager type of governance are,
on average, 1.4 stages of sophistication above cities with the commission government structure.
TABLE 7: Regression Results for Website Sophistication by Kentucky Cities
Variable Coefficient Robust
Standard Error
City Manager** 1.410 0.238 Mayor** 0.515 0.095 Consolidated -2.347 2.165 County Seat 0.230 0.121 Percent 65+ 0.151 0.772 Median Income1 0.006 0.004 Median Age* -0.021 0.009 Home Ownership 0.092 0.335 Percent White -0.450 0.349 College Degree 0.068 0.364 Percent English-only -0.584 1.266 Internet Availability** 0.195 0.045 Voter Registration -0.943 0.873 Percent Democrats* -0.540 0.235 Per Capita Revenue2* 0.031 0.013 Population3* 0.968 0.486
R-Squared 0.4107 No. of observations 356
*-Significance at the 5% level; **- Significance at the 1% level; 1-Median Income is analyzed in $1,000s;
2-Per capita revenue is analyzed in $100s.
3-Population is analyzed in millions.
21
Discussion
The findings show that there are many cities in Kentucky that are using e-government to provide
services to their citizens. Citizens of these cities have websites where they can at least access basic
information about their local governments. The larger and wealthier communities are more likely to
have sophisticated e-government websites which allow citizens to conduct financial and service
transactions over the internet.
The findings also show that there are many cities in Kentucky that do not have a website. Less
than 35% of cities currently have websites, leaving more than 65% of cities without online e-government
services. Though whether or not these cities feasibly can or should implement e-government websites
is beyond the scope of this analysis, we can assume that as time advances and web technologies
become even cheaper to produce and maintain that more cities will adopt websites. Similarly cities with
websites will likely develop new technologies to make their e-government services more sophisticated,
providing enhanced abilities for citizens to connect and communicate with the city government online.
Economic Analysis of Significant Indicators
According to fundamental economics, we would expect that cities with increased demand from
their citizens for e-government services would be more likely to have websites. Some of the factors
found to affect the adoption and sophistication of Kentucky city websites can be thought of as
associated with demand for e-government. A city’s population is a clear example: cities with 100,000
citizens will likely have much greater demand for city websites than cities with 1,000 citizens. Median
age and internet availability likely affect the demand in that younger people with greater internet access
are more likely to use the internet, and thus more likely to demand e-government than citizens who use
the internet less often. Per capita revenue, on the other hand, is likely to affect the supply of e-
22
government services. Cities with more resources have greater ability to spend money on developing e-
government services.
Mayor-council and city manager structures of city governance are likely indicators of higher
adoption and sophistication because of the power centralized in the mayor or the city manager. In
these forms of government, there is an authority figure that has a strong centralized decision-making
role in leading the administration for the city. With this centralized power, the mayor or city manager
likely has increased ability to implement a city website, especially compared to the public officials in the
less centralized commission structure of governance.
The percent of registered voters who are Democrats as a negative indicator of city website
adoption and sophistication, however, is more difficult to explain. Holding other variables constant
through linear regression, there is no clear reason why cities with fewer Democrats are more likely to
have websites. Previous research has shown that party affiliation can depend upon region so perhaps
this indicates regional effects which are not accounted for elsewhere in the regression analysis. Another
possibility is that cities with fewer Democrats are more likely to vote in a mayor or city manager with
corporate business experience who would have experience implementing websites for e-commerce
purposes. The correct reason why percent registered Democrats affects adoption and sophistication of
city websites remains unknown.
Potential Benefits of Increased Adoption and Sophistication
Local governments across the country are struggling to provide services to their citizens while
balancing their strained budgets. As one method of cost reduction, governments are “turning to online
or electronic government service-delivery solutions to improve citizen access and *to+ reduce costs”
(Brown & Brudney, 96). It is widely accepted that e-commerce, online transactions between the public
and businesses, has resulted in cost-savings to private firms (Borenstein & Saloner 2001). While e-
23
government has been slower to evolve, it is likely that governments can expect some degree of cost
savings from replacing some of the paper-based face-to-face transactions with automated electronic
exchanges. Arizona, for example, has seen substantial cost-savings through online vehicle registrations,
with costs of just 2 cents per e-payment while the mail-based method previously cost 43 cents per check
(Eggers 2004, 28, as cited by Blackstone, Boganno & Hakim 2005).
It is important for governments to understand that they will also likely achieve benefits for
internal staff. With online transactions facilitated by e-government websites, city employees will likely
experience increased efficiency, letting them be more productive with their time (Moulder 2002b).
Forms that facilitate automatic online transactions for citizens will likely decrease the workload of
reading, sorting and filing paper applications for staff. Because of these benefits of increased adoption
and sophistication of city websites, state policymakers should consider ways to encourage cities to
invest in online technologies. While grants for creating local government websites might not be feasible
in the current budget situation there are alternatives methods that state lawmakers could take to
increase local e-government. The Commonwealth Office or Technology or perhaps the League of Cities
could create a state-wide template that cities could easily customize to present important city
information and to enable online communication with city officials at low cost.
Direction for Future Research
As we look towards understanding how governments have adopted e-government practices to
better serve their citizens, we need to remember how expectations work. The better off a group
becomes, the higher their expectations rise which only leads to them desiring more still (James 2007).
As governments develop more and more sophisticated e-government practices that enhance the ease
with which their citizens can conduct exchanges with their public officials, the citizens will experience
increased expectations for more still. Continuous research into the new practices in e-government is
24
needed to research how governments are continuing to adopt the new technologies. Though it is
beyond the scope of this project, I imagine that e-government will be continue to change over the next
few years as social networking expands at an increasing rate. Social media has already become a major
management issue as local governments struggle with how to interact with their citizens through
websites like Facebook and Twitter (Bertot, Jaeger & Grimes 2010). The effectiveness of local
government websites is another topic for future research. It is clear that e-government at the local level
is something that many cities are using to reach their citizens, but any perceived gains in efficiency or
effectiveness have not been tested.
References
Bertot, J.C., Jaeger, P.T. & Grimes, J.M. (2010) Using ICTs to create a culture of transparency: E-government and social media as openness and anti-corruption tools for societies. Government Information Quarterly, 27(3), 264-271.
Blackstone, E.A., Boganna, M.L. & Hakim, S. (Eds.). (2005) Innovations in e-government: The thoughts of governors and mayors. Lanham, MD: Rowman & Littlefield.
Borenstein, S. & Saloner, G. (2001) Economics and electronic commerce. Journal of Economic Perspectives, 15(1). 3-12.
Brown, M.M. & Brudney, J.L. (2004) Achieving advanced electronic government services: opposing environmental constraints. Public Performance & Management Review, 28(1), 96-113.
Chen, Y. & Perry, J. (2003) Outsourcing for e-government: Managing for success. Public Performance & Management Review, 26(4), 404-421.
Eggers, W.D. (2004) Government 2.0: Using technology to improve education, cut red tape, reduce gridlock, and enhance democracy. Lanham, MD: Rowman & Littlefield.
European Commission, Directorate General for Information Society and Media. (2009) Smarter, faster, better eGovernment: 8th benchmark measurement.
Federal Communications Commission (2010) National broadband plan: Connecting America.
Fletcher, P.D., Holden, S.H. & Norris, D.F. (2001) E-government: Planning, funding and outsourcing. Washington, DC: International City/County Management Association.
Gant, J.P. & Gant, D.B. (2002) Web portal functionality and state government e-service. Proceedings of the 35th Hawaii International Conference on System Sciences – 2002. <http://ieeexplore.ieee.org/stamp/stamp.jsp?tp=&arnumber=994073> Accessed February 28, 2011.
25
Graafland-Essers, I. & Ettedgui, E. (2003) Benchmarking e-governmenti n Europe and the US. Santa Monica, CA: RAND.
Ho, A.T. (2002) Reinventing local governments and the e-government initiative. Public Administration Review, 62(4), 434-444.
Holden, S.H., Norris, D.F. & Fletcher, P.D. (2003) Electronic government at the local level: Progress to date and future issues. Public Performance & Management Review, 26(4), 325-344.
Horrigan, J.B. (2010) Broadband adoption and use in America. Federal Communications Commission Omnibus Broadband Initiative Working Paper Series.
James, O. (2007) Evaluating the expectations disconfirmation and expectations anchoring approaches to citizen satisfaction with local public services. Journal of Public Administration Research and Theory, 19(1), 107-123.
Kaylor, C., Deshazo, R. & Van Eck, D. (2001) Gauging e-government: A report on implementing services among American cities. Government Information Quarterly, 18(4), 293-307.
Kaylor, C.H. (2005) E-government, The next wave of e-government: The challenges of data architecture. Bulletin of the American Society for Information Science and Technology, 31(2), 18-22.
Kim, S. & Kim, D. (2003) South Korean public officials’ perceptions of values, failure, and consequences of failure in e-government leadership. Public Performance & Management Review, 26(4), 360-375.
Kratz, V. (2005) Delivering the promise of e-government. In Blackstone, E.A., Boganna, M.L. & Hakim, S. (Eds.). Innovations in e-government: The thoughts of governors and mayors. Lanham, MD: Rowman & Littlefield.
McNeal, R.S., Tolbert, C.J., Mossberger, K. & Dotterweich, L.J. (2003) Innovating in digital government in the American states. Social Science Quarterly, 84(1), 52-70.
Melitski, J. (2003) Capacity and e-government performance: An analysis based on early adopters of internet technologies in New Jersey. Public Performance & Management Review, 26(4), 376-390.
Moon, M.J. (2002) The evolution of e-government among municipalities: Rhetoric or reality? Public Administration Review, 62(4), 424-433.
Moulder, E. (2002a) E-government: What citizens want, what local governments provide. Washington, DC: International City/County Management Association.
---. (2002b) Inside e-government: Applications for staff. Washington, DC: International City/County Management Assocation.
Musso, J.A., Weare, C. & Hale, M.C. (1999) Designing web technologies for local governance reform: Good management or good democracy? Political Communication, 17(1), 1-19.
OECD. (2009) Rethinking e-government services: User-centered approaches. OECD E-Government Studies.
26
Welch, E.W. & Pandey, S. (2007) Multiple measures of website effectiveness and their association with service quality in health and human service agencies. Presented at the 40th Hawaii International Conference on System Sciences, 2007.
West, D.M. (2004). Public Administration Review, 64(1), 15-27.
--- (2008a). Improving technology utilization in electronic government around the world, 2008. Brookings Institution. http://www.brookings.edu/reports/2008/0817_egovernment_west.aspx> Accessed February 28, 2011.
--- (2008b). State and federal electronic government in the United States, 2008. Brookings Institution. <http://www.brookings.edu/~/media/Files/rc/reports/2008/0826_egovernment_west/0826_egovernment_west.pdf> Accessed February 28, 2011.
White, J.D. (2007) Managing Information in the Public Sector, M.E. Sharpe. Inc, New York.
United Nations (2005) Global e-government readiness report 2005: From e-government to e-inclusion. Department of Economic and Social Affairs Division for Public Administration and Development Management, UNPAN/2005/14.
--- (2010) United Nations e-government survey 2010: Leveraging e-government at a time of financial and economic crisis. Department of Economic and Social Affairs Division for Public Administration and Development Management, ST/ESA/PAD/SER.E/131.
Urban, F. (2002) Small town, big website? Cities and their representation on the internet. Cities, 19(1), 49-59.
27
Appendix A: Methodology for Determining Website Stage
Stage One: one-way information exchange. I classified a website as Stage One if it included any
information related to city/county government, city/county events, or city/county services. Any
reference at all to anything related to the municipal government or what the municipal government
does I counted as Stage One sophistication.
Stage Two: two-way information exchange. To be classified as Stage Two, a website had to include
either a web-based contact form or at least three linked email addresses of three different specific
people within the government. The contact form must contain a field asking for the web user’s contact
information and must include a submit button that automatically emails the contained information to a
municipal employee.
Stage Three: transaction facilitation. I classified a website as Stage Three if it had web-based
applications that allowed web users to complete transactions online. Specifically I looked for any web-
application accessible through the municipal’s website where users could pay bills or taxes online,
schedule appointments at government buildings, or perform similar transaction functions. The presence
of a web application alone made the website a Stage Three, as I did not test to make sure the
applications worked. A few websites had “Pay your utility bills online” webpages that said the pages
were currently were being developed but were not currently operating. I did not count these websites
as having Stage Three sophistication.
Stage Four: vertical/horizontal integration. I did not find any websites with Stage Four sophistication. To
qualify for Stage Four a website must have had web-based applications where the web user could
complete transactions with multiple municipalities: a true one-stop shop for online e-government
provision.
Stage Five: online political functioning. Again, I did not find any websites with Stage Five sophistication.
To qualify for Stage Five a website must have allowed online voting or online petitions.
In determining stage, I did not let lack of an early stage prevent me for looking for advanced stages. For
example, if a website did not have Stage Two’s two-way communication, I would have still counted
Stage Four if I had observed horizontal integration to another municipality. That said, I did not see any
instances where a municipality had an advanced stage when they were lacking an earlier one.
28
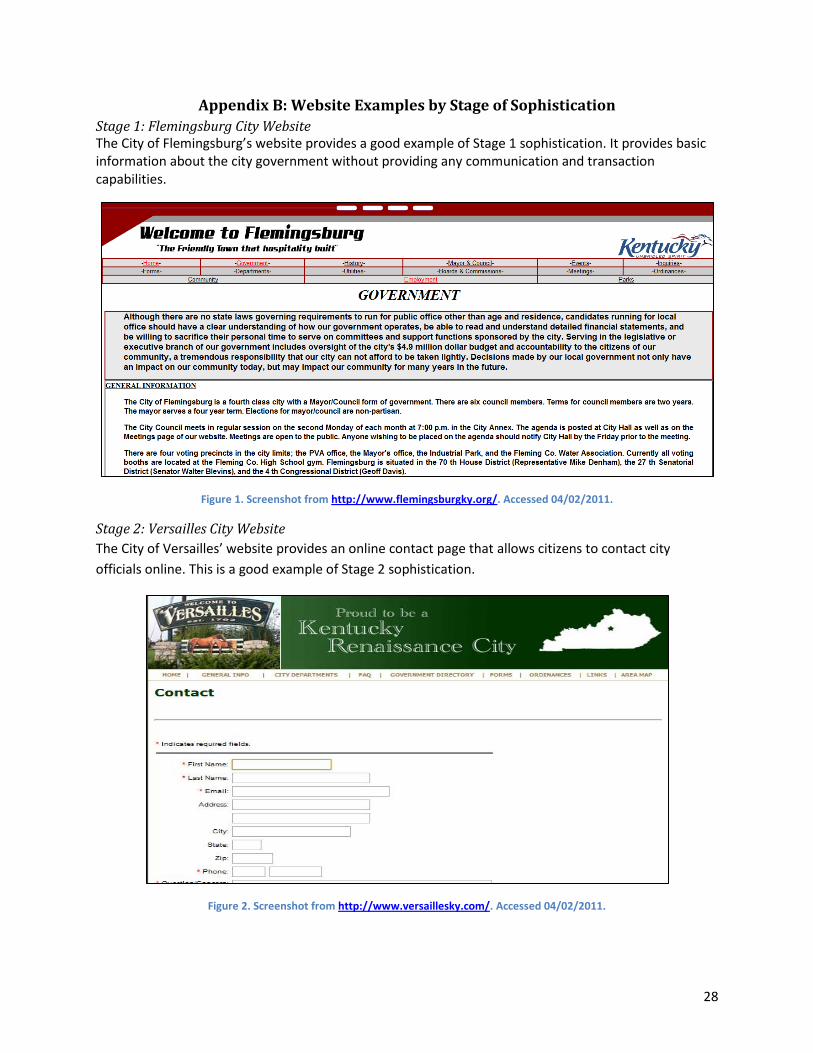
Appendix B: Website Examples by Stage of Sophistication
Stage 1: Flemingsburg City Website The City of Flemingsburg’s website provides a good example of Stage 1 sophistication. It provides basic information about the city government without providing any communication and transaction capabilities.
Figure 1. Screenshot from http://www.flemingsburgky.org/. Accessed 04/02/2011.
Stage 2: Versailles City Website
The City of Versailles’ website provides an online contact page that allows citizens to contact city
officials online. This is a good example of Stage 2 sophistication.
Figure 2. Screenshot from http://www.versaillesky.com/. Accessed 04/02/2011.
29
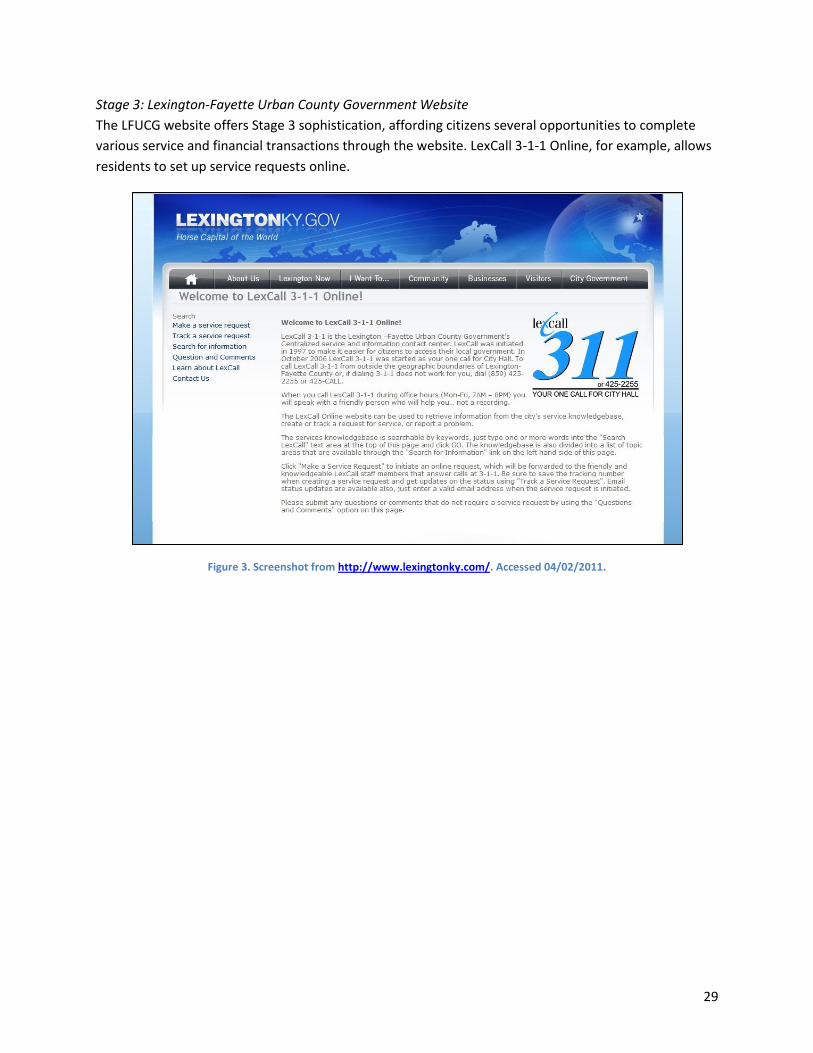
Stage 3: Lexington-Fayette Urban County Government Website
The LFUCG website offers Stage 3 sophistication, affording citizens several opportunities to complete
various service and financial transactions through the website. LexCall 3-1-1 Online, for example, allows
residents to set up service requests online.
Figure 3. Screenshot from http://www.lexingtonky.com/. Accessed 04/02/2011.
30
Appendix C: List of Cities with Websites Organized by Stage of Sophistication
Stage 1
Adairville Fulton Owenton Beattyville Germantown Park City Beaver Dam Glenview Parkway Village Bedford Guthrie Science Hill Calvert City Hanson Scottsville Campbellsburg Hazard Shepherdsville Campbellsville Hyden Springfield Carrolton Leitchfield Union Cynthiana Manchester Warsaw Earlington Marion West Liberty Elsmere New Haven Williamsburg Flemingsburg Olive Hill Woodland Hills
Stage 2
Anchorage Fort Mitchell Murray Audobon Park Fort Thomas Newport Augusta Franklin Nicholasville Bardstown Georgetown Oak Grove Beechwood Village Glasgow Owensboro Bellefonte Goshen Paducah Benton Grayson Paintsville Berea Hazel Park Hills Bloomfield Highland Heights Pewee Valley Brandenburg Hillview Princeton Cadiz Hodgenville Russellville Cloverport Hopkinsville Shelbyville Columbia Horse Cave Smiths Grove Corbin Indian Hills Somerset Covington Irvington Stanford Crescent Springs Jeffersontown Taylor Mill Crestview Kuttawa Versailles Crestview Hills LaGrange Villa Hills Crossgate Lakeside Park Vine Grove Dayton Lebanon Walton Edgewood London West Point Edmonton Ludlow Whitesburg Elizabethtown Madisonville Wilder Elkton Mayfield Williamstown Eminence Maysville Wilmore Erlanger Midway Winchester Flatwoods Morehead Florence Middletown

31
Stage 3
Alexandria Greensburg Louisville Ashland Henderson Paris Bellevue Independence Pikeville Bowling Green Lawrenceburg Prospect Danville Lewisport Radcliff Fort Wright Lexington Richmond Frankfort Livermore