Embed Size (px)
Citation preview
LOCAL BENCHMARKS FOR THE EVOLUTION OF MAJOR-MERGER
GALAXIES—SPITZER OBSERVATIONS OF A K-BAND SELECTED SAMPLE
This article has been downloaded from IOPscience. Please scroll down to see the full text article.
2010 ApJ 713 330
(http://iopscience.iop.org/0004-637X/713/1/330)
Download details:
IP Address: 131.215.220.165
The article was downloaded on 09/04/2010 at 23:52
Please note that terms and conditions apply.
The Table of Contents and more related content is available
Home Search Collections Journals About Contact us My IOPscience
The Astrophysical Journal, 713:330–355, 2010 April 10 doi:10.1088/0004-637X/713/1/330C© 2010. The American Astronomical Society. All rights reserved. Printed in the U.S.A.
LOCAL BENCHMARKS FOR THE EVOLUTION OF MAJOR-MERGER GALAXIES—SPITZER OBSERVATIONSOF A K-BAND SELECTED SAMPLE
C. Kevin Xu1, Donovan Domingue
2, Yi-Wen Cheng
1,3,4, Nanyao Lu
1, Jiasheng Huang
5, Yu Gao
6,
Joseph M. Mazzarella1, Roc Cutri
1, Wei-Hsin Sun
4, and Jason Surace
71 Infrared Processing and Analysis Center, California Institute of Technology 100-22, Pasadena, CA 91125, USA
2 Georgia College & State University, CBX 82, Milledgeville, GA 31061, USA3 Institute of Astronomy, National Central University, Chung-Li 32054, Taiwan
4 Institute of Astrophysics and Leung Center for Cosmology and Particle Astrophysics, National Taiwan University, Taipei 10617, Taiwan5 Harvard-Smithsonian Center for Astrophysics, 60 Garden Street, Cambridge, MA 02138, USA
6 Purple Mountain Observatory, Chinese Academy of Sciences, 2 West Beijing Road, Nanjing 210008, China7 Spitzer Science Center, California Institute of Technology, Mail Stop 220-6, Pasadena, CA 91125, USA
Received 2009 September 14; accepted 2010 February 17; published 2010 March 22
ABSTRACT
We present Spitzer observations for a sample of close major-merger galaxy pairs (KPAIR sample) selected fromcross-matches between the Two Micron All Sky Survey and Sloan Digital Sky Survey Data Release 3. The goalsare to study the star formation activity in these galaxies and to set a local bench mark for the cosmic evolution ofclose major mergers. The Spitzer KPAIR sample (27 pairs, 54 galaxies) includes all spectroscopically confirmedspiral–spiral (S+S) and spiral–elliptical (S+E) pairs in a parent sample that is complete for primaries brighter thanK = 12.5 mag, projected separations of 5 h−1 kpc � s � 20 h−1 kpc, and mass ratios � 2.5. The Spitzer data,consisting of images in seven bands (3.6, 4.5, 5.8, 8, 24, 70, 160 μm), show very diversified IR emission properties.Compared to single spiral galaxies in a control sample, only spiral galaxies in S+S pairs show significantly enhancedspecific star formation rate (sSFR = SFR/M), whereas spiral galaxies in S+E pairs do not. Furthermore, the SFRenhancement of spiral galaxies in S+S pairs is highly mass-dependent. Only those with M � 1010.5 M� showsignificant enhancement. Relatively low-mass (M ∼ 1010 M�) spirals in S+S pairs have about the same SFR/Mcompared to their counterparts in the control sample, while those with 1011 M� have on average a ∼3 times higherSFR/M than single spirals. There is evidence for a correlation between the global star formation activities (but notthe nuclear activities) of the component galaxies in massive S+S major-merger pairs (the “Holmberg effect”). Thereis no significant difference in the SFR/M between the primaries and the secondaries, nor between spirals of SEP < 1and those of SEP � 1, SEP being the normalized separation parameter. The contribution of KPAIR galaxies to thecosmic SFR density in the local universe is only 1.7%, and amounts to ρKPAIR = 2.54 × 10⁻⁴ (M� yr−1 Mpc−3).
Key words: galaxies: evolution – galaxies: general – galaxies: interactions – galaxies: starburst
1. INTRODUCTION
Two questions about the evolution of galaxy mergers arebeing intensely debated in the current literature. (1) Does mergerrate have a strong or weak cosmic evolution? (2) Are mergersresponsible for the strong evolution of the cosmic star formationrate (SFR) since z ∼ 1 (e.g., Lilly et al. 1996; Madau et al. 1998;Hopkins 2004)? Answers to these questions have importantimplications to the understanding of basic processes in galaxyformation/evolution, such as mass growth and star formation.
Earlier studies of merger rate, using samples of close galaxypairs and morphologically disturbed systems in different redshiftranges, yielded a very broad range of the evolutionary index m,m = 0–6, assuming the evolution has a power-law form (1 + z)m
(Zepf & Koo 1989; Burkey et al. 1994; Carlberg et al. 1994;Yee & Ellington 1995; Woods et al. 1995; Patton et al. 1997;Wu & Keel 1998; Brinchmann et al. 1998; Le Fevre et al. 2000;Carlberg et al. 2000; Patton et al. 2002; Conselice et al. 2003; Linet al. 2004; Bundy et al. 2004; Lavery et al. 2004). More recentresults can be divided into two camps, the “strong evolution”camp with m ∼ 3 (Conselice 2006; Kampczyk et al. 2007;Kartaltepe et al. 2007) and the “weak evolution” camp withm ∼ 0.5 (Lin et al. 2008; Lotz et al. 2008). The strong evolu-tion scenario is consistent with the cosmic time dependence ofthe merging rate of dark matter halos (DMHs; Lacey & Cole1993; Khochfar & Burkert 2001). However, more recent simu-
lations including sub-halo structures support the weak evolutionscenario (Berrier et al. 2006; Guo & White 2008).
Since the discovery of a strong evolution of the cosmic SFR(Lilly et al. 1996; Madau et al. 1998), many authors have arguedthat the primary cause is a rapid decline of merger-induced starformation (Driver et al. 1995; Glazebrook et al. 1995; Abrahamet al. 1996; Brinchmann et al. 1998, Le Fevre et al. 2000;Conselice et al. 2003). In particular, infrared (IR) surveys byboth the Infrared Space Observatory (ISO; Elbaz et al. 2002) andSpitzer (Le Floch et al. 2005) found that beyond z ∼ 0.7–1.0,the cosmic star formation is contributed mostly by luminousIR galaxies (LIRGs) with LIR � 1011 L�. In the local universemost LIRGs are in merger systems, and they contribute onlya few percent of the integrated IR luminosity density (Sanders& Mirabel 1996). This seems to provide another argument fora strong evolution of merger-induced starbursts as the primarydriver of the strong cosmic SFR evolution. However, are LIRGsat z ∼ 1 indeed mostly in merger systems, as observed fortheir local counterparts? To this question, there are both positiveanswers (Zheng et al. 2004; Hammer et al. 2005; Bridge et al.2007) and negative answers (Flores et al. 1999; Bell et al. 2005;Melbourne et al. 2005; Lotz et al. 2008). Authors in the lattergroup found that most LIRGs at z ∼ 1 are normal late-typegalaxies. According to them, it is the secular evolution of normallate-type galaxies that is mostly responsible for the cosmic SFRevolution, not the evolution of mergers.
330
No. 1, 2010 LOCAL BENCHMARKS FOR THE EVOLUTION OF MAJOR-MERGER GALAXIES 331
What are the reasons for these controversies? Foremostamong them are sample selection effects. There are two classi-cal methods of selecting interacting/merging galaxies. One isto find galaxies with peculiar morphology (e.g., with tidal tails,double nuclei, or distorted disks) and the other is to identifypaired galaxies. There are systematic differences between inter-acting galaxies selected using these two different methods. Inthe so-called merger sequence (Toomre 1977), galaxies in closepairs are usually mergers in the early stages when the two galax-ies are still separable. In contrast, peculiar galaxies are mostlyfound in the later stages when the first collision between thetwo galaxies is happening or passed. However, this distinctionis not clear-cut. Mergers such as the Antennae (= Arp 244) canbe identified using both methods.
There are several known biases in the morphological selectionmethod. The most serious one is due to the misidentificationsof isolated irregular galaxies or starburst galaxies as mergers(Lotz et al. 2008). This effect is particularly severe for samplesselected in the rest-frame UV bands (and to some extent thoseselected in the rest-frame B band), where the emission of youngstars and dust extinction can significantly affect the surfacebrightness distribution. Another bias is caused by missing lowsurface brightness merger features, such as faint tidal tails andbridges, in observations that lack sufficient sensitivity. Thisincompleteness becomes increasingly severe for high-z surveysbecause of cosmic dimming.
The most common bias affecting current pair selected samplesis an incompleteness known as “missing the secondary” (Xuet al. 2004). For flux-limited (= apparent magnitude limited)samples or luminosity limited (= absolute magnitude limited= “volume limited”) samples, a paired galaxy brighter thanthe limit can be missed if its companion is fainter than thelimit. The amplitude of this incompleteness can vary withthe redshift, and cause significant bias in the results on theevolution of merger rate. For example, in many recent studiesof merger rate evolution, pair fractions of galaxies of M � Mlimare compared, where Mlim is an absolute magnitude limit inthe rest-frame B or V band. For these samples, the amplitudeof the incompleteness due to the “missing the secondary”bias is on the order of Q ∼ 0.5φ(Mlim)δM/
∫ Mlim
− inf φ(M) dM ,where φ is the luminosity function (LF) of the paired galaxies(e.g., Xu et al. 2004; Domingue et al. 2009), and δM is thetypical magnitude difference between the two galaxies in apair, which is ∼ 1 mag for major mergers. When Mlim isfixed, the ratio Q decreases with z if the LF has a positive“luminosity evolution” (i.e., the “knee” of the LF becomesbrighter with increasing z), as observed for the LF of fieldgalaxies (Wolf et al. 2003; Marchesini et al. 2007). This canintroduce an artificial “evolution” of the merger rate in studiescomparing pair fractions in samples at different redshifts thatare limited by the same Mlim (e.g., Kartaltepe et al. 2007),and being responsible for the high evolutionary index (m∼ 3)found in those studies. On the other hand, all studies in the“weak evolution” camp invoke a correction for the “passiveluminosity evolution” (PLE), allowing the absolute value of Mlimto increase with z accordingly. This indeed reduces the effectof the incompleteness on the evolutionary index of the mergerrate. However, as pointed out by Kartaltepe et al. (2007), thereis no strong empirical justification for the PLE model. If the trueevolution of the luminosities of interacting galaxies is differentfrom PLE, then the bias is still present. It is better to get ridof the incompleteness from the merger rate studies in the firstplace.
Other biases for pair selections include: (1) contaminationdue to unphysical, projected pairs (“interlopers”), which affectsmostly samples with incomplete redshifts or with only photo-metric redshifts; and (2) incompleteness due to missing of pairsin which the two galaxies are too close to be separated visu-ally because of insufficient angular resolution or obscuration bydust.
Being aware of the selection effects that lead to the conflictingresults, we set out to design a set of merger selection criteria thatminimize the biases mentioned above. First, we opted for the pairselection method instead of the morphological selection methodbecause, based purely on galaxy separation, pair selectionsare more objective. However, this also confines our study tosystems prior to the final stages of the merging process. Second,we chose the rest-frame K as the wave band in which oursamples are to be selected. This is the band least affected bystar formation and dust extinction and most closely relatedto mass (Bell & De Jong 2001). Third, we confine ourselvesto close major-merger pairs with mass ratio < 2.5 and withprojected separation in the range 5 h−1 kpc � s � 20 h−1 kpc(h = H0/(100 km s−1 Mpc−1)). Many studies have foundthat only major mergers with separations comparable to thesize of galaxies (i.e., � 20 h−1 kpc) show significant SFRenhancements (Xu & Sulentic 1991; Barton et al. 2000; Lambaset al. 2003; Nikolic et al. 2004; Alonso et al. 2004; Woodset al. 2006; Barton et al. 2007; Ellison et al. 2008). Otherdetailed selection criteria are presented in Section 2. It shouldbe emphasized that, when studying the evolution of interactinggalaxies, samples at different redshifts must be selected usingidentical criteria.
In two earlier papers (Xu et al. 2004; Domingue et al.2009), we started from samples in the local universe, with thegoal of setting local benchmarks for merger rate evolution.Xu et al. (2004), using a sample of 19 close major-mergerpairs selected from the matched Two Micron All Sky Survey(2MASS)/2dFGRS catalog (Cole et al. 2001), derived theK-band luminosity function (KLF) and the differential pairfraction function (DPFF) of local binary galaxies. This wasfollowed up by a more extended analysis (Domingue et al.2009), exploiting a large sample of 173 close major-merger pairsselected from 2MASS/SDSS-DR5 cross-matches. Assumingthe mass-dependent merger timescale of Kitzbichler & White(2008), Domingue et al. (2009) found that the differential mergerrate increases with mass, and the merger rate versus massrelation is in good agreement with what being found in theN-body simulations of Maller et al. (2006).
In this paper, we report Spitzer imaging observations (sevenbands at 3.6, 4.5, 5.8, 8, 24, 70, and 160 μm) of 27 galaxy pairsin the local universe, selected from cross-matches of 2MASSand Sloan Digital Sky Survey Data Release 3 (SDSS-DR3).The scientific goals are (1) studying the star formation activityin these galaxies and (2) setting a local bench mark for theevolution of the SFR in close major mergers. Assuming thatonly late-type galaxies contribute significantly to the total SFR,our analysis is concentrated on spiral (S) galaxies in spiral–spiral(S+S) and spiral–elliptical (S+E) pairs. The main focus of thispaper is on the enhancement (or the lack of it) of the SFRof paired galaxies. Most previous studies on this subject arebased on optical/UV observations susceptible to dust extinction(Barton et al. 2000, 2007; Lambas et al. 2003; Nikolic et al.2004; Alonso et al. 2004; Woods et al. 2006; Woods & Geller2007; Ellison et al. 2008). Early FIR studies based on IRASobservations (Kennicutt et al. 1987; Telesco et al. 1988; Xu &
332 XU ET AL. Vol. 713
Sulentic 1991) cannot resolve the pairs because of the coarseangular resolution of IRAS. The more recent ISO study of Xuet al. (2001) and Spitzer study of Smith et al. (2007), whichresolved pairs into discrete regions (e.g., nuclei of componentgalaxies, bridges and tails, overlapping regions between the twodisks, etc.), are confined to pairs with strong interacting features,and therefore are biased to interacting galaxies with strong starformation enhancement. This work shall be neutral to thesebiases. Our studies on IR spectral energy distributions (SEDs;D. L. Domingue et al. 2010, in preparation) and on the opticalproperties including new Hα and Hβ imaging observations(Y. W. Cheng et al. 2010, in preparation) will be publishedseparately. Throughout this paper, we adopt the Λ-cosmologywith Ωm = 0.3 and ΩΛ = 0.7, and H0 = 75 (km s−1 Mpc−1).
2. THE SAMPLE
The sample of galaxy pairs was selected from cross-matchesbetween the 2MASS Extended Source Catalog (XSC; Jarrettet al. 2000) and the galaxy catalog of SDSS-DR3 (Abazajianet al. 2005). The selection procedure is similar to that inXu et al. (2004) and Domingue et al. (2009). First, the followingtwo criteria were set for galaxies to be considered in the pairselection.
1. Galaxies should be brighter than Ks = 13.5 mag, thecompleteness limit of the XSC (Jarrett et al. 2000). Thedefault K20 magnitude is used for the Ks band (2.16 μm)fluxes (Jarrett et al. 2000). The K20 magnitudes were takenfrom Domingue et al. (2009), for which the photometricerror due to the blending of close neighbors was corrected.As in Xu et al. (2004), a uniform −0.2 mag correction wasapplied to the K20 of galaxies when extrapolation to totalK-band magnitude was necessary.
2. Galaxies should have the redshift completeness indexcz>0.5, where cz is the ratio of the number of galaxieswith measured redshifts within 1◦ radius from the centerof the galaxy in question and the number of all galaxieswithin the same radius (Xu et al. 2004). This confines thepair selection to regions where the SDSS-DR3 has goodspectroscopic coverage.
The resulting sample has 50,312 galaxies, of which 42,847have measured redshifts (85% redshift completeness). A com-parison with the number counts of 2MASS galaxies (Kochaneket al. 2001) yielded an equivalent sky coverage of Ω =3000 deg2 (Ω = N/CN, where number counts CN is in units ofdeg−2).
Pair selection was then carried out with the following criteria.
1. The Ks magnitude of the primary is brighter than 12.5 mag.A primary is defined as the brighter component of a pair.
2. The Ks difference between the two components is less than1 mag: δKs � 1 mag.
3. At least one of the components has spectroscopic redshift.4. The projected separation is in the range of 5 h−1 kpc � s �
20 h−1 kpc.5. The velocity difference is less than 500 km s−1: δv �
500 km s−1.
Criteria 1 and 2 ensure that, by construction, all galaxies in thispair sample are brighter than Ks = 13.5, the completeness limitof the 2MASS survey (Jarrett et al. 2000). Therefore, the sampledoes not suffer from the “missing the secondary” bias thatplagued many earlier merger studies (see Section 1). This alsorestricts our sample to major-merger pairs whose mass ratios are
� 2.5. Criterion 4 makes the comparisons between local pairsin this sample and pairs in high-z samples robust. For high-zgalaxies, it is difficult to distinguish a galaxy pair from a singlegalaxy if the separation is � 5 h−1 kpc, and the probabilityfor chance pairs is significantly higher if projected separation ismuch larger than 20 h−1 kpc (Kartaltepe et al. 2007).
A total of 57 pairs were selected according to the criteria.Component galaxies are classified as either “S” or “E” usingthe following scheme: first, classical “eyeball” classificationswere carried out. Independently, two of us (C.K.X. and D.D.)inspected the SDSS optical image of every galaxy in the sampleand assigned a type to it according to its morphology. In addition,we also run an automatic classification script. It classifies agalaxy as “E” if u − r > 2.22 and R50/R90 < 0.35, where R50and R90 are the radii containing 50% and 90% of the Petrosianflux (Park & Choi 2005). Otherwise, the galaxy is classified as“S” type. The final classification is the median of the two eyeballresults and the result of the automatic method. We excluded20 pairs in which both components are “E” types (“E+E”pairs). According to their optical colors and EW(Hα), little starformation is evident, consistent with IRAS results on E+E pairs(Xu & Sulentic 1991). In order to minimize the contaminationdue to interlopers, single-redshift pairs were also excluded. Wewould stress that, judging from SDSS images, these single-redshift pairs do not show any special characteristics comparedto the total sample, therefore dropping them will not introduceany significant bias to our study.
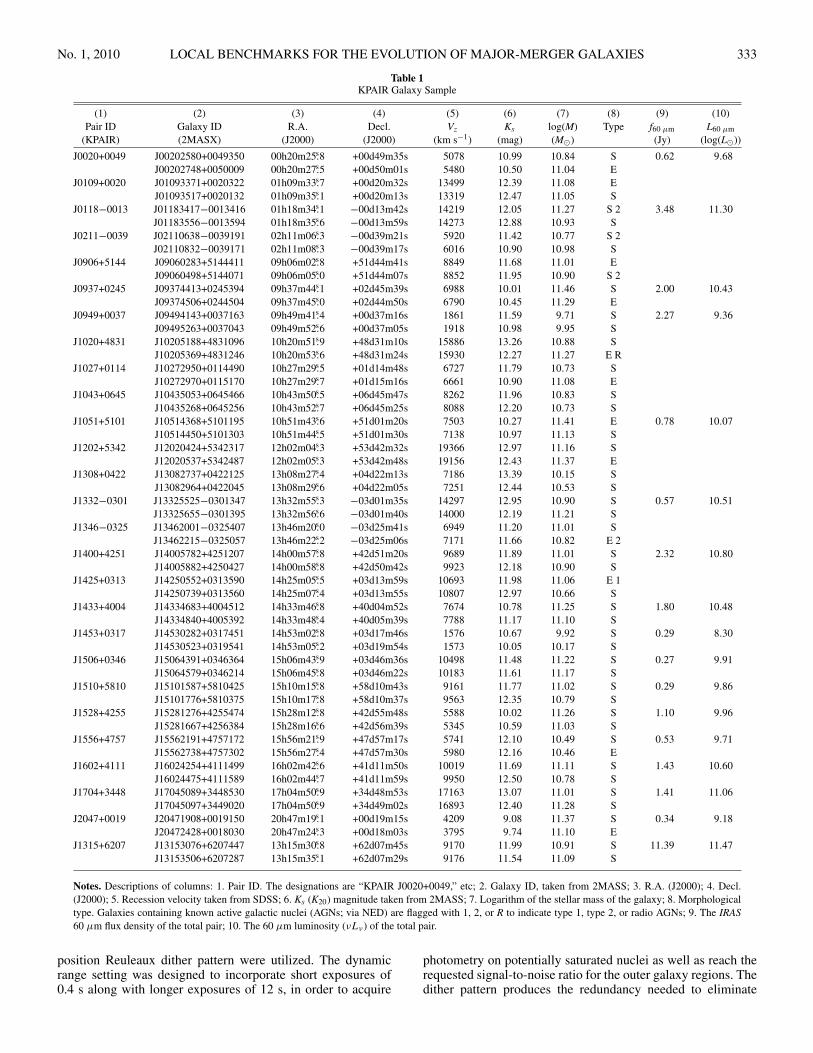
The final sample (KPAIR hereafter) for the Spitzer observa-tions contains 27 S+S and S+E pairs. Among the 54 componentgalaxies, 42 are classified as S and 12 as E. They are listed inTable 1. The mass in the table (and hereafter) is the so-calledstellar mass, excluding the mass of the dark matter and gas. Itis estimated from the K-band luminosity by assuming a mass-to-luminosity ratio of 1.32 (solar units), taken from Cole et al.(2001) for the Salpeter initial mass function (IMF).8 The helio-centric velocities are from SDSS-DR3, and the 60 μm flux densi-ties are from the IRAS Faint Source Catalog (Moshir et al. 1992).
3. SPITZER OBSERVATIONS
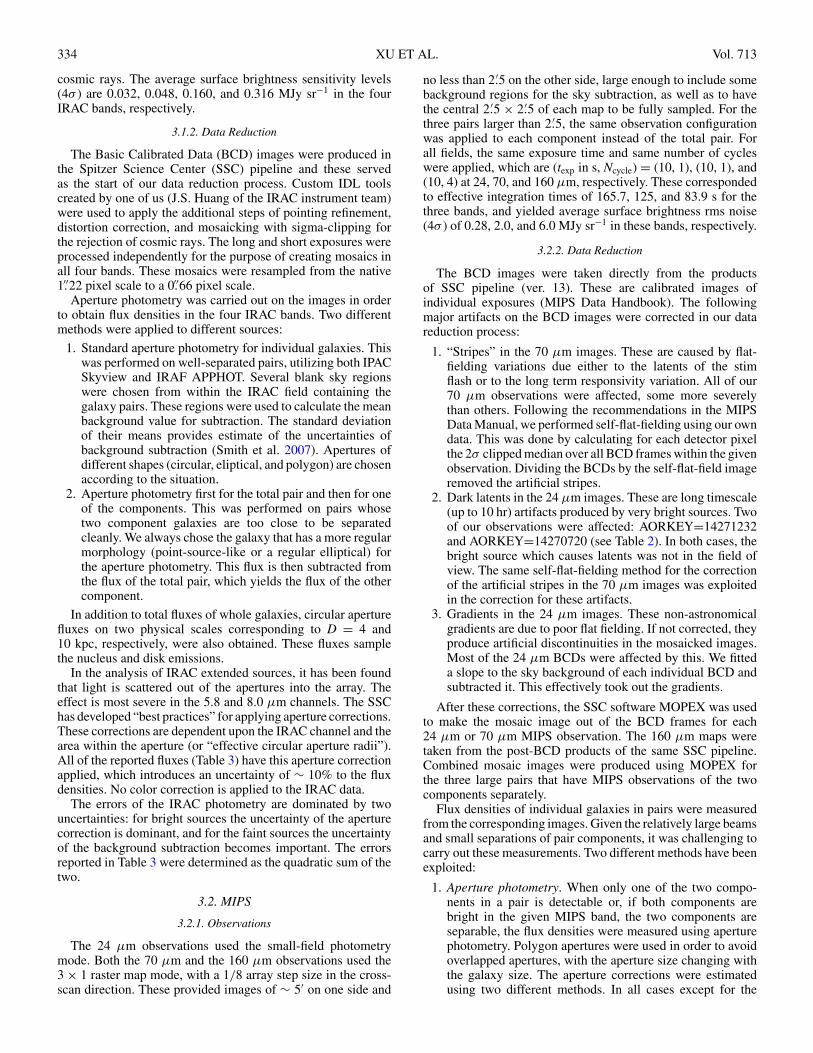
IR imaging observations of all pairs but J1315+6207 inTable 1 were carried out in 2005 and 2006 under the SpitzerCycle 2 GO Program “Local Benchmarks for the Evolution ofInteracting Galaxies” (PID no. 20187). These include images inthe four bands (3.6, 4.5, 5.8, and 8.0 μm) of the Infrared ArrayCamera (IRAC; Fazio et al. 2004) and in three bands (24, 70,and 160 μm) of the Multiband Imaging Photometer for Spitzer(MIPS; Rieke et al. 2004). KPAIR J1315+6207 (UGC08335a/b) is included in the Spitzer GO-1 survey of LIRGs (J. M.Mazzarella et al. 2010, in preparation). Its IRAC data weretaken from J. M. Mazzarella et al. (2010, in preparation), whileits MIPS observations were unsuccessful.
3.1. IRAC
3.1.1. Observations
All but three pairs in our sample are smaller than 2.′5 atoptical wavelengths. Each pair (or each pair component forthe three large pairs) was observed with the IRAC instrumentin Full Array mode. High dynamic range settings and a 12
8 The mass-to-luminosity ratio estimated using the Kennicutt IMF is a factorof 0.55 lower (Cole et al. 2001) and that estimated using the Kroupa IMF is afactor of 0.59 lower (Kauffmann et al. 2003).
No. 1, 2010 LOCAL BENCHMARKS FOR THE EVOLUTION OF MAJOR-MERGER GALAXIES 333
Table 1KPAIR Galaxy Sample
(1) (2) (3) (4) (5) (6) (7) (8) (9) (10)Pair ID Galaxy ID R.A. Decl. Vz Ks log(M) Type f60 μm L60 μm
(KPAIR) (2MASX) (J2000) (J2000) (km s−1) (mag) (M�) (Jy) (log(L�))
J0020+0049 J00202580+0049350 00h20m25.s8 +00d49m35s 5078 10.99 10.84 S 0.62 9.68J00202748+0050009 00h20m27.s5 +00d50m01s 5480 10.50 11.04 E
J0109+0020 J01093371+0020322 01h09m33.s7 +00d20m32s 13499 12.39 11.08 EJ01093517+0020132 01h09m35.s1 +00d20m13s 13319 12.47 11.05 S
J0118−0013 J01183417−0013416 01h18m34.s1 −00d13m42s 14219 12.05 11.27 S 2 3.48 11.30J01183556−0013594 01h18m35.s6 −00d13m59s 14273 12.88 10.93 S
J0211−0039 J02110638−0039191 02h11m06.s3 −00d39m21s 5920 11.42 10.77 S 2J02110832−0039171 02h11m08.s3 −00d39m17s 6016 10.90 10.98 S
J0906+5144 J09060283+5144411 09h06m02.s8 +51d44m41s 8849 11.68 11.01 EJ09060498+5144071 09h06m05.s0 +51d44m07s 8852 11.95 10.90 S 2
J0937+0245 J09374413+0245394 09h37m44.s1 +02d45m39s 6988 10.01 11.46 S 2.00 10.43J09374506+0244504 09h37m45.s0 +02d44m50s 6790 10.45 11.29 E
J0949+0037 J09494143+0037163 09h49m41.s4 +00d37m16s 1861 11.59 9.71 S 2.27 9.36J09495263+0037043 09h49m52.s6 +00d37m05s 1918 10.98 9.95 S
J1020+4831 J10205188+4831096 10h20m51.s9 +48d31m10s 15886 13.26 10.88 SJ10205369+4831246 10h20m53.s6 +48d31m24s 15930 12.27 11.27 E R
J1027+0114 J10272950+0114490 10h27m29.s5 +01d14m48s 6727 11.79 10.73 SJ10272970+0115170 10h27m29.s7 +01d15m16s 6661 10.90 11.08 E
J1043+0645 J10435053+0645466 10h43m50.s5 +06d45m47s 8262 11.96 10.83 SJ10435268+0645256 10h43m52.s7 +06d45m25s 8088 12.20 10.73 S
J1051+5101 J10514368+5101195 10h51m43.s6 +51d01m20s 7503 10.27 11.41 E 0.78 10.07J10514450+5101303 10h51m44.s5 +51d01m30s 7138 10.97 11.13 S
J1202+5342 J12020424+5342317 12h02m04.s3 +53d42m32s 19366 12.97 11.16 SJ12020537+5342487 12h02m05.s3 +53d42m48s 19156 12.43 11.37 E
J1308+0422 J13082737+0422125 13h08m27.s4 +04d22m13s 7186 13.39 10.15 SJ13082964+0422045 13h08m29.s6 +04d22m05s 7251 12.44 10.53 S
J1332−0301 J13325525−0301347 13h32m55.s3 −03d01m35s 14297 12.95 10.90 S 0.57 10.51J13325655−0301395 13h32m56.s6 −03d01m40s 14000 12.19 11.21 S
J1346−0325 J13462001−0325407 13h46m20.s0 −03d25m41s 6949 11.20 11.01 SJ13462215−0325057 13h46m22.s2 −03d25m06s 7171 11.66 10.82 E 2
J1400+4251 J14005782+4251207 14h00m57.s8 +42d51m20s 9689 11.89 11.01 S 2.32 10.80J14005882+4250427 14h00m58.s8 +42d50m42s 9923 12.18 10.90 S
J1425+0313 J14250552+0313590 14h25m05.s5 +03d13m59s 10693 11.98 11.06 E 1J14250739+0313560 14h25m07.s4 +03d13m55s 10807 12.97 10.66 S
J1433+4004 J14334683+4004512 14h33m46.s8 +40d04m52s 7674 10.78 11.25 S 1.80 10.48J14334840+4005392 14h33m48.s4 +40d05m39s 7788 11.17 11.10 S
J1453+0317 J14530282+0317451 14h53m02.s8 +03d17m46s 1576 10.67 9.92 S 0.29 8.30J14530523+0319541 14h53m05.s2 +03d19m54s 1573 10.05 10.17 S
J1506+0346 J15064391+0346364 15h06m43.s9 +03d46m36s 10498 11.48 11.22 S 0.27 9.91J15064579+0346214 15h06m45.s8 +03d46m22s 10183 11.61 11.17 S
J1510+5810 J15101587+5810425 15h10m15.s8 +58d10m43s 9161 11.77 11.02 S 0.29 9.86J15101776+5810375 15h10m17.s8 +58d10m37s 9563 12.35 10.79 S
J1528+4255 J15281276+4255474 15h28m12.s8 +42d55m48s 5588 10.02 11.26 S 1.10 9.96J15281667+4256384 15h28m16.s6 +42d56m39s 5345 10.59 11.03 S
J1556+4757 J15562191+4757172 15h56m21.s9 +47d57m17s 5741 12.10 10.49 S 0.53 9.71J15562738+4757302 15h56m27.s4 +47d57m30s 5980 12.16 10.46 E
J1602+4111 J16024254+4111499 16h02m42.s6 +41d11m50s 10019 11.69 11.11 S 1.43 10.60J16024475+4111589 16h02m44.s7 +41d11m59s 9950 12.50 10.78 S
J1704+3448 J17045089+3448530 17h04m50.s9 +34d48m53s 17163 13.07 11.01 S 1.41 11.06J17045097+3449020 17h04m50.s9 +34d49m02s 16893 12.40 11.28 S
J2047+0019 J20471908+0019150 20h47m19.s1 +00d19m15s 4209 9.08 11.37 S 0.34 9.18J20472428+0018030 20h47m24.s3 +00d18m03s 3795 9.74 11.10 E
J1315+6207 J13153076+6207447 13h15m30.s8 +62d07m45s 9170 11.99 10.91 S 11.39 11.47J13153506+6207287 13h15m35.s1 +62d07m29s 9176 11.54 11.09 S
Notes. Descriptions of columns: 1. Pair ID. The designations are “KPAIR J0020+0049,” etc; 2. Galaxy ID, taken from 2MASS; 3. R.A. (J2000); 4. Decl.(J2000); 5. Recession velocity taken from SDSS; 6. Ks (K20) magnitude taken from 2MASS; 7. Logarithm of the stellar mass of the galaxy; 8. Morphologicaltype. Galaxies containing known active galactic nuclei (AGNs; via NED) are flagged with 1, 2, or R to indicate type 1, type 2, or radio AGNs; 9. The IRAS60 μm flux density of the total pair; 10. The 60 μm luminosity (νLν ) of the total pair.
position Reuleaux dither pattern were utilized. The dynamicrange setting was designed to incorporate short exposures of0.4 s along with longer exposures of 12 s, in order to acquire
photometry on potentially saturated nuclei as well as reach therequested signal-to-noise ratio for the outer galaxy regions. Thedither pattern produces the redundancy needed to eliminate
334 XU ET AL. Vol. 713
cosmic rays. The average surface brightness sensitivity levels(4σ ) are 0.032, 0.048, 0.160, and 0.316 MJy sr−1 in the fourIRAC bands, respectively.
3.1.2. Data Reduction
The Basic Calibrated Data (BCD) images were produced inthe Spitzer Science Center (SSC) pipeline and these servedas the start of our data reduction process. Custom IDL toolscreated by one of us (J.S. Huang of the IRAC instrument team)were used to apply the additional steps of pointing refinement,distortion correction, and mosaicking with sigma-clipping forthe rejection of cosmic rays. The long and short exposures wereprocessed independently for the purpose of creating mosaics inall four bands. These mosaics were resampled from the native1.′′22 pixel scale to a 0.′′66 pixel scale.
Aperture photometry was carried out on the images in orderto obtain flux densities in the four IRAC bands. Two differentmethods were applied to different sources:
1. Standard aperture photometry for individual galaxies. Thiswas performed on well-separated pairs, utilizing both IPACSkyview and IRAF APPHOT. Several blank sky regionswere chosen from within the IRAC field containing thegalaxy pairs. These regions were used to calculate the meanbackground value for subtraction. The standard deviationof their means provides estimate of the uncertainties ofbackground subtraction (Smith et al. 2007). Apertures ofdifferent shapes (circular, eliptical, and polygon) are chosenaccording to the situation.
2. Aperture photometry first for the total pair and then for oneof the components. This was performed on pairs whosetwo component galaxies are too close to be separatedcleanly. We always chose the galaxy that has a more regularmorphology (point-source-like or a regular elliptical) forthe aperture photometry. This flux is then subtracted fromthe flux of the total pair, which yields the flux of the othercomponent.
In addition to total fluxes of whole galaxies, circular aperturefluxes on two physical scales corresponding to D = 4 and10 kpc, respectively, were also obtained. These fluxes samplethe nucleus and disk emissions.
In the analysis of IRAC extended sources, it has been foundthat light is scattered out of the apertures into the array. Theeffect is most severe in the 5.8 and 8.0 μm channels. The SSChas developed “best practices” for applying aperture corrections.These corrections are dependent upon the IRAC channel and thearea within the aperture (or “effective circular aperture radii”).All of the reported fluxes (Table 3) have this aperture correctionapplied, which introduces an uncertainty of ∼ 10% to the fluxdensities. No color correction is applied to the IRAC data.
The errors of the IRAC photometry are dominated by twouncertainties: for bright sources the uncertainty of the aperturecorrection is dominant, and for the faint sources the uncertaintyof the background subtraction becomes important. The errorsreported in Table 3 were determined as the quadratic sum of thetwo.
3.2. MIPS
3.2.1. Observations
The 24 μm observations used the small-field photometrymode. Both the 70 μm and the 160 μm observations used the3 × 1 raster map mode, with a 1/8 array step size in the cross-scan direction. These provided images of ∼ 5′ on one side and
no less than 2.′5 on the other side, large enough to include somebackground regions for the sky subtraction, as well as to havethe central 2.′5 × 2.′5 of each map to be fully sampled. For thethree pairs larger than 2.′5, the same observation configurationwas applied to each component instead of the total pair. Forall fields, the same exposure time and same number of cycleswere applied, which are (texp in s, Ncycle) = (10, 1), (10, 1), and(10, 4) at 24, 70, and 160 μm, respectively. These correspondedto effective integration times of 165.7, 125, and 83.9 s for thethree bands, and yielded average surface brightness rms noise(4σ ) of 0.28, 2.0, and 6.0 MJy sr−1 in these bands, respectively.
3.2.2. Data Reduction
The BCD images were taken directly from the productsof SSC pipeline (ver. 13). These are calibrated images ofindividual exposures (MIPS Data Handbook). The followingmajor artifacts on the BCD images were corrected in our datareduction process:
1. “Stripes” in the 70 μm images. These are caused by flat-fielding variations due either to the latents of the stimflash or to the long term responsivity variation. All of our70 μm observations were affected, some more severelythan others. Following the recommendations in the MIPSData Manual, we performed self-flat-fielding using our owndata. This was done by calculating for each detector pixelthe 2σ clipped median over all BCD frames within the givenobservation. Dividing the BCDs by the self-flat-field imageremoved the artificial stripes.
2. Dark latents in the 24 μm images. These are long timescale(up to 10 hr) artifacts produced by very bright sources. Twoof our observations were affected: AORKEY=14271232and AORKEY=14270720 (see Table 2). In both cases, thebright source which causes latents was not in the field ofview. The same self-flat-fielding method for the correctionof the artificial stripes in the 70 μm images was exploitedin the correction for these artifacts.
3. Gradients in the 24 μm images. These non-astronomicalgradients are due to poor flat fielding. If not corrected, theyproduce artificial discontinuities in the mosaicked images.Most of the 24 μm BCDs were affected by this. We fitteda slope to the sky background of each individual BCD andsubtracted it. This effectively took out the gradients.
After these corrections, the SSC software MOPEX was usedto make the mosaic image out of the BCD frames for each24 μm or 70 μm MIPS observation. The 160 μm maps weretaken from the post-BCD products of the same SSC pipeline.Combined mosaic images were produced using MOPEX forthe three large pairs that have MIPS observations of the twocomponents separately.
Flux densities of individual galaxies in pairs were measuredfrom the corresponding images. Given the relatively large beamsand small separations of pair components, it was challenging tocarry out these measurements. Two different methods have beenexploited:
1. Aperture photometry. When only one of the two compo-nents in a pair is detectable or, if both components arebright in the given MIPS band, the two components areseparable, the flux densities were measured using aperturephotometry. Polygon apertures were used in order to avoidoverlapped apertures, with the aperture size changing withthe galaxy size. The aperture corrections were estimatedusing two different methods. In all cases except for the
No. 1, 2010 LOCAL BENCHMARKS FOR THE EVOLUTION OF MAJOR-MERGER GALAXIES 335
Table 2The Spitzer Observations
IRAC MIPS On-Source Time
Pair ID R.A. Decl. AORKEY ObsDate AORKEY ObsDate IRAC 24 μm 70 μm 160 μm(KPAIR) (J2000) (J2000) (yy/mm/dd) (yy/mm/dd) (s) (s) (s) (s)
(1) (2) (3) (4) (5) (6) (7) (8) (9) (10) (11)
J0020+0049 00h20m26.s6 +00d49m48s 14276608 05/07/22 14269440 06/07/15 144.0 165.7 125.8 83.9J0109+0020 01h09m34.s4 +00d20m23s 14276864 06/01/01 14269696 06/07/19 144.0 165.7 125.8 83.9J0118−0013 01h18m34.s9 −00d13m51s 14277120 05/08/20 14269952 06/07/21 144.0 165.7 125.8 83.9J0211−0039 02h11m07.s3 −00d39m19s 14277376 05/08/21 14270208 06/02/14 144.0 165.7 125.8 83.9J0906+5144 09h06m03.s8 +51d44m24s 14277632 05/11/26 14270464 05/12/04 144.0 165.7 125.8 83.9J0937+0245 09h37m44.s6 +02d45m15s 14277888 05/11/26 14270720 05/12/03 144.0 165.7 125.8 83.9J0949+0037A 09h49m52.s6 +00d37m05s 14278144 05/12/27 14270976 05/12/03 144.0 165.7 125.8 83.9J0949+0037B 09h49m41.s4 +00d37m16s 14278400 05/12/27 14271232 05/12/03 144.0 165.7 125.8 83.9J1020+4831 10h20m52.s8 +48d31m17s 14278656 05/11/24 14271488 05/12/01 144.0 165.7 125.8 83.9J1027+0114 10h27m29.s5 +01d15m03s 14278912 05/12/24 14271744 06/06/07 144.0 165.7 125.8 83.9J1043+0645 10h43m51.s6 +06d45m36s 14279168 06/01/03 14272000 06/06/07 144.0 165.7 125.8 83.9J1051+5101 10h51m44.s2 +51d01m25s 14279424 05/11/24 14272256 05/12/05 144.0 165.7 125.8 83.9J1202+5342 12h02m04.s8 +53d42m40s 14279680 05/12/24 14272512 05/12/05 144.0 165.7 125.8 83.9J1308+0422 13h08m28.s6 +04d22m09s 14279936 05/07/24 14272768 06/02/21 144.0 165.7 125.8 83.9J1332−0301 13h32m55.s9 −03d01m37s 14280192 05/07/24 14273024 06/03/01 144.0 165.7 125.8 83.9J1346−0325 13h46m21.s1 −03d25m23s 14280448 05/07/24 14273280 06/03/01 144.0 165.7 125.8 83.9J1400+4251 14h00m58.s3 +42d51m02s 14280704 06/02/13 14273536 06/06/12 144.0 165.7 125.8 83.9J1425+0313 14h25m06.s5 +03d13m58s 14280960 05/07/24 14273792 06/03/01 144.0 165.7 125.8 83.9J1433+4004 14h33m47.s5 +40d05m15s 14281216 05/07/25 14274048 06/03/01 144.0 165.7 125.8 83.9J1453+0317A 14h53m02.s8 +03d17m46s 14281472 05/07/24 14274304 06/03/01 144.0 165.7 125.8 83.9J1453+0317B 14h53m05.s2 +03d19m54s 14281728 05/07/24 14274560 06/02/25 144.0 165.7 125.8 83.9J1506+0346 15h06m44.s9 +03d46m29s 14281984 05/07/24 14274816 06/03/01 144.0 165.7 125.8 83.9J1510+5810 15h10m16.s8 +58d10m40s 14282240 05/07/25 14275072 06/02/22 144.0 165.7 125.8 83.9J1528+4255 15h28m14.s6 +42d56m13s 14282496 05/07/24 14275328 06/03/03 144.0 165.7 125.8 83.9J1556+4757 15h56m24.s7 +47d57m24s 14282752 05/07/24 14275584 06/05/06 144.0 165.7 125.8 83.9J1602+4111 16h02m43.s7 +41d11m55s 14283008 05/07/24 14275840 05/08/29 144.0 165.7 125.8 83.9J1704+3448 17h04m50.s9 +34d48m58s 14283776 05/07/24 14284032 05/08/29 144.0 165.7 125.8 83.9J2047+0019A 20h47m24.s3 +00d18m03s 14283264 05/10/21 14276096 05/11/10 144.0 165.7 125.8 83.9J2047+0019B 20h47m19.s1 +00d19m15s 14283520 05/10/21 14276352 05/11/10 144.0 165.7 125.8 83.9
six 160 μm measurements in which the galaxy in ques-tion is extended in the 160 μm band, the aperture correc-tions were estimated under the point-source assumption,exploiting the point response function (PRF) presented inAppendix B. For the 24 μm and 70 μm sources that aresignificantly larger than a point source, this is an underesti-mation of the real aperture correction, though the fractionalaperture correction itself decreases with source size. For theextended 160 μm sources, the aperture corrections were es-timated differently. Because of the relatively small size ofthe 160 μm images compared to the beam, much of theemission of any galaxy that is extended in the 160 μm fallsout of the 160 μm image, and would not be recovered if anaperture correction based on the point-source assumptionwere applied. In order to fully recover the missing flux, thefollowing method was carried out. First, the 24 μm image(two times larger than the 160 μm image) was convolvedwith the PRF of the 160 μm band. Then, under the assump-tion that the f160/f24 ratio is constant across the galaxyin question, the desired aperture correction in the 160 μmband was estimated from the ratio between the total flux inthe 24 μm band and that in the 160 μm aperture measuredon the smoothed 24 μm image. From experiments with in-dividual sources, the following aperture-correction errorswere assigned: 14% for weak sources in the 24 μm band,5% for other 24 μm sources and all 70 μm sources, and10% for all 160 μm sources.
2. PRF fitting. This was applied to pairs in which bothcomponent galaxies are detectable point sources and the
two PRFs overlap with each other. In these cases, theflux densities of the two components were measured bysimultaneously fitting two PRFs within a pair, positionsand brightness of the two PRFs being the free parameters(altogether six of them: x1, y1, peak1, x2, y2, peak2). Theaverage flux measurement errors are 14%, 5%, and 21% inthe 24, 70, and 160 μm bands, respectively.
MIPS data are calibrated assuming a nominal spectrum ofa blackbody at 10,000 K. This is very different from the dustemission in galaxies. Therefore color corrections, calculatedusing the modified blackbody spectra (β = 2) of temperaturesof 100 K, 20 K, and 20 K, were applied to the 24 μm, 70 μm,and 160 μm band flux densities, respectively. The correspondingcorrection factors (multiplicative) are 0.967, 0.923, and 0.954.
The errors of the MIPS photometry are the quadratic sum of(in the order of importance): (1) the aperture-correction/model-fitting error (dominant for all sources except for the faintestones), (2) the uncertainty of the background subtraction, and(3) the rms of the background. We ignored the photon noisewhich is never significant. The 4σ upper limits for the un-detected sources were estimated using the quadratic sum ofthe uncertainty of the mean background value and the rms ofthe background. The apertures adopted in these estimates werederived from the K-band Kron radii taken from the 2MASSdatabase. However, for a given MIPS band, if the Kron radius ofa galaxy is less than a minimum value corresponds to the beam,then the aperture is derived using the minimum (8′′, 20′′, and40′′ for 24, 70, and 160 μm, respectively).
336 XU ET AL. Vol. 713
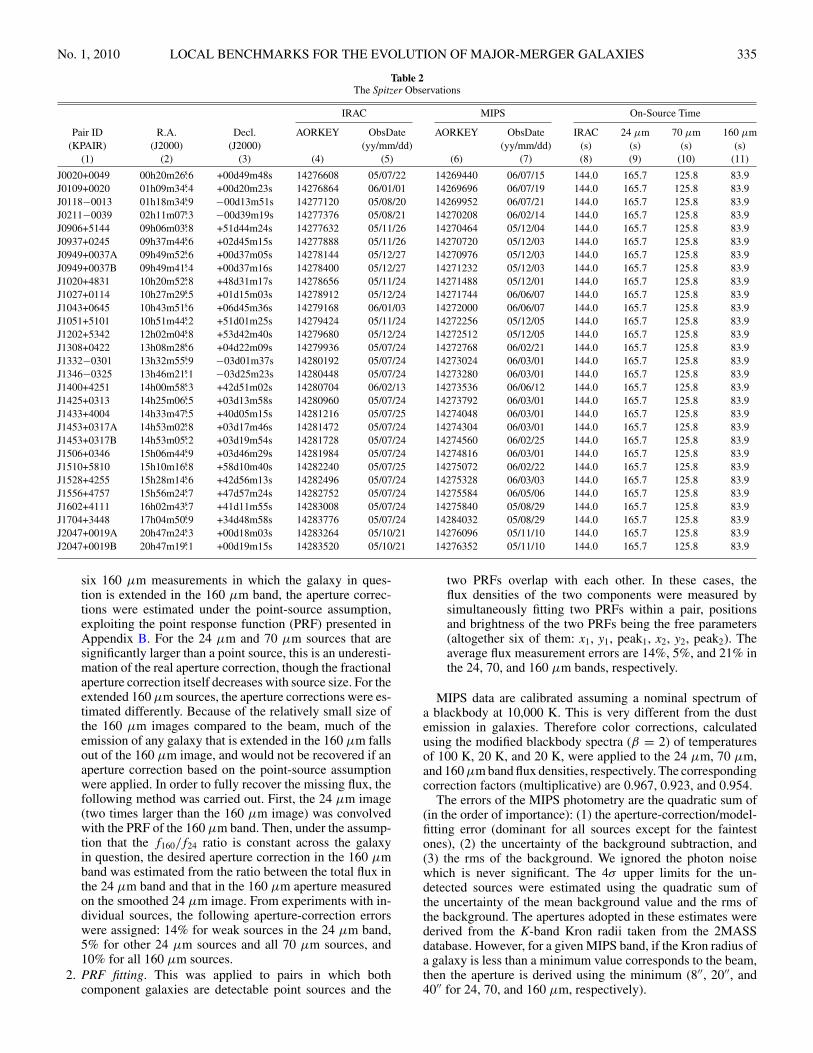
Table 3IR Emission of Paired Galaxies
(1) (2) (3) (4) (5) (6) (7) (8) (9) (10) (11) (12)Galaxy ID Aperture f3.6 μm f4.5 μm f5.8 μm f8 μm f24 μm f70 μm f160 μm Photometry LTIR LIR
(kpc) (mJy) (mJy) (mJy) (mJy) (mJy) (mJy) (mJy) (L�) (L�)J00202580+0049350 4 6.20 ± 0.62 4.24 ± 0.42 10.05 ± 1.01 28.20 ± 2.82
10 10.66 ± 1.07 7.08 ± 0.71 11.85 ± 1.19 29.82 ± 2.99Total 14.34 ± 1.44 9.26 ± 0.93 13.10 ± 1.35 30.84 ± 3.11 55.53 ± 2.87 677.27 ± 73.41 1375.07 ± 152.44 AAA 10.03 10.02
J00202748+0050009 4 10.56 ± 1.06 6.53 ± 0.65 4.48 ± 0.45 2.90 ± 0.2910 16.25 ± 1.62 9.93 ± 0.99 6.65 ± 0.68 4.46 ± 0.48
Total 17.39 ± 1.74 10.61 ± 1.06 6.97 ± 0.74 4.78 ± 0.56 2.68 ± 0.15 <33.87 <101.60 AAA < 8.96 9.01J01093371+0020322 4 1.93 ± 0.19 1.24 ± 0.12 0.74 ± 0.07 0.45 ± 0.05
10 3.34 ± 0.33 2.15 ± 0.21 1.32 ± 0.13 0.88 ± 0.09Total 3.97 ± 0.40 2.60 ± 0.26 1.46 ± 0.23 0.98 ± 0.21 <0.47 <10.57 <64.39 AAA < 9.58 < 9.03
J01093517+0020132 4 1.27 ± 0.13 0.83 ± 0.08 0.52 ± 0.05 0.30 ± 0.0310 2.65 ± 0.26 1.78 ± 0.18 1.17 ± 0.12 0.70 ± 0.07
Total 3.52 ± 0.35 2.36 ± 0.24 1.48 ± 0.21 0.86 ± 0.17 <1.03 <11.40 <91.13 AAA < 9.58 < 8.99J01183417−0013416 4 4.58 ± 0.46 3.99 ± 0.40 8.44 ± 0.84 33.48 ± 3.35
10 6.69 ± 0.67 5.87 ± 0.59 13.59 ± 1.36 56.31 ± 5.63Total 7.46 ± 0.75 6.41 ± 0.64 14.17 ± 1.48 57.06 ± 5.71 249.73 ± 34.96 2817.82 ± 305.30 2749.61 ± 293.58 PPP 11.41 11.36
J01183556−0013594 4 0.51 ± 0.05 0.31 ± 0.03 0.43 ± 0.05 1.92 ± 0.1910 1.86 ± 0.19 1.25 ± 0.13 2.18 ± 0.23 9.21 ± 0.92
Total 4.05 ± 0.41 2.83 ± 0.29 4.97 ± 0.87 20.20 ± 2.03 24.99 ± 3.50 305.32 ± 33.19 549.92 ± 73.94 PPP 10.55 10.67J02110638−0039191 4 6.74 ± 0.67 4.95 ± 0.50 11.35 ± 1.14 30.82 ± 3.08
10 10.22 ± 1.02 7.32 ± 0.73 15.72 ± 1.61 42.62 ± 4.26Total 11.62 ± 1.16 7.75 ± 0.78 16.17 ± 1.74 41.71 ± 4.17 75.18 ± 3.89 1034.44 ± 112.08 2184.97 ± 237.30 AAA 10.33 10.28
J02110832−0039171 4 8.28 ± 0.83 5.42 ± 0.54 3.82 ± 0.39 2.83 ± 0.2810 12.81 ± 1.28 8.27 ± 0.83 5.90 ± 0.69 4.73 ± 0.48
Total 12.87 ± 1.29 8.29 ± 0.83 5.72 ± 0.71 4.32 ± 0.45 3.25 ± 0.17 <13.77 <102.84 AAA < 9.36 9.13J09060283+5144411 4 4.25 ± 0.42 2.78 ± 0.28 1.69 ± 0.17 1.07 ± 0.11
10 6.42 ± 0.64 4.31 ± 0.43 2.68 ± 0.31 1.78 ± 0.18Total 7.97 ± 0.80 5.63 ± 0.57 3.61 ± 1.18 2.21 ± 0.36 0.69 ± 0.10 <6.89 <71.07 WAA < 9.07 9.03
J09060498+5144071 4 1.80 ± 0.18 1.21 ± 0.12 1.05 ± 0.11 1.60 ± 0.1610 4.26 ± 0.43 2.88 ± 0.29 3.07 ± 0.35 5.91 ± 0.59
Total 7.04 ± 0.71 4.80 ± 0.49 5.83 ± 0.94 13.10 ± 1.32 18.06 ± 0.93 191.21 ± 20.76 885.31 ± 93.44 AAA 10.17 10.08J09374413+0245394 4 8.53 ± 0.85 5.70 ± 0.57 7.41 ± 0.74 20.82 ± 2.08
10 21.66 ± 2.17 15.26 ± 1.53 26.77 ± 2.71 75.67 ± 7.57Total 21.66 ± 2.17 15.26 ± 1.53 26.77 ± 2.71 75.67 ± 7.57 183.80 ± 9.50 2133.90 ± 231.20 5989.62 ± 629.23 AAA 10.85 10.73
J09374506+0244504 4 11.42 ± 1.14 7.03 ± 0.70 4.60 ± 0.46 2.83 ± 0.2810 17.38 ± 1.74 10.74 ± 1.07 7.03 ± 0.82 4.57 ± 0.48
Total 21.03 ± 2.10 12.90 ± 1.30 8.79 ± 1.72 6.81 ± 0.84 2.74 ± 0.15 <16.45 <207.44 AAA < 9.31 9.34J09494143+0037163 4 9.95 ± 1.00 6.73 ± 0.67 12.11 ± 1.25 24.63 ± 2.49
10 17.61 ± 1.79 10.99 ± 1.10 21.11 ± 2.82 35.16 ± 4.13Total 13.29 ± 1.34 8.74 ± 0.88 17.63 ± 1.98 31.51 ± 3.33 87.09 ± 4.50 1254.62 ± 135.96 1364.04 ± 154.12 AAA 9.27 9.23
J09495263+0037043 4 10.84 ± 1.09 7.67 ± 0.77 14.83 ± 1.51 33.65 ± 3.3810 23.41 ± 2.36 17.94 ± 1.80 31.27 ± 3.64 71.17 ± 7.44
Total 27.34 ± 2.99 20.07 ± 2.07 35.00 ± 7.65 81.32 ± 11.33 192.14 ± 9.94 3028.93 ± 328.16 4019.44 ± 421.57 AAA 9.68 9.62J10205188+4831096 4 0.68 ± 0.07 0.52 ± 0.05 0.61 ± 0.06 2.82 ± 0.28
10 1.50 ± 0.15 1.12 ± 0.11 1.46 ± 0.15 5.80 ± 0.58Total 2.15 ± 0.22 1.58 ± 0.16 1.73 ± 0.27 7.20 ± 0.73 14.76 ± 2.07 182.84 ± 19.85 276.01 ± 34.89 PAA 10.39 10.42
J10205369+4831246 4 1.40 ± 0.14 1.00 ± 0.10 0.63 ± 0.06 0.45 ± 0.0410 2.85 ± 0.29 2.03 ± 0.20 1.36 ± 0.14 1.14 ± 0.12
Total 4.25 ± 0.43 2.91 ± 0.29 1.92 ± 0.27 2.04 ± 0.23 1.90 ± 0.27 <7.56 <72.13 PAA < 9.78 9.72J10272950+0114490 4 5.81 ± 0.58 4.38 ± 0.44 12.01 ± 1.20 36.28 ± 3.63
10 8.27 ± 0.83 5.91 ± 0.59 14.29 ± 1.45 42.18 ± 4.22Total 8.27 ± 0.83 5.91 ± 0.59 14.29 ± 1.45 42.18 ± 4.22 53.17 ± 2.75 692.21 ± 75.02 1598.47 ± 173.13 AAA 10.28 10.32
J10272970+0115170 4 6.80 ± 0.68 4.49 ± 0.45 2.90 ± 0.29 1.96 ± 0.2010 11.84 ± 1.18 7.81 ± 0.78 5.28 ± 0.59 3.93 ± 0.40
Total 16.04 ± 1.61 10.77 ± 1.08 8.09 ± 1.36 6.54 ± 0.69 1.75 ± 0.25 <22.95 <62.12 WAA < 9.10 9.22J10435053+0645466 4 3.48 ± 0.35 2.72 ± 0.27 7.53 ± 0.75 23.48 ± 2.35
10 7.29 ± 0.73 5.50 ± 0.55 15.40 ± 1.56 50.30 ± 5.03Total 8.75 ± 0.88 6.55 ± 0.66 17.58 ± 1.91 57.33 ± 5.74 164.80 ± 8.52 1005.01 ± 108.90 1661.42 ± 175.97 APP 10.62 10.79
J10435268+0645256 4 2.01 ± 0.20 1.39 ± 0.14 1.62 ± 0.17 3.59 ± 0.3610 3.86 ± 0.39 2.67 ± 0.27 3.33 ± 0.42 7.83 ± 0.78
Total 5.55 ± 0.56 3.83 ± 0.39 4.30 ± 1.20 9.93 ± 1.02 10.10 ± 0.52 94.53 ± 10.40 460.59 ± 67.12 APP 9.81 9.83J10514368+5101195 4 10.13 ± 1.01 6.38 ± 0.64 4.30 ± 0.43 3.25 ± 0.33
10 18.89 ± 1.89 12.01 ± 1.20 7.87 ± 0.83 5.94 ± 0.60Total 18.89 ± 1.89 12.01 ± 1.20 7.87 ± 0.83 5.94 ± 0.60 3.28 ± 0.14 55.62 ± 6.17 307.21 ± 56.37 AWW 9.51 9.40
J10514450+5101303 4 4.15 ± 0.41 2.66 ± 0.27 1.75 ± 0.18 1.14 ± 0.1110 10.84 ± 1.08 7.02 ± 0.70 4.90 ± 0.56 3.41 ± 0.35
Total 10.84 ± 1.08 7.02 ± 0.70 4.90 ± 0.56 3.41 ± 0.35 <2.49 <17.44 <105.45 AAA < 9.39 < 9.05J12020424+5342317 4 0.64 ± 0.06 0.45 ± 0.04 0.26 ± 0.03 0.42 ± 0.04
10 1.70 ± 0.17 1.21 ± 0.12 0.88 ± 0.09 1.91 ± 0.19Total 2.51 ± 0.25 1.78 ± 0.18 1.30 ± 0.19 3.12 ± 0.31 4.96 ± 0.29 48.56 ± 5.45 364.87 ± 52.62 AAA 10.44 10.18
J12020537+5342487 4 0.87 ± 0.09 0.69 ± 0.07 0.31 ± 0.03 0.26 ± 0.0310 2.43 ± 0.24 1.70 ± 0.17 1.00 ± 0.10 0.66 ± 0.07
Total 3.91 ± 0.39 2.84 ± 0.28 1.73 ± 0.27 1.27 ± 0.13 <0.27 <6.88 <32.91 AAA < 10.11 < 9.72
No. 1, 2010 LOCAL BENCHMARKS FOR THE EVOLUTION OF MAJOR-MERGER GALAXIES 337
Table 3(Continued)
(1) (2) (3) (4) (5) (6) (7) (8) (9) (10) (11) (12)Galaxy ID Aperture f3.6 μm f4.5 μm f5.8 μm f8 μm f24 μm f70 μm f160 μm Photometry TIR LIR
(kpc) (mJy) (mJy) (mJy) (mJy) (mJy) (mJy) (mJy) (L�) (L�)J13082737+0422125 4 1.16 ± 0.12 0.78 ± 0.08 1.16 ± 0.12 2.87 ± 0.29
10 2.07 ± 0.21 1.36 ± 0.14 2.07 ± 0.27 5.31 ± 0.53Total 2.35 ± 0.24 1.48 ± 0.16 1.99 ± 0.67 5.71 ± 0.61 5.91 ± 0.31 87.80 ± 9.67 336.59 ± 49.16 AAP 9.58 9.48
J13082964+0422045 4 2.49 ± 0.25 1.59 ± 0.16 1.60 ± 0.16 2.85 ± 0.2810 4.04 ± 0.40 2.58 ± 0.26 2.92 ± 0.34 5.96 ± 0.60
Total 4.68 ± 0.47 2.98 ± 0.30 3.38 ± 0.64 7.43 ± 0.77 5.38 ± 0.28 87.55 ± 9.64 376.16 ± 63.60 AAP 9.61 9.53J13325525−0301347 4 1.38 ± 0.14 1.04 ± 0.10 1.57 ± 0.16 5.60 ± 0.56
10 2.60 ± 0.26 1.91 ± 0.19 2.89 ± 0.29 10.49 ± 1.05Total 3.25 ± 0.33 2.34 ± 0.23 3.30 ± 0.35 11.50 ± 1.15 46.50 ± 6.51 497.48 ± 53.92 575.53 ± 67.59 PPP 10.68 10.64
J13325655−0301395 4 0.88 ± 0.09 0.60 ± 0.06 0.46 ± 0.05 1.23 ± 0.1210 2.82 ± 0.28 1.89 ± 0.19 2.23 ± 0.22 7.44 ± 0.74
Total 5.29 ± 0.53 3.62 ± 0.36 4.50 ± 0.48 15.98 ± 1.60 15.94 ± 2.23 176.01 ± 19.19 770.98 ± 85.21 PPP 10.53 10.52J13462001−0325407 4 5.26 ± 0.53 3.65 ± 0.36 2.93 ± 0.30 3.11 ± 0.31
10 9.04 ± 0.90 6.08 ± 0.61 5.38 ± 0.59 6.97 ± 0.70Total 11.83 ± 1.19 7.84 ± 0.79 7.64 ± 1.59 11.03 ± 1.12 13.99 ± 0.72 51.49 ± 5.85 692.82 ± 74.59 AAA 9.80 9.79
J13462215−0325057 4 5.42 ± 0.54 3.60 ± 0.36 2.59 ± 0.26 2.25 ± 0.2210 7.36 ± 0.74 4.86 ± 0.49 3.31 ± 0.40 2.75 ± 0.28
Total 9.06 ± 0.91 5.96 ± 0.60 3.23 ± 1.09 3.28 ± 0.36 6.15 ± 0.32 41.13 ± 4.83 <77.92 AAA < 9.13 9.34J14005782+4251207 4 3.80 ± 0.38 3.41 ± 0.34 8.21 ± 0.82 26.57 ± 2.66
10 6.88 ± 0.69 5.37 ± 0.54 11.80 ± 1.19 40.61 ± 4.06Total 10.07 ± 1.02 7.17 ± 0.72 14.42 ± 2.01 49.30 ± 4.93 94.87 ± 13.28 1218.70 ± 132.05 1697.41 ± 184.78 PPP 10.76 10.81
J14005882+4250427 4 5.36 ± 0.54 4.22 ± 0.42 12.09 ± 1.21 39.95 ± 3.9910 7.41 ± 0.74 5.80 ± 0.58 15.95 ± 1.60 54.19 ± 5.42
Total 8.86 ± 0.89 6.35 ± 0.64 16.23 ± 1.91 55.36 ± 5.54 190.59 ± 26.68 1470.53 ± 159.33 1786.75 ± 204.99 PPP 10.87 10.97J14250552+0313590 4 3.63 ± 0.36 2.69 ± 0.27 2.16 ± 0.22 2.38 ± 0.24
10 5.68 ± 0.57 3.99 ± 0.40 3.18 ± 0.33 3.48 ± 0.35Total 6.72 ± 0.67 4.67 ± 0.47 3.55 ± 0.43 3.74 ± 0.39 9.66 ± 0.50 111.32 ± 12.18 526.61 ± 60.98 AAA 10.11 9.83
J14250739+0313560 4 1.18 ± 0.12 0.77 ± 0.08 0.48 ± 0.05 0.31 ± 0.0310 1.63 ± 0.16 1.05 ± 0.10 0.66 ± 0.10 0.52 ± 0.06
Total 1.63 ± 0.16 1.05 ± 0.10 0.66 ± 0.10 0.52 ± 0.06 1.39 ± 0.19 <9.15 <104.79 WAA < 9.55 8.98J14334683+4004512 4 6.67 ± 0.67 4.75 ± 0.48 8.79 ± 0.88 23.43 ± 2.34
10 11.98 ± 1.20 8.12 ± 0.81 12.27 ± 1.24 30.52 ± 3.05Total 19.27 ± 1.93 12.93 ± 1.30 19.74 ± 2.32 47.21 ± 4.73 86.65 ± 4.48 840.66 ± 91.10 1747.03 ± 185.16 PPP 10.49 10.57
J14334840+4005392 4 10.27 ± 1.03 7.11 ± 0.71 19.60 ± 1.96 60.41 ± 6.0410 14.36 ± 1.44 9.95 ± 0.99 27.36 ± 2.74 85.42 ± 8.54
Total 16.50 ± 1.65 11.43 ± 1.15 29.35 ± 3.06 91.71 ± 9.17 117.17 ± 6.06 1337.09 ± 144.88 2553.35 ± 269.55 PPP 10.66 10.79J14530282+0317451 4 17.75 ± 1.78 13.12 ± 1.31 18.41 ± 1.94 42.39 ± 4.24
10 26.86 ± 2.69 26.41 ± 2.64 22.96 ± 4.43 57.36 ± 5.74Total 26.86 ± 2.69 26.41 ± 2.64 22.96 ± 4.43 57.36 ± 5.74 47.05 ± 2.43 680.55 ± 73.76 3028.63 ± 320.69 AAA 9.18 9.11
J14530523+0319541 4 25.20 ± 2.52 16.15 ± 1.62 13.88 ± 1.52 23.56 ± 2.3810 45.99 ± 4.61 31.66 ± 3.19 31.69 ± 4.94 90.85 ± 9.08
Total 49.18 ± 4.94 35.19 ± 3.59 33.88 ± 7.17 117.68 ± 11.77 50.07 ± 2.59 830.04 ± 89.96 2432.15 ± 259.60 AAA 9.14 9.29J15064391+0346364 4 4.37 ± 0.44 2.73 ± 0.27 1.84 ± 0.18 1.30 ± 0.13
10 7.20 ± 0.72 4.59 ± 0.46 3.18 ± 0.33 2.37 ± 0.24Total 9.04 ± 0.90 5.67 ± 0.57 3.81 ± 0.52 2.92 ± 0.32 2.22 ± 0.31 36.79 ± 4.35 <141.61 WAA < 9.82 9.45
J15064579+0346214 4 4.45 ± 0.45 4.34 ± 0.43 6.10 ± 0.61 11.95 ± 1.1910 7.22 ± 0.72 6.25 ± 0.62 8.89 ± 0.89 20.05 ± 2.00
Total 9.61 ± 0.96 7.72 ± 0.77 10.95 ± 1.19 26.50 ± 2.66 47.67 ± 2.47 340.83 ± 36.98 1440.24 ± 156.70 AAA 10.55 10.57J15101587+5810425 4 3.47 ± 0.35 2.22 ± 0.22 1.51 ± 0.15 1.22 ± 0.12
10 5.54 ± 0.55 3.61 ± 0.36 2.69 ± 0.29 2.83 ± 0.28Total 6.28 ± 0.63 4.07 ± 0.41 3.16 ± 0.35 4.13 ± 0.41 2.86 ± 0.40 31.00 ± 3.62 <62.28 PPA < 9.37 9.50
J15101776+5810375 4 2.46 ± 0.25 1.78 ± 0.18 2.87 ± 0.29 8.28 ± 0.8310 4.83 ± 0.48 3.41 ± 0.34 6.28 ± 0.64 18.22 ± 1.82
Total 5.01 ± 0.50 3.50 ± 0.35 6.45 ± 0.65 18.62 ± 1.86 27.91 ± 3.91 384.68 ± 41.70 1160.61 ± 124.37 PPA 10.39 10.30J15281276+4255474 4 15.92 ± 1.59 10.57 ± 1.06 14.35 ± 1.44 33.82 ± 3.38
10 31.74 ± 3.17 20.64 ± 2.06 32.36 ± 3.26 74.22 ± 7.42Total 33.68 ± 3.37 24.95 ± 2.50 37.27 ± 4.63 81.05 ± 8.16 93.80 ± 4.85 1524.48 ± 165.19 3472.94 ± 365.14 AAA 10.43 10.41
J15281667+4256384 4 14.02 ± 1.40 8.93 ± 0.89 6.26 ± 0.63 5.04 ± 0.5010 18.60 ± 1.86 11.71 ± 1.17 7.95 ± 0.89 6.17 ± 0.63
Total 24.34 ± 2.44 13.20 ± 1.33 7.98 ± 1.89 7.21 ± 0.92 4.25 ± 0.22 123.94 ± 13.59 252.58 ± 32.84 AAA 9.29 9.23J15562191+4757172 4 2.94 ± 0.29 2.11 ± 0.21 5.31 ± 0.53 15.16 ± 1.52
10 5.61 ± 0.56 3.84 ± 0.39 7.95 ± 0.85 21.14 ± 2.11Total 6.48 ± 0.65 4.40 ± 0.45 8.85 ± 1.22 22.15 ± 2.22 48.79 ± 2.44 538.73 ± 58.40 1163.05 ± 125.91 AAA 10.06 10.03
J15562738+4757302 4 3.63 ± 0.36 2.26 ± 0.23 1.45 ± 0.15 0.90 ± 0.0910 4.93 ± 0.49 3.06 ± 0.31 1.79 ± 0.36 1.24 ± 0.13
Total 5.07 ± 0.51 3.12 ± 0.32 1.76 ± 0.64 1.33 ± 0.16 <0.35 <7.34 <30.31 AAA < 9.05 < 8.66J16024254+4111499 4 2.89 ± 0.29 2.15 ± 0.22 6.78 ± 0.68 22.67 ± 2.27
10 7.02 ± 0.70 5.04 ± 0.50 20.88 ± 2.11 53.41 ± 5.34Total 11.04 ± 1.11 7.88 ± 0.79 22.89 ± 2.43 77.56 ± 7.76 109.52 ± 15.33 1110.58 ± 120.33 2171.84 ± 237.03 PPP 10.82 10.96
J16024475+4111589 4 1.72 ± 0.17 1.17 ± 0.12 3.29 ± 0.33 9.50 ± 0.9510 3.64 ± 0.36 2.58 ± 0.26 6.74 ± 0.69 21.92 ± 2.19
Total 3.64 ± 0.36 2.58 ± 0.26 6.74 ± 0.69 21.92 ± 2.19 26.83 ± 3.76 460.22 ± 49.90 1143.07 ± 146.32 PPP 10.46 10.39
338 XU ET AL. Vol. 713
Table 3(Continued)
(1) (2) (3) (4) (5) (6) (7) (8) (9) (10) (11) (12)Galaxy ID Aperture f3.6 μm f4.5 μm f5.8 μm f8 μm f24 μm f70 μm f160 μm Photometry LTIR LIR
(kpc) (mJy) (mJy) (mJy) (mJy) (mJy) (mJy) (mJy) (L�) (L�)J17045089+3448530 4 1.11 ± 0.11 0.84 ± 0.08 1.06 ± 0.11 4.62 ± 0.46
10 2.47 ± 0.25 1.80 ± 0.18 2.63 ± 0.27 13.13 ± 1.31Total 2.82 ± 0.28 2.07 ± 0.21 2.94 ± 0.31 15.88 ± 1.59 28.93 ± 4.05 82.28 ± 9.07 360.76 ± 48.50 PPP 10.49 10.80
J17045097+3449020 4 2.56 ± 0.26 2.25 ± 0.23 4.56 ± 0.46 23.63 ± 2.3610 5.07 ± 0.51 3.99 ± 0.40 8.83 ± 0.88 49.86 ± 4.99
Total 5.56 ± 0.56 4.25 ± 0.43 8.71 ± 0.88 47.99 ± 4.80 131.22 ± 18.37 1518.03 ± 164.47 1636.24 ± 175.34 PPP 11.31 11.36J20471908+0019150 4 33.53 ± 3.35 18.87 ± 1.89 14.31 ± 1.44 10.86 ± 1.09
10 61.20 ± 6.12 34.60 ± 3.46 27.27 ± 2.82 25.13 ± 2.55Total 132.43 ± 13.43 75.75 ± 7.63 66.41 ± 16.73 101.26 ± 13.41 121.03 ± 6.27 462.86 ± 50.18 3048.90 ± 326.39 AAA 10.02 10.24
J20472428+0018030 4 21.05 ± 2.10 13.11 ± 1.31 8.92 ± 0.90 5.76 ± 0.5810 36.97 ± 3.70 23.40 ± 2.34 15.72 ± 1.74 10.50 ± 1.13
Total 50.90 ± 5.12 31.05 ± 3.11 22.91 ± 4.75 16.23 ± 2.88 11.93 ± 0.62 <36.64 <117.51 AAA < 9.10 9.32J13153076+6207447 4 6.00 ± 0.60 4.00 ± 0.40 15.00 ± 1.50 46.00 ± 4.60
10 8.00 ± 0.80 6.00 ± 0.60 18.00 ± 1.80 54.00 ± 5.40Total 8.00 ± 0.80 6.00 ± 0.60 18.00 ± 1.80 54.00 ± 5.40 11.01 11.01
J13153506+6207287 4 16.00 ± 1.60 15.00 ± 1.50 59.00 ± 5.90 179.00 ± 17.9010 17.00 ± 1.70 16.00 ± 1.60 62.00 ± 6.20 187.00 ± 18.70
Total 17.00 ± 1.70 16.00 ± 1.60 62.00 ± 6.20 187.00 ± 18.70 11.65 11.65
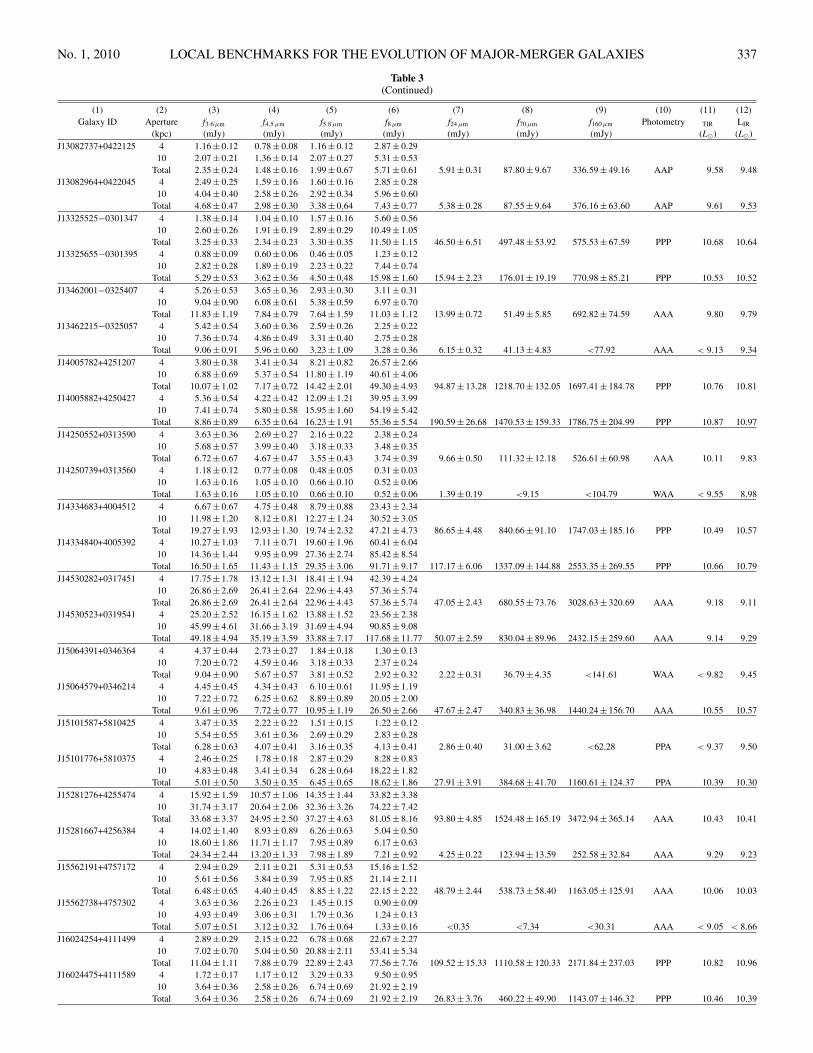
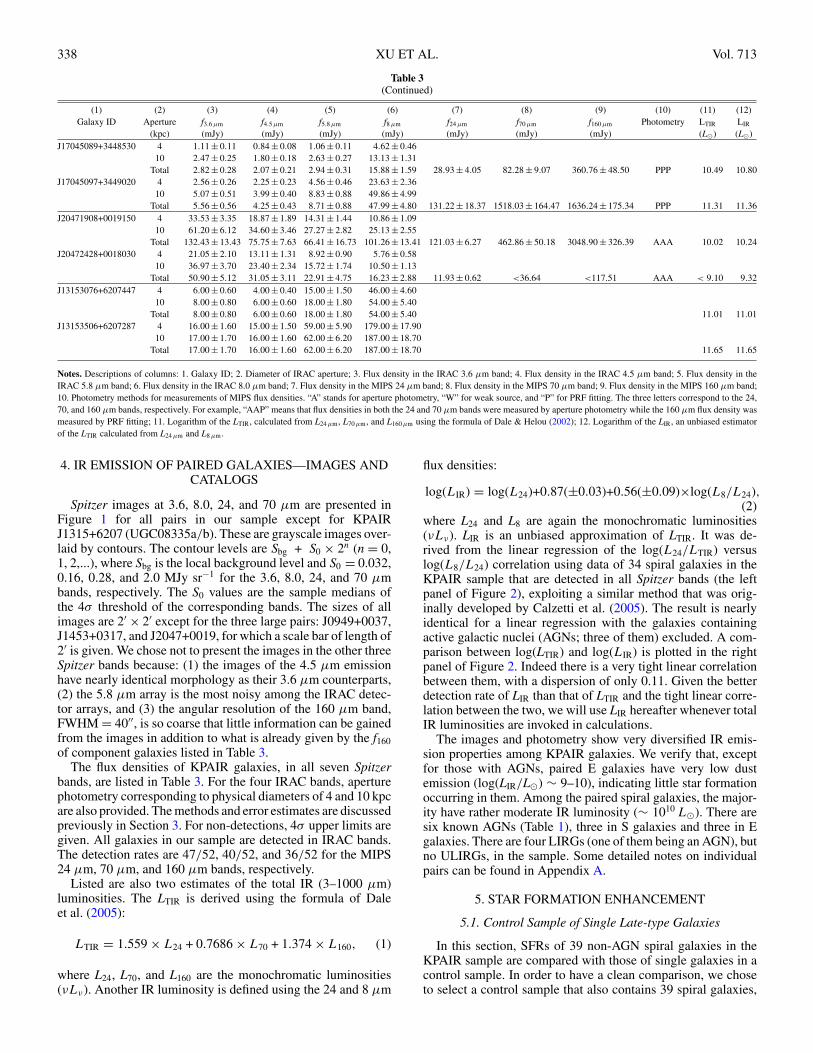
Notes. Descriptions of columns: 1. Galaxy ID; 2. Diameter of IRAC aperture; 3. Flux density in the IRAC 3.6 μm band; 4. Flux density in the IRAC 4.5 μm band; 5. Flux density in theIRAC 5.8 μm band; 6. Flux density in the IRAC 8.0 μm band; 7. Flux density in the MIPS 24 μm band; 8. Flux density in the MIPS 70 μm band; 9. Flux density in the MIPS 160 μm band;10. Photometry methods for measurements of MIPS flux densities. “A” stands for aperture photometry, “W” for weak source, and “P” for PRF fitting. The three letters correspond to the 24,70, and 160 μm bands, respectively. For example, “AAP” means that flux densities in both the 24 and 70 μm bands were measured by aperture photometry while the 160 μm flux density wasmeasured by PRF fitting; 11. Logarithm of the LTIR, calculated from L24 μm, L70 μm, and L160 μm using the formula of Dale & Helou (2002); 12. Logarithm of the LIR, an unbiased estimatorof the LTIR calculated from L24 μm and L8 μm.
4. IR EMISSION OF PAIRED GALAXIES—IMAGES ANDCATALOGS
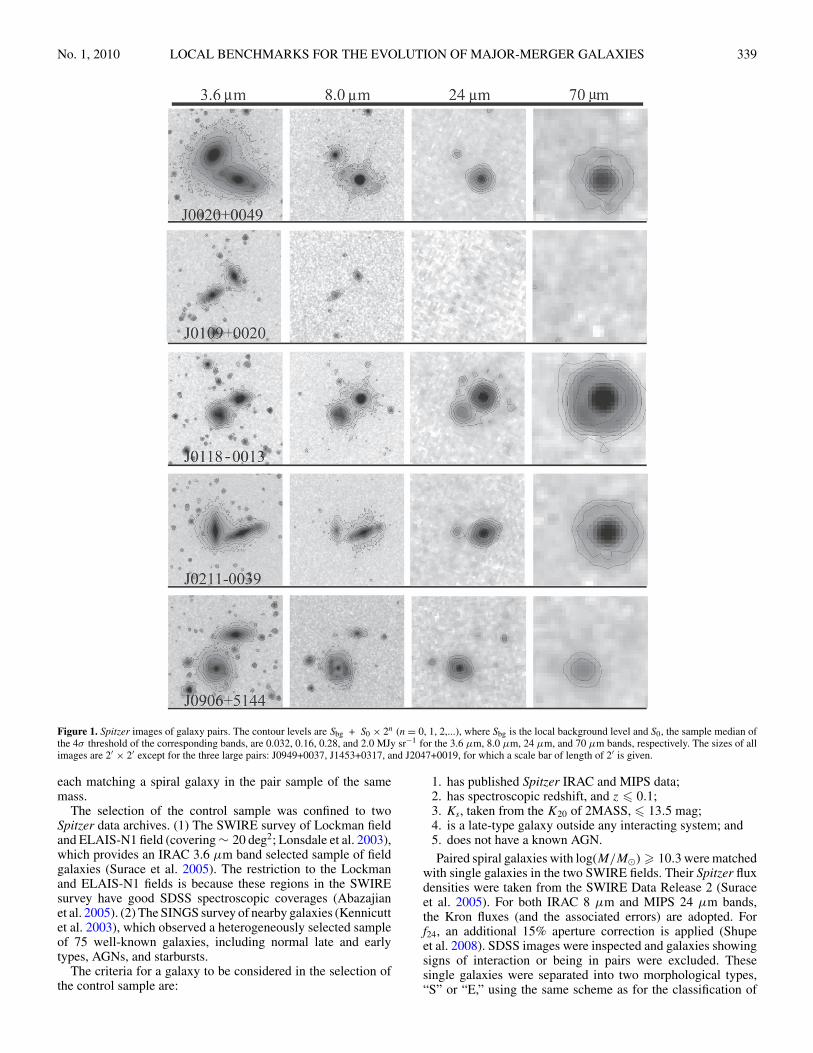
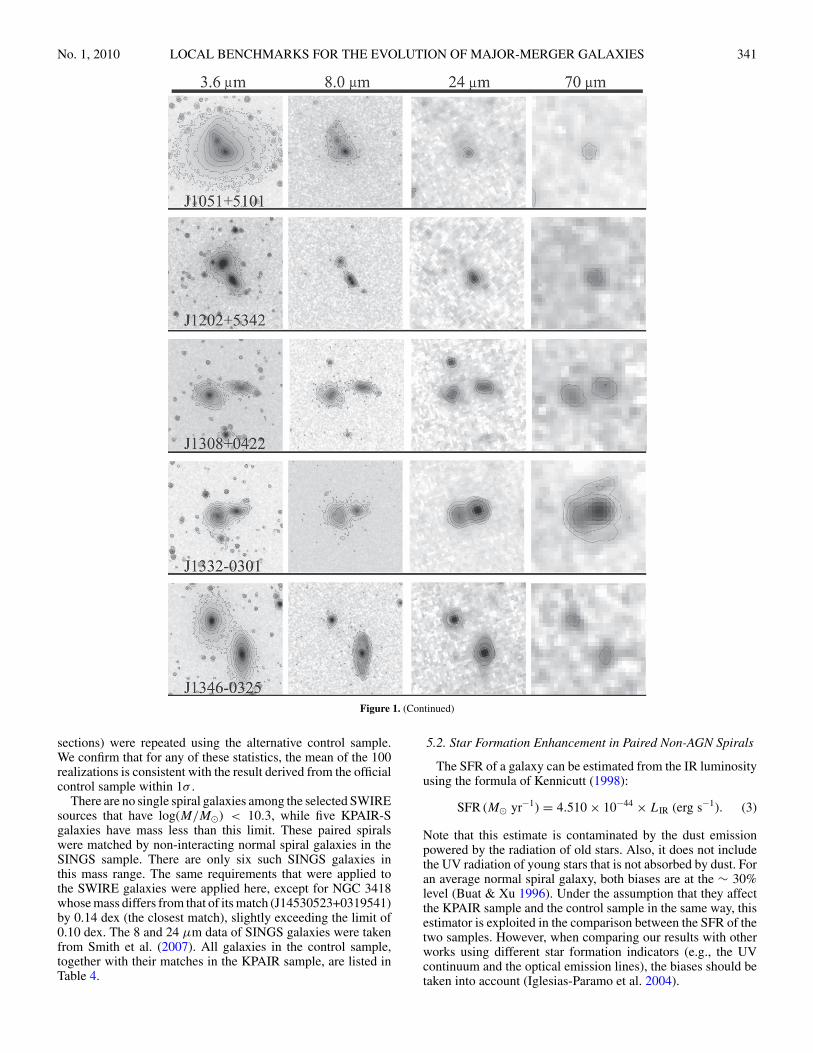
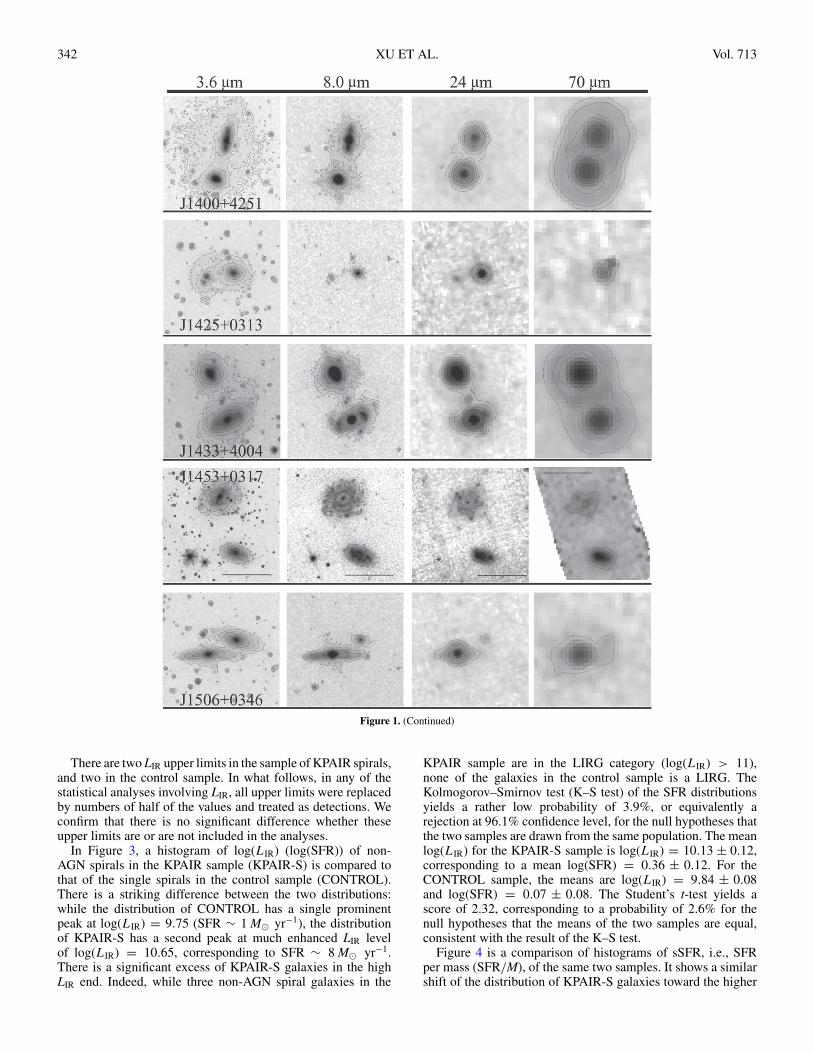
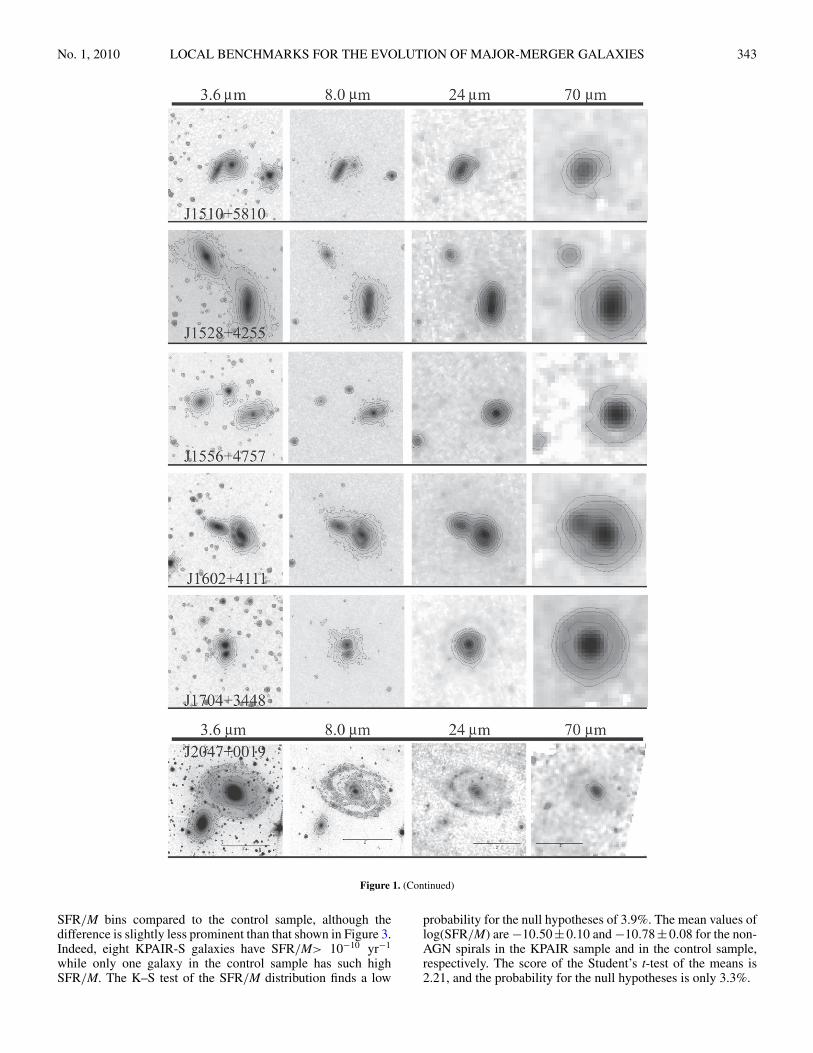
Spitzer images at 3.6, 8.0, 24, and 70 μm are presented inFigure 1 for all pairs in our sample except for KPAIRJ1315+6207 (UGC08335a/b). These are grayscale images over-laid by contours. The contour levels are Sbg + S0 × 2n (n = 0,1, 2,...), where Sbg is the local background level and S0 = 0.032,0.16, 0.28, and 2.0 MJy sr−1 for the 3.6, 8.0, 24, and 70 μmbands, respectively. The S0 values are the sample medians ofthe 4σ threshold of the corresponding bands. The sizes of allimages are 2′ × 2′ except for the three large pairs: J0949+0037,J1453+0317, and J2047+0019, for which a scale bar of length of2′ is given. We chose not to present the images in the other threeSpitzer bands because: (1) the images of the 4.5 μm emissionhave nearly identical morphology as their 3.6 μm counterparts,(2) the 5.8 μm array is the most noisy among the IRAC detec-tor arrays, and (3) the angular resolution of the 160 μm band,FWHM = 40′′, is so coarse that little information can be gainedfrom the images in addition to what is already given by the f160of component galaxies listed in Table 3.
The flux densities of KPAIR galaxies, in all seven Spitzerbands, are listed in Table 3. For the four IRAC bands, aperturephotometry corresponding to physical diameters of 4 and 10 kpcare also provided. The methods and error estimates are discussedpreviously in Section 3. For non-detections, 4σ upper limits aregiven. All galaxies in our sample are detected in IRAC bands.The detection rates are 47/52, 40/52, and 36/52 for the MIPS24 μm, 70 μm, and 160 μm bands, respectively.
Listed are also two estimates of the total IR (3–1000 μm)luminosities. The LTIR is derived using the formula of Daleet al. (2005):
LTIR = 1.559 × L24 + 0.7686 × L70 + 1.374 × L160, (1)
where L24, L70, and L160 are the monochromatic luminosities(νLν). Another IR luminosity is defined using the 24 and 8 μm
flux densities:
log(LIR) = log(L24)+0.87(±0.03)+0.56(±0.09)×log(L8/L24),(2)
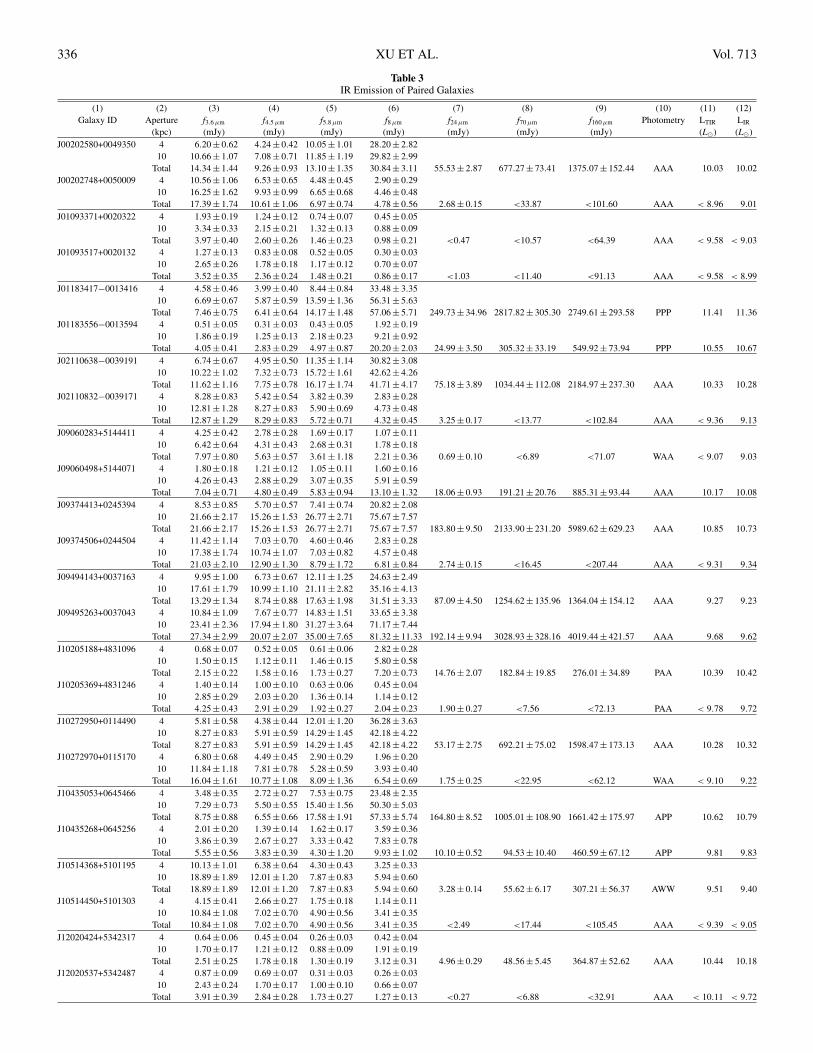
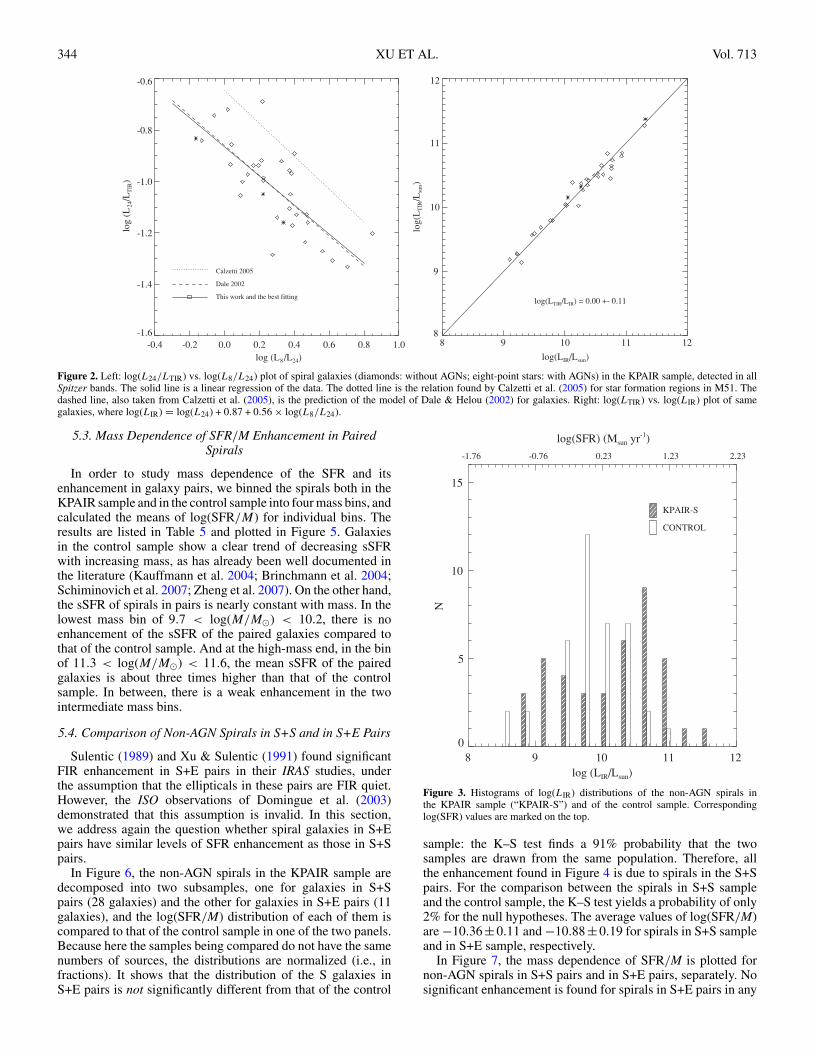
where L24 and L8 are again the monochromatic luminosities(νLν). LIR is an unbiased approximation of LTIR. It was de-rived from the linear regression of the log(L24/LTIR) versuslog(L8/L24) correlation using data of 34 spiral galaxies in theKPAIR sample that are detected in all Spitzer bands (the leftpanel of Figure 2), exploiting a similar method that was orig-inally developed by Calzetti et al. (2005). The result is nearlyidentical for a linear regression with the galaxies containingactive galactic nuclei (AGNs; three of them) excluded. A com-parison between log(LTIR) and log(LIR) is plotted in the rightpanel of Figure 2. Indeed there is a very tight linear correlationbetween them, with a dispersion of only 0.11. Given the betterdetection rate of LIR than that of LTIR and the tight linear corre-lation between the two, we will use LIR hereafter whenever totalIR luminosities are invoked in calculations.
The images and photometry show very diversified IR emis-sion properties among KPAIR galaxies. We verify that, exceptfor those with AGNs, paired E galaxies have very low dustemission (log(LIR/L�) ∼ 9–10), indicating little star formationoccurring in them. Among the paired spiral galaxies, the major-ity have rather moderate IR luminosity (∼ 1010 L�). There aresix known AGNs (Table 1), three in S galaxies and three in Egalaxies. There are four LIRGs (one of them being an AGN), butno ULIRGs, in the sample. Some detailed notes on individualpairs can be found in Appendix A.
5. STAR FORMATION ENHANCEMENT
5.1. Control Sample of Single Late-type Galaxies
In this section, SFRs of 39 non-AGN spiral galaxies in theKPAIR sample are compared with those of single galaxies in acontrol sample. In order to have a clean comparison, we choseto select a control sample that also contains 39 spiral galaxies,
No. 1, 2010 LOCAL BENCHMARKS FOR THE EVOLUTION OF MAJOR-MERGER GALAXIES 339
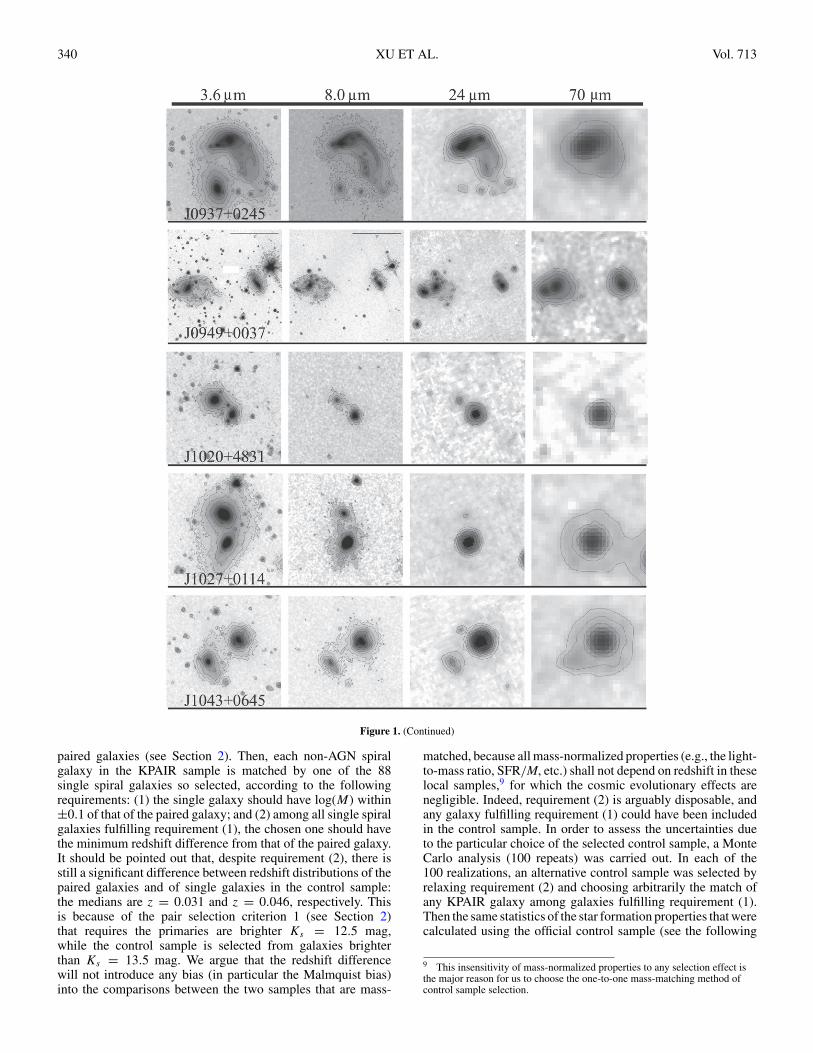
Figure 1. Spitzer images of galaxy pairs. The contour levels are Sbg + S0 × 2n (n = 0, 1, 2,...), where Sbg is the local background level and S0, the sample median ofthe 4σ threshold of the corresponding bands, are 0.032, 0.16, 0.28, and 2.0 MJy sr−1 for the 3.6 μm, 8.0 μm, 24 μm, and 70 μm bands, respectively. The sizes of allimages are 2′ × 2′ except for the three large pairs: J0949+0037, J1453+0317, and J2047+0019, for which a scale bar of length of 2′ is given.
each matching a spiral galaxy in the pair sample of the samemass.
The selection of the control sample was confined to twoSpitzer data archives. (1) The SWIRE survey of Lockman fieldand ELAIS-N1 field (covering ∼ 20 deg2; Lonsdale et al. 2003),which provides an IRAC 3.6 μm band selected sample of fieldgalaxies (Surace et al. 2005). The restriction to the Lockmanand ELAIS-N1 fields is because these regions in the SWIREsurvey have good SDSS spectroscopic coverages (Abazajianet al. 2005). (2) The SINGS survey of nearby galaxies (Kennicuttet al. 2003), which observed a heterogeneously selected sampleof 75 well-known galaxies, including normal late and earlytypes, AGNs, and starbursts.
The criteria for a galaxy to be considered in the selection ofthe control sample are:
1. has published Spitzer IRAC and MIPS data;2. has spectroscopic redshift, and z � 0.1;3. Ks, taken from the K20 of 2MASS, � 13.5 mag;4. is a late-type galaxy outside any interacting system; and5. does not have a known AGN.Paired spiral galaxies with log(M/M�) � 10.3 were matched
with single galaxies in the two SWIRE fields. Their Spitzer fluxdensities were taken from the SWIRE Data Release 2 (Suraceet al. 2005). For both IRAC 8 μm and MIPS 24 μm bands,the Kron fluxes (and the associated errors) are adopted. Forf24, an additional 15% aperture correction is applied (Shupeet al. 2008). SDSS images were inspected and galaxies showingsigns of interaction or being in pairs were excluded. Thesesingle galaxies were separated into two morphological types,“S” or “E,” using the same scheme as for the classification of
340 XU ET AL. Vol. 713
Figure 1. (Continued)
paired galaxies (see Section 2). Then, each non-AGN spiralgalaxy in the KPAIR sample is matched by one of the 88single spiral galaxies so selected, according to the followingrequirements: (1) the single galaxy should have log(M) within±0.1 of that of the paired galaxy; and (2) among all single spiralgalaxies fulfilling requirement (1), the chosen one should havethe minimum redshift difference from that of the paired galaxy.It should be pointed out that, despite requirement (2), there isstill a significant difference between redshift distributions of thepaired galaxies and of single galaxies in the control sample:the medians are z = 0.031 and z = 0.046, respectively. Thisis because of the pair selection criterion 1 (see Section 2)that requires the primaries are brighter Ks = 12.5 mag,while the control sample is selected from galaxies brighterthan Ks = 13.5 mag. We argue that the redshift differencewill not introduce any bias (in particular the Malmquist bias)into the comparisons between the two samples that are mass-
matched, because all mass-normalized properties (e.g., the light-to-mass ratio, SFR/M, etc.) shall not depend on redshift in theselocal samples,9 for which the cosmic evolutionary effects arenegligible. Indeed, requirement (2) is arguably disposable, andany galaxy fulfilling requirement (1) could have been includedin the control sample. In order to assess the uncertainties dueto the particular choice of the selected control sample, a MonteCarlo analysis (100 repeats) was carried out. In each of the100 realizations, an alternative control sample was selected byrelaxing requirement (2) and choosing arbitrarily the match ofany KPAIR galaxy among galaxies fulfilling requirement (1).Then the same statistics of the star formation properties that werecalculated using the official control sample (see the following
9 This insensitivity of mass-normalized properties to any selection effect isthe major reason for us to choose the one-to-one mass-matching method ofcontrol sample selection.
No. 1, 2010 LOCAL BENCHMARKS FOR THE EVOLUTION OF MAJOR-MERGER GALAXIES 341
Figure 1. (Continued)
sections) were repeated using the alternative control sample.We confirm that for any of these statistics, the mean of the 100realizations is consistent with the result derived from the officialcontrol sample within 1σ .
There are no single spiral galaxies among the selected SWIREsources that have log(M/M�) < 10.3, while five KPAIR-Sgalaxies have mass less than this limit. These paired spiralswere matched by non-interacting normal spiral galaxies in theSINGS sample. There are only six such SINGS galaxies inthis mass range. The same requirements that were applied tothe SWIRE galaxies were applied here, except for NGC 3418whose mass differs from that of its match (J14530523+0319541)by 0.14 dex (the closest match), slightly exceeding the limit of0.10 dex. The 8 and 24 μm data of SINGS galaxies were takenfrom Smith et al. (2007). All galaxies in the control sample,together with their matches in the KPAIR sample, are listed inTable 4.
5.2. Star Formation Enhancement in Paired Non-AGN Spirals
The SFR of a galaxy can be estimated from the IR luminosityusing the formula of Kennicutt (1998):
SFR (M� yr−1) = 4.510 × 10−44 × LIR (erg s−1). (3)
Note that this estimate is contaminated by the dust emissionpowered by the radiation of old stars. Also, it does not includethe UV radiation of young stars that is not absorbed by dust. Foran average normal spiral galaxy, both biases are at the ∼ 30%level (Buat & Xu 1996). Under the assumption that they affectthe KPAIR sample and the control sample in the same way, thisestimator is exploited in the comparison between the SFR of thetwo samples. However, when comparing our results with otherworks using different star formation indicators (e.g., the UVcontinuum and the optical emission lines), the biases should betaken into account (Iglesias-Paramo et al. 2004).
342 XU ET AL. Vol. 713
Figure 1. (Continued)
There are two LIR upper limits in the sample of KPAIR spirals,and two in the control sample. In what follows, in any of thestatistical analyses involving LIR, all upper limits were replacedby numbers of half of the values and treated as detections. Weconfirm that there is no significant difference whether theseupper limits are or are not included in the analyses.
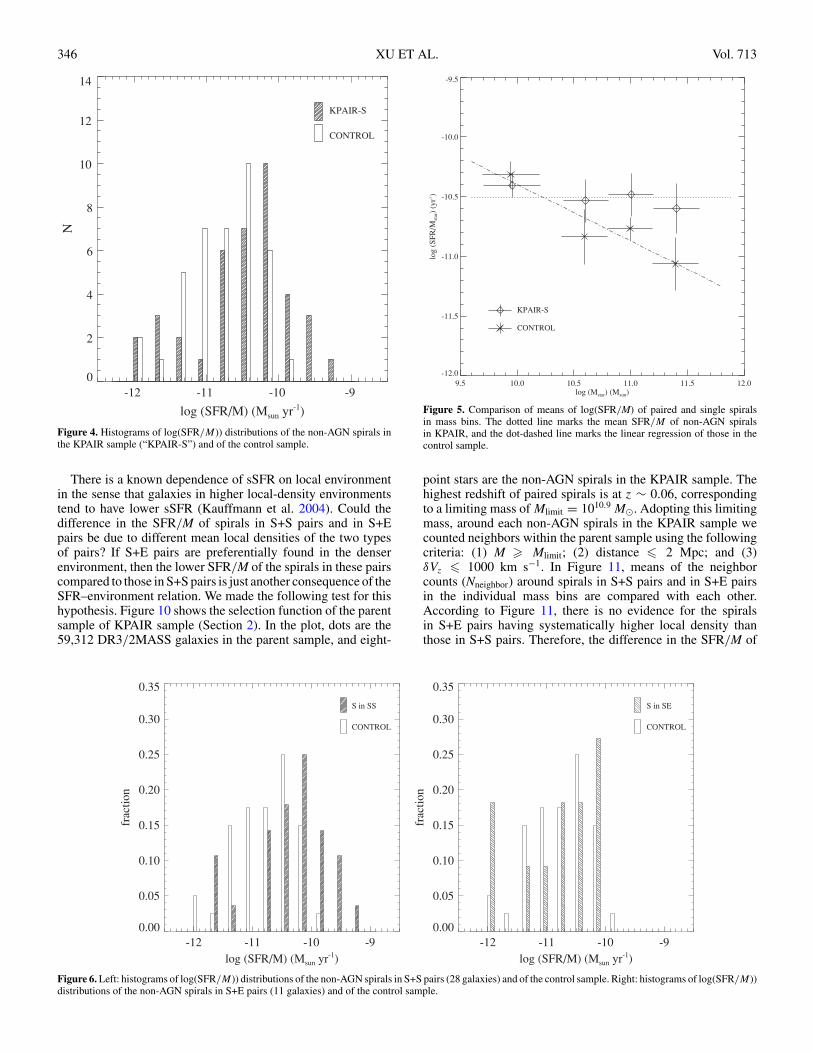
In Figure 3, a histogram of log(LIR) (log(SFR)) of non-AGN spirals in the KPAIR sample (KPAIR-S) is compared tothat of the single spirals in the control sample (CONTROL).There is a striking difference between the two distributions:while the distribution of CONTROL has a single prominentpeak at log(LIR) = 9.75 (SFR ∼ 1 M� yr−1), the distributionof KPAIR-S has a second peak at much enhanced LIR levelof log(LIR) = 10.65, corresponding to SFR ∼ 8 M� yr−1.There is a significant excess of KPAIR-S galaxies in the highLIR end. Indeed, while three non-AGN spiral galaxies in the
KPAIR sample are in the LIRG category (log(LIR) > 11),none of the galaxies in the control sample is a LIRG. TheKolmogorov–Smirnov test (K–S test) of the SFR distributionsyields a rather low probability of 3.9%, or equivalently arejection at 96.1% confidence level, for the null hypotheses thatthe two samples are drawn from the same population. The meanlog(LIR) for the KPAIR-S sample is log(LIR) = 10.13 ± 0.12,corresponding to a mean log(SFR) = 0.36 ± 0.12. For theCONTROL sample, the means are log(LIR) = 9.84 ± 0.08and log(SFR) = 0.07 ± 0.08. The Student’s t-test yields ascore of 2.32, corresponding to a probability of 2.6% for thenull hypotheses that the means of the two samples are equal,consistent with the result of the K–S test.
Figure 4 is a comparison of histograms of sSFR, i.e., SFRper mass (SFR/M), of the same two samples. It shows a similarshift of the distribution of KPAIR-S galaxies toward the higher
No. 1, 2010 LOCAL BENCHMARKS FOR THE EVOLUTION OF MAJOR-MERGER GALAXIES 343
Figure 1. (Continued)
SFR/M bins compared to the control sample, although thedifference is slightly less prominent than that shown in Figure 3.Indeed, eight KPAIR-S galaxies have SFR/M> 10−10 yr−1
while only one galaxy in the control sample has such highSFR/M. The K–S test of the SFR/M distribution finds a low
probability for the null hypotheses of 3.9%. The mean values oflog(SFR/M) are −10.50±0.10 and −10.78±0.08 for the non-AGN spirals in the KPAIR sample and in the control sample,respectively. The score of the Student’s t-test of the means is2.21, and the probability for the null hypotheses is only 3.3%.
344 XU ET AL. Vol. 713
-0.4 -0.2 0.0 0.2 0.4 0.6 0.8 1.0log (L8/L24)
-1.6
-1.4
-1.2
-1.0
-0.8
-0.6
log
(L24
/LT
IR)
Calzetti 2005
Dale 2002
This work and the best fitting
8 9 10 11 12
log(LIR/Lsun)
8
9
10
11
12
log(
LT
IR/L
sun)
log(LTIR/LIR) = 0.00 +- 0.11
Figure 2. Left: log(L24/LTIR) vs. log(L8/L24) plot of spiral galaxies (diamonds: without AGNs; eight-point stars: with AGNs) in the KPAIR sample, detected in allSpitzer bands. The solid line is a linear regression of the data. The dotted line is the relation found by Calzetti et al. (2005) for star formation regions in M51. Thedashed line, also taken from Calzetti et al. (2005), is the prediction of the model of Dale & Helou (2002) for galaxies. Right: log(LTIR) vs. log(LIR) plot of samegalaxies, where log(LIR) = log(L24) + 0.87 + 0.56 × log(L8/L24).
5.3. Mass Dependence of SFR/M Enhancement in PairedSpirals
In order to study mass dependence of the SFR and itsenhancement in galaxy pairs, we binned the spirals both in theKPAIR sample and in the control sample into four mass bins, andcalculated the means of log(SFR/M) for individual bins. Theresults are listed in Table 5 and plotted in Figure 5. Galaxiesin the control sample show a clear trend of decreasing sSFRwith increasing mass, as has already been well documented inthe literature (Kauffmann et al. 2004; Brinchmann et al. 2004;Schiminovich et al. 2007; Zheng et al. 2007). On the other hand,the sSFR of spirals in pairs is nearly constant with mass. In thelowest mass bin of 9.7 < log(M/M�) < 10.2, there is noenhancement of the sSFR of the paired galaxies compared tothat of the control sample. And at the high-mass end, in the binof 11.3 < log(M/M�) < 11.6, the mean sSFR of the pairedgalaxies is about three times higher than that of the controlsample. In between, there is a weak enhancement in the twointermediate mass bins.
5.4. Comparison of Non-AGN Spirals in S+S and in S+E Pairs
Sulentic (1989) and Xu & Sulentic (1991) found significantFIR enhancement in S+E pairs in their IRAS studies, underthe assumption that the ellipticals in these pairs are FIR quiet.However, the ISO observations of Domingue et al. (2003)demonstrated that this assumption is invalid. In this section,we address again the question whether spiral galaxies in S+Epairs have similar levels of SFR enhancement as those in S+Spairs.
In Figure 6, the non-AGN spirals in the KPAIR sample aredecomposed into two subsamples, one for galaxies in S+Spairs (28 galaxies) and the other for galaxies in S+E pairs (11galaxies), and the log(SFR/M) distribution of each of them iscompared to that of the control sample in one of the two panels.Because here the samples being compared do not have the samenumbers of sources, the distributions are normalized (i.e., infractions). It shows that the distribution of the S galaxies inS+E pairs is not significantly different from that of the control
8 9 10 11 12log (LIR/Lsun)
0
5
10
15
N
-1.76 -0.76 0.23 1.23 2.23
log(SFR) (Msun yr-1)
KPAIR-S
CONTROL
Figure 3. Histograms of log(LIR) distributions of the non-AGN spirals inthe KPAIR sample (“KPAIR-S”) and of the control sample. Correspondinglog(SFR) values are marked on the top.
sample: the K–S test finds a 91% probability that the twosamples are drawn from the same population. Therefore, allthe enhancement found in Figure 4 is due to spirals in the S+Spairs. For the comparison between the spirals in S+S sampleand the control sample, the K–S test yields a probability of only2% for the null hypotheses. The average values of log(SFR/M)are −10.36±0.11 and −10.88±0.19 for spirals in S+S sampleand in S+E sample, respectively.
In Figure 7, the mass dependence of SFR/M is plotted fornon-AGN spirals in S+S pairs and in S+E pairs, separately. Nosignificant enhancement is found for spirals in S+E pairs in any
No. 1, 2010 LOCAL BENCHMARKS FOR THE EVOLUTION OF MAJOR-MERGER GALAXIES 345
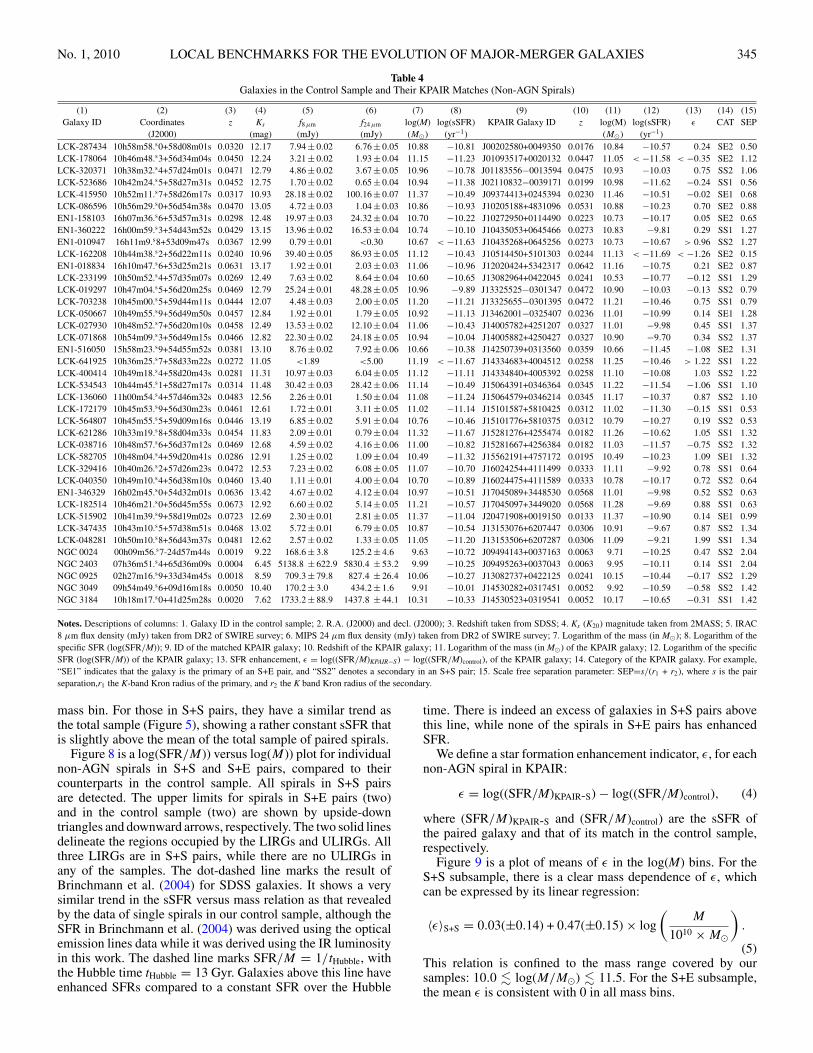
Table 4Galaxies in the Control Sample and Their KPAIR Matches (Non-AGN Spirals)
(1) (2) (3) (4) (5) (6) (7) (8) (9) (10) (11) (12) (13) (14) (15)Galaxy ID Coordinates z Ks f8 μm f24 μm log(M) log(sSFR) KPAIR Galaxy ID z log(M) log(sSFR) ε CAT SEP
(J2000) (mag) (mJy) (mJy) (M�) (yr−1) (M�) (yr−1)LCK-287434 10h58m58.s0+58d08m01s 0.0320 12.17 7.94 ± 0.02 6.76 ± 0.05 10.88 −10.81 J00202580+0049350 0.0176 10.84 −10.57 0.24 SE2 0.50LCK-178064 10h46m48.s3+56d34m04s 0.0450 12.24 3.21 ± 0.02 1.93 ± 0.04 11.15 −11.23 J01093517+0020132 0.0447 11.05 < −11.58 < −0.35 SE2 1.12LCK-320371 10h38m32.s4+57d24m01s 0.0471 12.79 4.86 ± 0.02 3.67 ± 0.05 10.96 −10.78 J01183556−0013594 0.0475 10.93 −10.03 0.75 SS2 1.06LCK-523686 10h42m24.s5+58d27m31s 0.0452 12.75 1.70 ± 0.02 0.65 ± 0.04 10.94 −11.38 J02110832−0039171 0.0199 10.98 −11.62 −0.24 SS1 0.56LCK-415950 10h52m11.s7+58d26m17s 0.0317 10.93 28.18 ± 0.02 100.16 ± 0.07 11.37 −10.49 J09374413+0245394 0.0230 11.46 −10.51 −0.02 SE1 0.68LCK-086596 10h56m29.s0+56d54m38s 0.0470 13.05 4.72 ± 0.03 1.04 ± 0.03 10.86 −10.93 J10205188+4831096 0.0531 10.88 −10.23 0.70 SE2 0.88EN1-158103 16h07m36.s6+53d57m31s 0.0298 12.48 19.97 ± 0.03 24.32 ± 0.04 10.70 −10.22 J10272950+0114490 0.0223 10.73 −10.17 0.05 SE2 0.65EN1-360222 16h00m59.s3+54d43m52s 0.0429 13.15 13.96 ± 0.02 16.53 ± 0.04 10.74 −10.10 J10435053+0645466 0.0273 10.83 −9.81 0.29 SS1 1.27EN1-010947 16h11m9.s8+53d09m47s 0.0367 12.99 0.79 ± 0.01 <0.30 10.67 < −11.63 J10435268+0645256 0.0273 10.73 −10.67 > 0.96 SS2 1.27LCK-162208 10h44m38.s2+56d22m11s 0.0240 10.96 39.40 ± 0.05 86.93 ± 0.05 11.12 −10.43 J10514450+5101303 0.0244 11.13 < −11.69 < −1.26 SE2 0.15EN1-018834 16h10m47.s6+53d25m21s 0.0631 13.17 1.92 ± 0.01 2.03 ± 0.03 11.06 −10.96 J12020424+5342317 0.0642 11.16 −10.75 0.21 SE2 0.87LCK-233199 10h50m52.s4+57d35m07s 0.0269 12.49 7.63 ± 0.02 8.64 ± 0.04 10.60 −10.65 J13082964+0422045 0.0241 10.53 −10.77 −0.12 SS1 1.29LCK-019297 10h47m04.s5+56d20m25s 0.0469 12.79 25.24 ± 0.01 48.28 ± 0.05 10.96 −9.89 J13325525−0301347 0.0472 10.90 −10.03 −0.13 SS2 0.79LCK-703238 10h45m00.s5+59d44m11s 0.0444 12.07 4.48 ± 0.03 2.00 ± 0.05 11.20 −11.21 J13325655−0301395 0.0472 11.21 −10.46 0.75 SS1 0.79LCK-050667 10h49m55.s9+56d49m50s 0.0457 12.84 1.92 ± 0.01 1.79 ± 0.05 10.92 −11.13 J13462001−0325407 0.0236 11.01 −10.99 0.14 SE1 1.28LCK-027930 10h48m52.s7+56d20m10s 0.0458 12.49 13.53 ± 0.02 12.10 ± 0.04 11.06 −10.43 J14005782+4251207 0.0327 11.01 −9.98 0.45 SS1 1.37LCK-071868 10h54m09.s3+56d49m15s 0.0466 12.82 22.30 ± 0.02 24.18 ± 0.05 10.94 −10.04 J14005882+4250427 0.0327 10.90 −9.70 0.34 SS2 1.37EN1-516050 15h58m23.s9+54d55m52s 0.0381 13.10 8.76 ± 0.02 7.92 ± 0.06 10.66 −10.38 J14250739+0313560 0.0359 10.66 −11.45 −1.08 SE2 1.31LCK-641925 10h36m25.s7+58d33m22s 0.0272 11.05 <1.89 <5.00 11.19 < −11.67 J14334683+4004512 0.0258 11.25 −10.46 > 1.22 SS1 1.22LCK-400414 10h49m18.s4+58d20m43s 0.0281 11.31 10.97 ± 0.03 6.04 ± 0.05 11.12 −11.11 J14334840+4005392 0.0258 11.10 −10.08 1.03 SS2 1.22LCK-534543 10h44m45.s1+58d27m17s 0.0314 11.48 30.42 ± 0.03 28.42 ± 0.06 11.14 −10.49 J15064391+0346364 0.0345 11.22 −11.54 −1.06 SS1 1.10LCK-136060 11h00m54.s4+57d46m32s 0.0483 12.56 2.26 ± 0.01 1.50 ± 0.04 11.08 −11.24 J15064579+0346214 0.0345 11.17 −10.37 0.87 SS2 1.10LCK-172179 10h45m53.s9+56d30m23s 0.0461 12.61 1.72 ± 0.01 3.11 ± 0.05 11.02 −11.14 J15101587+5810425 0.0312 11.02 −11.30 −0.15 SS1 0.53LCK-564807 10h45m55.s5+59d09m16s 0.0446 13.19 6.85 ± 0.02 5.91 ± 0.04 10.76 −10.46 J15101776+5810375 0.0312 10.79 −10.27 0.19 SS2 0.53LCK-621286 10h33m19.s8+58d04m33s 0.0454 11.83 2.09 ± 0.01 0.79 ± 0.04 11.32 −11.67 J15281276+4255474 0.0182 11.26 −10.62 1.05 SS1 1.32LCK-038716 10h48m57.s6+56d37m12s 0.0469 12.68 4.59 ± 0.02 4.16 ± 0.06 11.00 −10.82 J15281667+4256384 0.0182 11.03 −11.57 −0.75 SS2 1.32LCK-582705 10h48m04.s4+59d20m41s 0.0286 12.91 1.25 ± 0.02 1.09 ± 0.04 10.49 −11.32 J15562191+4757172 0.0195 10.49 −10.23 1.09 SE1 1.32LCK-329416 10h40m26.s2+57d26m23s 0.0472 12.53 7.23 ± 0.02 6.08 ± 0.05 11.07 −10.70 J16024254+4111499 0.0333 11.11 −9.92 0.78 SS1 0.64LCK-040350 10h49m10.s4+56d38m10s 0.0460 13.40 1.11 ± 0.01 4.00 ± 0.04 10.70 −10.89 J16024475+4111589 0.0333 10.78 −10.17 0.72 SS2 0.64EN1-346329 16h02m45.s0+54d32m01s 0.0636 13.42 4.67 ± 0.02 4.12 ± 0.04 10.97 −10.51 J17045089+3448530 0.0568 11.01 −9.98 0.52 SS2 0.63LCK-182514 10h46m21.s0+56d45m55s 0.0673 12.92 6.60 ± 0.02 5.14 ± 0.05 11.21 −10.57 J17045097+3449020 0.0568 11.28 −9.69 0.88 SS1 0.63LCK-515902 10h41m39.s9+58d19m02s 0.0723 12.69 2.30 ± 0.01 2.81 ± 0.05 11.37 −11.04 J20471908+0019150 0.0133 11.37 −10.90 0.14 SE1 0.99LCK-347435 10h43m10.s5+57d38m51s 0.0468 13.02 5.72 ± 0.01 6.79 ± 0.05 10.87 −10.54 J13153076+6207447 0.0306 10.91 −9.67 0.87 SS2 1.34LCK-048281 10h50m10.s8+56d43m37s 0.0481 12.62 2.57 ± 0.02 1.33 ± 0.05 11.05 −11.20 J13153506+6207287 0.0306 11.09 −9.21 1.99 SS1 1.34NGC 0024 00h09m56.s7-24d57m44s 0.0019 9.22 168.6 ± 3.8 125.2 ± 4.6 9.63 −10.72 J09494143+0037163 0.0063 9.71 −10.25 0.47 SS2 2.04NGC 2403 07h36m51.s4+65d36m09s 0.0004 6.45 5138.8 ± 622.9 5830.4 ± 53.2 9.99 −10.25 J09495263+0037043 0.0063 9.95 −10.11 0.14 SS1 2.04NGC 0925 02h27m16.s9+33d34m45s 0.0018 8.59 709.3 ± 79.8 827.4 ± 26.4 10.06 −10.27 J13082737+0422125 0.0241 10.15 −10.44 −0.17 SS2 1.29NGC 3049 09h54m49.s6+09d16m18s 0.0050 10.40 170.2 ± 3.0 434.2 ± 1.6 9.91 −10.01 J14530282+0317451 0.0052 9.92 −10.59 −0.58 SS2 1.42NGC 3184 10h18m17.s0+41d25m28s 0.0020 7.62 1733.2 ± 88.9 1437.8 ± 44.1 10.31 −10.33 J14530523+0319541 0.0052 10.17 −10.65 −0.31 SS1 1.42
Notes. Descriptions of columns: 1. Galaxy ID in the control sample; 2. R.A. (J2000) and decl. (J2000); 3. Redshift taken from SDSS; 4. Ks (K20) magnitude taken from 2MASS; 5. IRAC8 μm flux density (mJy) taken from DR2 of SWIRE survey; 6. MIPS 24 μm flux density (mJy) taken from DR2 of SWIRE survey; 7. Logarithm of the mass (in M�); 8. Logarithm of thespecific SFR (log(SFR/M)); 9. ID of the matched KPAIR galaxy; 10. Redshift of the KPAIR galaxy; 11. Logarithm of the mass (in M�) of the KPAIR galaxy; 12. Logarithm of the specificSFR (log(SFR/M)) of the KPAIR galaxy; 13. SFR enhancement, ε = log((SFR/M)KPAIR−S) − log((SFR/M)control), of the KPAIR galaxy; 14. Category of the KPAIR galaxy. For example,“SE1” indicates that the galaxy is the primary of an S+E pair, and “SS2” denotes a secondary in an S+S pair; 15. Scale free separation parameter: SEP=s/(r1 + r2), where s is the pairseparation,r1 the K-band Kron radius of the primary, and r2 the K band Kron radius of the secondary.
mass bin. For those in S+S pairs, they have a similar trend asthe total sample (Figure 5), showing a rather constant sSFR thatis slightly above the mean of the total sample of paired spirals.
Figure 8 is a log(SFR/M)) versus log(M)) plot for individualnon-AGN spirals in S+S and S+E pairs, compared to theircounterparts in the control sample. All spirals in S+S pairsare detected. The upper limits for spirals in S+E pairs (two)and in the control sample (two) are shown by upside-downtriangles and downward arrows, respectively. The two solid linesdelineate the regions occupied by the LIRGs and ULIRGs. Allthree LIRGs are in S+S pairs, while there are no ULIRGs inany of the samples. The dot-dashed line marks the result ofBrinchmann et al. (2004) for SDSS galaxies. It shows a verysimilar trend in the sSFR versus mass relation as that revealedby the data of single spirals in our control sample, although theSFR in Brinchmann et al. (2004) was derived using the opticalemission lines data while it was derived using the IR luminosityin this work. The dashed line marks SFR/M = 1/tHubble, withthe Hubble time tHubble = 13 Gyr. Galaxies above this line haveenhanced SFRs compared to a constant SFR over the Hubble
time. There is indeed an excess of galaxies in S+S pairs abovethis line, while none of the spirals in S+E pairs has enhancedSFR.
We define a star formation enhancement indicator, ε, for eachnon-AGN spiral in KPAIR:
ε = log((SFR/M)KPAIR-S) − log((SFR/M)control), (4)
where (SFR/M)KPAIR-S and (SFR/M)control) are the sSFR ofthe paired galaxy and that of its match in the control sample,respectively.
Figure 9 is a plot of means of ε in the log(M) bins. For theS+S subsample, there is a clear mass dependence of ε, whichcan be expressed by its linear regression:
〈ε〉S+S = 0.03(±0.14) + 0.47(±0.15) × log
(M
1010 × M�
).
(5)This relation is confined to the mass range covered by oursamples: 10.0 � log(M/M�) � 11.5. For the S+E subsample,the mean ε is consistent with 0 in all mass bins.
346 XU ET AL. Vol. 713
-12 -11 -10 -9
log (SFR/M) (Msun yr-1)
0
2
4
6
8
10
12
14N
KPAIR-S
CONTROL
Figure 4. Histograms of log(SFR/M)) distributions of the non-AGN spirals inthe KPAIR sample (“KPAIR-S”) and of the control sample.
There is a known dependence of sSFR on local environmentin the sense that galaxies in higher local-density environmentstend to have lower sSFR (Kauffmann et al. 2004). Could thedifference in the SFR/M of spirals in S+S pairs and in S+Epairs be due to different mean local densities of the two typesof pairs? If S+E pairs are preferentially found in the denserenvironment, then the lower SFR/M of the spirals in these pairscompared to those in S+S pairs is just another consequence of theSFR–environment relation. We made the following test for thishypothesis. Figure 10 shows the selection function of the parentsample of KPAIR sample (Section 2). In the plot, dots are the59,312 DR3/2MASS galaxies in the parent sample, and eight-
9.5 10.0 10.5 11.0 11.5 12.0log (Mstar) (Msun)
-12.0
-11.5
-11.0
-10.5
-10.0
-9.5
log
(SFR
/Mst
ar)
(yr-1
)
KPAIR-S
CONTROL
Figure 5. Comparison of means of log(SFR/M) of paired and single spiralsin mass bins. The dotted line marks the mean SFR/M of non-AGN spiralsin KPAIR, and the dot-dashed line marks the linear regression of those in thecontrol sample.
point stars are the non-AGN spirals in the KPAIR sample. Thehighest redshift of paired spirals is at z ∼ 0.06, correspondingto a limiting mass of Mlimit = 1010.9 M�. Adopting this limitingmass, around each non-AGN spirals in the KPAIR sample wecounted neighbors within the parent sample using the followingcriteria: (1) M � Mlimit; (2) distance � 2 Mpc; and (3)δVz � 1000 km s−1. In Figure 11, means of the neighborcounts (Nneighbor) around spirals in S+S pairs and in S+E pairsin the individual mass bins are compared with each other.According to Figure 11, there is no evidence for the spiralsin S+E pairs having systematically higher local density thanthose in S+S pairs. Therefore, the difference in the SFR/M of
-12 -11 -10 -9log (SFR/M) (Msun yr-1)
0.00
0.05
0.10
0.15
0.20
0.25
0.30
0.35
frac
tion
S in SS
CONTROL
-12 -11 -10 -9log (SFR/M) (Msun yr-1)
0.00
0.05
0.10
0.15
0.20
0.25
0.30
0.35
frac
tion
S in SE
CONTROL
Figure 6. Left: histograms of log(SFR/M)) distributions of the non-AGN spirals in S+S pairs (28 galaxies) and of the control sample. Right: histograms of log(SFR/M))distributions of the non-AGN spirals in S+E pairs (11 galaxies) and of the control sample.
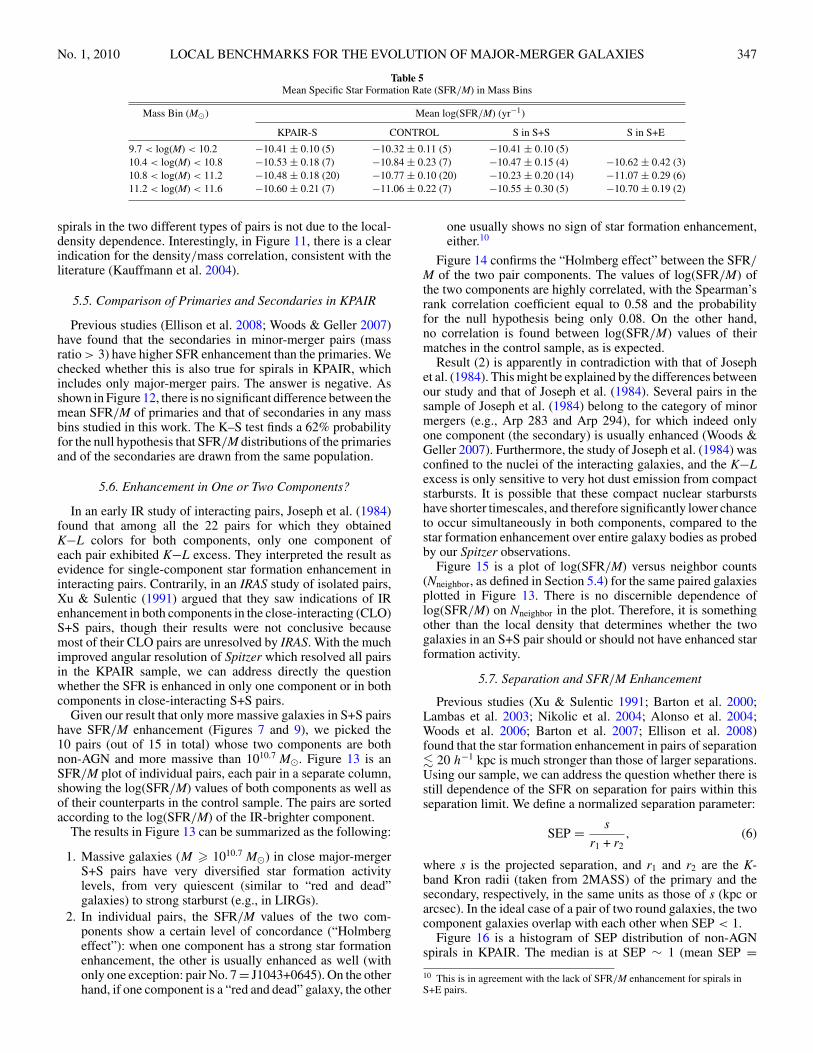
No. 1, 2010 LOCAL BENCHMARKS FOR THE EVOLUTION OF MAJOR-MERGER GALAXIES 347
Table 5Mean Specific Star Formation Rate (SFR/M) in Mass Bins
Mass Bin (M�) Mean log(SFR/M) (yr−1)
KPAIR-S CONTROL S in S+S S in S+E
9.7 < log(M) < 10.2 −10.41 ± 0.10 (5) −10.32 ± 0.11 (5) −10.41 ± 0.10 (5)10.4 < log(M) < 10.8 −10.53 ± 0.18 (7) −10.84 ± 0.23 (7) −10.47 ± 0.15 (4) −10.62 ± 0.42 (3)10.8 < log(M) < 11.2 −10.48 ± 0.18 (20) −10.77 ± 0.10 (20) −10.23 ± 0.20 (14) −11.07 ± 0.29 (6)11.2 < log(M) < 11.6 −10.60 ± 0.21 (7) −11.06 ± 0.22 (7) −10.55 ± 0.30 (5) −10.70 ± 0.19 (2)
spirals in the two different types of pairs is not due to the local-density dependence. Interestingly, in Figure 11, there is a clearindication for the density/mass correlation, consistent with theliterature (Kauffmann et al. 2004).
5.5. Comparison of Primaries and Secondaries in KPAIR
Previous studies (Ellison et al. 2008; Woods & Geller 2007)have found that the secondaries in minor-merger pairs (massratio > 3) have higher SFR enhancement than the primaries. Wechecked whether this is also true for spirals in KPAIR, whichincludes only major-merger pairs. The answer is negative. Asshown in Figure 12, there is no significant difference between themean SFR/M of primaries and that of secondaries in any massbins studied in this work. The K–S test finds a 62% probabilityfor the null hypothesis that SFR/M distributions of the primariesand of the secondaries are drawn from the same population.
5.6. Enhancement in One or Two Components?
In an early IR study of interacting pairs, Joseph et al. (1984)found that among all the 22 pairs for which they obtainedK−L colors for both components, only one component ofeach pair exhibited K−L excess. They interpreted the result asevidence for single-component star formation enhancement ininteracting pairs. Contrarily, in an IRAS study of isolated pairs,Xu & Sulentic (1991) argued that they saw indications of IRenhancement in both components in the close-interacting (CLO)S+S pairs, though their results were not conclusive becausemost of their CLO pairs are unresolved by IRAS. With the muchimproved angular resolution of Spitzer which resolved all pairsin the KPAIR sample, we can address directly the questionwhether the SFR is enhanced in only one component or in bothcomponents in close-interacting S+S pairs.
Given our result that only more massive galaxies in S+S pairshave SFR/M enhancement (Figures 7 and 9), we picked the10 pairs (out of 15 in total) whose two components are bothnon-AGN and more massive than 1010.7 M�. Figure 13 is anSFR/M plot of individual pairs, each pair in a separate column,showing the log(SFR/M) values of both components as well asof their counterparts in the control sample. The pairs are sortedaccording to the log(SFR/M) of the IR-brighter component.
The results in Figure 13 can be summarized as the following:
1. Massive galaxies (M � 1010.7 M�) in close major-mergerS+S pairs have very diversified star formation activitylevels, from very quiescent (similar to “red and dead”galaxies) to strong starburst (e.g., in LIRGs).
2. In individual pairs, the SFR/M values of the two com-ponents show a certain level of concordance (“Holmbergeffect”): when one component has a strong star formationenhancement, the other is usually enhanced as well (withonly one exception: pair No. 7 = J1043+0645). On the otherhand, if one component is a “red and dead” galaxy, the other
one usually shows no sign of star formation enhancement,either.10
Figure 14 confirms the “Holmberg effect” between the SFR/M of the two pair components. The values of log(SFR/M) ofthe two components are highly correlated, with the Spearman’srank correlation coefficient equal to 0.58 and the probabilityfor the null hypothesis being only 0.08. On the other hand,no correlation is found between log(SFR/M) values of theirmatches in the control sample, as is expected.
Result (2) is apparently in contradiction with that of Josephet al. (1984). This might be explained by the differences betweenour study and that of Joseph et al. (1984). Several pairs in thesample of Joseph et al. (1984) belong to the category of minormergers (e.g., Arp 283 and Arp 294), for which indeed onlyone component (the secondary) is usually enhanced (Woods &Geller 2007). Furthermore, the study of Joseph et al. (1984) wasconfined to the nuclei of the interacting galaxies, and the K−Lexcess is only sensitive to very hot dust emission from compactstarbursts. It is possible that these compact nuclear starburstshave shorter timescales, and therefore significantly lower chanceto occur simultaneously in both components, compared to thestar formation enhancement over entire galaxy bodies as probedby our Spitzer observations.
Figure 15 is a plot of log(SFR/M) versus neighbor counts(Nneighbor, as defined in Section 5.4) for the same paired galaxiesplotted in Figure 13. There is no discernible dependence oflog(SFR/M) on Nneighbor in the plot. Therefore, it is somethingother than the local density that determines whether the twogalaxies in an S+S pair should or should not have enhanced starformation activity.
5.7. Separation and SFR/M Enhancement
Previous studies (Xu & Sulentic 1991; Barton et al. 2000;Lambas et al. 2003; Nikolic et al. 2004; Alonso et al. 2004;Woods et al. 2006; Barton et al. 2007; Ellison et al. 2008)found that the star formation enhancement in pairs of separation� 20 h−1 kpc is much stronger than those of larger separations.Using our sample, we can address the question whether there isstill dependence of the SFR on separation for pairs within thisseparation limit. We define a normalized separation parameter:
SEP = s
r1 + r2, (6)
where s is the projected separation, and r1 and r2 are the K-band Kron radii (taken from 2MASS) of the primary and thesecondary, respectively, in the same units as those of s (kpc orarcsec). In the ideal case of a pair of two round galaxies, the twocomponent galaxies overlap with each other when SEP < 1.
Figure 16 is a histogram of SEP distribution of non-AGNspirals in KPAIR. The median is at SEP ∼ 1 (mean SEP =10 This is in agreement with the lack of SFR/M enhancement for spirals inS+E pairs.
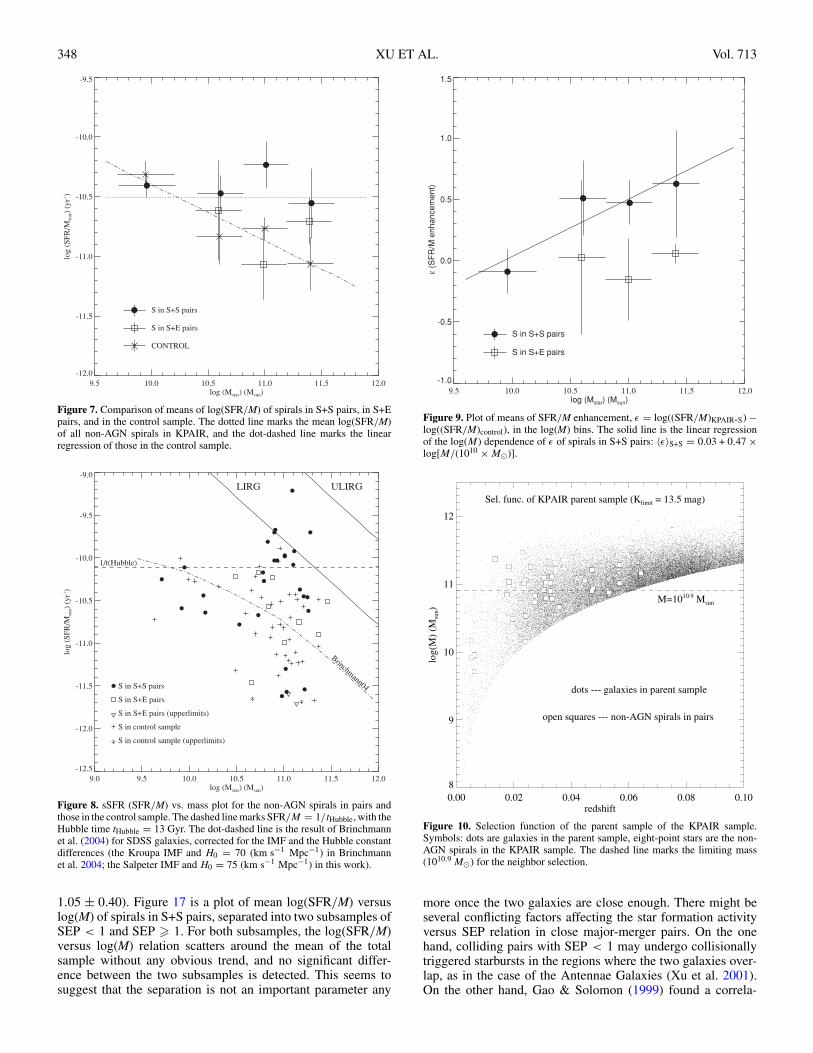
348 XU ET AL. Vol. 713
9.5 10.0 10.5 11.0 11.5 12.0log (Mstar) (Msun)
-12.0
-11.5
-11.0
-10.5
-10.0
-9.5
log
(SFR
/Mst
ar)
(yr-1
)
S in S+S pairs
S in S+E pairs
CONTROL
Figure 7. Comparison of means of log(SFR/M) of spirals in S+S pairs, in S+Epairs, and in the control sample. The dotted line marks the mean log(SFR/M)of all non-AGN spirals in KPAIR, and the dot-dashed line marks the linearregression of those in the control sample.
9.0 9.5 10.0 10.5 11.0 11.5 12.0log (Mstar) (Msun)
-12.5
-12.0
-11.5
-11.0
-10.5
-10.0
-9.5
-9.0
log
(SFR
/Mst
ar)
(yr-1
)
S in S+S pairs
S in S+E pairs
S in S+E pairs (upperlimits)
S in control sample
S in control sample (upperlimits)
1/t(Hubble)
Brinchmann04
LIRG ULIRG
Figure 8. sSFR (SFR/M) vs. mass plot for the non-AGN spirals in pairs andthose in the control sample. The dashed line marks SFR/M = 1/tHubble, with theHubble time tHubble = 13 Gyr. The dot-dashed line is the result of Brinchmannet al. (2004) for SDSS galaxies, corrected for the IMF and the Hubble constantdifferences (the Kroupa IMF and H0 = 70 (km s−1 Mpc−1) in Brinchmannet al. 2004; the Salpeter IMF and H0 = 75 (km s−1 Mpc−1) in this work).
1.05 ± 0.40). Figure 17 is a plot of mean log(SFR/M) versuslog(M) of spirals in S+S pairs, separated into two subsamples ofSEP < 1 and SEP � 1. For both subsamples, the log(SFR/M)versus log(M) relation scatters around the mean of the totalsample without any obvious trend, and no significant differ-ence between the two subsamples is detected. This seems tosuggest that the separation is not an important parameter any
9.5 10.0 10.5 11.0 11.5 12.0log (Mstar) (Msun)
-1.0
-0.5
0.0
0.5
1.0
1.5
ε (S
FR
/M e
nhan
cem
ent)
S in S+S pairs
S in S+E pairs
Figure 9. Plot of means of SFR/M enhancement, ε = log((SFR/M)KPAIR-S) −log((SFR/M)control), in the log(M) bins. The solid line is the linear regressionof the log(M) dependence of ε of spirals in S+S pairs: 〈ε〉S+S = 0.03 + 0.47 ×log[M/(1010 × M�)].
0.00 0.02 0.04 0.06 0.08 0.10redshift
8
9
10
11
12
log(
M)
(Msu
n)
dots --- galaxies in parent sample
open squares --- non-AGN spirals in pairs
M=1010.9 Msun
Sel. func. of KPAIR parent sample (Klimit = 13.5 mag)
Figure 10. Selection function of the parent sample of the KPAIR sample.Symbols: dots are galaxies in the parent sample, eight-point stars are the non-AGN spirals in the KPAIR sample. The dashed line marks the limiting mass(1010.9 M�) for the neighbor selection.
more once the two galaxies are close enough. There might beseveral conflicting factors affecting the star formation activityversus SEP relation in close major-merger pairs. On the onehand, colliding pairs with SEP < 1 may undergo collisionallytriggered starbursts in the regions where the two galaxies over-lap, as in the case of the Antennae Galaxies (Xu et al. 2001).On the other hand, Gao & Solomon (1999) found a correla-
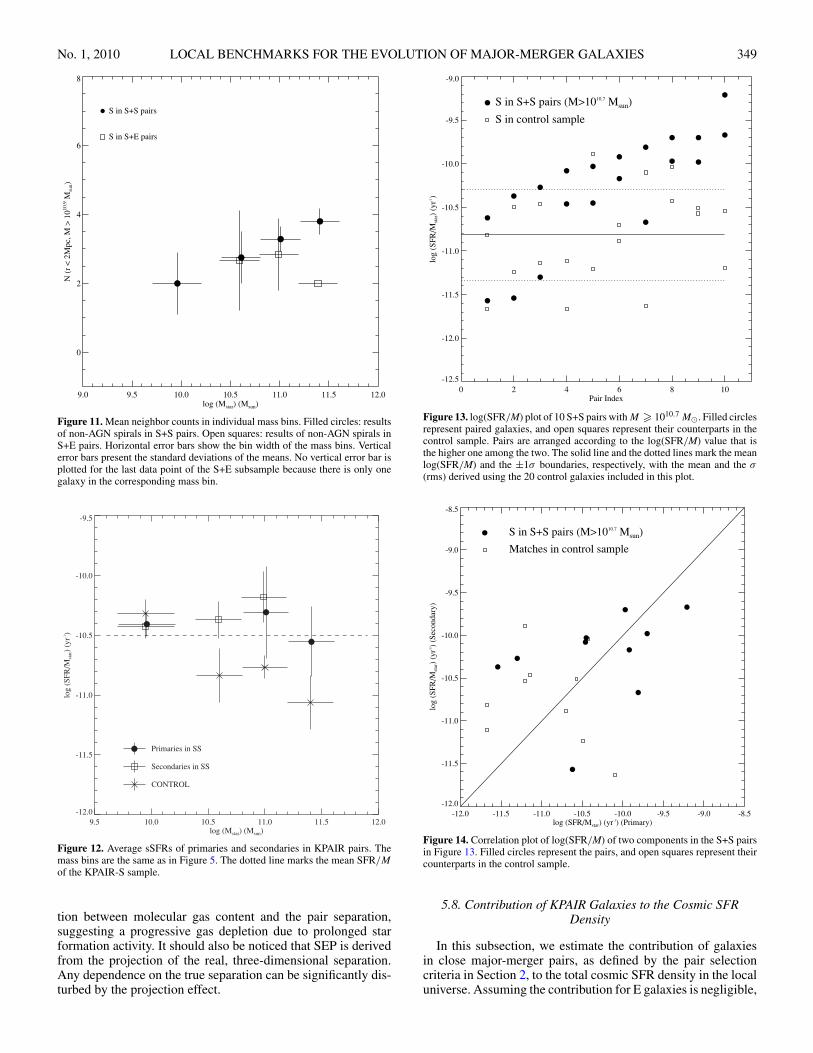
No. 1, 2010 LOCAL BENCHMARKS FOR THE EVOLUTION OF MAJOR-MERGER GALAXIES 349
9.0 9.5 10.0 10.5 11.0 11.5 12.0log (Mstar) (Msun)
0
2
4
6
8
N (
r <
2M
pc, M
> 1
010.9 M
sun)
S in S+S pairs
S in S+E pairs
Figure 11. Mean neighbor counts in individual mass bins. Filled circles: resultsof non-AGN spirals in S+S pairs. Open squares: results of non-AGN spirals inS+E pairs. Horizontal error bars show the bin width of the mass bins. Verticalerror bars present the standard deviations of the means. No vertical error bar isplotted for the last data point of the S+E subsample because there is only onegalaxy in the corresponding mass bin.
9.5 10.0 10.5 11.0 11.5 12.0log (Mstar) (Msun)
-12.0
-11.5
-11.0
-10.5
-10.0
-9.5
log
(SFR
/Mst
ar)
(yr-1
)
Primaries in SS
Secondaries in SS
CONTROL
Figure 12. Average sSFRs of primaries and secondaries in KPAIR pairs. Themass bins are the same as in Figure 5. The dotted line marks the mean SFR/M
of the KPAIR-S sample.
tion between molecular gas content and the pair separation,suggesting a progressive gas depletion due to prolonged starformation activity. It should also be noticed that SEP is derivedfrom the projection of the real, three-dimensional separation.Any dependence on the true separation can be significantly dis-turbed by the projection effect.
0 2 4 6 8 10Pair Index
-12.5
-12.0
-11.5
-11.0
-10.5
-10.0
-9.5
-9.0
log
(SFR
/Mst
ar)
(yr-1
)
S in S+S pairs (M>1010.7 Msun)
S in control sample
Figure 13. log(SFR/M) plot of 10 S+S pairs with M � 1010.7 M�. Filled circlesrepresent paired galaxies, and open squares represent their counterparts in thecontrol sample. Pairs are arranged according to the log(SFR/M) value that isthe higher one among the two. The solid line and the dotted lines mark the meanlog(SFR/M) and the ±1σ boundaries, respectively, with the mean and the σ
(rms) derived using the 20 control galaxies included in this plot.
-12.0 -11.5 -11.0 -10.5 -10.0 -9.5 -9.0 -8.5log (SFR/Mstar) (yr-1) (Primary)
-12.0
-11.5
-11.0
-10.5
-10.0
-9.5
-9.0
-8.5
log
(SFR
/Mst
ar)
(yr-1
) (S
econ
dary
)
S in S+S pairs (M>1010.7 Msun)
Matches in control sample
Figure 14. Correlation plot of log(SFR/M) of two components in the S+S pairsin Figure 13. Filled circles represent the pairs, and open squares represent theircounterparts in the control sample.
5.8. Contribution of KPAIR Galaxies to the Cosmic SFRDensity
In this subsection, we estimate the contribution of galaxiesin close major-merger pairs, as defined by the pair selectioncriteria in Section 2, to the total cosmic SFR density in the localuniverse. Assuming the contribution for E galaxies is negligible,
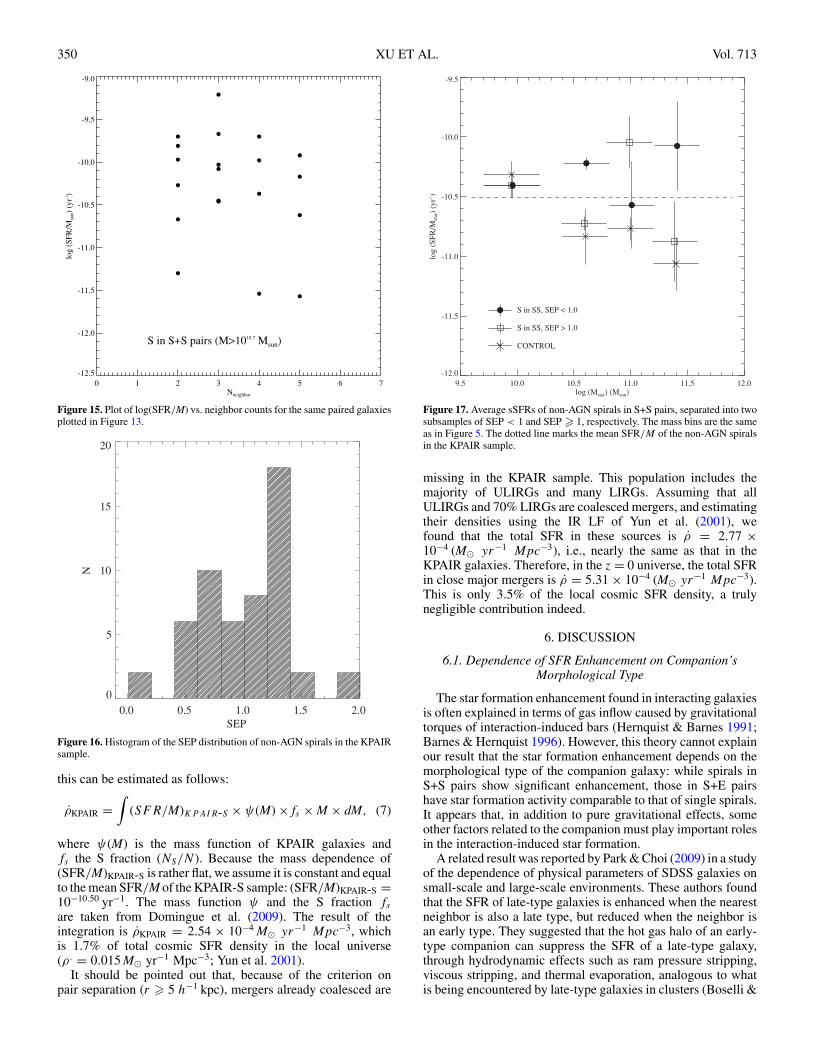
350 XU ET AL. Vol. 713
0 1 2 3 4 5 6 7Nneighbor
-12.5
-12.0
-11.5
-11.0
-10.5
-10.0
-9.5
-9.0lo
g (S
FR/M
star)
(yr-1
)
S in S+S pairs (M>1010.7 Msun)
Figure 15. Plot of log(SFR/M) vs. neighbor counts for the same paired galaxiesplotted in Figure 13.
0.0 0.5 1.0 1.5 2.0SEP
0
5
10
15
20
N
Figure 16. Histogram of the SEP distribution of non-AGN spirals in the KPAIRsample.
this can be estimated as follows:
ρKPAIR =∫
(SFR/M)KPAIR-S × ψ(M) × fs × M × dM, (7)
where ψ(M) is the mass function of KPAIR galaxies andfs the S fraction (NS/N ). Because the mass dependence of(SFR/M)KPAIR-S is rather flat, we assume it is constant and equalto the mean SFR/M of the KPAIR-S sample: (SFR/M)KPAIR-S =10−10.50 yr−1. The mass function ψ and the S fraction fs
are taken from Domingue et al. (2009). The result of theintegration is ρKPAIR = 2.54 × 10⁻⁴ M� yr−1 Mpc−3, whichis 1.7% of total cosmic SFR density in the local universe(ρ. = 0.015 M� yr−1 Mpc−3; Yun et al. 2001).
It should be pointed out that, because of the criterion onpair separation (r � 5 h−1 kpc), mergers already coalesced are
9.5 10.0 10.5 11.0 11.5 12.0log (Mstar) (Msun)
-12.0
-11.5
-11.0
-10.5
-10.0
-9.5
log
(SFR
/Mst
ar)
(yr-1
)
S in SS, SEP < 1.0
S in SS, SEP > 1.0
CONTROL
Figure 17. Average sSFRs of non-AGN spirals in S+S pairs, separated into twosubsamples of SEP < 1 and SEP � 1, respectively. The mass bins are the sameas in Figure 5. The dotted line marks the mean SFR/M of the non-AGN spiralsin the KPAIR sample.
missing in the KPAIR sample. This population includes themajority of ULIRGs and many LIRGs. Assuming that allULIRGs and 70% LIRGs are coalesced mergers, and estimatingtheir densities using the IR LF of Yun et al. (2001), wefound that the total SFR in these sources is ρ = 2.77 ×10⁻⁴ (M� yr−1 Mpc−3), i.e., nearly the same as that in theKPAIR galaxies. Therefore, in the z = 0 universe, the total SFRin close major mergers is ρ = 5.31 × 10⁻⁴ (M� yr−1 Mpc−3).This is only 3.5% of the local cosmic SFR density, a trulynegligible contribution indeed.
6. DISCUSSION
6.1. Dependence of SFR Enhancement on Companion’sMorphological Type
The star formation enhancement found in interacting galaxiesis often explained in terms of gas inflow caused by gravitationaltorques of interaction-induced bars (Hernquist & Barnes 1991;Barnes & Hernquist 1996). However, this theory cannot explainour result that the star formation enhancement depends on themorphological type of the companion galaxy: while spirals inS+S pairs show significant enhancement, those in S+E pairshave star formation activity comparable to that of single spirals.It appears that, in addition to pure gravitational effects, someother factors related to the companion must play important rolesin the interaction-induced star formation.
A related result was reported by Park & Choi (2009) in a studyof the dependence of physical parameters of SDSS galaxies onsmall-scale and large-scale environments. These authors foundthat the SFR of late-type galaxies is enhanced when the nearestneighbor is also a late type, but reduced when the neighbor isan early type. They suggested that the hot gas halo of an early-type companion can suppress the SFR of a late-type galaxy,through hydrodynamic effects such as ram pressure stripping,viscous stripping, and thermal evaporation, analogous to whatis being encountered by late-type galaxies in clusters (Boselli &
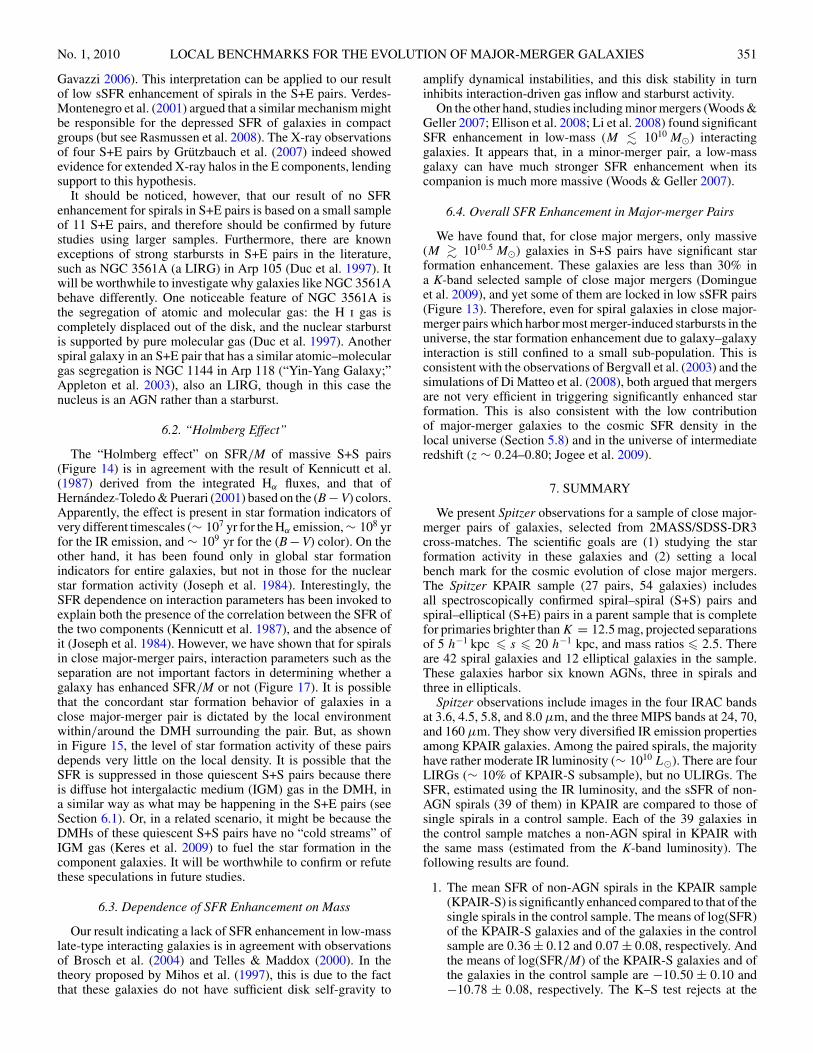
No. 1, 2010 LOCAL BENCHMARKS FOR THE EVOLUTION OF MAJOR-MERGER GALAXIES 351
Gavazzi 2006). This interpretation can be applied to our resultof low sSFR enhancement of spirals in the S+E pairs. Verdes-Montenegro et al. (2001) argued that a similar mechanism mightbe responsible for the depressed SFR of galaxies in compactgroups (but see Rasmussen et al. 2008). The X-ray observationsof four S+E pairs by Grutzbauch et al. (2007) indeed showedevidence for extended X-ray halos in the E components, lendingsupport to this hypothesis.
It should be noticed, however, that our result of no SFRenhancement for spirals in S+E pairs is based on a small sampleof 11 S+E pairs, and therefore should be confirmed by futurestudies using larger samples. Furthermore, there are knownexceptions of strong starbursts in S+E pairs in the literature,such as NGC 3561A (a LIRG) in Arp 105 (Duc et al. 1997). Itwill be worthwhile to investigate why galaxies like NGC 3561Abehave differently. One noticeable feature of NGC 3561A isthe segregation of atomic and molecular gas: the H i gas iscompletely displaced out of the disk, and the nuclear starburstis supported by pure molecular gas (Duc et al. 1997). Anotherspiral galaxy in an S+E pair that has a similar atomic–moleculargas segregation is NGC 1144 in Arp 118 (“Yin-Yang Galaxy;”Appleton et al. 2003), also an LIRG, though in this case thenucleus is an AGN rather than a starburst.
6.2. “Holmberg Effect”
The “Holmberg effect” on SFR/M of massive S+S pairs(Figure 14) is in agreement with the result of Kennicutt et al.(1987) derived from the integrated Hα fluxes, and that ofHernandez-Toledo & Puerari (2001) based on the (B − V) colors.Apparently, the effect is present in star formation indicators ofvery different timescales (∼ 107 yr for the Hα emission, ∼ 108 yrfor the IR emission, and ∼ 109 yr for the (B − V) color). On theother hand, it has been found only in global star formationindicators for entire galaxies, but not in those for the nuclearstar formation activity (Joseph et al. 1984). Interestingly, theSFR dependence on interaction parameters has been invoked toexplain both the presence of the correlation between the SFR ofthe two components (Kennicutt et al. 1987), and the absence ofit (Joseph et al. 1984). However, we have shown that for spiralsin close major-merger pairs, interaction parameters such as theseparation are not important factors in determining whether agalaxy has enhanced SFR/M or not (Figure 17). It is possiblethat the concordant star formation behavior of galaxies in aclose major-merger pair is dictated by the local environmentwithin/around the DMH surrounding the pair. But, as shownin Figure 15, the level of star formation activity of these pairsdepends very little on the local density. It is possible that theSFR is suppressed in those quiescent S+S pairs because thereis diffuse hot intergalactic medium (IGM) gas in the DMH, ina similar way as what may be happening in the S+E pairs (seeSection 6.1). Or, in a related scenario, it might be because theDMHs of these quiescent S+S pairs have no “cold streams” ofIGM gas (Keres et al. 2009) to fuel the star formation in thecomponent galaxies. It will be worthwhile to confirm or refutethese speculations in future studies.
6.3. Dependence of SFR Enhancement on Mass
Our result indicating a lack of SFR enhancement in low-masslate-type interacting galaxies is in agreement with observationsof Brosch et al. (2004) and Telles & Maddox (2000). In thetheory proposed by Mihos et al. (1997), this is due to the factthat these galaxies do not have sufficient disk self-gravity to
amplify dynamical instabilities, and this disk stability in turninhibits interaction-driven gas inflow and starburst activity.
On the other hand, studies including minor mergers (Woods &Geller 2007; Ellison et al. 2008; Li et al. 2008) found significantSFR enhancement in low-mass (M � 1010 M�) interactinggalaxies. It appears that, in a minor-merger pair, a low-massgalaxy can have much stronger SFR enhancement when itscompanion is much more massive (Woods & Geller 2007).
6.4. Overall SFR Enhancement in Major-merger Pairs
We have found that, for close major mergers, only massive(M � 1010.5 M�) galaxies in S+S pairs have significant starformation enhancement. These galaxies are less than 30% ina K-band selected sample of close major mergers (Domingueet al. 2009), and yet some of them are locked in low sSFR pairs(Figure 13). Therefore, even for spiral galaxies in close major-merger pairs which harbor most merger-induced starbursts in theuniverse, the star formation enhancement due to galaxy–galaxyinteraction is still confined to a small sub-population. This isconsistent with the observations of Bergvall et al. (2003) and thesimulations of Di Matteo et al. (2008), both argued that mergersare not very efficient in triggering significantly enhanced starformation. This is also consistent with the low contributionof major-merger galaxies to the cosmic SFR density in thelocal universe (Section 5.8) and in the universe of intermediateredshift (z ∼ 0.24–0.80; Jogee et al. 2009).
7. SUMMARY
We present Spitzer observations for a sample of close major-merger pairs of galaxies, selected from 2MASS/SDSS-DR3cross-matches. The scientific goals are (1) studying the starformation activity in these galaxies and (2) setting a localbench mark for the cosmic evolution of close major mergers.The Spitzer KPAIR sample (27 pairs, 54 galaxies) includesall spectroscopically confirmed spiral–spiral (S+S) pairs andspiral–elliptical (S+E) pairs in a parent sample that is completefor primaries brighter than K = 12.5 mag, projected separationsof 5 h−1 kpc � s � 20 h−1 kpc, and mass ratios � 2.5. Thereare 42 spiral galaxies and 12 elliptical galaxies in the sample.These galaxies harbor six known AGNs, three in spirals andthree in ellipticals.
Spitzer observations include images in the four IRAC bandsat 3.6, 4.5, 5.8, and 8.0 μm, and the three MIPS bands at 24, 70,and 160 μm. They show very diversified IR emission propertiesamong KPAIR galaxies. Among the paired spirals, the majorityhave rather moderate IR luminosity (∼ 1010 L�). There are fourLIRGs (∼ 10% of KPAIR-S subsample), but no ULIRGs. TheSFR, estimated using the IR luminosity, and the sSFR of non-AGN spirals (39 of them) in KPAIR are compared to those ofsingle spirals in a control sample. Each of the 39 galaxies inthe control sample matches a non-AGN spiral in KPAIR withthe same mass (estimated from the K-band luminosity). Thefollowing results are found.
1. The mean SFR of non-AGN spirals in the KPAIR sample(KPAIR-S) is significantly enhanced compared to that of thesingle spirals in the control sample. The means of log(SFR)of the KPAIR-S galaxies and of the galaxies in the controlsample are 0.36 ± 0.12 and 0.07 ± 0.08, respectively. Andthe means of log(SFR/M) of the KPAIR-S galaxies and ofthe galaxies in the control sample are −10.50 ± 0.10 and−10.78 ± 0.08, respectively. The K–S test rejects at the
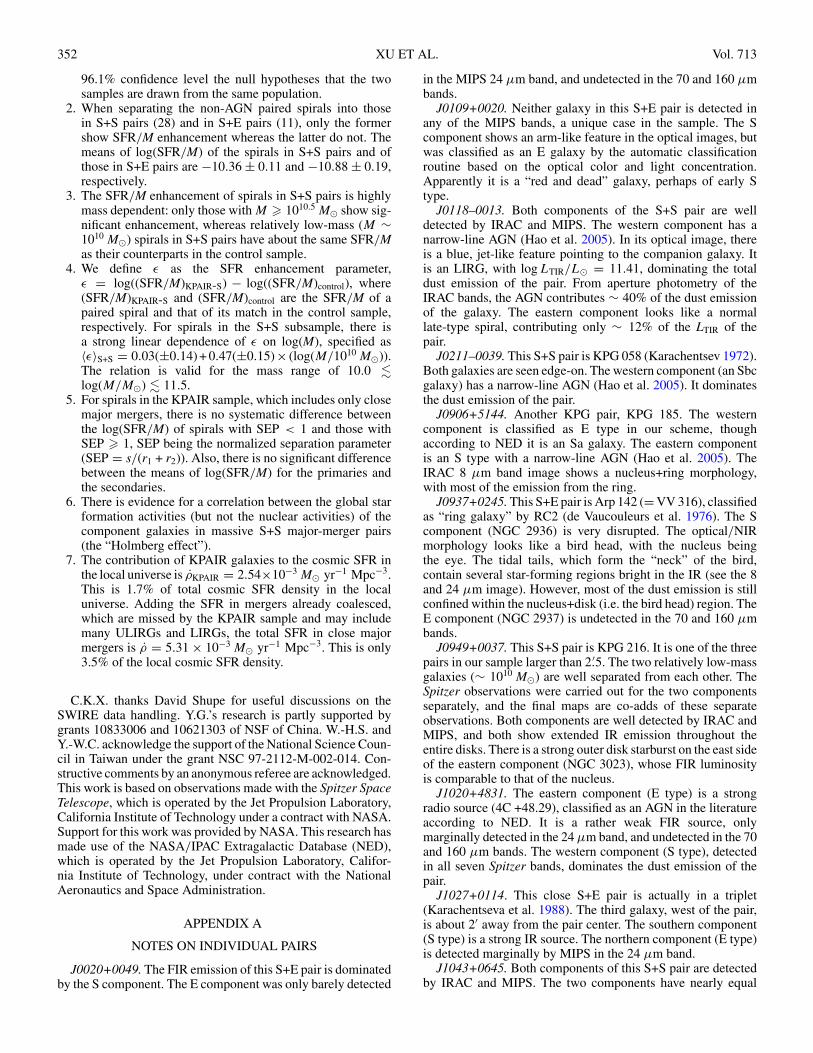
352 XU ET AL. Vol. 713
96.1% confidence level the null hypotheses that the twosamples are drawn from the same population.
2. When separating the non-AGN paired spirals into thosein S+S pairs (28) and in S+E pairs (11), only the formershow SFR/M enhancement whereas the latter do not. Themeans of log(SFR/M) of the spirals in S+S pairs and ofthose in S+E pairs are −10.36 ± 0.11 and −10.88 ± 0.19,respectively.
3. The SFR/M enhancement of spirals in S+S pairs is highlymass dependent: only those with M � 1010.5 M� show sig-nificant enhancement, whereas relatively low-mass (M ∼1010 M�) spirals in S+S pairs have about the same SFR/Mas their counterparts in the control sample.
4. We define ε as the SFR enhancement parameter,ε = log((SFR/M)KPAIR-S) − log((SFR/M)control), where(SFR/M)KPAIR-S and (SFR/M)control are the SFR/M of apaired spiral and that of its match in the control sample,respectively. For spirals in the S+S subsample, there isa strong linear dependence of ε on log(M), specified as〈ε〉S+S = 0.03(±0.14) + 0.47(±0.15)× (log(M/1010 M�)).The relation is valid for the mass range of 10.0 �log(M/M�) � 11.5.
5. For spirals in the KPAIR sample, which includes only closemajor mergers, there is no systematic difference betweenthe log(SFR/M) of spirals with SEP < 1 and those withSEP � 1, SEP being the normalized separation parameter(SEP = s/(r1 + r2)). Also, there is no significant differencebetween the means of log(SFR/M) for the primaries andthe secondaries.
6. There is evidence for a correlation between the global starformation activities (but not the nuclear activities) of thecomponent galaxies in massive S+S major-merger pairs(the “Holmberg effect”).
7. The contribution of KPAIR galaxies to the cosmic SFR inthe local universe is ρKPAIR = 2.54×10⁻³ M� yr−1 Mpc−3.This is 1.7% of total cosmic SFR density in the localuniverse. Adding the SFR in mergers already coalesced,which are missed by the KPAIR sample and may includemany ULIRGs and LIRGs, the total SFR in close majormergers is ρ = 5.31 × 10⁻³ M� yr−1 Mpc−3. This is only3.5% of the local cosmic SFR density.
C.K.X. thanks David Shupe for useful discussions on theSWIRE data handling. Y.G.’s research is partly supported bygrants 10833006 and 10621303 of NSF of China. W.-H.S. andY.-W.C. acknowledge the support of the National Science Coun-cil in Taiwan under the grant NSC 97-2112-M-002-014. Con-structive comments by an anonymous referee are acknowledged.This work is based on observations made with the Spitzer SpaceTelescope, which is operated by the Jet Propulsion Laboratory,California Institute of Technology under a contract with NASA.Support for this work was provided by NASA. This research hasmade use of the NASA/IPAC Extragalactic Database (NED),which is operated by the Jet Propulsion Laboratory, Califor-nia Institute of Technology, under contract with the NationalAeronautics and Space Administration.
APPENDIX A
NOTES ON INDIVIDUAL PAIRS
J0020+0049. The FIR emission of this S+E pair is dominatedby the S component. The E component was only barely detected
in the MIPS 24 μm band, and undetected in the 70 and 160 μmbands.
J0109+0020. Neither galaxy in this S+E pair is detected inany of the MIPS bands, a unique case in the sample. The Scomponent shows an arm-like feature in the optical images, butwas classified as an E galaxy by the automatic classificationroutine based on the optical color and light concentration.Apparently it is a “red and dead” galaxy, perhaps of early Stype.
J0118–0013. Both components of the S+S pair are welldetected by IRAC and MIPS. The western component has anarrow-line AGN (Hao et al. 2005). In its optical image, thereis a blue, jet-like feature pointing to the companion galaxy. Itis an LIRG, with log LTIR/L� = 11.41, dominating the totaldust emission of the pair. From aperture photometry of theIRAC bands, the AGN contributes ∼ 40% of the dust emissionof the galaxy. The eastern component looks like a normallate-type spiral, contributing only ∼ 12% of the LTIR of thepair.
J0211–0039. This S+S pair is KPG 058 (Karachentsev 1972).Both galaxies are seen edge-on. The western component (an Sbcgalaxy) has a narrow-line AGN (Hao et al. 2005). It dominatesthe dust emission of the pair.
J0906+5144. Another KPG pair, KPG 185. The westerncomponent is classified as E type in our scheme, thoughaccording to NED it is an Sa galaxy. The eastern componentis an S type with a narrow-line AGN (Hao et al. 2005). TheIRAC 8 μm band image shows a nucleus+ring morphology,with most of the emission from the ring.
J0937+0245. This S+E pair is Arp 142 (= VV 316), classifiedas “ring galaxy” by RC2 (de Vaucouleurs et al. 1976). The Scomponent (NGC 2936) is very disrupted. The optical/NIRmorphology looks like a bird head, with the nucleus beingthe eye. The tidal tails, which form the “neck” of the bird,contain several star-forming regions bright in the IR (see the 8and 24 μm image). However, most of the dust emission is stillconfined within the nucleus+disk (i.e. the bird head) region. TheE component (NGC 2937) is undetected in the 70 and 160 μmbands.
J0949+0037. This S+S pair is KPG 216. It is one of the threepairs in our sample larger than 2.′5. The two relatively low-massgalaxies (∼ 1010 M�) are well separated from each other. TheSpitzer observations were carried out for the two componentsseparately, and the final maps are co-adds of these separateobservations. Both components are well detected by IRAC andMIPS, and both show extended IR emission throughout theentire disks. There is a strong outer disk starburst on the east sideof the eastern component (NGC 3023), whose FIR luminosityis comparable to that of the nucleus.
J1020+4831. The eastern component (E type) is a strongradio source (4C +48.29), classified as an AGN in the literatureaccording to NED. It is a rather weak FIR source, onlymarginally detected in the 24 μm band, and undetected in the 70and 160 μm bands. The western component (S type), detectedin all seven Spitzer bands, dominates the dust emission of thepair.
J1027+0114. This close S+E pair is actually in a triplet(Karachentseva et al. 1988). The third galaxy, west of the pair,is about 2′ away from the pair center. The southern component(S type) is a strong IR source. The northern component (E type)is detected marginally by MIPS in the 24 μm band.
J1043+0645. Both components of this S+S pair are detectedby IRAC and MIPS. The two components have nearly equal
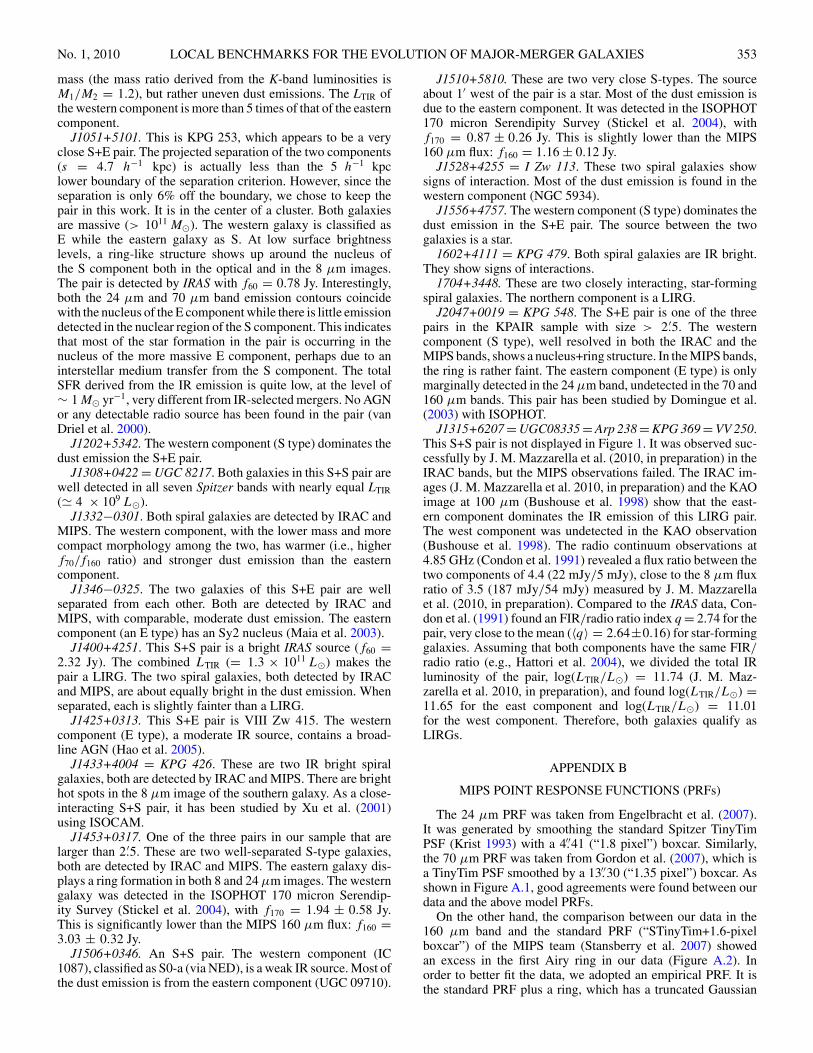
No. 1, 2010 LOCAL BENCHMARKS FOR THE EVOLUTION OF MAJOR-MERGER GALAXIES 353
mass (the mass ratio derived from the K-band luminosities isM1/M2 = 1.2), but rather uneven dust emissions. The LTIR ofthe western component is more than 5 times of that of the easterncomponent.
J1051+5101. This is KPG 253, which appears to be a veryclose S+E pair. The projected separation of the two components(s = 4.7 h−1 kpc) is actually less than the 5 h−1 kpclower boundary of the separation criterion. However, since theseparation is only 6% off the boundary, we chose to keep thepair in this work. It is in the center of a cluster. Both galaxiesare massive (> 1011 M�). The western galaxy is classified asE while the eastern galaxy as S. At low surface brightnesslevels, a ring-like structure shows up around the nucleus ofthe S component both in the optical and in the 8 μm images.The pair is detected by IRAS with f60 = 0.78 Jy. Interestingly,both the 24 μm and 70 μm band emission contours coincidewith the nucleus of the E component while there is little emissiondetected in the nuclear region of the S component. This indicatesthat most of the star formation in the pair is occurring in thenucleus of the more massive E component, perhaps due to aninterstellar medium transfer from the S component. The totalSFR derived from the IR emission is quite low, at the level of∼ 1 M� yr−1, very different from IR-selected mergers. No AGNor any detectable radio source has been found in the pair (vanDriel et al. 2000).
J1202+5342. The western component (S type) dominates thedust emission the S+E pair.
J1308+0422 = UGC 8217. Both galaxies in this S+S pair arewell detected in all seven Spitzer bands with nearly equal LTIR( 4 × 10⁹ L�).
J1332−0301. Both spiral galaxies are detected by IRAC andMIPS. The western component, with the lower mass and morecompact morphology among the two, has warmer (i.e., higherf70/f160 ratio) and stronger dust emission than the easterncomponent.
J1346−0325. The two galaxies of this S+E pair are wellseparated from each other. Both are detected by IRAC andMIPS, with comparable, moderate dust emission. The easterncomponent (an E type) has an Sy2 nucleus (Maia et al. 2003).
J1400+4251. This S+S pair is a bright IRAS source (f60 =2.32 Jy). The combined LTIR (= 1.3 × 10¹¹ L�) makes thepair a LIRG. The two spiral galaxies, both detected by IRACand MIPS, are about equally bright in the dust emission. Whenseparated, each is slightly fainter than a LIRG.
J1425+0313. This S+E pair is VIII Zw 415. The westerncomponent (E type), a moderate IR source, contains a broad-line AGN (Hao et al. 2005).
J1433+4004 = KPG 426. These are two IR bright spiralgalaxies, both are detected by IRAC and MIPS. There are brighthot spots in the 8 μm image of the southern galaxy. As a close-interacting S+S pair, it has been studied by Xu et al. (2001)using ISOCAM.
J1453+0317. One of the three pairs in our sample that arelarger than 2.′5. These are two well-separated S-type galaxies,both are detected by IRAC and MIPS. The eastern galaxy dis-plays a ring formation in both 8 and 24 μm images. The westerngalaxy was detected in the ISOPHOT 170 micron Serendip-ity Survey (Stickel et al. 2004), with f170 = 1.94 ± 0.58 Jy.This is significantly lower than the MIPS 160 μm flux: f160 =3.03 ± 0.32 Jy.
J1506+0346. An S+S pair. The western component (IC1087), classified as S0-a (via NED), is a weak IR source. Most ofthe dust emission is from the eastern component (UGC 09710).
J1510+5810. These are two very close S-types. The sourceabout 1′ west of the pair is a star. Most of the dust emission isdue to the eastern component. It was detected in the ISOPHOT170 micron Serendipity Survey (Stickel et al. 2004), withf170 = 0.87 ± 0.26 Jy. This is slightly lower than the MIPS160 μm flux: f160 = 1.16 ± 0.12 Jy.
J1528+4255 = I Zw 113. These two spiral galaxies showsigns of interaction. Most of the dust emission is found in thewestern component (NGC 5934).
J1556+4757. The western component (S type) dominates thedust emission in the S+E pair. The source between the twogalaxies is a star.
1602+4111 = KPG 479. Both spiral galaxies are IR bright.They show signs of interactions.
1704+3448. These are two closely interacting, star-formingspiral galaxies. The northern component is a LIRG.
J2047+0019 = KPG 548. The S+E pair is one of the threepairs in the KPAIR sample with size > 2.′5. The westerncomponent (S type), well resolved in both the IRAC and theMIPS bands, shows a nucleus+ring structure. In the MIPS bands,the ring is rather faint. The eastern component (E type) is onlymarginally detected in the 24 μm band, undetected in the 70 and160 μm bands. This pair has been studied by Domingue et al.(2003) with ISOPHOT.
J1315+6207 = UGC08335 = Arp 238 = KPG 369 = VV 250.This S+S pair is not displayed in Figure 1. It was observed suc-cessfully by J. M. Mazzarella et al. (2010, in preparation) in theIRAC bands, but the MIPS observations failed. The IRAC im-ages (J. M. Mazzarella et al. 2010, in preparation) and the KAOimage at 100 μm (Bushouse et al. 1998) show that the east-ern component dominates the IR emission of this LIRG pair.The west component was undetected in the KAO observation(Bushouse et al. 1998). The radio continuum observations at4.85 GHz (Condon et al. 1991) revealed a flux ratio between thetwo components of 4.4 (22 mJy/5 mJy), close to the 8 μm fluxratio of 3.5 (187 mJy/54 mJy) measured by J. M. Mazzarellaet al. (2010, in preparation). Compared to the IRAS data, Con-don et al. (1991) found an FIR/radio ratio index q = 2.74 for thepair, very close to the mean (〈q〉 = 2.64±0.16) for star-forminggalaxies. Assuming that both components have the same FIR/radio ratio (e.g., Hattori et al. 2004), we divided the total IRluminosity of the pair, log(LTIR/L�) = 11.74 (J. M. Maz-zarella et al. 2010, in preparation), and found log(LTIR/L�) =11.65 for the east component and log(LTIR/L�) = 11.01for the west component. Therefore, both galaxies qualify asLIRGs.
APPENDIX B
MIPS POINT RESPONSE FUNCTIONS (PRFs)
The 24 μm PRF was taken from Engelbracht et al. (2007).It was generated by smoothing the standard Spitzer TinyTimPSF (Krist 1993) with a 4.′′41 (“1.8 pixel”) boxcar. Similarly,the 70 μm PRF was taken from Gordon et al. (2007), which isa TinyTim PSF smoothed by a 13.′′30 (“1.35 pixel”) boxcar. Asshown in Figure A.1, good agreements were found between ourdata and the above model PRFs.
On the other hand, the comparison between our data in the160 μm band and the standard PRF (“STinyTim+1.6-pixelboxcar”) of the MIPS team (Stansberry et al. 2007) showedan excess in the first Airy ring in our data (Figure A.2). Inorder to better fit the data, we adopted an empirical PRF. It isthe standard PRF plus a ring, which has a truncated Gaussian
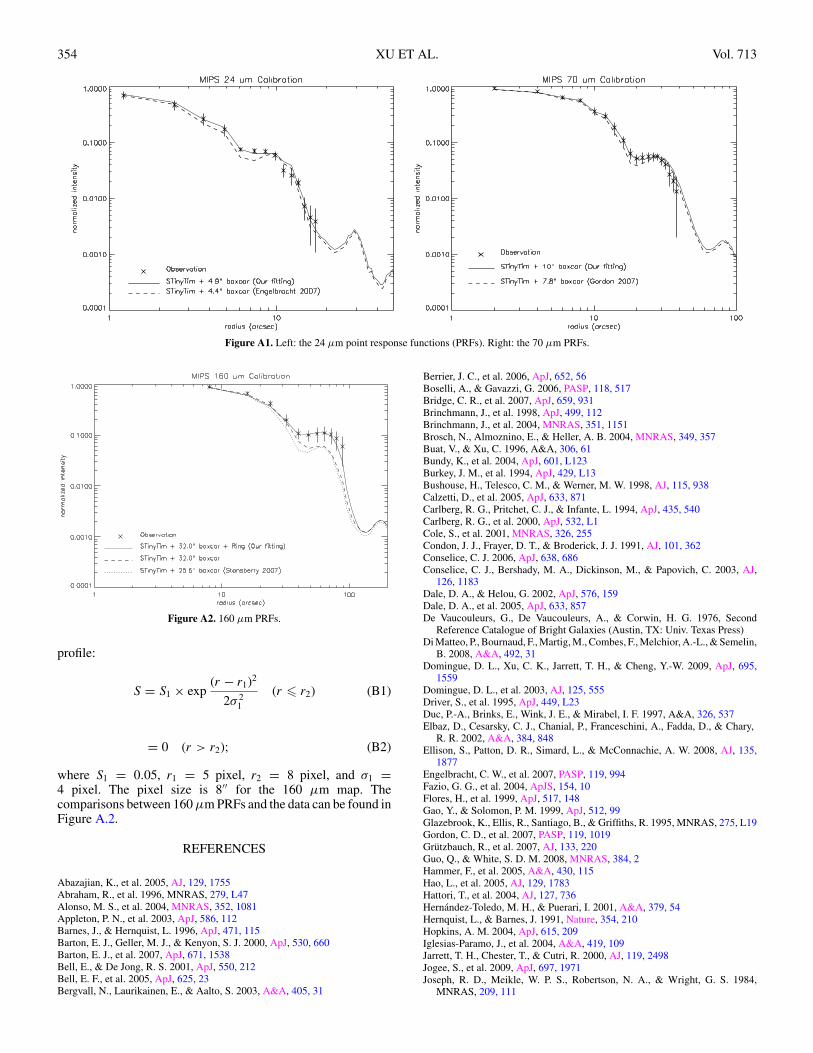
354 XU ET AL. Vol. 713
Figure A1. Left: the 24 μm point response functions (PRFs). Right: the 70 μm PRFs.
Figure A2. 160 μm PRFs.
profile:
S = S1 × exp(r − r1)2
2σ 21
(r � r2) (B1)
= 0 (r > r2); (B2)
where S1 = 0.05, r1 = 5 pixel, r2 = 8 pixel, and σ1 =4 pixel. The pixel size is 8′′ for the 160 μm map. Thecomparisons between 160 μm PRFs and the data can be found inFigure A.2.
REFERENCES
Abazajian, K., et al. 2005, AJ, 129, 1755Abraham, R., et al. 1996, MNRAS, 279, L47Alonso, M. S., et al. 2004, MNRAS, 352, 1081Appleton, P. N., et al. 2003, ApJ, 586, 112Barnes, J., & Hernquist, L. 1996, ApJ, 471, 115Barton, E. J., Geller, M. J., & Kenyon, S. J. 2000, ApJ, 530, 660Barton, E. J., et al. 2007, ApJ, 671, 1538Bell, E., & De Jong, R. S. 2001, ApJ, 550, 212Bell, E. F., et al. 2005, ApJ, 625, 23Bergvall, N., Laurikainen, E., & Aalto, S. 2003, A&A, 405, 31
Berrier, J. C., et al. 2006, ApJ, 652, 56Boselli, A., & Gavazzi, G. 2006, PASP, 118, 517Bridge, C. R., et al. 2007, ApJ, 659, 931Brinchmann, J., et al. 1998, ApJ, 499, 112Brinchmann, J., et al. 2004, MNRAS, 351, 1151Brosch, N., Almoznino, E., & Heller, A. B. 2004, MNRAS, 349, 357Buat, V., & Xu, C. 1996, A&A, 306, 61Bundy, K., et al. 2004, ApJ, 601, L123Burkey, J. M., et al. 1994, ApJ, 429, L13Bushouse, H., Telesco, C. M., & Werner, M. W. 1998, AJ, 115, 938Calzetti, D., et al. 2005, ApJ, 633, 871Carlberg, R. G., Pritchet, C. J., & Infante, L. 1994, ApJ, 435, 540Carlberg, R. G., et al. 2000, ApJ, 532, L1Cole, S., et al. 2001, MNRAS, 326, 255Condon, J. J., Frayer, D. T., & Broderick, J. J. 1991, AJ, 101, 362Conselice, C. J. 2006, ApJ, 638, 686Conselice, C. J., Bershady, M. A., Dickinson, M., & Papovich, C. 2003, AJ,
126, 1183Dale, D. A., & Helou, G. 2002, ApJ, 576, 159Dale, D. A., et al. 2005, ApJ, 633, 857De Vaucouleurs, G., De Vaucouleurs, A., & Corwin, H. G. 1976, Second
Reference Catalogue of Bright Galaxies (Austin, TX: Univ. Texas Press)Di Matteo, P., Bournaud, F., Martig, M., Combes, F., Melchior, A.-L., & Semelin,
B. 2008, A&A, 492, 31Domingue, D. L., Xu, C. K., Jarrett, T. H., & Cheng, Y.-W. 2009, ApJ, 695,
1559Domingue, D. L., et al. 2003, AJ, 125, 555Driver, S., et al. 1995, ApJ, 449, L23Duc, P.-A., Brinks, E., Wink, J. E., & Mirabel, I. F. 1997, A&A, 326, 537Elbaz, D., Cesarsky, C. J., Chanial, P., Franceschini, A., Fadda, D., & Chary,
R. R. 2002, A&A, 384, 848Ellison, S., Patton, D. R., Simard, L., & McConnachie, A. W. 2008, AJ, 135,
1877Engelbracht, C. W., et al. 2007, PASP, 119, 994Fazio, G. G., et al. 2004, ApJS, 154, 10Flores, H., et al. 1999, ApJ, 517, 148Gao, Y., & Solomon, P. M. 1999, ApJ, 512, 99Glazebrook, K., Ellis, R., Santiago, B., & Griffiths, R. 1995, MNRAS, 275, L19Gordon, C. D., et al. 2007, PASP, 119, 1019Grutzbauch, R., et al. 2007, AJ, 133, 220Guo, Q., & White, S. D. M. 2008, MNRAS, 384, 2Hammer, F., et al. 2005, A&A, 430, 115Hao, L., et al. 2005, AJ, 129, 1783Hattori, T., et al. 2004, AJ, 127, 736Hernandez-Toledo, M. H., & Puerari, I. 2001, A&A, 379, 54Hernquist, L., & Barnes, J. 1991, Nature, 354, 210Hopkins, A. M. 2004, ApJ, 615, 209Iglesias-Paramo, J., et al. 2004, A&A, 419, 109Jarrett, T. H., Chester, T., & Cutri, R. 2000, AJ, 119, 2498Jogee, S., et al. 2009, ApJ, 697, 1971Joseph, R. D., Meikle, W. P. S., Robertson, N. A., & Wright, G. S. 1984,
MNRAS, 209, 111
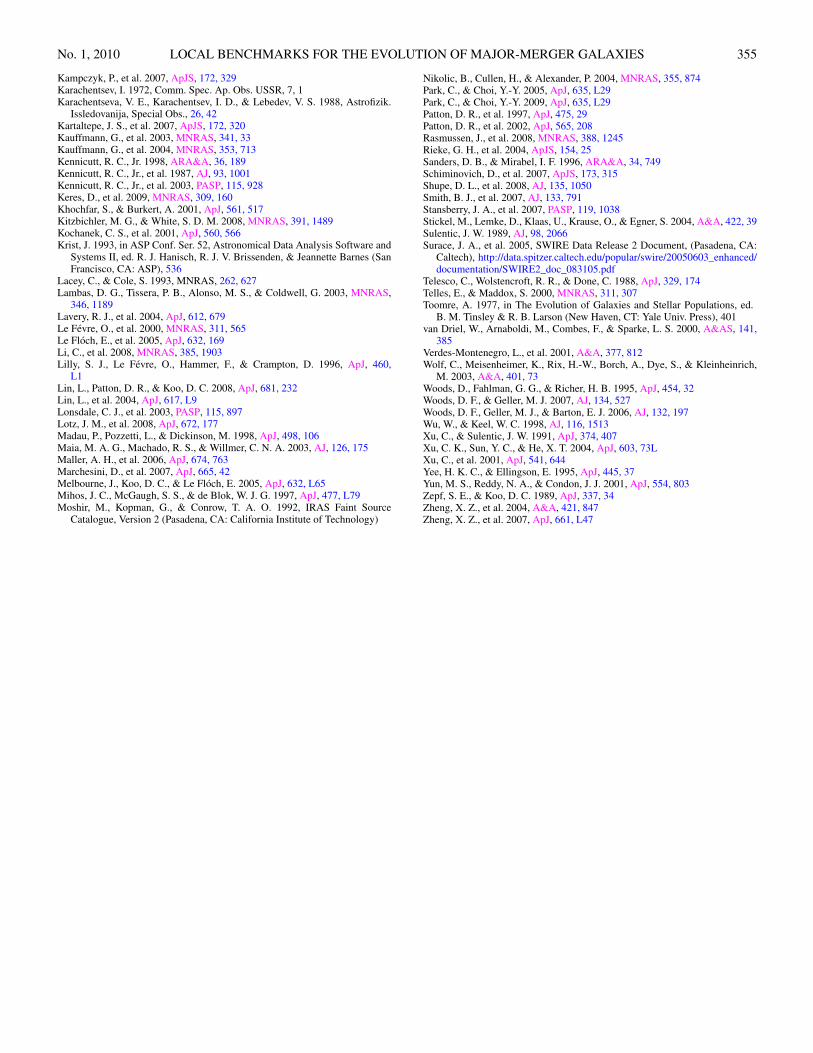
No. 1, 2010 LOCAL BENCHMARKS FOR THE EVOLUTION OF MAJOR-MERGER GALAXIES 355
Kampczyk, P., et al. 2007, ApJS, 172, 329Karachentsev, I. 1972, Comm. Spec. Ap. Obs. USSR, 7, 1Karachentseva, V. E., Karachentsev, I. D., & Lebedev, V. S. 1988, Astrofizik.
Issledovanija, Special Obs., 26, 42Kartaltepe, J. S., et al. 2007, ApJS, 172, 320Kauffmann, G., et al. 2003, MNRAS, 341, 33Kauffmann, G., et al. 2004, MNRAS, 353, 713Kennicutt, R. C., Jr. 1998, ARA&A, 36, 189Kennicutt, R. C., Jr., et al. 1987, AJ, 93, 1001Kennicutt, R. C., Jr., et al. 2003, PASP, 115, 928Keres, D., et al. 2009, MNRAS, 309, 160Khochfar, S., & Burkert, A. 2001, ApJ, 561, 517Kitzbichler, M. G., & White, S. D. M. 2008, MNRAS, 391, 1489Kochanek, C. S., et al. 2001, ApJ, 560, 566Krist, J. 1993, in ASP Conf. Ser. 52, Astronomical Data Analysis Software and
Systems II, ed. R. J. Hanisch, R. J. V. Brissenden, & Jeannette Barnes (SanFrancisco, CA: ASP), 536
Lacey, C., & Cole, S. 1993, MNRAS, 262, 627Lambas, D. G., Tissera, P. B., Alonso, M. S., & Coldwell, G. 2003, MNRAS,
346, 1189Lavery, R. J., et al. 2004, ApJ, 612, 679Le Fevre, O., et al. 2000, MNRAS, 311, 565Le Floch, E., et al. 2005, ApJ, 632, 169Li, C., et al. 2008, MNRAS, 385, 1903Lilly, S. J., Le Fevre, O., Hammer, F., & Crampton, D. 1996, ApJ, 460,
L1Lin, L., Patton, D. R., & Koo, D. C. 2008, ApJ, 681, 232Lin, L., et al. 2004, ApJ, 617, L9Lonsdale, C. J., et al. 2003, PASP, 115, 897Lotz, J. M., et al. 2008, ApJ, 672, 177Madau, P., Pozzetti, L., & Dickinson, M. 1998, ApJ, 498, 106Maia, M. A. G., Machado, R. S., & Willmer, C. N. A. 2003, AJ, 126, 175Maller, A. H., et al. 2006, ApJ, 674, 763Marchesini, D., et al. 2007, ApJ, 665, 42Melbourne, J., Koo, D. C., & Le Floch, E. 2005, ApJ, 632, L65Mihos, J. C., McGaugh, S. S., & de Blok, W. J. G. 1997, ApJ, 477, L79Moshir, M., Kopman, G., & Conrow, T. A. O. 1992, IRAS Faint Source
Catalogue, Version 2 (Pasadena, CA: California Institute of Technology)
Nikolic, B., Cullen, H., & Alexander, P. 2004, MNRAS, 355, 874Park, C., & Choi, Y.-Y. 2005, ApJ, 635, L29Park, C., & Choi, Y.-Y. 2009, ApJ, 635, L29Patton, D. R., et al. 1997, ApJ, 475, 29Patton, D. R., et al. 2002, ApJ, 565, 208Rasmussen, J., et al. 2008, MNRAS, 388, 1245Rieke, G. H., et al. 2004, ApJS, 154, 25Sanders, D. B., & Mirabel, I. F. 1996, ARA&A, 34, 749Schiminovich, D., et al. 2007, ApJS, 173, 315Shupe, D. L., et al. 2008, AJ, 135, 1050Smith, B. J., et al. 2007, AJ, 133, 791Stansberry, J. A., et al. 2007, PASP, 119, 1038Stickel, M., Lemke, D., Klaas, U., Krause, O., & Egner, S. 2004, A&A, 422, 39Sulentic, J. W. 1989, AJ, 98, 2066Surace, J. A., et al. 2005, SWIRE Data Release 2 Document, (Pasadena, CA:
Caltech), http://data.spitzer.caltech.edu/popular/swire/20050603_enhanced/documentation/SWIRE2_doc_083105.pdf
Telesco, C., Wolstencroft, R. R., & Done, C. 1988, ApJ, 329, 174Telles, E., & Maddox, S. 2000, MNRAS, 311, 307Toomre, A. 1977, in The Evolution of Galaxies and Stellar Populations, ed.
B. M. Tinsley & R. B. Larson (New Haven, CT: Yale Univ. Press), 401van Driel, W., Arnaboldi, M., Combes, F., & Sparke, L. S. 2000, A&AS, 141,
385Verdes-Montenegro, L., et al. 2001, A&A, 377, 812Wolf, C., Meisenheimer, K., Rix, H.-W., Borch, A., Dye, S., & Kleinheinrich,
M. 2003, A&A, 401, 73Woods, D., Fahlman, G. G., & Richer, H. B. 1995, ApJ, 454, 32Woods, D. F., & Geller, M. J. 2007, AJ, 134, 527Woods, D. F., Geller, M. J., & Barton, E. J. 2006, AJ, 132, 197Wu, W., & Keel, W. C. 1998, AJ, 116, 1513Xu, C., & Sulentic, J. W. 1991, ApJ, 374, 407Xu, C. K., Sun, Y. C., & He, X. T. 2004, ApJ, 603, 73LXu, C., et al. 2001, ApJ, 541, 644Yee, H. K. C., & Ellingson, E. 1995, ApJ, 445, 37Yun, M. S., Reddy, N. A., & Condon, J. J. 2001, ApJ, 554, 803Zepf, S. E., & Koo, D. C. 1989, ApJ, 337, 34Zheng, X. Z., et al. 2004, A&A, 421, 847Zheng, X. Z., et al. 2007, ApJ, 661, L47

![Benchmarks - June, 2013 | Benchmarks Onlineit.unt.edu/sites/default/files/benchmarks-06-2013.pdf · Benchmarks - June, 2013 | Benchmarks Online 4/26/16, 8:52:25 AM] Skip to content](https://img.pdfslide.us/doc/110x75/5f9d6dd4a6e586755376b37d/benchmarks-june-2013-benchmarks-benchmarks-june-2013-benchmarks-online.jpg)


![Benchmarks - May, 2011 | Benchmarks Onlineit.unt.edu/sites/default/files/benchmarks-05-2011.pdf · Benchmarks - May, 2011 | Benchmarks Online 4/28/16, 9:13:42 AM] By Patrick McLoud,](https://img.pdfslide.us/doc/110x75/5fe545814aa19825752e7bae/benchmarks-may-2011-benchmarks-benchmarks-may-2011-benchmarks-online-42816.jpg)


![arXiv:2005.12873v3 [cs.DC] 7 Jun 2020processing benchmarks [12]. They studied about distributed and parallel benchmarks for graph analyzers, graph database benchmarks, benchmarks for](https://img.pdfslide.us/doc/110x75/60c4e778df2cd14e603091d9/arxiv200512873v3-csdc-7-jun-2020-processing-benchmarks-12-they-studied-about.jpg)