Embed Size (px)
Citation preview
Journal of Alloys and Compounds 560 (2013) 67–71
Contents lists available at SciVerse ScienceDirect
Journal of Alloys and Compounds
journal homepage: www.elsevier .com/locate / ja lcom
Local atomic structure of lanthanide complexes in cubic ordered mesoporous silica
T.S. Martins a, L.C. Cides da Silva b, J.R. Matos b, M.C.A. Fantini c,⇑a Laboratório de Materiais Híbridos (LMH), Instituto de Ciências Ambientais, Químicas e Farmacêuticas, Universidade Federal de São Paulo, Rua São Nicolau, 210, 2� andar,09913-030 Diadema, SP, Brazilb Instituto de Química, Universidade de São Paulo, Av. Prof. Lineu Prestes 748, 05508-900 São Paulo, Brazilc Instituto de Física, Universidade de São Paulo, P.O. Box 66318, 05314-970 São Paulo, Brazil
a r t i c l e i n f o
Article history:Received 28 November 2012Received in revised form 14 January 2013Accepted 16 January 2013Available online 9 February 2013
Keywords:Mesoporous silicaLanthanide complexesEXAFS
0925-8388/$ - see front matter � 2013 Elsevier B.V. Ahttp://dx.doi.org/10.1016/j.jallcom.2013.01.084
⇑ Corresponding author. Tel.: +55 11 30916882; faxE-mail address: [email protected] (M.C.A. Fantini)
a b s t r a c t
The aim of this work was to analyze the local atomic environment around lanthanide atoms anchoredinside silica matrices by means of X-ray absorption spectroscopy (XAS). Europium and cerium complexeswere incorporated in cubic FDU-1 and SBA-16 ordered mesoporous silica (OMS) by a post-synthesismethod. Small angle X-ray scattering (SAXS) showed the presence of an ordered arrangement of poresfor all investigated samples. A much higher Eu incorporation for the dibenzoylmethane complex isattained compared to picrate complex with a weight percent similar to the nominal concentration ofEu, as determined by Rutherford back-scattering spectrometry (RBS). The XAS results showed that thelocal atomic arrangement around Eu is composed by a first neighbor sphere similar to the complexand different second neighbors compared to pristine material, indicating an interaction of the complexeswith the silica walls, in such an extent that it does not interfere on the complexes luminescent properties.The first and second spheres around the incorporated Ce are analogous to the pure cerium picrate com-plex, showing that the complex is anchored on the porous surface. The solvent does not interfere on thelocal atomic structure, but on the incorporation capacity.
� 2013 Elsevier B.V. All rights reserved.
1. Introduction
Lanthanide (Ln) materials, due to their Lewis acidity and spec-troscopic, magnetic and redox properties, have extensive use as,for example, catalysts in the treatment of car gaseous emissionsand cracking of oil; as luminescent material in the manufactureof lasers, in cathodic ray tubes for television, ‘‘matches’’ in themanufacture of fluorescent light bulbs, etc. and contrast agents [1].
The use of lanthanide compounds to check the properties andfunctions of biochemical systems, and also to determine biologi-cally active substances, has been increased [1–5]. The lanthanidesare used mainly as spectroscopic sounding leads in the study ofbio-molecules functions [3–5]. For example, they can be used asbiological tracers to follow the path of drugs in men and animals[3,6]; as labels in immunology essays (fluoro-immunoassays) [6–8] and also, as agent of contrast in non-invasive diagnosis ofpathologies in tissues by Nuclear Magnetic Resonance (NMR)images [1,3–5].
As we can verify the lanthanides have innumerable applica-tions, but the majority of them demands sufficiently stable com-pounds, as it is in the case of contrast agents. However, many ofthese applications are limited, because many Ln compounds are
ll rights reserved.
: +55 11 30916749..
not much stable. The incorporation of them in mesoporous silica,silica gel or glasses can improve their stability [9,10].
The highly ordered mesoporous silica (OMS) have been de-served much scientific attention because they have great potential-ities for various applications, including host for compounds. Thesematerials are hydro-thermal and thermally very stable and possesslarge pore diameter (2 nm < D < 30 nm), that can be tailored for adiversity of nano-technological applications, such as sensors, elec-trodes, separation processes, selective adsorption, and mainly inthe area of catalysis. Mesoporous silica is prepared by means of dif-ferent methods, which depend on the structure template, produc-ing a variety of pore sizes; moreover, the surface can be modifiedby a number of silylants agents and by incorporation of metals in-side the structure [11–13].
Studies show that the incorporation of lanthanide ions in silica,beyond improving their stability, makes them to generate highluminescence, by protecting them from non-irradiative processes[14–17]. For example, the emission of lanthanide ions in watersolution is highly decreased due to the loses of vibration energyof the excited Ln (III) state to water molecules, but for compoundsincorporated in silica this effect does not occur [17]. Thus, it is ofgreat importance to modify to local environment of Ln (III) ionsin order to improve their absorption characteristics and to reducenon-irradiative mechanisms of the excited state [15–18].
In our previous work we report on the post-synthesis incorpo-ration of Eu luminescent complexes on only one type of cubic
68 T.S. Martins et al. / Journal of Alloys and Compounds 560 (2013) 67–71
OMS, FDU-1, and we analyzed the incorporation capacity, thermalstability and luminescence efficiency of these new materials [14].In this work we demonstrated the incorporation of the Eu com-plexes inside the silica matrix by analyzing the SAXS results, sincethe decrease of the peak intensities is an indication for complexesinclusion within the silica mesopores. The present work aims tocomplete the characterization of lanthanide complexes (Eu(dbm)3-
�TPPO, where dbm = dibenzoylmethane and TPPO = triphenylphos-phine oxide and Ln(pic)3�2Leu�5H2O, where Ln = Ce and Eu,pic = picrate and Leu = L-leucine) embedded in three cubic OMSby looking at the local atomic structure around the lanthanides.X-ray absorption spectroscopy (XAS) at Ce and Eu L3 edges, is apowerful experimental tool to analyze the insertion of the lantha-nide compounds in silica and its atomic coordination [19–22].Therefore, in this research we investigated the local atomic struc-ture of lanthanide compounds, more specifically, Ce and Eu, incor-porated in cubic mesoporous silica (FDU-1 and SBA-16) by meansof XAS in order to check the interaction of these luminescent com-plexes with the silica host.
2. Experimental
2.1. Synthesis
The triblock copolymers used in this work as templates for syntheses of OMS(FDU-1 and SBA-16) are (i) B50-6600, poly(ethylene oxide)–poly(butylene oxide)–poly(ethylene oxide), EO39BO47EO39 from Dow Chemicals, (ii) Vorasurf 504, EO38-
BO46EO38 from Dow Chemicals and (iii) Pluronic F-127, EO106BO70EO106 from Basf.The synthesis of FDU-1 was carried out using the same synthesis gel composi-
tion (expressed as molar ratio) as reported by Yu et al. [23–25]: 1 TEOS:0.00735 tri-block copolymer:6 HCl:155 H2O, where TEOS stands for tetraethyl orthosilicatefrom Aldrich Chemical Company.
The detailed procedure of FDU-1 synthesis using B50-6600 is described in Ref.[14]. The synthesis of FDU-1 using Vorasurf 504 followed exactly the same synthe-sis process used with B50-6600 [25–28], except for the copolymer dissolution inethanol and heat treatment at 100 �C, which was performed in a conventional ovenduring a period of 12 h. The sample was calcined under nitrogen atmosphere, whichwas afterwards switched to air, at 540 �C.
In a typical synthesis using Pluronic F-127 [29,30], a new SBA-16 sample wasprepared for this investigation, followed a synthesis process in which 4 g of F-127was dissolved in 30 g of deionized water and 120 g of HCl (2 mol L�1) at 25 �C. Achosen amount of TEOS (�9 g) is added to the solution. The mixture is maintainedat 25 �C for �22 h with vigorous stirring, followed by heating at 100 �C during 24 h.The solid products were filtered and washed with deionized water repeatedly. Afterdrying at room-temperature overnight, the products were calcined in ambientatmosphere from room temperature up to 540 �C with a heating rate of 2 �C min�1.
The complexes (Eu(dbm)3�TPPO and Ln(pic)3�2Leu�5H2O (Ln = Ce and Eu)) prep-aration incorporated in FDU-1 and SBA-16 type of OMS are described in reference14. In the incorporation processes, Eu(dbm)3�TPPO and Ln(pic)3�2Leu�5H2O com-plexes were incorporated into silica according to the following: a molar ratio of7.4% Eu(dbm)3�TPPO and 7.8% Ln(pic)3�2Leu�5H2O complexes (1% of Ln3+ ion) to92.6% and 92.2%, respectively, of OMS (FDU-1 and SBA-16) was used. Lanthanidecomplexes, Eu(dbm)3�TPPO and Ln(pic)3�2Leu�5H2O were dissolved in N,N-dimeth-ylformamide (DMF) and acetone, respectively, and were added to the silica sus-pended in chloroform (CHCl3) or toluene (C7H8 or C6H5CH3). The mixture wasstirred at room temperature for 48 h and then the product was filtered, washedwith chloroform or toluene and dried under vacuum over anhydrous calcium chlo-ride. The samples are denoted by letters and as follows: lanthanide compound (Eu-DbmTppo, EuPicLeu and CePicLeu) – OMS type – C or T (chloroform or toluenesolvent).
Table 1 shows the sample description and the atomic concentration obtainedfrom Rutherford back-scattering spectrometry (RBS).
2.2. Characterization
Rutherford back-scattering spectrometry (RBS) measurements were made witha He+ beam with an energy E of 2.2 MeV, charge Q = 20 lC, current I = 30 nA anddetection angle of 170�. RBS data were analyzed by the SIMRA routine [31] andthe atomic densities (atoms cm�2) were obtained.
Small angle X-ray scattering (SAXS) measurements were carried out with arotating anode X-ray generator or with synchrotron radiation, regarding only theavailability of the equipments. With conventional X-ray source the power was setat 10 kW. The wavelength of the copper Ka radiation was k = 0.15418 nm. An imageplate detector was utilized to record the scattered intensity as a function of thescattering vector q = (4psinh)/k, h being half the scattering angle, during 2 h. Line
focus geometry was used and the system was collimated by slits. A vacuum pathbetween the sample and the detector was utilized. The sample to detector distancewas chosen in order to record the scattered intensity for q values ranging from0.1 nm�1 to 3.5 nm�1. Samples were placed inside a quartz tube, 1.5 mm in diame-ter. The scattering of the sample’s holder was subtracted from the total measuredintensities. All data were corrected for absorption effects. SAXS measurements withsynchrotron radiation were performed at the Brazilian Synchrotron Light Labora-tory (LNLS), Campinas, SP, Brazil, using the D11A-SAXS beamline [30]. The whitephoton beam was extracted from the ring through a high-vacuum path. After pass-ing through a thin beryllium window, the beam was monochromatized and hori-zontally focused by a cylindrically bent and asymmetrically cut (111) siliconsingle crystal. The selected wavelength was 0.1608 nm. The focus was located atthe detection plane. The scattered intensities were collected by a one-dimensionposition sensitive detector, at a distance of the sample holder such that the scatter-ing vector was selected as 0.1 nm�1 < q < 3.5 nm�1. An ionization detector moni-tored the intensity of the incident beam. The data were corrected by detectorhomogeneity, incident beam intensity, sample absorption and blank subtraction(sample holder with two mica windows). A straight line background was removedfrom each diffraction peak of all SAXS data.
Adsorption isotherms were measured with a Micromeritics ASAP 2010 volu-metric adsorption analyzer using nitrogen of 99.998% purity. Specific surface areawas evaluated using the BET method [31]. The total pore volume was estimatedfrom the amount adsorbed at the relative pressure of 0.99. Pore size distribution(PSD) was calculated using the BJH algorithm [32] with the relation between capil-lary condensation pressure and pore diameter established by Kruk et al. [33].
X-ray absorption near edge (XANES) and extended X-ray absorption fine struc-ture (EXAFS) spectra were measured at the D04B-XAFS1 beamline [34] of the Bra-zilian Synchrotron Light Laboratory, LNLS, (Campinas – SP, Brazil) in transmissionmode using Si (111) monochromator. The nominal photon flux of the beamline is3 � 109 photons/(s mrad 100 mA) @ 6 keV. The energy range was from 5650 to6160 eV for Ce L3 edge and 6900–7610 eV for Eu L3 edge; the energy was calibratedwith vanadium and iron foils, respectively. The powder samples were mixed withboron nitride (BN) and pressed into pellets in amounts adjusted to obtain a totalabsorption above the edge of 1.5. The measurements were carried out at room tem-perature using energy steps from 0.2 to 2 eV, depending on the energy range(XANES and EXAFS) and E/DE = 5000–10,000. The integration time varied from 1 sto 12 s, at different energy ranges. EXAFS data analysis was performed using theWINXAS code [35]. Both pre and post-edge were subtracted from raw data. Forthe pre-edge region, a linear fit of the absorption signal was subtracted from theexperimental data and, a fifth-order polynomial was used for the post-edge re-moval. The first shell was analyzed for samples and references. The selected Fouriertransform (FT) window for Ce L3 edge was 2.24–8.36 Å�1 and, the first coordinationshell was analyzed from 0.77 to 2.45 Å in R-space. For Eu L3 edge the FT windowwas 1.6–10 Å�1 and, the first coordination shell was analyzed from 1.1 to 2.6 Å inR-space. A k3-weighted oscillation was used to calculate the Fourier transform.The coordination numbers (N) were set free or fixed, equal to those of referencecompounds. These two type of fitting analysis allow to analyze the variation inthe Debye–Waller factor (r), which is correlated with N. Bond length (R), Debye–Waller factor (r) and inner potential shift (DEo) were used as free parameters inthe fitting procedure.
3. Results and discussion
The experimental data allow analyzing how the complex load-ing and local atomic structure depend on four different synthesisparameters: (i) cubic OMS structure, (ii) complex composition,(iii) solvent type and (iv) Ln atom.
Therefore, the results presented below will compare these fourvariable parameters on the material properties.
3.1. RBS: atomic concentration
Table 1 depicts the RBS data. The incorporation of Eu is higherfor DbmTppo complexes in chloroform (samples A and C), reachingthe nominal composition in both analyzed structures FDU-1 andSBA-16. The encapsulation efficiency is very low for the picratecomplex and also in toluene, probably because there are not anyphysical bonds between the silica matrix and this complex or sol-vent. But, some Cl� ions remain in the material after the wholepreparation process is completed. The incorporation of the com-plexes based on PicLeu in chloroform (samples D and F) is verylow, but higher for Ce compared to Eu (samples E and G), probablydue to the higher solubility of Ce complex in acetone, also checkedin this work, promoting a better interaction with silanol groups. By
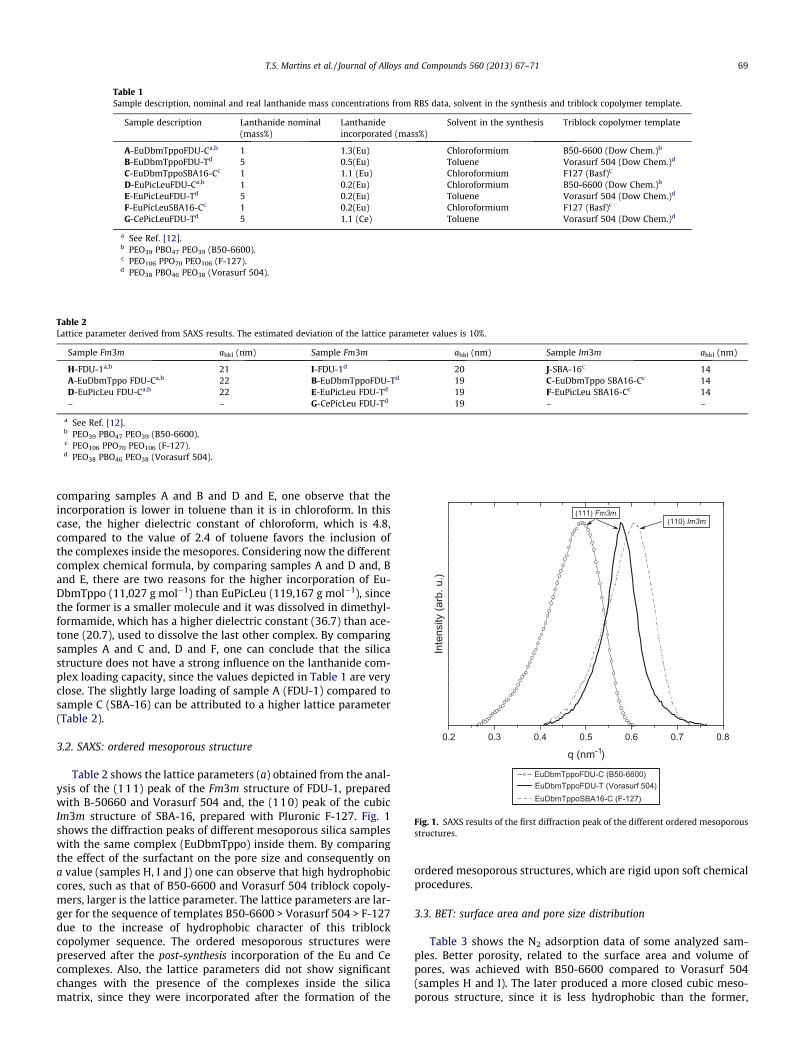
Table 1Sample description, nominal and real lanthanide mass concentrations from RBS data, solvent in the synthesis and triblock copolymer template.
Sample description Lanthanide nominal(mass%)
Lanthanideincorporated (mass%)
Solvent in the synthesis Triblock copolymer template
A-EuDbmTppoFDU-Ca,b 1 1.3(Eu) Chloroformium B50-6600 (Dow Chem.)b
B-EuDbmTppoFDU-Td 5 0.5(Eu) Toluene Vorasurf 504 (Dow Chem.)d
C-EuDbmTppoSBA16-Cc 1 1.1 (Eu) Chloroformium F127 (Basf)c
D-EuPicLeuFDU-Ca,b 1 0.2(Eu) Chloroformium B50-6600 (Dow Chem.)b
E-EuPicLeuFDU-Td 5 0.2(Eu) Toluene Vorasurf 504 (Dow Chem.)d
F-EuPicLeuSBA16-Cc 1 0.2(Eu) Chloroformium F127 (Basf)c
G-CePicLeuFDU-Td 5 1.1 (Ce) Toluene Vorasurf 504 (Dow Chem.)d
a See Ref. [12].b PEO39 PBO47 PEO39 (B50-6600).c PEO106 PPO70 PEO106 (F-127).d PEO38 PBO46 PEO38 (Vorasurf 504).
Table 2Lattice parameter derived from SAXS results. The estimated deviation of the lattice parameter values is 10%.
Sample Fm3m ahkl (nm) Sample Fm3m ahkl (nm) Sample Im3m ahkl (nm)
H-FDU-1a,b 21 I-FDU-1d 20 J-SBA-16c 14A-EuDbmTppo FDU-Ca,b 22 B-EuDbmTppoFDU-Td 19 C-EuDbmTppo SBA16-Cc 14D-EuPicLeu FDU-Ca,b 22 E-EuPicLeu FDU-Td 19 F-EuPicLeu SBA16-Cc 14– – G-CePicLeu FDU-Td 19 – –
a See Ref. [12].b PEO39 PBO47 PEO39 (B50-6600).c PEO106 PPO70 PEO106 (F-127).d PEO38 PBO46 PEO38 (Vorasurf 504).
0.2 0.3 0.4 0.5 0.6 0.7 0.8
(110) Im3m (111) Fm3m
Inte
nsity
(arb
. u.)
EuDbmTppoFDU-C (B50-6600) EuDbmTppoFDU-T (Vorasurf 504) EuDbmTppoSBA16-C (F-127)
Fig. 1. SAXS results of the first diffraction peak of the different ordered mesoporousstructures.
T.S. Martins et al. / Journal of Alloys and Compounds 560 (2013) 67–71 69
comparing samples A and B and D and E, one observe that theincorporation is lower in toluene than it is in chloroform. In thiscase, the higher dielectric constant of chloroform, which is 4.8,compared to the value of 2.4 of toluene favors the inclusion ofthe complexes inside the mesopores. Considering now the differentcomplex chemical formula, by comparing samples A and D and, Band E, there are two reasons for the higher incorporation of Eu-DbmTppo (11,027 g mol�1) than EuPicLeu (119,167 g mol�1), sincethe former is a smaller molecule and it was dissolved in dimethyl-formamide, which has a higher dielectric constant (36.7) than ace-tone (20.7), used to dissolve the last other complex. By comparingsamples A and C and, D and F, one can conclude that the silicastructure does not have a strong influence on the lanthanide com-plex loading capacity, since the values depicted in Table 1 are veryclose. The slightly large loading of sample A (FDU-1) compared tosample C (SBA-16) can be attributed to a higher lattice parameter(Table 2).
3.2. SAXS: ordered mesoporous structure
Table 2 shows the lattice parameters (a) obtained from the anal-ysis of the (111) peak of the Fm3m structure of FDU-1, preparedwith B-50660 and Vorasurf 504 and, the (110) peak of the cubicIm3m structure of SBA-16, prepared with Pluronic F-127. Fig. 1shows the diffraction peaks of different mesoporous silica sampleswith the same complex (EuDbmTppo) inside them. By comparingthe effect of the surfactant on the pore size and consequently ona value (samples H, I and J) one can observe that high hydrophobiccores, such as that of B50-6600 and Vorasurf 504 triblock copoly-mers, larger is the lattice parameter. The lattice parameters are lar-ger for the sequence of templates B50-6600 > Vorasurf 504 > F-127due to the increase of hydrophobic character of this triblockcopolymer sequence. The ordered mesoporous structures werepreserved after the post-synthesis incorporation of the Eu and Cecomplexes. Also, the lattice parameters did not show significantchanges with the presence of the complexes inside the silicamatrix, since they were incorporated after the formation of the
ordered mesoporous structures, which are rigid upon soft chemicalprocedures.
3.3. BET: surface area and pore size distribution
Table 3 shows the N2 adsorption data of some analyzed sam-ples. Better porosity, related to the surface area and volume ofpores, was achieved with B50-6600 compared to Vorasurf 504(samples H and I). The later produced a more closed cubic meso-porous structure, since it is less hydrophobic than the former,
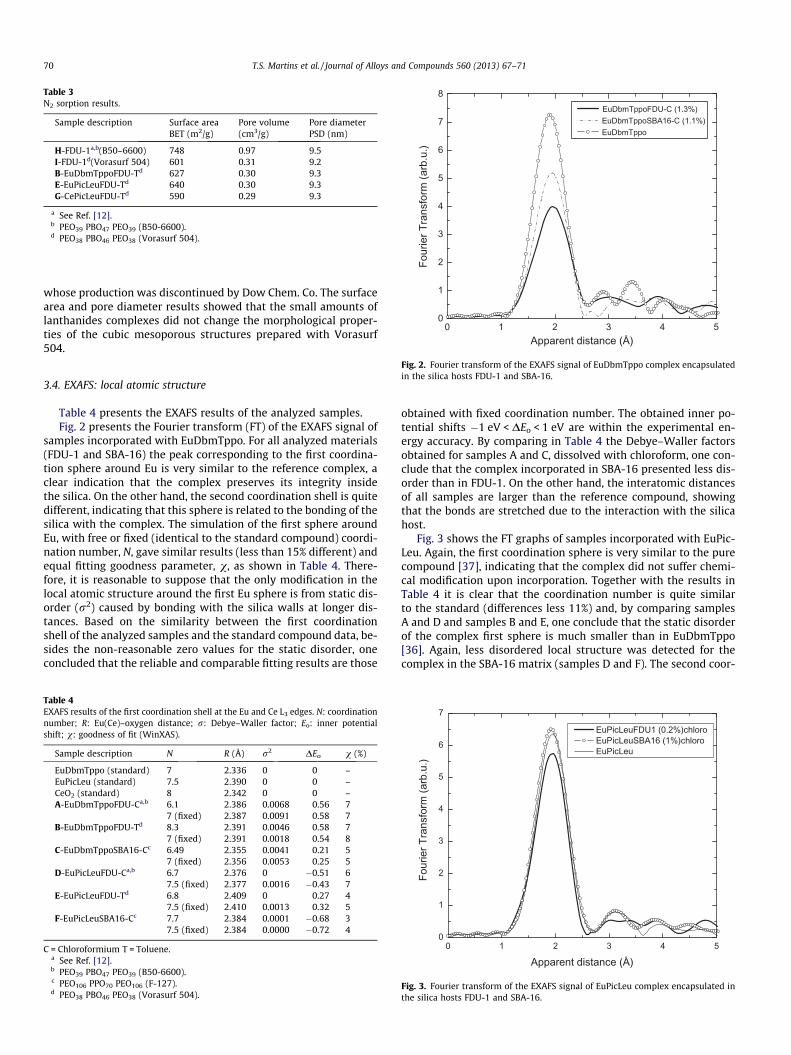
Table 3N2 sorption results.
Sample description Surface areaBET (m2/g)
Pore volume(cm3/g)
Pore diameterPSD (nm)
H-FDU-1a,b(B50–6600) 748 0.97 9.5I-FDU-1d(Vorasurf 504) 601 0.31 9.2B-EuDbmTppoFDU-Td 627 0.30 9.3E-EuPicLeuFDU-Td 640 0.30 9.3G-CePicLeuFDU-Td 590 0.29 9.3
a See Ref. [12].b PEO39 PBO47 PEO39 (B50-6600).d PEO38 PBO46 PEO38 (Vorasurf 504).
0 1 2 3 4 50
1
2
3
4
5
6
7
8
Four
ier T
rans
form
(arb
.u.)
Apparent distance (Å)
EuDbmTppoFDU-C (1.3%) EuDbmTppoSBA16-C (1.1%) EuDbmTppo
70 T.S. Martins et al. / Journal of Alloys and Compounds 560 (2013) 67–71
whose production was discontinued by Dow Chem. Co. The surfacearea and pore diameter results showed that the small amounts oflanthanides complexes did not change the morphological proper-ties of the cubic mesoporous structures prepared with Vorasurf504.
Fig. 2. Fourier transform of the EXAFS signal of EuDbmTppo complex encapsulatedin the silica hosts FDU-1 and SBA-16.
3.4. EXAFS: local atomic structure
Table 4 presents the EXAFS results of the analyzed samples.Fig. 2 presents the Fourier transform (FT) of the EXAFS signal of
samples incorporated with EuDbmTppo. For all analyzed materials(FDU-1 and SBA-16) the peak corresponding to the first coordina-tion sphere around Eu is very similar to the reference complex, aclear indication that the complex preserves its integrity insidethe silica. On the other hand, the second coordination shell is quitedifferent, indicating that this sphere is related to the bonding of thesilica with the complex. The simulation of the first sphere aroundEu, with free or fixed (identical to the standard compound) coordi-nation number, N, gave similar results (less than 15% different) andequal fitting goodness parameter, v, as shown in Table 4. There-fore, it is reasonable to suppose that the only modification in thelocal atomic structure around the first Eu sphere is from static dis-order (r2) caused by bonding with the silica walls at longer dis-tances. Based on the similarity between the first coordinationshell of the analyzed samples and the standard compound data, be-sides the non-reasonable zero values for the static disorder, oneconcluded that the reliable and comparable fitting results are those
Table 4EXAFS results of the first coordination shell at the Eu and Ce L3 edges. N: coordinationnumber; R: Eu(Ce)–oxygen distance; r: Debye–Waller factor; Eo: inner potentialshift; v: goodness of fit (WinXAS).
Sample description N R (Å) r2 DEo v (%)
EuDbmTppo (standard) 7 2.336 0 0 –EuPicLeu (standard) 7.5 2.390 0 0 –CeO2 (standard) 8 2.342 0 0 –A-EuDbmTppoFDU-Ca,b 6.1 2.386 0.0068 0.56 7
7 (fixed) 2.387 0.0091 0.58 7B-EuDbmTppoFDU-Td 8.3 2.391 0.0046 0.58 7
7 (fixed) 2.391 0.0018 0.54 8C-EuDbmTppoSBA16-Cc 6.49 2.355 0.0041 0.21 5
7 (fixed) 2.356 0.0053 0.25 5D-EuPicLeuFDU-Ca,b 6.7 2.376 0 �0.51 6
7.5 (fixed) 2.377 0.0016 �0.43 7E-EuPicLeuFDU-Td 6.8 2.409 0 0.27 4
7.5 (fixed) 2.410 0.0013 0.32 5F-EuPicLeuSBA16-Cc 7.7 2.384 0.0001 �0.68 3
7.5 (fixed) 2.384 0.0000 �0.72 4
C = Chloroformium T = Toluene.a See Ref. [12].b PEO39 PBO47 PEO39 (B50-6600).c PEO106 PPO70 PEO106 (F-127).d PEO38 PBO46 PEO38 (Vorasurf 504).
obtained with fixed coordination number. The obtained inner po-tential shifts �1 eV < DEo < 1 eV are within the experimental en-ergy accuracy. By comparing in Table 4 the Debye–Waller factorsobtained for samples A and C, dissolved with chloroform, one con-clude that the complex incorporated in SBA-16 presented less dis-order than in FDU-1. On the other hand, the interatomic distancesof all samples are larger than the reference compound, showingthat the bonds are stretched due to the interaction with the silicahost.
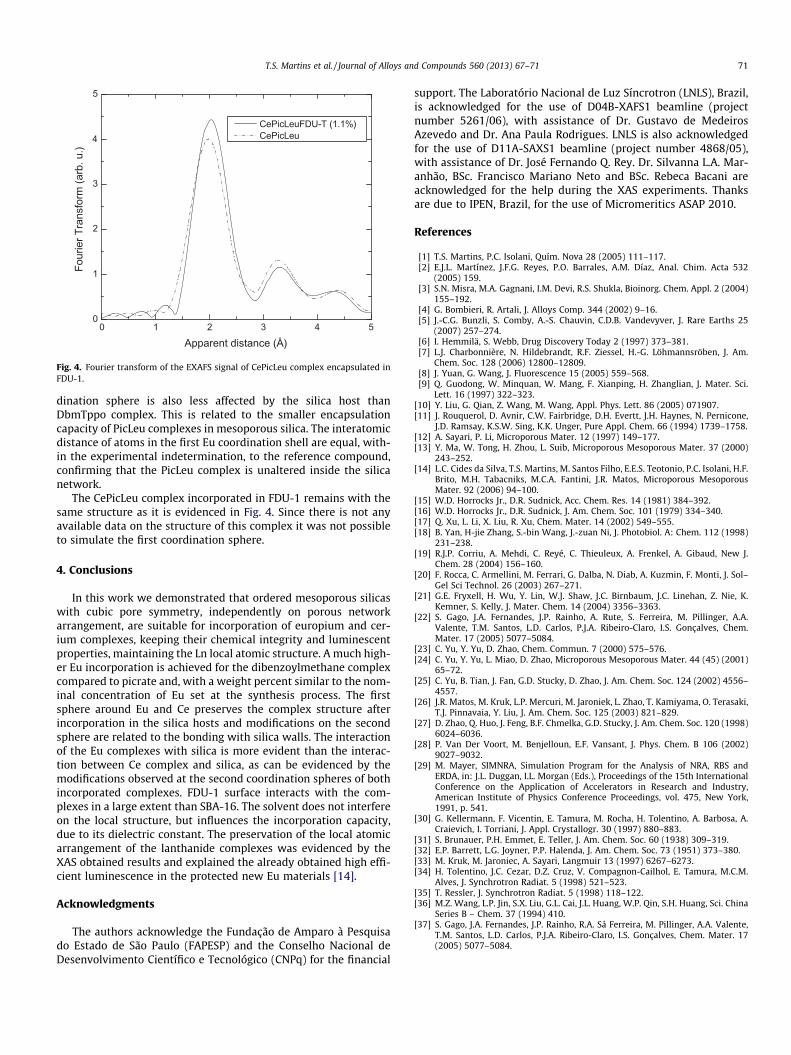
Fig. 3 shows the FT graphs of samples incorporated with EuPic-Leu. Again, the first coordination sphere is very similar to the purecompound [37], indicating that the complex did not suffer chemi-cal modification upon incorporation. Together with the results inTable 4 it is clear that the coordination number is quite similarto the standard (differences less 11%) and, by comparing samplesA and D and samples B and E, one conclude that the static disorderof the complex first sphere is much smaller than in EuDbmTppo[36]. Again, less disordered local structure was detected for thecomplex in the SBA-16 matrix (samples D and F). The second coor-
0 1 2 3 4 50
1
2
3
4
5
6
7
Four
ier T
rans
form
(arb
.u.)
Apparent distance (Å)
EuPicLeuFDU1 (0.2%)chloro EuPicLeuSBA16 (1%)chloro EuPicLeu
Fig. 3. Fourier transform of the EXAFS signal of EuPicLeu complex encapsulated inthe silica hosts FDU-1 and SBA-16.
0 1 2 3 4 50
1
2
3
4
5
Four
ier T
rans
form
(arb
. u.)
Apparent distance (Å)
CePicLeuFDU-T (1.1%) CePicLeu
Fig. 4. Fourier transform of the EXAFS signal of CePicLeu complex encapsulated inFDU-1.
T.S. Martins et al. / Journal of Alloys and Compounds 560 (2013) 67–71 71
dination sphere is also less affected by the silica host thanDbmTppo complex. This is related to the smaller encapsulationcapacity of PicLeu complexes in mesoporous silica. The interatomicdistance of atoms in the first Eu coordination shell are equal, with-in the experimental indetermination, to the reference compound,confirming that the PicLeu complex is unaltered inside the silicanetwork.
The CePicLeu complex incorporated in FDU-1 remains with thesame structure as it is evidenced in Fig. 4. Since there is not anyavailable data on the structure of this complex it was not possibleto simulate the first coordination sphere.
4. Conclusions
In this work we demonstrated that ordered mesoporous silicaswith cubic pore symmetry, independently on porous networkarrangement, are suitable for incorporation of europium and cer-ium complexes, keeping their chemical integrity and luminescentproperties, maintaining the Ln local atomic structure. A much high-er Eu incorporation is achieved for the dibenzoylmethane complexcompared to picrate and, with a weight percent similar to the nom-inal concentration of Eu set at the synthesis process. The firstsphere around Eu and Ce preserves the complex structure afterincorporation in the silica hosts and modifications on the secondsphere are related to the bonding with silica walls. The interactionof the Eu complexes with silica is more evident than the interac-tion between Ce complex and silica, as can be evidenced by themodifications observed at the second coordination spheres of bothincorporated complexes. FDU-1 surface interacts with the com-plexes in a large extent than SBA-16. The solvent does not interfereon the local structure, but influences the incorporation capacity,due to its dielectric constant. The preservation of the local atomicarrangement of the lanthanide complexes was evidenced by theXAS obtained results and explained the already obtained high effi-cient luminescence in the protected new Eu materials [14].
Acknowledgments
The authors acknowledge the Fundação de Amparo à Pesquisado Estado de São Paulo (FAPESP) and the Conselho Nacional deDesenvolvimento Científico e Tecnológico (CNPq) for the financial
support. The Laboratório Nacional de Luz Síncrotron (LNLS), Brazil,is acknowledged for the use of D04B-XAFS1 beamline (projectnumber 5261/06), with assistance of Dr. Gustavo de MedeirosAzevedo and Dr. Ana Paula Rodrigues. LNLS is also acknowledgedfor the use of D11A-SAXS1 beamline (project number 4868/05),with assistance of Dr. José Fernando Q. Rey. Dr. Silvanna L.A. Mar-anhão, BSc. Francisco Mariano Neto and BSc. Rebeca Bacani areacknowledged for the help during the XAS experiments. Thanksare due to IPEN, Brazil, for the use of Micromeritics ASAP 2010.
References
[1] T.S. Martins, P.C. Isolani, Quím. Nova 28 (2005) 111–117.[2] E.J.L. Martínez, J.F.G. Reyes, P.O. Barrales, A.M. Díaz, Anal. Chim. Acta 532
(2005) 159.[3] S.N. Misra, M.A. Gagnani, I.M. Devi, R.S. Shukla, Bioinorg. Chem. Appl. 2 (2004)
155–192.[4] G. Bombieri, R. Artali, J. Alloys Comp. 344 (2002) 9–16.[5] J.-C.G. Bunzli, S. Comby, A.-S. Chauvin, C.D.B. Vandevyver, J. Rare Earths 25
(2007) 257–274.[6] I. Hemmilä, S. Webb, Drug Discovery Today 2 (1997) 373–381.[7] L.J. Charbonnière, N. Hildebrandt, R.F. Ziessel, H.-G. Löhmannsröben, J. Am.
Chem. Soc. 128 (2006) 12800–12809.[8] J. Yuan, G. Wang, J. Fluorescence 15 (2005) 559–568.[9] Q. Guodong, W. Minquan, W. Mang, F. Xianping, H. Zhanglian, J. Mater. Sci.
Lett. 16 (1997) 322–323.[10] Y. Liu, G. Qian, Z. Wang, M. Wang, Appl. Phys. Lett. 86 (2005) 071907.[11] J. Rouquerol, D. Avnir, C.W. Fairbridge, D.H. Evertt, J.H. Haynes, N. Pernicone,
J.D. Ramsay, K.S.W. Sing, K.K. Unger, Pure Appl. Chem. 66 (1994) 1739–1758.[12] A. Sayari, P. Li, Microporous Mater. 12 (1997) 149–177.[13] Y. Ma, W. Tong, H. Zhou, L. Suib, Microporous Mesoporous Mater. 37 (2000)
243–252.[14] L.C. Cides da Silva, T.S. Martins, M. Santos Filho, E.E.S. Teotonio, P.C. Isolani, H.F.
Brito, M.H. Tabacniks, M.C.A. Fantini, J.R. Matos, Microporous MesoporousMater. 92 (2006) 94–100.
[15] W.D. Horrocks Jr., D.R. Sudnick, Acc. Chem. Res. 14 (1981) 384–392.[16] W.D. Horrocks Jr., D.R. Sudnick, J. Am. Chem. Soc. 101 (1979) 334–340.[17] Q. Xu, L. Li, X. Liu, R. Xu, Chem. Mater. 14 (2002) 549–555.[18] B. Yan, H-jie Zhang, S.-bin Wang, J.-zuan Ni, J. Photobiol. A: Chem. 112 (1998)
231–238.[19] R.J.P. Corriu, A. Mehdi, C. Reyé, C. Thieuleux, A. Frenkel, A. Gibaud, New J.
Chem. 28 (2004) 156–160.[20] F. Rocca, C. Armellini, M. Ferrari, G. Dalba, N. Diab, A. Kuzmin, F. Monti, J. Sol–
Gel Sci Technol. 26 (2003) 267–271.[21] G.E. Fryxell, H. Wu, Y. Lin, W.J. Shaw, J.C. Birnbaum, J.C. Linehan, Z. Nie, K.
Kemner, S. Kelly, J. Mater. Chem. 14 (2004) 3356–3363.[22] S. Gago, J.A. Fernandes, J.P. Rainho, A. Rute, S. Ferreira, M. Pillinger, A.A.
Valente, T.M. Santos, L.D. Carlos, P.J.A. Ribeiro-Claro, I.S. Gonçalves, Chem.Mater. 17 (2005) 5077–5084.
[23] C. Yu, Y. Yu, D. Zhao, Chem. Commun. 7 (2000) 575–576.[24] C. Yu, Y. Yu, L. Miao, D. Zhao, Microporous Mesoporous Mater. 44 (45) (2001)
65–72.[25] C. Yu, B. Tian, J. Fan, G.D. Stucky, D. Zhao, J. Am. Chem. Soc. 124 (2002) 4556–
4557.[26] J.R. Matos, M. Kruk, L.P. Mercuri, M. Jaroniek, L. Zhao, T. Kamiyama, O. Terasaki,
T.J. Pinnavaia, Y. Liu, J. Am. Chem. Soc. 125 (2003) 821–829.[27] D. Zhao, Q. Huo, J. Feng, B.F. Chmelka, G.D. Stucky, J. Am. Chem. Soc. 120 (1998)
6024–6036.[28] P. Van Der Voort, M. Benjelloun, E.F. Vansant, J. Phys. Chem. B 106 (2002)
9027–9032.[29] M. Mayer, SIMNRA, Simulation Program for the Analysis of NRA, RBS and
ERDA, in: J.L. Duggan, I.L. Morgan (Eds.), Proceedings of the 15th InternationalConference on the Application of Accelerators in Research and Industry,American Institute of Physics Conference Proceedings, vol. 475, New York,1991, p. 541.
[30] G. Kellermann, F. Vicentin, E. Tamura, M. Rocha, H. Tolentino, A. Barbosa, A.Craievich, I. Torriani, J. Appl. Crystallogr. 30 (1997) 880–883.
[31] S. Brunauer, P.H. Emmet, E. Teller, J. Am. Chem. Soc. 60 (1938) 309–319.[32] E.P. Barrett, L.G. Joyner, P.P. Halenda, J. Am. Chem. Soc. 73 (1951) 373–380.[33] M. Kruk, M. Jaroniec, A. Sayari, Langmuir 13 (1997) 6267–6273.[34] H. Tolentino, J.C. Cezar, D.Z. Cruz, V. Compagnon-Cailhol, E. Tamura, M.C.M.
Alves, J. Synchrotron Radiat. 5 (1998) 521–523.[35] T. Ressler, J. Synchrotron Radiat. 5 (1998) 118–122.[36] M.Z. Wang, L.P. Jin, S.X. Liu, G.L. Cai, J.L. Huang, W.P. Qin, S.H. Huang, Sci. China
Series B – Chem. 37 (1994) 410.[37] S. Gago, J.A. Fernandes, J.P. Rainho, R.A. Sá Ferreira, M. Pillinger, A.A. Valente,
T.M. Santos, L.D. Carlos, P.J.A. Ribeiro-Claro, I.S. Gonçalves, Chem. Mater. 17(2005) 5077–5084.