Embed Size (px)
Citation preview

ww
ww
.rea
ch-e
nerg
y.eu
LOCAL ACTION PLAN ON ENERGY POVERTY
Pomurje, SLOVENIA
Аuthor: Tomislav TKALEC
December 2014

ww
ww
.rea
ch-e
nerg
y.eu
2
This document is product of the activities under the second work package(WP2) of the project REACH (Reduce Energy Consumption andChange Habits), co-funded by the Intelligent Energy Europe Program ofthe European Union.

ww
ww
.rea
ch-e
nerg
y.eu
3
CONTENTS
1. INTRODUCTION...................................................................................................4
1.1 AIM OF THE ACTION PLAN.................................................................................5
2. DATA ABOUT ENERGY POVERTY IN POMURJE......................................................5
3. STAKEHOLDERS RELATED TO ENERGY POVERTY...............................................11
4. TARGET GROUPS..............................................................................................12
5. ACTION PLAN....................................................................................................13

ww
ww
.rea
ch-e
nerg
y.eu
4
1. INTRODUCTION
Pomurje region is one of the twelve statistical regions in Slovenia. It is the mostnorth-east, flat and agricultural region. Predominant activity is agriculture.Remote location and poor transport links have an adverse effect on the economicsituation of the region. This is reflected in low GDP per capita and high level ofunemployment. The region covers 1,337 km2 and average age of the populationis 43.3 years (data for 2012). Pomurje has 117,005 inhabitants and 45,255households. Average number of household members is 2.6.
Figure 1: Pomurje statistical region – marked yellow
Source: SURS
Energy poverty in Slovenia and in Pomurje region is becoming an increasingproblem as rising energy prices outpass the rise of income of the population.Thus, the expenditure on energy for households in the first income quintile1 rosesharply in the couple of last years and in 2010 represented 17.4% of all availableresources of individual households (in 2000: 13.1%)2.
1 Income quintiles represent houeholds, arranged by their size of disposable income. First quintile represents 20% houeholds with lowest incomes; fifth quintile represent houeholds with highest income.
2 SURS: http://www.stat.si/novica_prikazi.aspx?id=5164
ww
ww
.rea
ch-e
nerg
y.eu
5
1.1 AIM OF THE ACTION PLAN
The aim of this document is to define stakeholders, target groups and type ofactivities, that will be implemented in the Pomurje area. Action plan includes atimetable in order to make those actions more effective.
Furthermore this local action plan includes some of the relevant statistical dataabout the region, in particular social, economic and energy indicators, related tothe issue of energy poverty.
2. DATA ABOUT ENERGY POVERTY IN POMURJE
Social, economic and energy indicators in the Pomurje area, that affect the issueof fuel poverty, are presented in this part of the document. Information and dataabout energy poverty on the national level is presented in the document ''Reporton national situation in the field of energy poverty''3. In the absence of adequatedata on energy poverty for the regional level, only available indicators that showthe regional picture are presented in this document. For creating a broaderpicture about the state of energy poverty issue in Slovenia and in Pomurje region,it is advisable to read the above-mentioned report as well.
Extent of the housing stock
In 2011, according to Statistical Office of Republic of Slovenia (SURS)4, there are844,656 apartments in Slovenia. In Pomurje region there are 48,268 apartments5.
Average size of dwellings
Average floor space of dwellings is 79.6 m2 (SURS, data for 2011). In Pomurjeaverage size of dwellings is slightly higher (86.4 m2), mainly because there aremore traditional one-family houses in rural area.
Table 1: Size of dwellings (in %), data for 2002Up to 20 m2 21-40 m2 41-60 m2 61-80 m2 81-100 m2 Above 101 m2
Slovenia 1.4 13.4 25.8 27.2 17.5 14.6
Pomurje 1.9 11.7 20.8 21.6 20.3 23.8
Source: SURS
3 REACH, 2014: Report on national situation in the field of energy poverty. Available at: http://reach-energy.eu/wordpress/wp-content/uploads/2014/12/D2.2-Focus_EN.pdf
4 SURS: http://www.stat.si/novica_prikazi.aspx?id=47715 SURS: http://www.stat.si/PrikaziDatoteko.aspx?id=5930

ww
ww
.rea
ch-e
nerg
y.eu
6
GDP per capita
Since 2008, the decline of GDP per capita is noted in Slovenia, which coincideswith the start of the financial crisis. Pomurje has second lowest GDP per capitafrom all regions in Slovenia. The gap when compared to the Central-Slovenianregion is especially apparent, because the latter's GDP per capita was 24,170EUR in 2012.
Table 2: GDP per capita (in EUR)
2008 2009 2010 2011 2012
Slovenia 18,420 17,349 17,320 17,610 17,172
Pomurje 11,909 11,415 11,367 11,948 11,872
Source: SURS
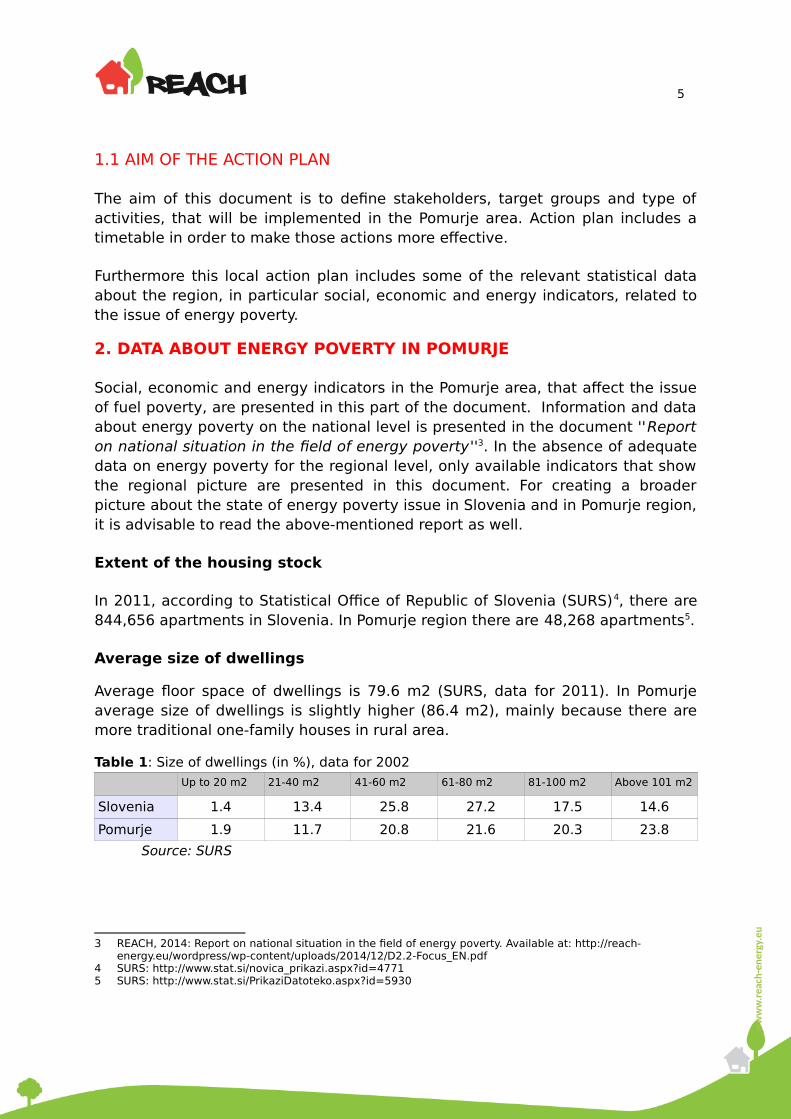
Average income
The average net salary in Slovenia grow yearly at a minimum rate, but is stillbelow 1000 EUR per month. When compared to other regions, Pomurje hassecond lowest salaries.
Table 3: Average monthly net earnings for month September in provided years (in EUR)
2010 2011 2012 2013 2014
Slovenia 963.84 978.20 972.73 983.30 994.31
Pomurje 874.88 881.20 889.17 887.37 906.44
Source: SURS
ww
ww
.rea
ch-e
nerg
y.eu
7
Figure 2: Average monthly earnings for September 2014, in regions,, Pomurje is no. 1
Source: SURS
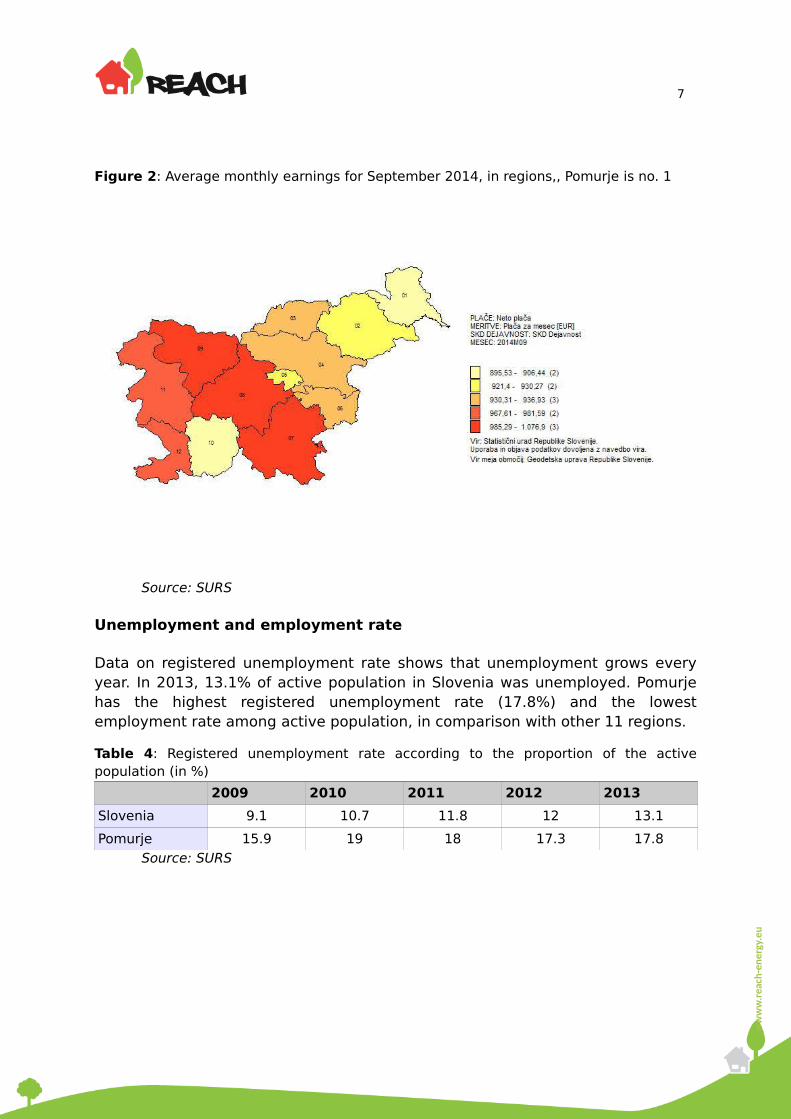
Unemployment and employment rate
Data on registered unemployment rate shows that unemployment grows everyyear. In 2013, 13.1% of active population in Slovenia was unemployed. Pomurjehas the highest registered unemployment rate (17.8%) and the lowestemployment rate among active population, in comparison with other 11 regions.
Table 4: Registered unemployment rate according to the proportion of the activepopulation (in %)
2009 2010 2011 2012 2013
Slovenia 9.1 10.7 11.8 12 13.1
Pomurje 15.9 19 18 17.3 17.8Source: SURS

ww
ww
.rea
ch-e
nerg
y.eu
8
Figure 3: Registered unemployment rate, for 2013, Pomurje is no. 1
Source: SURS
Table 5: Employment rate among active population (in %)
2009 2010 2011 2012 2013
Slovenia 60.5 58.8 58.1 57.4 -
Pomurje 55.4 52.5 53.2 51.2 -
Source: SURS
Poverty risk rate and number of people below the poverty line
Poverty risk rate represents the percentage of people living below the povertyline. People below the poverty line are those living in households with availableincome below 60% of median equivalent available income in the country. Risk ofpoverty rate in Slovenia increases every year. Pomurje is second-worst amongthe 12 regions according to the indicator for poverty risk rate.

ww
ww
.rea
ch-e
nerg
y.eu
9
Table 6: Poverty risk rate and number of people below poverty line
2009 2010 2011 2012 2013
Poverty risk rate (% of people)
Slovenia 11.3 12.7 13.6 13.5 14.5
Pomurje 18.8 21.2 20.6 19.2 19.9
Number of people below poverty line
Slovenia 223,000 254,000 273,000 271,000 291,000
Pomurje 22,000 22,000 22,000 21,000 23,000
Source: SURS
Figure 4: Poverty risk rate, Pomurje is no. 1
Source: SURS
Recipients of social support
Social support is given to those individuals, who cannot provide means for theirminimum survival needs, due to the circumstances, which they cannot control.The average value of state support in 2013 was 253.29 EUR6. There is nocomprehensive statistics in this area. Data on the number of different recipientsof social support are available for 2010 (94,000 recipients7) and 2011 (86,000
6 MDDSZ: http://www.mddsz.gov.si/si/uveljavljanje_pravic/statistika/denarna_socialna_pomoc/7 SURS: http://www.stat.si/obcinevstevilkah/Vsebina.aspx?leto=2012&ClanekNaslov=SocialnaDenarnaPomoc

ww
ww
.rea
ch-e
nerg
y.eu
10
recipients8). Geographically, the majority of recipients of social support are in themunicipalities of the eastern part of Slovenia, in Pomurje (66.2/1.000 inhabitants)and in the Podravje statistical region.
Figure 5: Recipients of social support by municipalities, 2011
Source: SURS
Heating sources
Data on heating sources in households for various regions is available only for2002, which means that it is partly out of date. However, it can still be used as anindicator of the situation in the region. In Pomurje region with mostly individualhouses in non-urban settlements, mostly individual heating with wood fuel andheating oil is used.
8 SURS: http://www.stat.si/obcinevstevilkah/Vsebina.aspx?leto=2013&ClanekNaslov=SocialnaDenarnaPomoc

ww
ww
.rea
ch-e
nerg
y.eu
11
Table 7: Share of different heating sources in households, Pomurje, Census 2002
Urban settlements Non-urbansettlements
Total
Coal, coal briquettes 432 1,803 2,235
Wood fuels 1,749 20,426 22,175
Heating oil 5,788 14,021 19,809
Electricity 681 461 1,142
Natural gas 640 347 987
District heating 632 0 632
Boiler room for several buildings
2,497 0 2,497
Apartment is not heated
155 2,145 2,300
Other 173 536 709
Total9 11,680 34,191 45,871
Source: SURS
3. STAKEHOLDERS RELATED TO ENERGY POVERTY
Stakeholder participants are all organizations and institutions that can supportthe campaign for recruitment and involvement of energy poor houeholds orprovide any other kind of support for the implementation of REACH project.
Potential stakeholders:
• Local energy agency Pomurje (LEA Pomurje),
• Centres for Social Work (Murska Sobota and potentially Lendava),
• local and regional social organizations (Caritas and Red Cross),
• Municipalities in Pomurje (Murska Sobota and other smaller ones),
• local pensioners' associations,
• Vocational and Technical High School Murska Sobota,
• other stakeholders on regional level (Employment offices, People'sUniversity Murska Sobota...).
Stakeholders already identified
Most of the presented potential stakeholders have already been identified andcontacted. Also, cooperation was already established with majority of them:
9 Sum of heating sources is not necessarily the same as the total number of housing units, as some housing unit use several heating sources.
ww
ww
.rea
ch-e
nerg
y.eu
12
• LEA Pomurje (they are partners of the project; will be involved with all keyactivities);
• Centre for Social Work (are contacting and taking care of applications ofhouseholds),
• local and regional social organizations (Caritas and Red Cross in MurskaSobota are aware of the project),
• Vocational and Technical High School Murska Sobota (will be included intraining and practice of students).
4. TARGET GROUPS
Given the objectives of REACH project, there are two target groups:
• households at risk of energy poverty,
• high schools, teachers and students.
Households at risk of energy poverty are the main target group of this project, aswithin its duration 200 visits are going to be implemented in Pomurje. Thespecific aim of the visits is to analyse energy and water consumption, giveadvice in order to achieve savings, and provide a set of saving devices, with theaim of reducing energy costs.
High schools, teachers and students are the next group to be targeted. Thepurpose of communication and cooperation with them is to build a partnership inexecution of activities of the project.

ww
ww
.rea
ch-e
nerg
y.eu
13
5. ACTION PLAN
Table 8: Action plan with timetable of planned activities
Activity 2014 2015 2016 2017
Inclusion of the school in the project September
Inclusion of Centre for Social Work in promotion the visits and taking care of applications of households – first season
May– -April
Agreement with school on implementation of training for students – first generation
April-June
Inclusion of municipalities in the project (practise of students – first generation)
March-September
Implementation of training for students (and teachers) – first generation
September
Implementation of visits (first generation) 100 visits
September-December
Evaluation of visits – first season October- -February
Award ceremony for students – first generation December- -April
Promotion of visits (Centres for Social Work, leaflets) – second season
August-November
Agreement with school on implementation of training for students – second generation
April-June
Inclusion of municipalities in the project (practise of students – second generation)
March-September
Implementation of training for students (and teachers) – second generation
September
Implementation of visits (second generation) 100 visits
September-December
Evaluation of visits – second season October- -January
Award ceremony for students – second gen. December- -February
Post-training support for students (with implementation of visits and after visits are finished)
September- -January
Eventual post-visit support for households, if needed
September -January
Promotion of the project in local media December- -March
Searching for solutions with high schools (and municipalities) for sustainability of energy advising as form of a practise for students
January- -March
Searching structural solutions for energy poverty with municipalities
January- -March
Potential new partners for promotion of visits and taking care of applications of households
August-December
ww
ww
.rea
ch-e
nerg
y.eu
14
Partners
Focus – Association for sustainable development, Slovenja
www.focus.si
DOOR – Society for Sustainable Development Design, Croatia
www.door.hr
EAP – Energy Agency of Plovdiv, Bulgaria
www.eap-save.eu
MACEF – Мacedonian Centre for Energy efficiency, Macedonia
www.macef.org.mk
Co-funded by
Co-funded by the Intelligent Energy Europe Programme of the European Union
The sole responsibility for the content of this document lies withthe authors. It does not necessarily reflect the opinion of theEuropean Union. Neither the EACI nor the European Commissionare responsible for any use that may be made of the informationcontained therein.
For more information about EU: www.ec.europa.eu