Embed Size (px)
Citation preview
LOADING TEST OF A HOLLOW TILE AND REINFORCEDCONCRETE FLOOR OF ARLINGTON BUILDING,
WASHINGTON, D. C.
By Louis J. Larson and Serge N. Petrenko.
ABSTRACT.
Hollow-tile and reinforced concrete floor panels, supported on reinforced concrete
beams, were loaded, some to 3.8 times the design live load. The loading was designed
to produce the maximum positive and the maximum negative moments. Strain
measurements were taken on the concrete and the reinforcing steel of the slabs and
of the girders. Deflections of the slab were measured also . In the slabs the maximumstresses were developed at the positions of negative moment. The beams at the
edges of the panels offered so little resistance to torsion that the stressses in the steel
across these beams due to negative moment were little affected by a transfer of load
between adjacent panels.
The effect of time under load was very pronounced in the first 20 hours and com-
paratively small later. The increase in the deformation, due to continued loading,
was greater in the reinforcement than in the concrete. The cracking of the concrete
and the resulting great increase of the stresses in the reinforcing steel showed that at
first the concrete carried a considerable portion of the tensile stresses.
Due to the low stresses, the moment coefficients were generally small. They are
not proposed for use in design but to show the relative amount of the bending momentcarried in the two directions. The effect on the moment coefficients of an increase
in the ratio of length to width of the panel was a rapid increase of both the positive
and the negative moments in the direction of the short span and a less rapid de-
crease of both moments in the direction of the long span.
The factor of safety of the structure was apparently greater than 2.
CONTENTS.Page.
I. Introduction 406
1
.
Purpose of tests 406
2. Acknowledgments 407II. Description of test 407
1. Building 4072. Test panels 412
3. The test 414(a) Instruments used 414(b) Observations taken 414(c) Method of loading 416
4. Temperature corrections 418
5. Recording and presenting test data 418
4©S
406 Technologic Papers of the Bureau of Standards. vol. 17
Page.
III. Results of test 4I9i. Effect of change in loading conditions on stresses 4192. Effect of time under load of stresses 4273. Cracks 43I
4. Stresses and moments 430
5. Effect of shape of panel on moments 4376. Deflections
, 437(a) Effect of time 438(b) Residual deflections 438(c) Effect of loading conditions 430
IV. Sufficiency of construction for design load 439V. Bibliography 444
I. INTRODUCTION.
The tests of the Arlington Building consisted of loading cer-
tain floor panels and taking measurements of the deflections
of the panels, deformations of the concrete, and reinforcement
of the beams and panel slabs. Other investigators had madesimilar tests of concrete flat slab, beam, and girder, and various
types of reinforced concrete and hollow-tile floor constructions;
and simple loading tests of three floor panels of two-way rein-
forced concrete and hollow-tile construction without concrete
topping, in which the deformations were measured, had been
made by Prof. James S. McGregor, of Columbia University, in
cooperation with the Bureau of Buildings of New York, N. Y.
The tests herein described, however, were among the first madeon this type of construction, which was a framework of light-
weight structural steel members used as reinforcement for the
concrete columns and beams, supporting two-way reinforced con-
crete and terra-cotta, hollow-tile floor panels.
Due to the differences in construction of the panels the results
obtained can not be considered representative of general con-
struction. Some of the slabs are supported on lintel beams
and beams spanning between columns, while others are supported
on beams and girders. It is therefore evident that the stress
distribution in these tests must differ materially from that in
a floor slab continuous in both directions over several panels.
1. PURPOSE OF TESTS.
The type of construction was new in many respects and the
structure is considerably lighter than recommended by the
final report (1916) of the Joint Committee on Concrete and Rein-
forced Concrete or allowed by most building codes.
C v
pZrenko] Test of Hollow Tile and Concrete Floor. 407
The primary purpose of the test was, therefore, to find howmuch live load could actually be placed on individual panels
before serious stresses were developed. It was desired by all
concerned in this test to secure as much information as possible
on the action of the hollow-tile slabs and incidentally also on
the framework when subjected to load.
2. ACKNOWLEDGMENTS.
The preliminary arrangements for the test were made by E. C.
Ruebsam, chief structural engineer, Office of the Supervising
Architect, Treasury Department. Mr. Ruebsam also cooperated
in selecting the test panels and planning the test. L. J. Larson,
assisted by R. L. Templin, of the Bureau of Standards, con-
ducted the test. The recorders were J. A. Cliff, Office of the
Supervising Architect, and H. G. Boutell, Bureau of Standards.
J. T. McCoy, of Schuster Engineering Co., arranged for the labor
and loading material for loading the panels. The reduction of
the data and the preparation of the report of the test have been
done by the authors, assisted by the members of the engineering
and structural materials division, Bureau of Standards. Theauthors are especially indebted to W. A. Slater, engineer physicist,
Bureau of Standards, for advice and assistance. The interpre-
tation of the results in many cases was due to him.
II. DESCRIPTION OF TEST.
1. BUILDING.
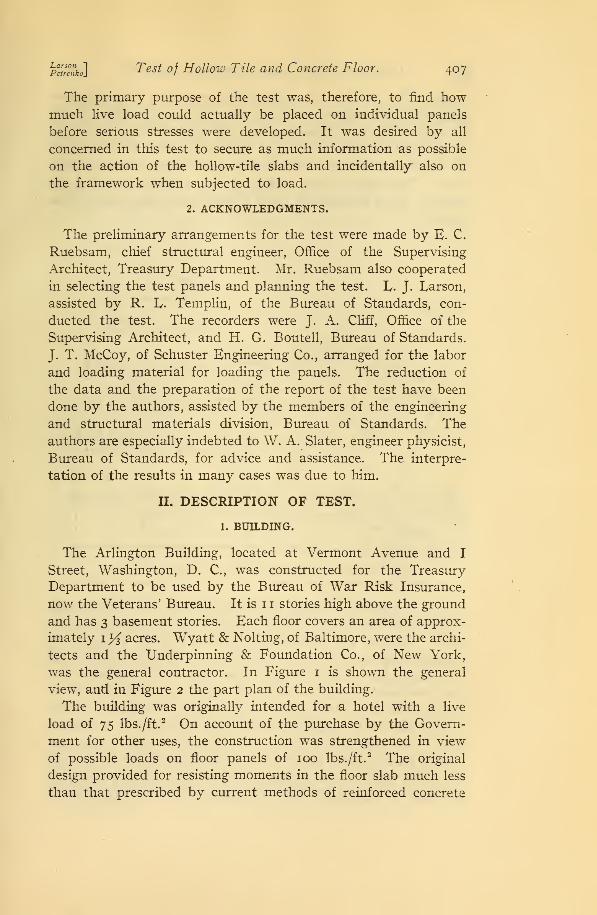
The Arlington Building, located at Vermont Avenue and I
Street, Washington, D. C, was constructed for the Treasury
Department to be used by the Bureau of War Risk Insurance,
now the Veterans' Bureau. It is 11 stories high above the ground
and has 3 basement stories. Each floor covers an area of approx-
imately 1 Ys acres. Wyatt & Nolting, of Baltimore, were the archi-
tects and the Underpinning & Foundation Co., of New York,
was the general contractor. In Figure 1 is shown the general
view, and in Figure 2 the part plan of the building.
The building was originally intended for a hotel with a live
load of 75 lbs. /ft.2 On account of the purchase by the Govern-
ment for other uses, the construction was strengthened in view
of possible loads on floor panels of 100 lbs. /ft.2 The original
design provided for resisting moments in the floor slab much less
than that prescribed by current methods of reinforced concrete
408 Technologic Papers of thr Bureau of Standards. vol. 17
design. The subsequent modifications secured a proportionate
increase in the original resistance somewhat greater than would
be required by the increase in live load contemplated, but even
so the total computed resistance was much lower than required
by accepted standards for the design of reinforced concrete struc-
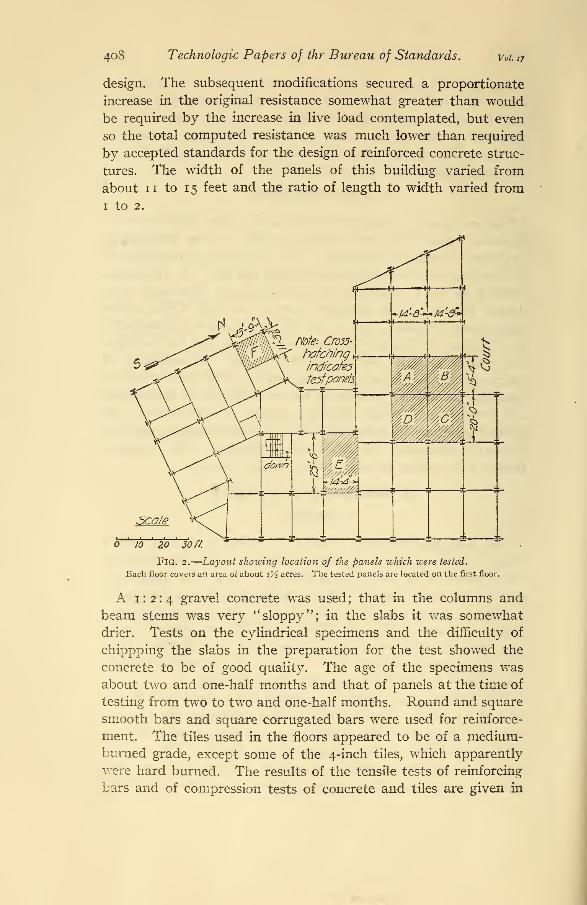
tures. The width of the panels of this building varied from
about 11 to 15 feet and the ratio of length to width varied from
1 to 2.
Fig. 2.
—
Layout showing location of the panels which were tested.
Bach floor covers an area of about 1% acres. The tested panels are located on the first floor.
A 1:2:4 gravel concrete was used ; that in the columns and
beam stems was very "sloppy"; in the slabs it was somewhatdrier. Tests on the cylindrical specimens and the difficulty of
chippping the slabs in the preparation for the test showed the
concrete to be of good quality. The age of the specimens was
about two and one-half months and that of panels at the time of
testing from two to two and one-half months. Round and square
smooth bars and square corrugated bars were used for reinforce-
ment. The tiles used in the floors appeared to be of a medium-burned grade, except some of the 4-inch tiles, which apparently
were hard burned. The results of the tensile tests of reinforcing
bars and of compression tests of concrete and tiles are given in
Larson 1
Pelrenkoj Test of Hollow Tile and Concrete Floor. 409
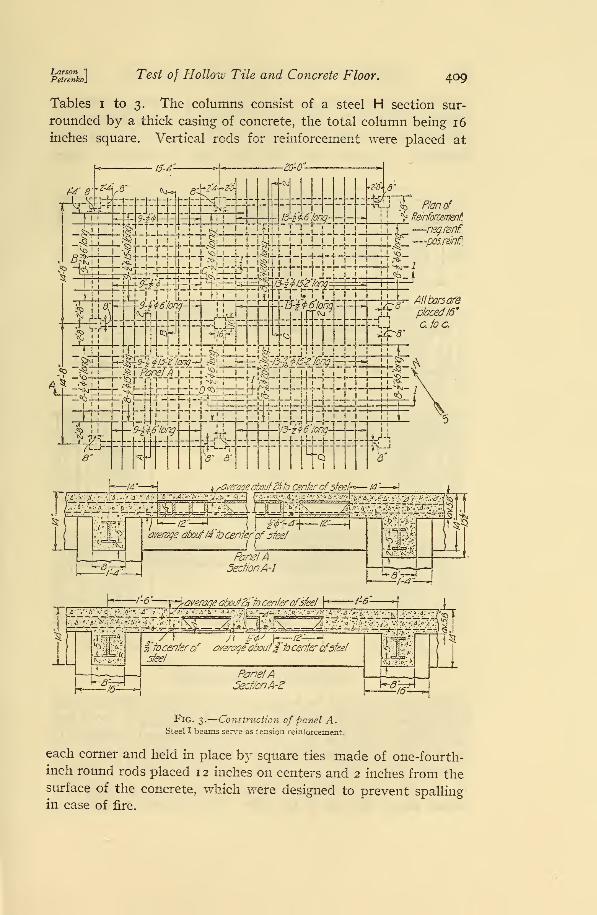
Tables i to 3. The columns consist of a steel H section sur-
rounded by a thick casing of concrete, the total column being 16
inches square. Vertical rods for reinforcement were placed at
f4~ 8'
15-4-
Z-4
itf>H°*-i
Q-y^'Zb
BEffi-T-t-T
:-i— 1— I—I.
I
-ZO'-O"-
q I ^ 1 1 1 j—1 .^n'Ti
,
$
+JLJ.
1
J-4-i^
13-fMorig^r_
—
1 L ' -Ll 1 '
"T'T"1" f"~
f"~r~r
•z# 5"
iS-v ;4 Plan of
\_ Reinforcement
xrpyz-j-.-i
— ~9-f'46'fong~^
__{_j jol L -i- ,4--|.^iJ-i—!— 1—i—l— + —J—
I
i~T~
—
negi&f,
\_ %__ —posre/nf?
<o
A*
IStir
.VPanelA I J «J§LL
^L8" B1
L£i$LJLJ4~+
_. u
—1— ir+1
—
t
-9~i4x
6'long m '3rz$6'long
—
H
k ravemrje about&io center ofsteelr*— /4
average about(z bcenter'of steel
J {
PanelASectionA'l
?s&
RS5
til
6 *\*-)?ai/eraqe about2fto centerofsteel \
l- /-£
1.'4'o;.6't
TSR*:I . 71 yf 7^ h—^—H I It's
» :"4 '.••-"4
71 ytj
I tocenterof average about£"tocenter ofsteel
PanelASectionA-Z! J^/^EU]
FlG. 3.
—
Construction of panel A.Steel I beams serve as tension reinforcement.
each corner and held in place by square ties made of one-fourth-inch round rods placed 12 inches on centers and 2 inches from thesurface of the concrete, which were designed to prevent spallingin case of fire.
4io Technologic Papers of the Bureau of Standards. vol. n
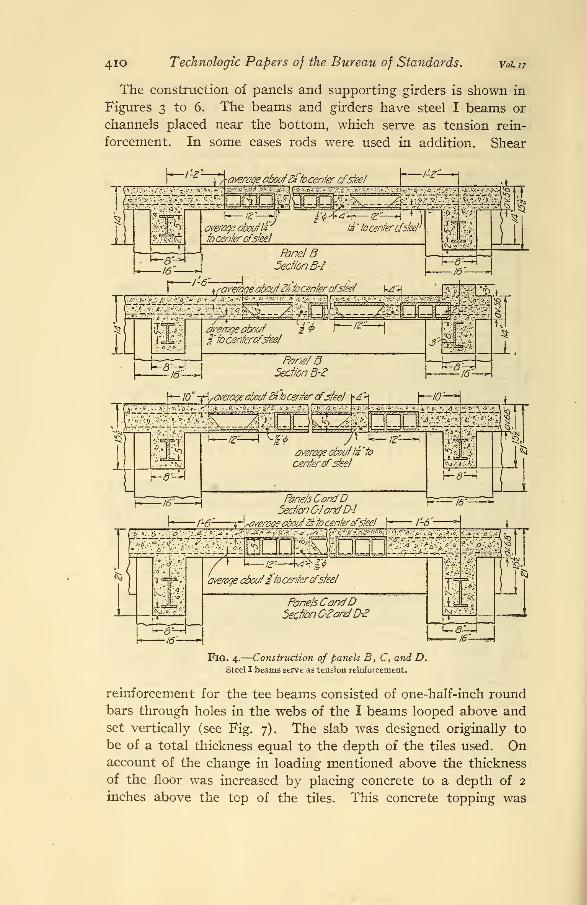
The construction of panels and supporting girders is shown in
Figures 3 to 6. The beams and girders have steel I beams or
channels placed near the bottom, which serve as tension rein-
forcement. In some cases rods were used in addition. Shear
Fig. 4.
—
Construction of panels B, C, and D.Steel I beams serve as tension reinforcement.
reinforcement for the tee beams consisted of one-half-inch roundbars through holes in the webs of the I beams looped above andset vertically (see Fig. 7). The slab was designed originally to
be of a total thickness equal to the depth of the tiles used. Onaccount of the change in loading mentioned above the thickness
of the floor was increased by placing concrete to a depth of 2
inches above the top of the tiles. This concrete topping was
LarsonPetrenko Test of Hollow Tile and Concrete Floor. 411
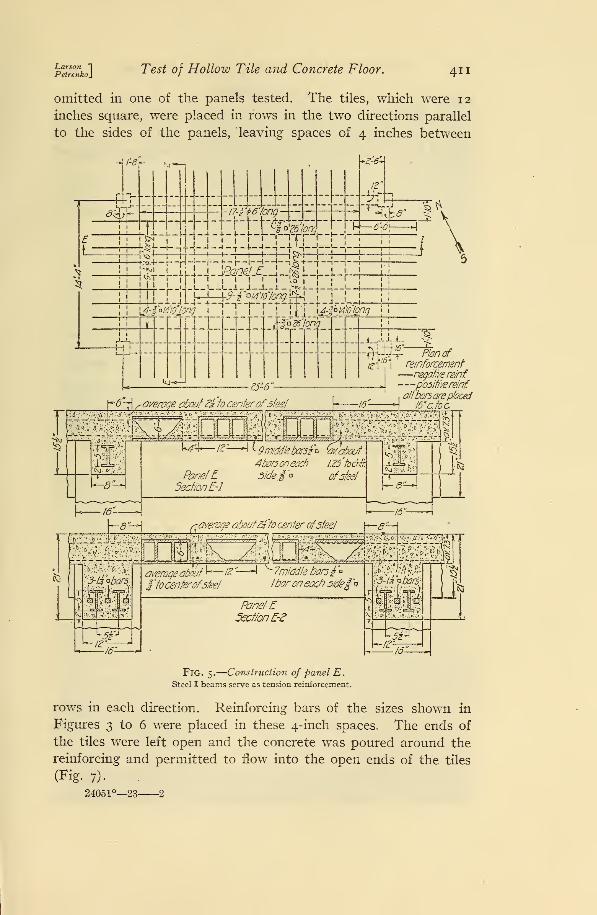
omitted in one of the panels tested. The tiles, which were 12
inches square, were placed in rows in the two directions parallel
to the sides of the panels, leaving spaces of 4 inches between
Fig. 5.
—
Construction of panel E.Steel I beams serve as tension reinforcement.
rows in each direction. Reinforcing bars of the sizes shown in
Figures 3 to 6 were placed in these 4-inch spaces. The ends of
the tiles were left open and the concrete was poured around the
reinforcing and permitted to flow into the open ends of the tiles
(Fig. 7).
24051°—23 2
412 Technologic Papers of the Bureau of Standards.
2. TEST PANELS.
Vol. 17
For convenience in loading, the test panels were selected on the
first floor. Panels having ratios of length to width of i .05 (panels
A and B), 1.38 (panels C and D), and 1.86 (panel E) were selected
M*j
nf*$fi
EDE£f3pEB6-lt6?ong-
n r •&
kp=
i
LJJ-™
1
kj
h4--te lI
!
i-
J__1J__
-T>,:F-:
Vf,
7/-JJ'
/%7/7 ofreinforcementnegative reinf
positive reinf
Ailbars areplaced 16*
a toa
f ~3 (r&verage about0.4'tocntfcf5feel\4"*\
&Y-I2-
Jfn^ ?;?'#••&'
PanelFSection F-l
average about$ to
center ofsteel.
-"^ht?
^average abouta4"to cente,~tfJtM§>
IZ—Panel F
5ecf/onF-Z
^average aboutktocenterofsfeet
'd-'h. SW-: &'.'?K>"&'* B -; °' -
<^-I6 :
fcS
=*1
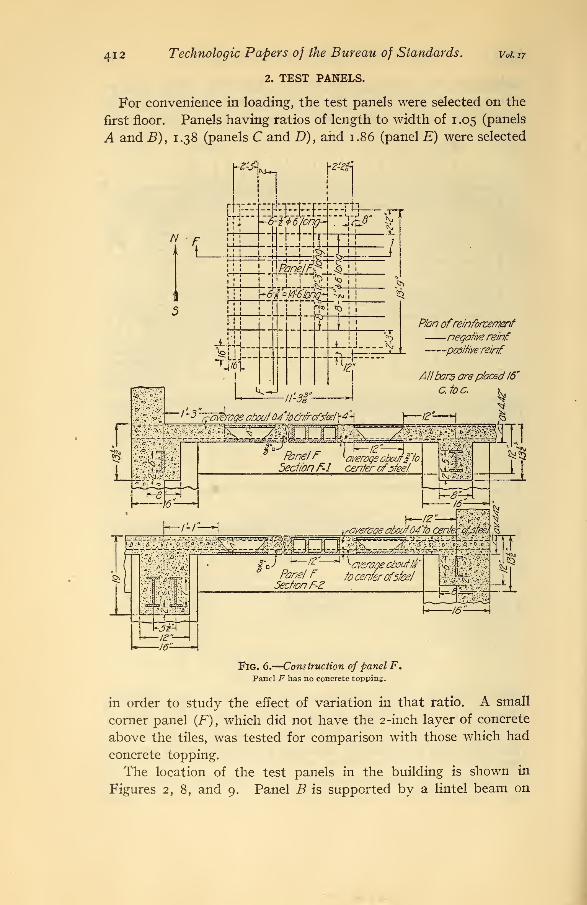
FlG. 6.
—
Construction of panel F.Panel F has no concrete topping.
in order to study the effect of variation in that ratio. A small
corner panel (F), which did not have the 2 -inch layer of concrete
above the tiles, was tested for comparison with those which had
concrete topping.
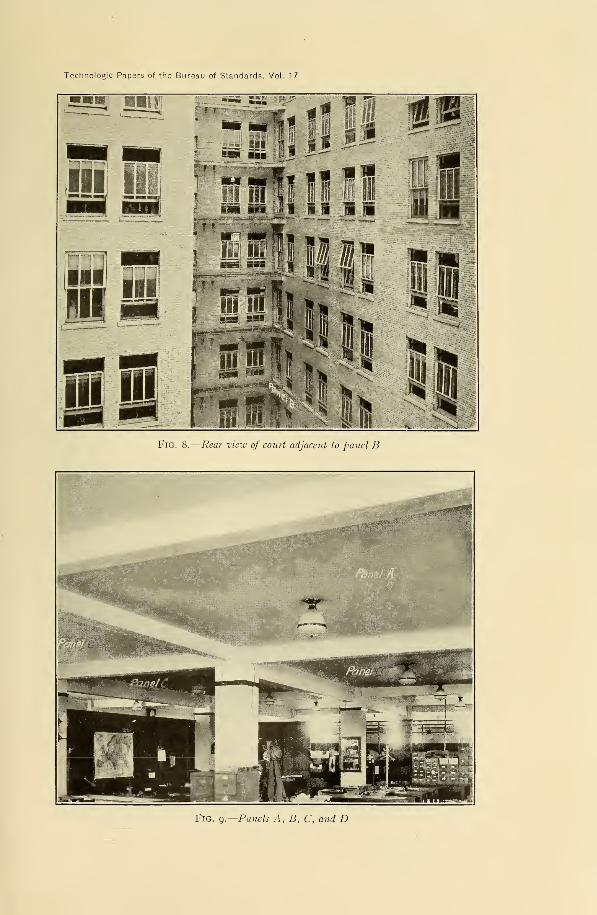
The location of the test panels in the building is shown in
Figures 2, 8, and 9. Panel B is supported by a lintel beam on
Technologic Papers of the Bureau of Standards, Vol. 17
Fig. 8.
—
Rear view of court adjacent to panel B
Fig. 9.—Panels A, B, C, and D
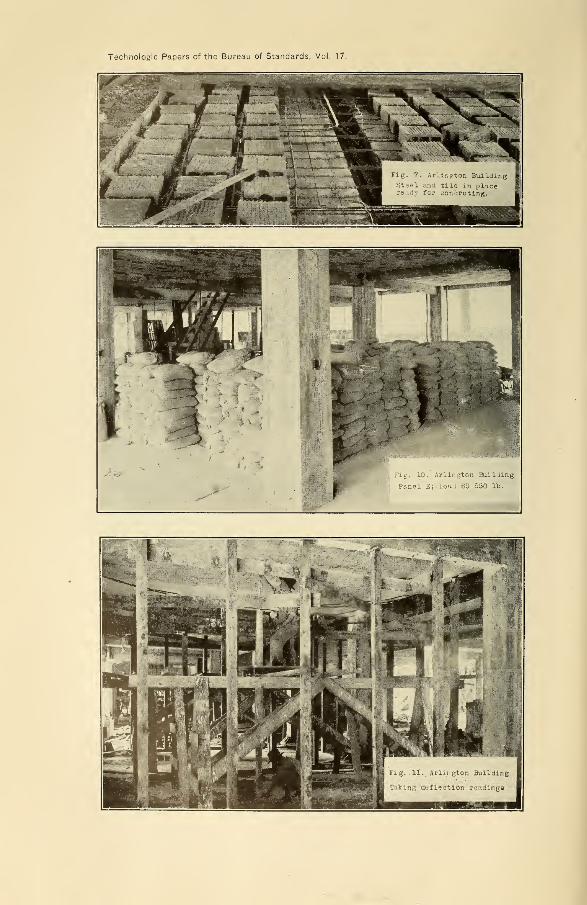
Technologic Papers of the Bureau of Standards, Vol. 17.
Panel E; load 69 550 lb.
Larson 1Petrenkoj
Test of Hollow Tile and Concrete Floor. 413
one side. Panel F is supported by lintel beams on the north
and west sides.
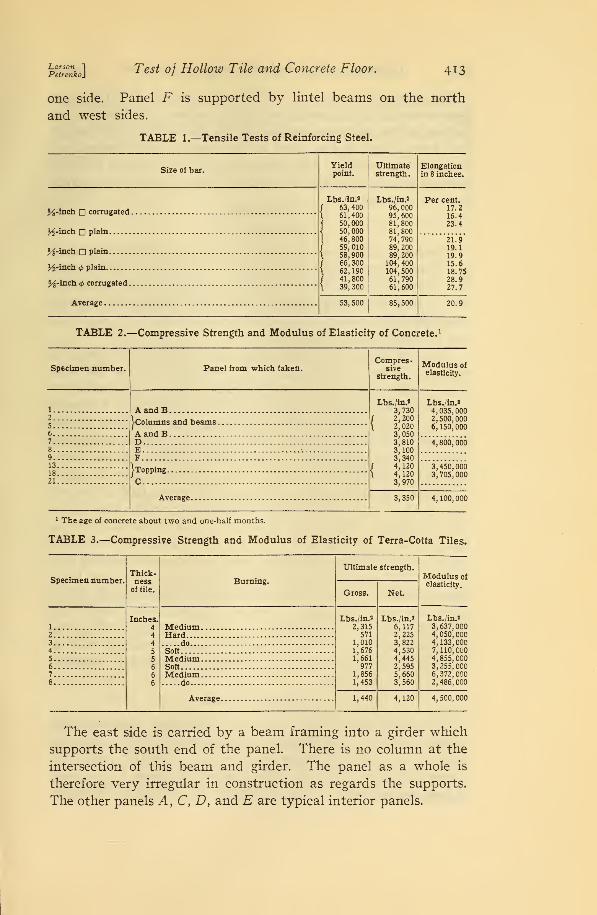
TABLE 1.—Tensile Tests of Reinforcing Steel.
Size of bar.Yieldpoint.
Ultimatestrength.
Elongationin 8 inches.
M-inch corrugated
J^-inch D plain
%-inch plain
3^-inch <j> plain
%-inch <$> corrugated.
Average
Lbs./in.*
63, 40061,40050,00050,00046,80059,01058,90066,30062, 19041, 80039,300
Lbs./in.J
96, 00095, 60081,80081,80074, 79089, 20089, 200
104, 400104, 50061,79061,600
Per cent.17.216.423.4
21.919.119.915.618.7528.927.7
53,500 85,500 20.9
TABLE 2.—Compressive Strength and Modulus of Elasticity of Concrete. 1
Specimen number. Panel from which taken.Compres-
sivestrength.
Modulus of
elasticity.
1 A and BLbs./in.*
3,730f 2, 200
\ 2,0203,0503,8103,1003,340
f 4, 120
I 4, 120
3,970
Lbs./in.»
4,035,0002,500,0002
[Columns and beams
6 A and B6, 150, 000
7 D. 4,800,0008 E9 F13
^Topping 3,450,000
21;c. .
3, 705, 000
3,350 4, 100, 000
1 The age of concrete about two and one-half months.
TABLE 3.—Compressive Strength and Modulus of Elasticity of Terra-Cotta Tiles.
Specimen number.Thick-ness
of tile.
Burning.
Ultimate strength.
Modulus of
Gross. Net.elasticity.
1
Inches.44
4
556
6
6
Lbs./in.*
2,315571
1,0101,6761,661977
1,8561,453
Lbs./in.*
6,1172,2253,8224,5304,4452,5955,6603,560
Lbs./in.*
3,637.0002 Hard 4, 050', 000
3 do - 4,133,0004 Soft 7,110,0005 4,855,0006 Soft 3, 255, 000
6, 372, 0007
8 ... .do 2,486,000
1,440 4,120 4, 500, 000
The east side is carried by a beam framing into a girder which
supports the south end of the panel. There is no column at the
intersection of this beam and girder. The panel as a whole is
therefore very irregular in construction as regards the supports.
The other panels A, C, D, and E are typical interior panels.
414 Technologic Papers of the Bureau of Standards. V0L17
The bars in the top of the slab were exposed for strain-gage
measurements by chipping holes in the concrete and those in the
bottom of the slab were exposed by the removal of corks whichhad been nailed to the forms at the desired points before anyconcrete was poured. Steel plugs were set with plaster of Paris
into one-half-inch holes in the concrete where readings on concrete
were to be made.3. THE TEST.
(a) INSTRUMENTS USED.
The deformation measurements on the steel and concrete were
made with 8-inch Berry strain gages. One of these instruments
had 4^-inch legs so as to facilitate readings on the embeddedsteel. In other respects both of the strain gages used were of
standard design reading total deformation directly to 0.0002 inch
and by estimation to 0.00002 inch.
The deflections were determined by measuring the change of
distance between a steel plug set in the bottom of the test slab
and a plate attached to the basement floor. The deflection
apparatus consisted of a wooden rod (Fig. 11) having a T-shaped
section to give stiffness, with a dial micrometer attached at one
end and a conical steel point at the other. The bearing end of the
plunger of the micrometer was also fitted with a conical point.
The dial used read directly to 0.00 1 inch and had a range of 1 inch.
To take a deflection reading the steel point at the base of the rod
was inserted into a hole in the steel plate set on the floor below
the test panel. The conical point of the dial micrometer was
brought to a firm bearing in the hole in the steel plug set in the
ceiling vertically above the lower plate, and the dial reading wasnoted. The use of the conical points bearing in cylindrical holes
insured definite contact. The use of such a deflectometer elimi-
nated the need of a special deflection scaffolding and saved con-
siderable time in the preparation for the test and in taking the
deflection readings. It was possible to repeat readings with a
variation of not more than 0.001 inch, which gave a sufficient
accuracy for this work.
(b) OBSERVATIONS TAKEN.
The observations taken included deformation measurements
on steel, concrete, and deflection measurements of the slabs and
beams. The locations of the gage lines and deflection points are
shown in Figures 12 and 13. The gage lines in panels A, B, C, and
D were located with a view of finding the stresses at the edges
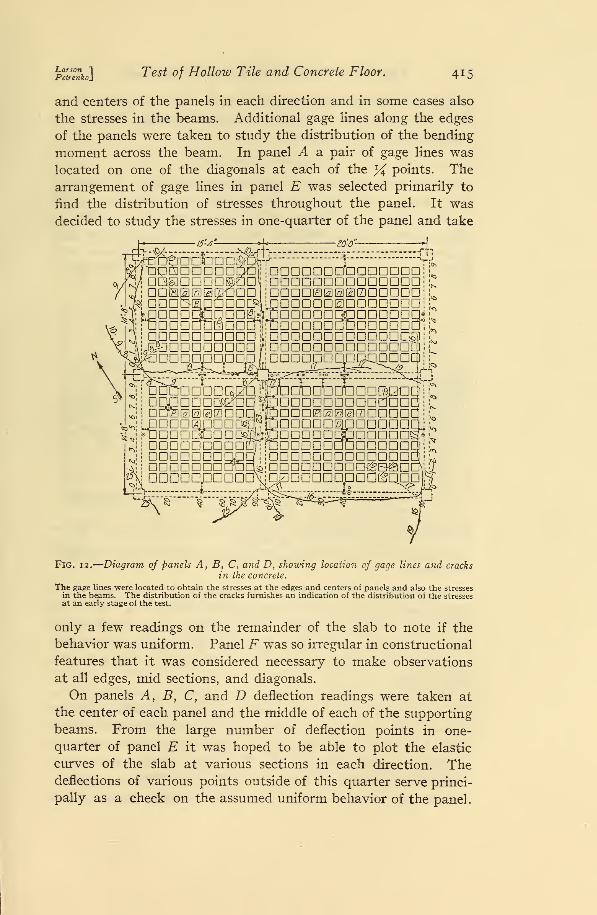
Larson 1Petrenko] Test of Hollow Tile and Concrete Floor. 415
and centers of the panels in each direction and in some cases also
the stresses in the beams. Additional gage lines along the edges
of the panels were taken to study the distribution of the bending
moment across the beam. In panel A sl pair of gage lines was
located on one of the diagonals at each of the % points. The
arrangement of gage lines in panel E was selected primarily to
find the distribution of stresses throughout the panel. It was
decided to study the stresses in one-quarter of the panel and take
•£0-0- •%1iDDDDDnnnDDDDDD:
inannDDnnnnnnDDiDnnniaEtHiEiiinnnDnDDDDDEDDDDDDD:DnnnngnnDDnDDicDDDDDDDaDDDDOiCDDDDDDDDDDDDraDDnnnnnnnanDnLS3
(9
DDDDpDqp^n
00 **>
DDDRIDannnnQQ
DDDDHinnaoa
DDDDDDDDDIDDDDDDDIDDDDDDDlQDDDDDDDDD'
lEoD!
-»\
abacinnDnnnnDDannci
nnnnnaPDnnnnaii,
DDDDDDDDDDDDDDDDDDDDDDDDDDDDDDDDDD^BfiDDHDDDa'Dpaasagp
Fig. 12.
—
Diagram of panels A, B, C, and D, showing location of gage lines and cracks
in the concrete.
The gage lines were located to obtain the stresses at the edges and centers of panels and also the stressesin the beams. The distribution of the cracks furnishes an indication of the distribution of the stressesat an early stage of the test.
only a few readings on the remainder of the slab to note if the
behavior was uniform. Panel F was so irregular in constructional
features that it was considered necessary to make observations
at all edges, mid sections, and diagonals.
On panels A, B, C, and D deflection readings were taken at
the center of each panel and the middle of each of the supporting
beams. From the large number of deflection points in one-
quarter of panel E it was hoped to be able to plot the elastic
curves of the slab at various sections in each direction. Thedeflections of various points outside of this quarter serve princi-
pally as a check on the assumed uniform behavior of the panel.
41
6
Technologic Papers of the Bureau of Standards. vol 17
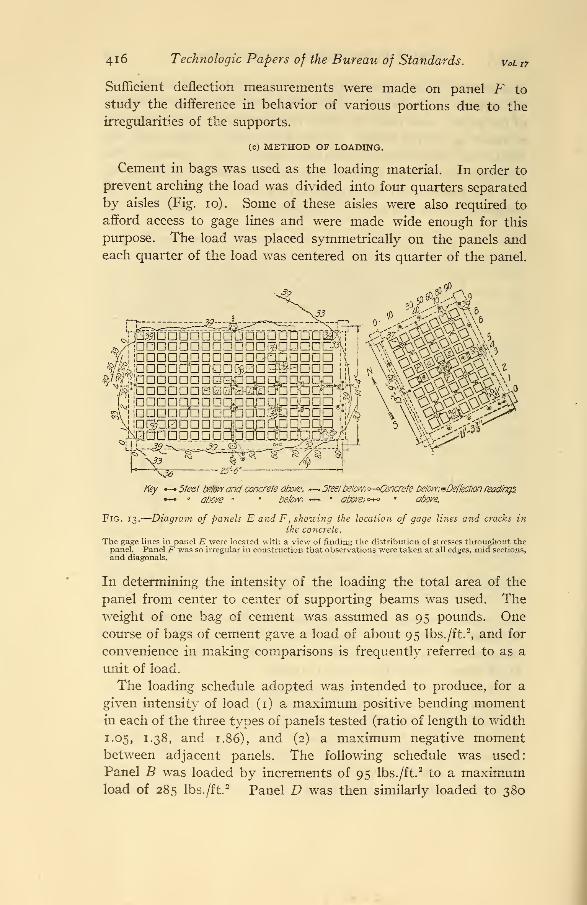
Sufficient deflection measurements were made on panel F to
study the difference in behavior of various portions due to the
irregularities of the supports.
(c) METHOD OF LOADING.
Cement in bags was used as the loading material. In order to
prevent arching the load was divided into four quarters separated
by aisles (Fig. 10). Some of these aisles were also required to
afford access to gage lines and were made wide enough for this
purpose. The load was placed symmetrically on the panels andeach quarter of the load was centered on its quarter of the panel.
nnnnDDDl
30,
^' innnannGaannDdpanan
riannnnnGii]"*
L—^.^r^,_.39- _ i§V - -^—n~^Z5'-6"**
nn ! ^ 1
m?m
Key > Steel below and concrete above, *—5tee! below; o-*Concrete below,
> " above " " below; <-+* • above-, *+q *
Fig. 13.
—
Diagram of panels E and F, showing the location of gage lines and cracks in
the concrete.
The gage lines in panel E were located with a view of finding the distribution of stresses throughout thepanel. Panel F was so irregular in construction that observations were taken at all edges, mid sections,and diagonals.
In determining the intensity of the loading the total area of the
panel from center to center of supporting beams was used. Theweight of one bag of cement was assumed as 95 pounds. Onecourse of bags of cement gave a load of about 95 lbs. /ft.
2, and for
convenience in making comparisons is frequently referred to as a
unit of load.
The loading schedule adopted was intended to produce, for a
given intensity of load (1) a maximum positive bending momentin each of the three types of panels tested (ratio of length to width
1.05, 1.38, and 1.86), and (2) a maximum negative momentbetween adjacent panels. The following schedule was used:
Panel B was loaded by increments of 95 lbs. /ft.2to a maximum
load of 285 lbs./ft.2 Panel D was then similarly loaded to 380
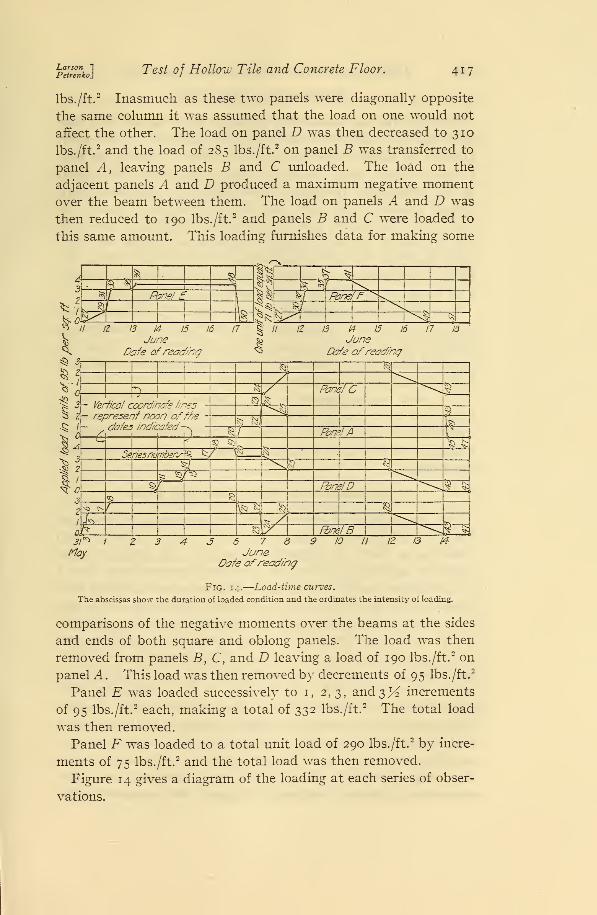
Larson 1
PetrenkojTest of Hollow Tile and Concrete Floor. 417
lbs. /ft.2 Inasmuch as these two panels were diagonally opposite
the same column it was assumed that the load on one would not
affect the other. The load on panel D was then decreased to 310
lbs. /ft.2 and the load of 285 lbs./ft.
2 on panel B was transferred to
panel A, leaving panels B and C unloaded. The load on the
adjacent panels A and D produced a maximum negative momentover the beam between them. The load on panels A and D was
then reduced to 190 lbs./ft.2 and panels B and C were loaded to
this same amount. This loading furnishes data for making some
^MPane'
13 14
June15 16 14 15
JuneZfczfe ofreading « ZM? ofreading
V'1 1
S3 n1 1 ? ,
1 K 1 & Pane! C ** J
, 1 J 1
- Vertical coordinate ///
- represent noon of
_ SJ
3 Z
v.
^ -^\&
p^ ^
i. „feJ Pane! A^ C| r
SQ R»| & $:
*3 Seriesnutafeofe ^/ ^r 8
t
Ft /
=M^& u
== ^r^
3Si
> PaafD S $*s> £
2^O tv f fa
CO & ft)
r:|
1
^r /a& 1
8XX FbnelB 3_j£
May6 7 8June
Oafe ofreading
10 fl IZ 13 ft
Fig. 14.
—
Load-time curves.
The abscissas show the duration of loaded condition and the ordinates the intensity of loading.
comparisons of the negative moments over the beams at the sides
and ends of both square and oblong panels. The load was then
removed from panels B, C, and D leaving a load of 190 lbs./ft.2 on
panel A . This load was then removed by decrements of 95 lbs./ft.2
Panel E was loaded successively to 1, 2,3, and3K increments
of 95 lbs./ft.2 each, making a total of 332 lbs./ft.
2 The total load
was then removed.
Panel F was loaded to a total unit load of 290 lbs./ft.2 by incre-
ments of 75 lbs./ft.2 and the total load was then removed.
Figure 14 gives a diagram of the loading at each series of obser-
vations.
418 Technologic Papers of the Bureau of Standards. V0I17
4. TEMPERATURE CORRECTIONS.
Although the test panels were protected from the sun they were
subjected to a considerable variation in temperature. The temper-
ature in the shade varied from about 60 to 90° F. during the test.
It has, therefore, been necessary to apply temperature corrections
to the strain-gage readings. Observations on unstressed bars,
termed standard bars, were used for this purpose. During the
first part of the test on panel B it was found that these bars were
not sufficiently protected against temperature changes and they
were, therefore, incased in concrete in a wooden box. From this
time on the readings on the standard bars appeared to be consistent
with those on gage lines at unstressed portions of the panels.
For observations in panels A , C, and D taken before the standard
bars were covered, the temperature corrections were based upon
readings on unstressed reinforcing bars of the slab. After the
standard bars were covered the readings on them were used as a
basis for making temperature corrections.
To guard against errors in the observed deflections, due to
unaccounted for changes in the deflectometer, deflection readings
were taken at a point near a column. The deflection at this point
was assumed to be zero and any necessary corrections were madeaccordingly.
5. RECORDING AND PRESENTING TEST DATA.
For the purpose of systematizing the numbering of the gage
lines the panels were divided into nine zones or strips in each
direction as shown in Figures 12 and 13. The strips running
east-west across the panels were numbered consecutively from 1
to 9, inclusive, and those running in the north-south direction were
numbered by tens from o to 90, inclusive. The gage line at any
point received its number from the combined numbering of strips.
For example, gage line number 49 was always located at the center
of the north edge of a panel and is at the intersection of north-
south strip No. 40 and east-west strip No. 9. The six panels
tested were designated alphabetically A to F, inclusive. Thepanel letter was prefixed to the number of the gage line. Suffixes
"E" and "N" were used to designate readings in the east-west
and north-south directions, respectively. For example, B49Nwas the gage line in the north-south direction at the center of the
north edge of panel B. The gage line on the steel and that on the
concrete at the same location in the panel were numbered alike.
pTtrmko] Test of Hollow Tile and Concrete Floor. 419
The gage line on the steel was always on the tension side of the
slab and the gage line on the concrete on the compression side.
In a few cases a gage line was located on the concrete on the
tension side of the slab and these were designated by the sub-
script (c).
Each set of consecutive strain-gage observations on all parts
of the structure under test was termed a series and these
series were numbered consecutively throughout the entire test.
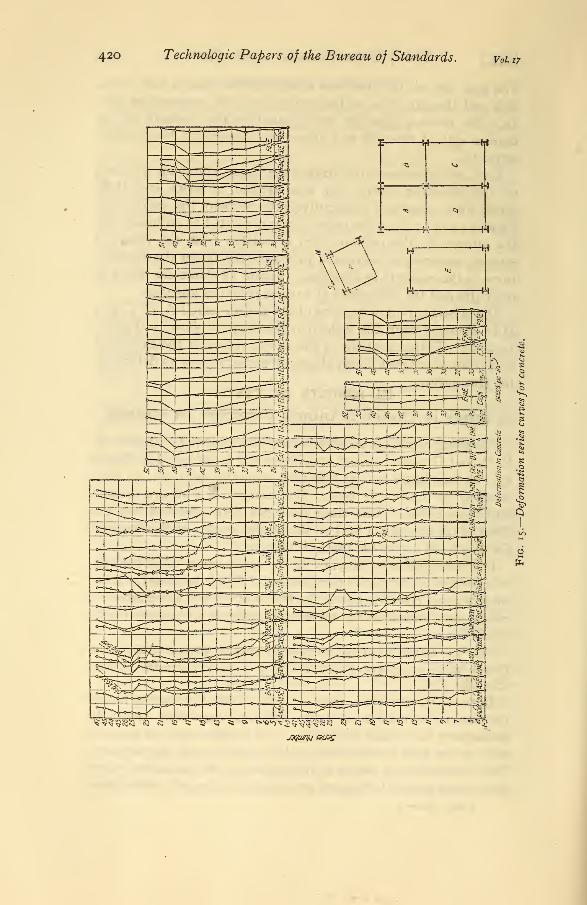
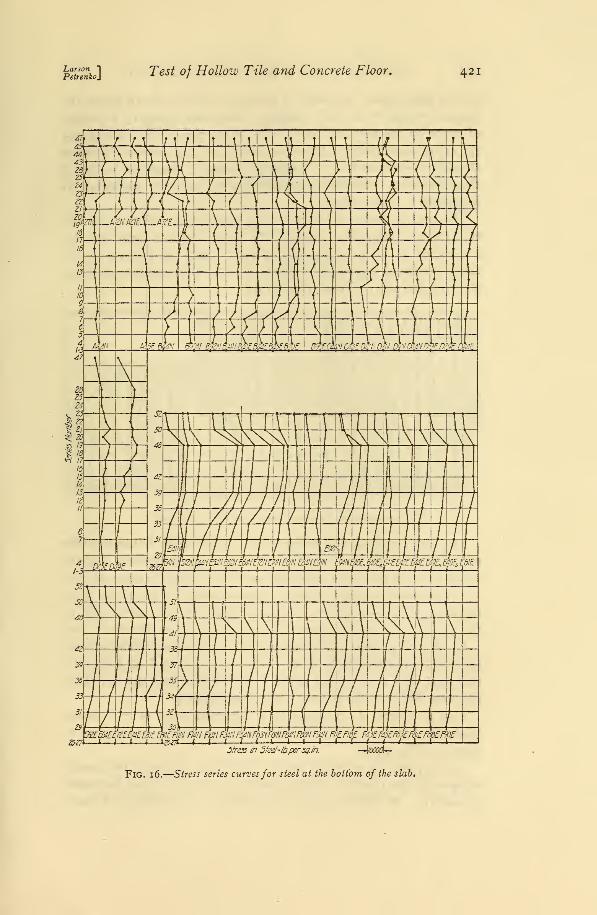
Figures 15 to 17 show the series numbers plotted as ordinates and
the stresses in the reinforcement calculated from the observed
stresses, assuming a modulus of 30,000,000 lbs./in.2 or the deforma-
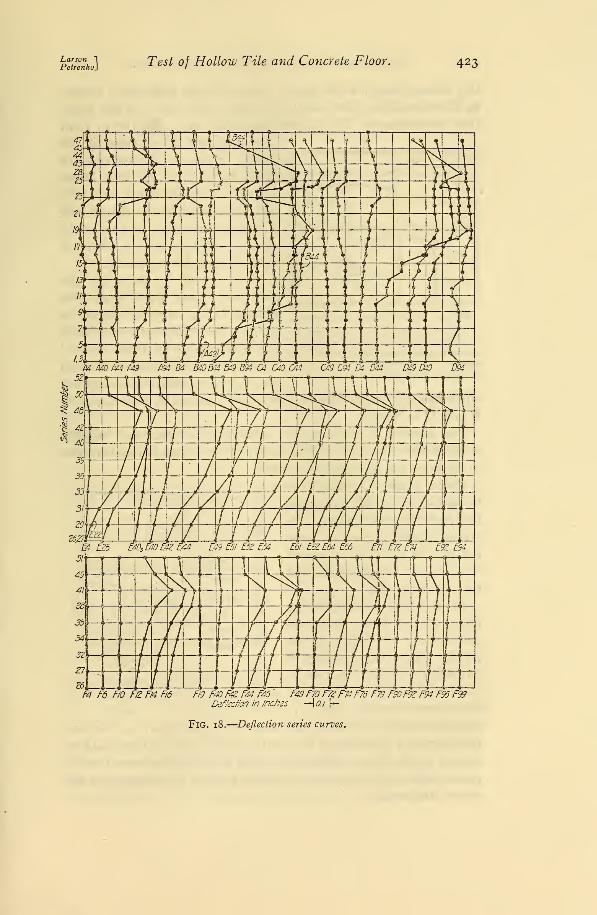
tions in the concrete as abscissas. Figure 18 shows the series as
ordinates and the deflections at various points as abscissas.
The elastic curves of sections of the slab in panels A, B, C, and
D as obtained from the deflection readings are shown in Figures
19 to 22. Dotted portions of the curves represent the estimated
curvature where insufficient observations were made to determine
the true curve.
III. RESULTS OF TESTS.
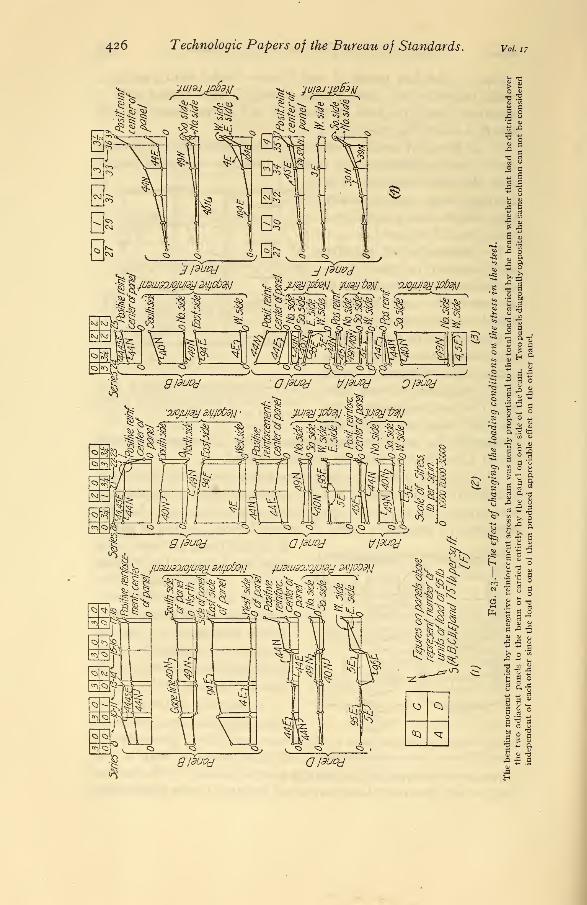
1. EFFECT OF CHANGE IN LOADING CONDITIONS ON STRESSES.
The effect of change in area loaded was observed on panels A,
B, C, and D under various conditions and is indicated in Figure
2$. In this figure and in this discussion the term unit of load,
meaning 95 lbs. /ft.2
, is used. The changes of load are divided
into three cases. These three cases are here described and the
effect of the changes of load on the tensile stresses at the center of
the panel and across the beams is discussed.
In the discussion an increase in the stress refers to an increase
in tension or a decrease in compression. This is because the mainsubject under consideration is the tensile stress and a decrease in a
compressive stress has the same significance as an increase in the
tensile stress.
Case 1.—Panel B carried a constant load of 3 units while panel
D was being successively loaded with 1, 2, 3, and 4 units of load.
(See Fig. 23-1.)
In panel B, which was under constant load, the stresses in the
positive reinforcement in both directions increased gradually
throughout the change in loading. The increase was 100 per cent
and 50 per cent in the short and the long spans, respectively.
The stresses in the negative reinforcement on the sides farther
away from panel D remained practically unchanged, while those
24051°—23 3
420 Technologic Papers of the Bureau of Standards. vol. i7
hT^1%32—lIl
i*p
*1c=>
'% 3?
S% K* ^ Ii &> §*%
H
w
H
M M
<U
w
—
-1*1.
•£.
jgqutyj «?4S£
Larson "1
PetrenkojTest of Hollow Tile and Concrete Floor. 421
Stress in Steel-lbpersq.in -^joood*-
FiG. 16.
—
Stress series curvesfor steel at the bottom of the slab.
422 Technologic Papers of the Bureau of Standards. vol. it
on the sides nearer to panel D (the east and the south sides) in-
creased regularly at each loading. The corresponding increases
of stress on the east and south sides of the panel were 92 and 185
per cent, respectively. However, not all of the increase in stress
should be attributed to the loading of panel D, since the length of
time between successive operations was probably sufficient to
introduce a "time effect."
The results stated in the preceding paragraph indicate that the
two panels diagonally opposite the same column could not beconsidered as independent of each other, since the load on one of
them produced appreciable effect on both the negative and the
positive moments of the other panel.
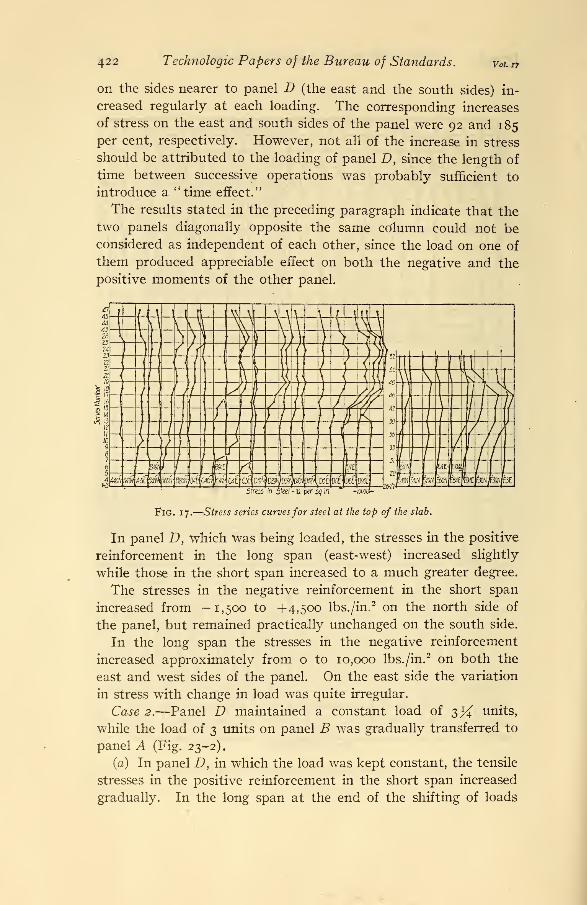
per sq. in
Fig. 17.
—
Stress series curvesfor steel at the top of the slab.
In panel D, which was being loaded, the stresses in the positive
reinforcement in the long span (east-west) increased slightly
while those in the short span increased to a much greater degree.
The stresses in the negative reinforcement in the short span
increased from -1,500 to +4,500 lbs./in.2 on the north side of
the panel, but remained practically unchanged on the south side.
In the long span the stresses in the negative reinforcement
increased approximately from o to 10,000 lbs./in.2 on both the
east and west sides of the panel. On the east side the variation
in stress with change in load was quite irregular.
Case 2.—Panel D maintained a constant load of 3% units,
while the load of 3 units on panel B was gradually transferred to
panel A (Fig. 23-2).
(a) In panel D, in which the load was kept constant, the tensile
stresses in the positive reinforcement in the short span increased
gradually. In the long span at the end of the shifting of loads
Larson ~\
Petrenko]Test of Hollow Tile and Concrete Floor. 423
fW\ M9 A94 319 B94 C4 C40 C44 C49 C94 D4 D44 D49 DdO D94
& £25 E5I E5Z EM E6I E6Z E6-1 E60 Ell E7Z E74 E9Z E94
F4 F6 FIO FlZ FI4 F/6 Fi9 F40 F4Z F44 F46 F49 F70 F7Z F74 F76 F79 F90F9Z F94 F96 F99Deflection in inches —
] 0.1 |—
Fig. 18.—Deflection series curves.
424 Technologic Papers of the Bureau of Standards. Vol. 17
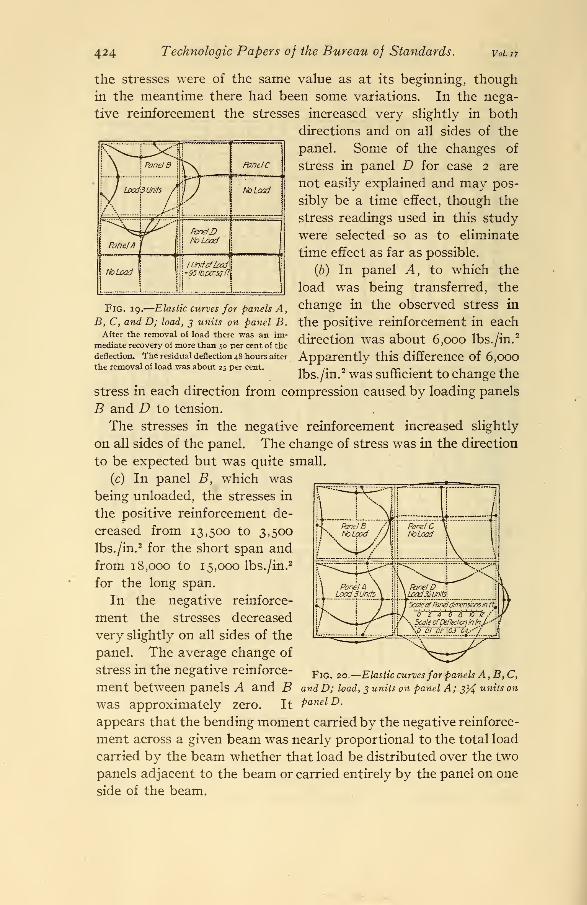
Fig. 19.
—
Elastic curves for panels A,
B, C, and D; load, 3 units on panel B.After the removal of load there was an im-
mediate recovery of more than 50 per cent of the
deflection. The residual deflection 48 hours after
the removal of load was about 25 per cent.
the stresses were of the same value as at its beginning, though
in the meantime there had been some variations. In the nega-
tive reinforcement the stresses increased very slightly in both
directions and on all sides of the
panel. Some of the changes of
stress in panel D for case 2 are
not easily explained and may pos-
sibly be a time effect, though the
stress readings used in this study
were selected so as to eliminate
time effect as far as possible.
(b) In panel A, to which the
load was being transferred, the
change in the observed stress in
the positive reinforcement in each
direction was about 6,000 lbs./in.2
Apparently this difference of 6,000
lbs./in.2 was sufficient to change the
stress in each direction from compression caused by loading panels
B and D to tension.
The stresses in the negative reinforcement increased slightly
on all sides of the panel. The change of stress was in the direction
to be expected but was quite small.
(c) In panel B, which was
being unloaded, the stresses in
the positive reinforcement de-
creased from 13,500 to 3,500
lbs./in. 2 for the short span and
from 18,000 to 15,000 lbs./in.2
for the long span.
In the negative reinforce-
ment the stresses decreased
very slightly on all sides of the
panel. The average change of
stress in the negative reinforce-lG> ?o.-Efarifc curvesfor panels A,B,C,
ment between panels A and B and D; load, 3 units on panel A; 3% units on
was approximately zero. It PanelD -
appears that the bending moment carried by the negative reinforce-
ment across a given beam was nearly proportional to the total load
carried by the beam whether that load be distributed over the two
panels adjacent to the beam or carried entirely by the panel on one
side of the beam.
S^-
Larson "I
Peircnko] Test of Hollow Tile and Concrete Floor. 425
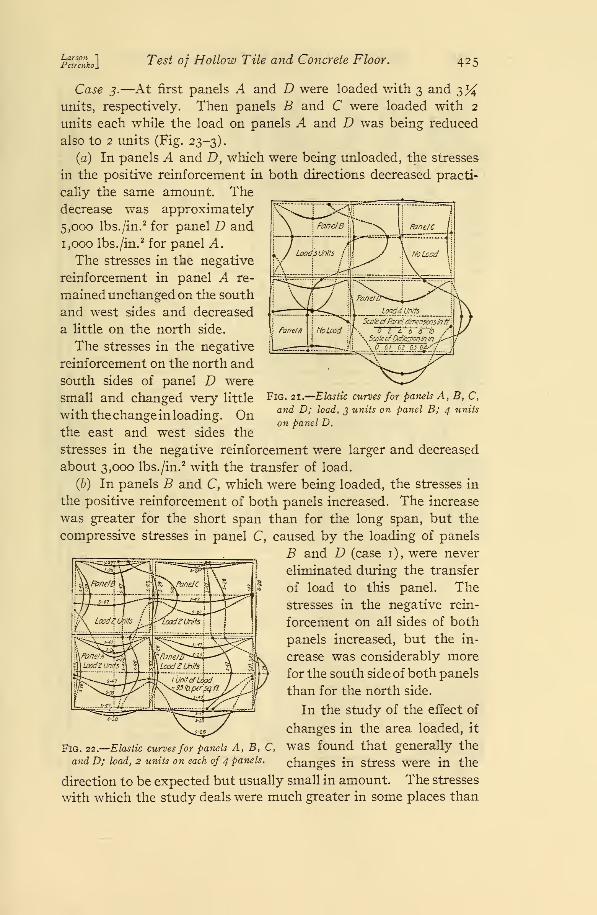
Fig. 31.
—
Elastic curves for panels A, B, C,
and D; load, 3 units on panel B; 4 units
on panel D.
Case 3.—At first panels A and D were loaded with 3 and 3^units, respectively. Then panels B and C were loaded with 2
units each while the load on panels A and D was being reduced
also to 2 units (Fig. 23-3).
(a) In panels A and D, which were being unloaded, the stresses
in the positive reinforcement in both directions decreased practi-
cally the same amount. Thedecrease was approximately
5,000 lbs. /in.2 for panel D and
1,000 lbs. /in.2 for panel A.
The stresses in the negative
reinforcement in panel A re-
mained unchanged on the south
and west sides and decreased
a little on the north side.
The stresses in the negative
reinforcement on the north and
south sides of panel D were
small and changed very little
with the change in loading. Onthe east and west sides the
stresses in the negative reinforcement were larger and decreased
about 3,000 lbs. /in.2 with the transfer of load.
(b) In panels B and C, which were being loaded, the stresses in
the positive reinforcement of both panels increased. The increase
was greater for the short span than for the long span, but the
compressive stresses in panel C, caused by the loading of panels
B and D (case i), were never
eliminated during the transfer
of load to this panel. The
stresses in the negative rein-
forcement on all sides of both
panels increased, but the in-
crease was considerably more
for the south side of both panels
than for the north side.
In the study of the effect of
changes in the area loaded, it
was found that generally the
changes in stress were in the
direction to be expected but usually small in amount. The stresses
with which the study deals were much greater in some places than
:%. Lead£ Units jJ^boadZUnits\ { \
i^rPanel,
LoadI Unitsj
lUnitofLdad J /'%Vlhper'sqft.
Lg.—fcf&Ui—„.JlL„x ~ZlZT7f
Fig. 22.
—
Elastic curves for panels A, B, C,
and D; load, 2 units on each of 4 panels.
426 Technologic Papers of the Bureau of Standards. vol n
•JUWJDDdtf
«£ 03 c? 8^ || I ^VtitS ^a>
<o Q
^ ^c
3 g °•g t g
IS "3
*i go81sa j= -2
<U O 4)
s-g|
a a «
E 3 °
2 ;* ti
'•5 £>
1duty 42 -a_g
p°t%nko] Test of Hollow Tile and Concrete Floor. 427
in others, but no reason for this difference was apparent. The
beams around the edges of the panels apparently offered so little
resistance to torsion that the stresses across these beams, due to
negative moments, were little affected by transfer of load between
adjacent panels.
Panel E.—Panel E was far enough away from the other panels
tested that it was not affected by the loads on them. (See Figs. 2
and 23-4.) It was loaded, successively, with 1, 2, 3, and 3% (332
lbs. /ft.2) units of load. The stresses in positive reinforcement
increased gradually from o to 24,000 and 10,000 lbs. /in.2 in short
span and long span, respectively.
The maximum stress in the positive reinforcement in the long
span (11,000 lbs./in.2) was found, however, not in the center but
near the quarter point of the middle strip, which observation
agrees with the subsequent mathematical discussion. 1
Maximum stresses in the negative reinforcement were about
4,000 and 6,500 lbs./in.2 in the short (north and south sides,
respectively) and 12,500 and 14,500 lbs./in.2 in the long span (east
and west sides, respectively).
Panel F.—This panel was loaded with increments of about 71
up to 284 lbs./ft.2
(See Fig. 23-4.)
The maximum stresses in the positive reinforcement were about
8,000 and 11,000 lbs./in.2 in the long and the short spans, respec-
tively.
The stress in the negative reinforcement at the west side of the
panel was low (2,500 lbs./in.2). This was to be expected, since
the slab was not anchored to the wall and, therefore, free to
rotate with its support. That such rotation actually took place
was indicated by the opening of a crack between the slab and the
wall as the test progressed.
2. EFFECT OF TIME UNDER LOAD ON STRESSES.
Due to shortage of labor and sometimes of loading material
several delays occurred which introduced time effects and the
results are considerably complicated by such effects. For study
of the effects of the duration of the loaded condition on the
deformation in the concrete and in the reinforcement there are
available the cases in which panel E was loaded to 332 lbs./ft.3
for 92 hours and panel F to 284 lbs./ft.2for 20 hours. Although
there was some variation in temperature during the time under
1 Westergaard and Slater, ' 'Moments and stresses in slabs," 17, Proc. Am. Cone. Inst., p. 433; 192 1.
428 Technologic Papers of the Bureau of Standards. vol. n
consideration, an examination of the data indicates that the
effect of temperature changes on the deformations had been
removed by the temperature corrections.
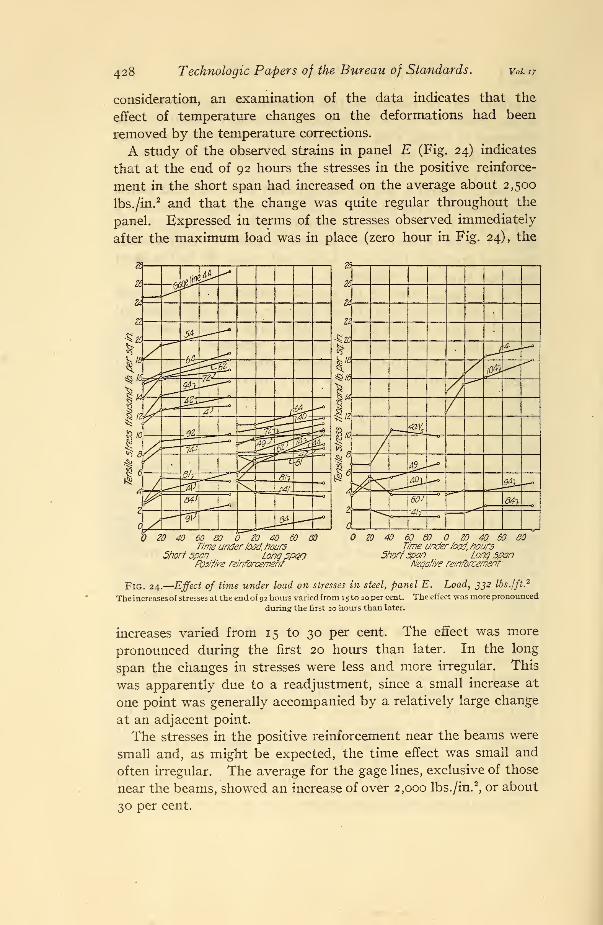
A study of the observed strains in panel E (Fig. 24) indicates
that at the end of 92 hours the stresses in the positive reinforce-
ment in the short span had increased on the average about 2,500
lbs./in.2 and that the change was quite regular throughout the
panel. Expressed in terms of the stresses observed immediately
after the maximum load was in place (zero hour in Fig. 24), the
60 80 20 40 60Time under load, hours
Short span Long spanPosif/Ve reinforcement
60 SO ZO 40, 60Time under load, hours
Shortspan long spanNeqafiVe reinforcement'
Fig. 24.
—
Effect of time under load on stresses in steel, panel E. Load, 332 lbs./ft.2
The increases of stresses at the endof 92 hours varied from 15 to 20 per cent. The effect was more pronounced
during the first 20 hours than later.
increases varied from 15 to 30 per cent. The effect was more
pronounced during the first 20 hours than later. In the long
span the changes in stresses were less and more irregular. This
was apparently due to a readjustment, since a small increase at
one point was generally accompanied by a relatively large change
at an adjacent point.
The stresses in the positive reinforcement near the beams were
small and, as might be expected, the time effect was small and
often irregular. The average for the gage lines, exclusive of those
near the beams, showed an increase of over 2,000 lbs./in.2
, or about
30 per cent.
Larson 1
Petrenkoj Test of Hollow Tile and Concrete Floor. 429
For the negative reinforcement the average increase for sections
of maximum stress was about 3,000 lbs. /in.2
, or 25 per cent, in
the direction of the short span and nearly 5,000 lbs. /in.2
, or 35per cent, in the direction of the long span.
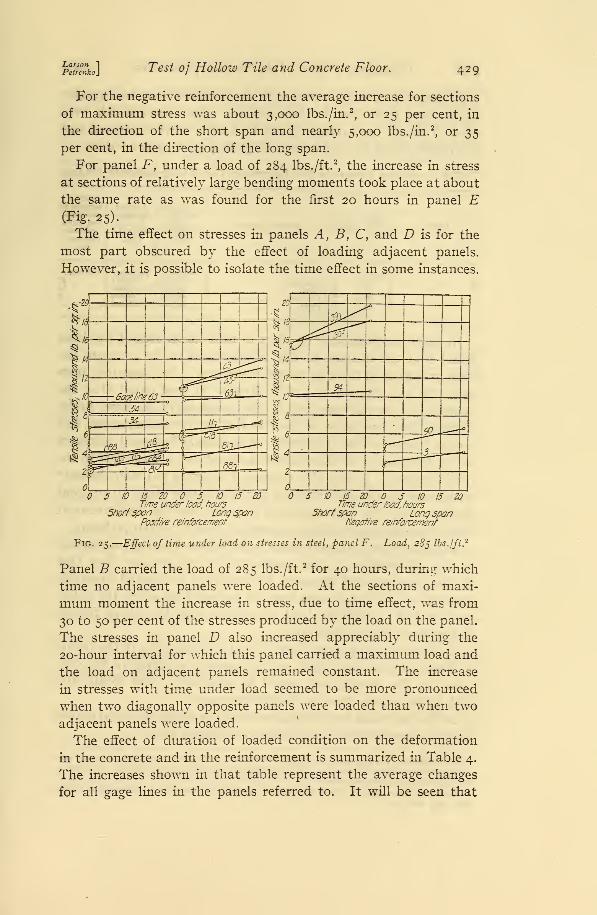
For panel F, under a load of 284 lbs./ft.2
, the increase in stress
at sections of relatively large bending moments took place at about
the same rate as was found for the first 20 hours in panel E(Fig. 25).
The time effect on stresses in panels A, B, C, and D is for the
most part obscured by the effect of loading adjacent panels.
However, it is possible to isolate the time effect in some instances.
5 10 15 20 5 10 15 20Time under Iodd, hours
5horf spun Long spanPosifi/e reinforcement
\5 20 OS 10 15 20Time under food, hours
Short span Long spanNegative reinforcement
Fig. 25.
—
Effect of time under load on stresses in steel, panel F. Load, 285 lbs./ft.2
Panel B carried the load of 285 lbs./ft.2 for 40 hours, during which
time no adjacent panels were loaded. At the sections of maxi-
mum moment the increase in stress, due to time effect, was from
30 to 50 per cent of the stresses produced by the load on the panel.
The stresses in panel D also increased appreciably during the
20-hour interval for which this panel carried a maximum load and
the load on adjacent panels remained constant. The increase
in stresses with time under load seemed to be more pronounced
when two diagonally opposite panels were loaded than when two
adjacent panels were loaded.
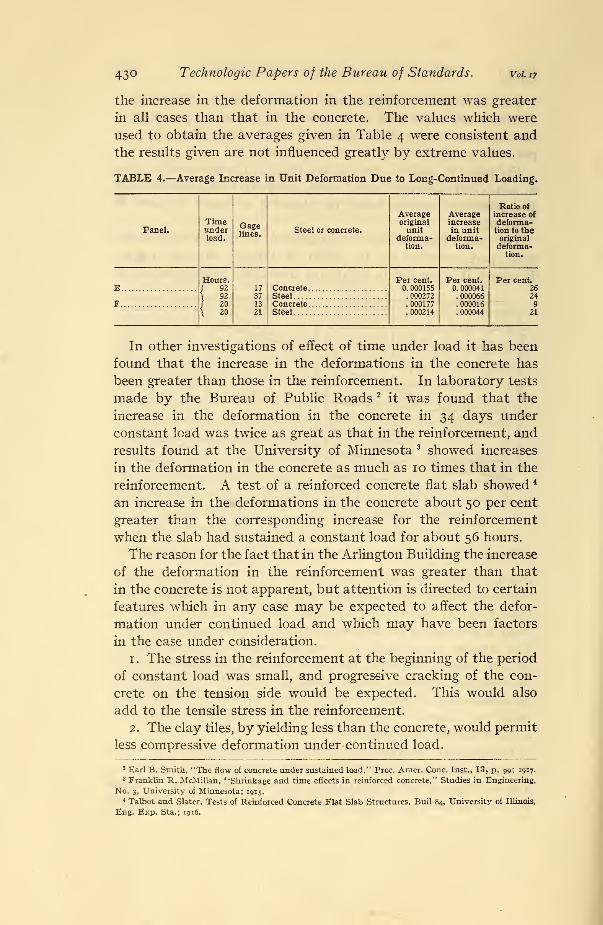
The effect of duration of loaded condition on the deformation
in the concrete and in the reinforcement is summarized in Table 4.
The increases shown in that table represent the average changes
for all gage lines in the panels referred to. It will be seen that
43° Technologic Papers of the Bureau of Standards. vol. 17
the increase in the deformation in the reinforcement was greater
in all cases than that in the concrete. The values which were
used to obtain the averages given in Table 4 were consistent andthe results given are not influenced greatly by extreme values.
TABLE 4.—Average Increase in Unit Deformation Due to Long-Continued Loading.
Ratio ofAverage Average increase of
Time Gagelines.
original increase deforma-Panel. under Steel or concrete. unit in unit tion to the
load. deforma- deforma- originaltion. tion. deforma-
tion.
Hours. Per cent. Per cent. Per cent.E f 92
\ 92
/ 20\ 20
17371321
Concrete 0. 000155. 000272. 000177. 000214
0. 000041. 000066.000016.000044
26Steel 24
F Concrete 9Steel 21
In other investigations of effect of time under load it has been
found that the increase in the deformations in the concrete has
been greater than those in the reinforcement. In laboratory tests
made by the Bureau of Public Roads 2it was found that the
increase in the deformation in the concrete in 34 days under
constant load was twice as great as that in the reinforcement, andresults found at the University of Minnesota 3 showed increases
in the deformation in the concrete as much as 10 times that in the
reinforcement. A test of a reinforced concrete flat slab showed 4
an increase in the deformations in the concrete about 50 per cent
greater than the corresponding increase for the reinforcement
when the slab had sustained a constant load for about 56 hours.
The reason for the fact that in the Arlington Building the increase
of the deformation in the reinforcement was greater than that
in the concrete is not apparent, but attention is directed to certain
features which in any case may be expected to affect the defor-
mation under continued load and which may have been factors
in the case under consideration.
1
.
The stress in the reinforcement at the beginning of the period
of constant load was small, and progressive cracking of the con-
crete on the tension side would be expected. This would also
add to the tensile stress in the reinforcement.
2. The clay tiles, by yielding less than the concrete, would permit
less compressive deformation under continued load.
2 Earl B. Smith, "The flow of concrete under sustained load," Proc. Amer. Cone. Inst., 13, p. 99; 1917.
3 Franklin R. McMillan, "Shrinkage and time effects in reinforced concrete," Studies in Engineering,.
No. 3, University of Minnesota; 1915.
* Talbot and Slater, Tests of Reinforced Concrete Flat Slab Structures, Bull 84, University of Illinois,
Eng. Exp. Sta.; 1916.
Larson 1
PetrenkoJ Test of Hollow Tile and Concrete Floor. 431
The relative importance of these two factors would depend
upon the percentage of reinforcement and the relative plasticity
of the concrete and tile. The percentage of reinforcement in
these slabs was so small and the position of the negative reinforce-
ment so low 5 that the large increases in tensile deformations were
to be expected.
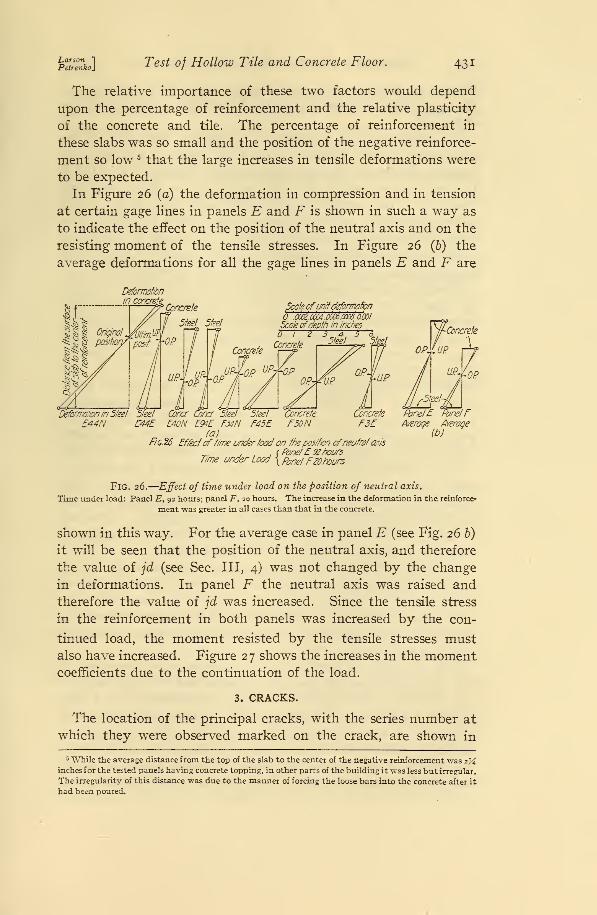
In Figure 26 (a) the deformation in compression and in tension
at certain gage lines in panels E and F is shown in such a way as
to indicate the effect on the position of the neutral axis and on the
resisting moment of the tensile stresses. In Figure 26 (b) the
average deformations for all the gage lines in panels E and F are
Scaleofunitdeformation
Deformation in Steel Sfeel
£44N E44ECora: Conor 'Steel
'
Steel
E40N E&E F34N F45E(a)
f/c.26 Effectoftime under toadon the position ofneutral axis
_ , , . r Pone!'£'92'hoursTime under Lood \Ponel Ftohours
Fig. 26.
—
Effect of time under load on the position of neutral axis.
Time under load: Panel E, 92 hours; panel F, 20 hours. The increase in the deformation in the reinforce-
ment was greater in all cases than that in the concrete.
shown in this way. For the average case in panel E (see Fig. 26 b)
it will be seen that the position of the neutral axis, and therefore
the value of jd (see Sec. Ill, 4) was not changed by the change
in deformations. In panel F the neutral axis was raised andtherefore the value of jd was increased. Since the tensile stress
in the reinforcement in both panels was increased by the con-
tinued load, the moment resisted by the tensile stresses mustalso have increased. Figure 27 shows the increases in the momentcoefficients due to the continuation of the load.
3. CRACKS.
The location of the principal cracks, with the series number at
which they were observed marked on the crack, are shown in
5 While the average distance from the top of the slab to the center of the negative reinforcement was 2%inches for the tested panels having concrete topping, in other parts of the building it was less but irregular.
The irregularity of this distance was due to the manner of forcing the loose bars into the concrete after it
had been poured.
432 Technologic Papers of the Bureau of Standards. Vol.17
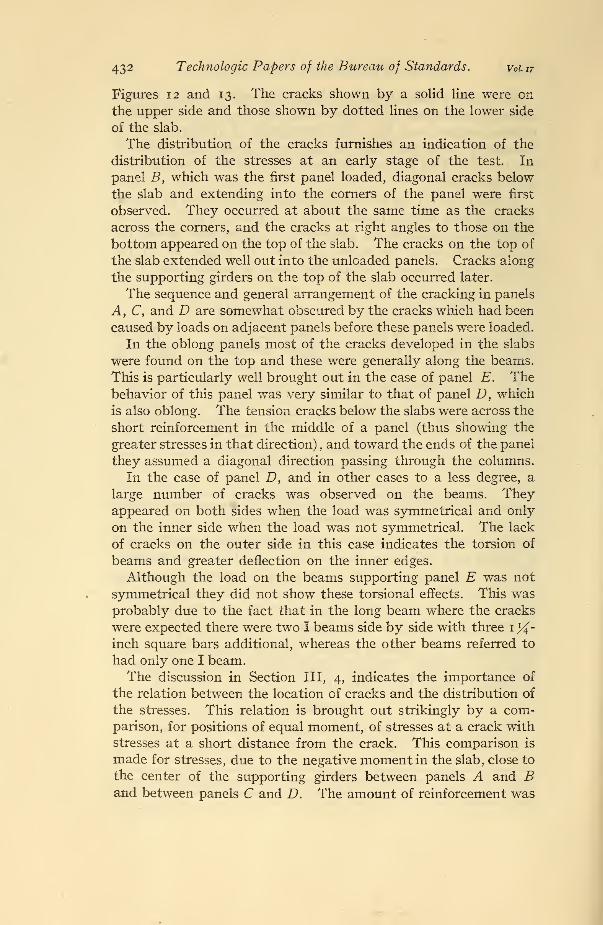
Figures 12 and 13. The cracks shown by a solid line were on
the upper side and those shown by dotted lines on the lower side
of the slab.
The distribution of the cracks furnishes an indication of the
distribution of the stresses at an early stage of the test. In
panel B, which was the first panel loaded, diagonal cracks below
the slab and extending into the corners of the panel were first
observed. They occurred at about the same time as the cracks
across the corners, and the cracks at right angles to those on the
bottom appeared on the top of the slab. The cracks on the top of
the slab extended well out into the unloaded panels. Cracks along
the supporting girders on the top of the slab occurred later.
The sequence and general arrangement of the cracking in panels
A, C, and D are somewhat obscured by the cracks which had been
caused by loads on adjacent panels before these panels were loaded.
In the oblong panels most of the cracks developed in the slabs
were found on the top and these were generally along the beams.
This is particularly well brought out in the case of panel E. Thebehavior of this panel was very similar to that of panel D, which
is also oblong. The tension cracks below the slabs were across the
short reinforcement in the middle of a panel (thus showing the
greater stresses in that direction) , and toward the ends of the panel
they assumed a diagonal direction passing through the columns.
In the case of panel D, and in other cases to a less degree, a
large number of cracks was observed on the beams. Theyappeared on both sides when the load was symmetrical and only
on the inner side when the load was not symmetrical. The lack
of cracks on the outer side in this case indicates the torsion of
beams and greater deflection on the inner edges.
Although the load on the beams supporting panel E was not
symmetrical they did not show these torsional effects. This wasprobably due to the fact that in the long beam where the cracks
were expected there were two I beams side by side with three 1%-inch square bars additional, whereas the other beams referred to
had only one I beam.The discussion in Section III, 4, indicates the importance of
the relation between the location of cracks and the distribution of
the stresses. This relation is brought out strikingly by a com-parison, for positions of equal moment, of stresses at a crack with
stresses at a short distance from the crack. This comparison is
made for stresses, due to the negative moment in the slab, close to
the center of the supporting girders between panels A and Band between panels C and D. The amount of reinforcement was
p%rmko] Test of Hollow Tile and Concrete Floor. 433
the same for all these positions and the distance from the top of
slab to the center of steel was about 2*4 inches. The thicknesses
of the slabs in these panels were: A, 5.79 inches; B, 5.58 inches;
C, 6.83 inches, D, 6.81 inches. The thicknesses of slabs on whichcomparisons are based were nearly enough the same that the
comparisons may be made without corrections for the difference
in slab thickness. The stresses and the gage lines at which they
occurred are shown in Table 6.
From this study it will be obvious that in a test of this kind
the deformations, though measured at positions of maximummoment, will fall far short of showing the maximum stresses,
unless gage lines are located across or very close to the principal
cracks. Even then the actual stresses may be considerably
higher than those indicated by the strain-gage measurements on
account of considerable gage length (8 inches) as compared with
the portion of bar where high stresses are developed.
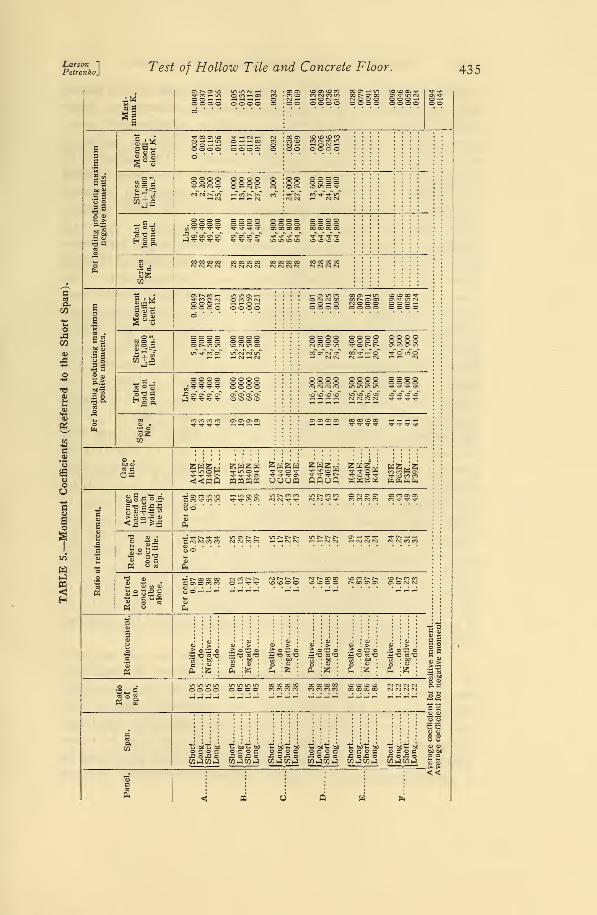
4. STRESSES AND MOMENTS.
In Table 5 and Figures 27 to 30 are given the values of momentcoefficients calculated according to the formula
K = A sjd(fs + f' s)jWb.
where K — the moment coefficient.
A s = total sectional area in square inches of reinforcement
extending in one direction of the panel.
/s= observed stresses in steel, lbs. /in. 2
/'s = estimated dead load stress of 1,000 lbs. /in.2 The
exact value is not known, but it is small and for
percentage of reinforcement used may be considered
about 1,000 lbs. /in.2
j = ratio of lever arm of resisting couple to depth d.
d = the depth in inches from the compression surface to
the center of the tension reinforcement.
W = total dead and live load on the panels, in pounds,
multiplied by the ratio of the product of the clear
spans to the product of the spans center to center
of columns. This would be the load on the area
bounded by the edges of girders if the load were
uniformly distributed and all aisles eliminated.
b = short panel length, in inches between edges of girders.
It will be noted that the coefficients are given in terms of the
short span. This permits a direct comparison of moments in the
two directions and has been used in other publications which are
concerned with this question. The load used for computing the
moment coefficients is somewhat less than the live and dead load
434 Technologic Papers of the Bureau of Standards. Vol. it
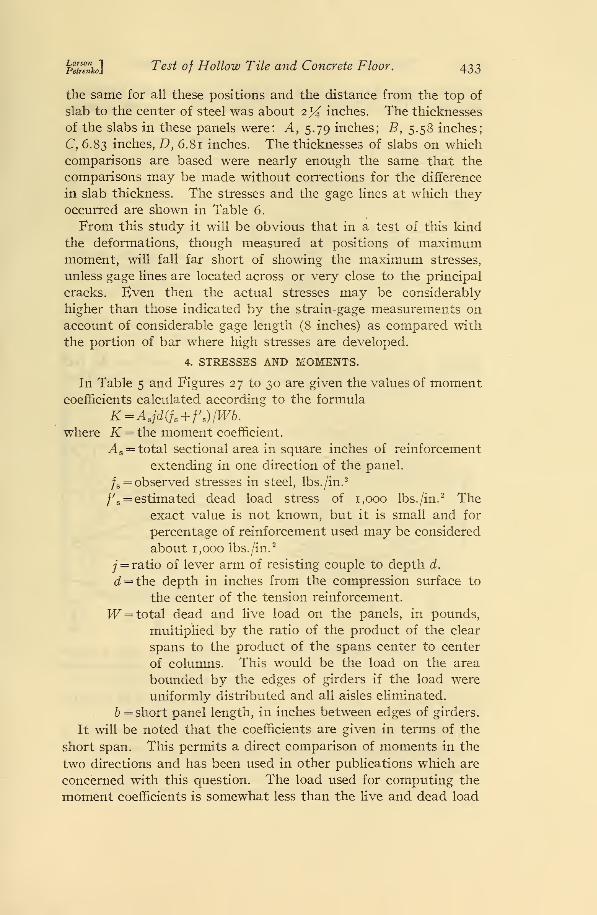
actually on the slab and may be termed the equivalent uniformlydistributed load, although it is not known how close the approxi-
/tpersyft
Fig. 27.
—
The effect of time under load on
moment coefficients.
250 3SO /SO. '.- Z5QLoad, Ik per sq.ft.
Panel£ r vPanelB
ISO
Fig. 28.
—
The effect of increase of load on
moment coefficients
.
mation is. The necessity for the correction arises from the fact
that the presence of the aisles has a tendency to throw the resultant
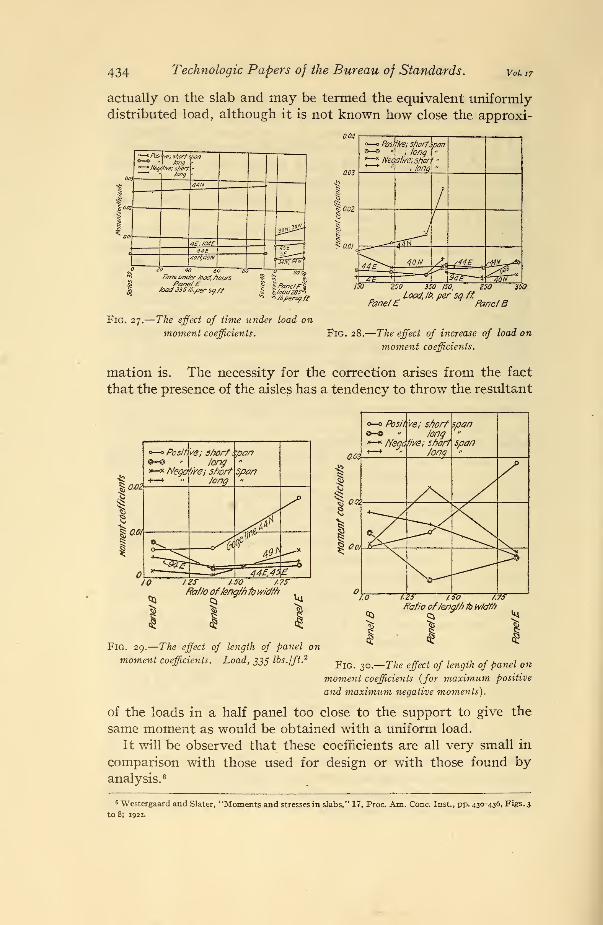
JIS j.SO 17?Ratio oflengthtowidth
10
05
Fig. 29.
—
The effect of length of panel on
moment coefficients. Load, 335 lbs./ft.2
Fd-
!
Ratio oflength lb w/dtn
Fig. 30.
—
The effect of length of panel on
moment coefficients {for maximum positive
and maximum negative moments).
of the loads in a half panel too close to the support to give the
same moment as would be obtained with a uniform load.
It will be observed that these coefficients are all very small in
comparison with those used for design or with those found byanalysis. 6
6 Westergaard and Slater, ' 'Moments and stresses in slabs," 17, Proc. Am. Cone. Inst., pp. 430-436, Figs. 3.
to 8; 1921.
'LarsonPetrenko_ Test of Hollow Tile and Concrete Floor. 435
•<f co i-i inOO — rH© oo o
00 <3\ ~*lftoo r- cr* oocm © © © §2OO
II" 2
C >
3fl
a*09
t:o
oo
o
E
a-
I!
= < Ma®-
co©CM 1-1oo
© © © COco cm co mh © cm i-io©o©
© © ©© o oCM CM -3-
cm cm c- m hi
© © © ©o © © o© in © t^
o a
©oo© o©o©
© © © I
00 00 00 00
© © © ©
siCO
cm cm cq cm
oSg
^- fo <y> oo© © © —
i
© ©CO © ©o<
§
-i3 i wpal;jo
m cm cm in
© © © ©o© © ©
c &
co co co co c> o cj> <ti
CO
£5
© CM CM 00r-O — ©©©© ©
© © © ©© © O OCM CM C\ IT)
888;
OOOO
O^O^OC^ 00 00 VO 00 ^—'—* t—* t—I
KK^M Swsk gwgw SSScxi ^S5d wfc^s^i- m © W Trin©Tj- 2lTj-OTf «*°K it22 nrtKcTj-^-Tj-t^ *3" Tj- Tl- C7l "^"Tj-ii-O *> *T^^ '^•©''i-i^" i— JO n c*^
<j<fqQ mmmw ooom flflofl hwhw p=,f±«*c=<
>®OT»
«SS~a is
o^c-p oo co ot ati* Tf pinnn
V, <D 03 Ou0 ^^ rt rtrirt,
11El
>o~o >oSo > 0:3 © ,> es © .> ©3 © .2 © 3 o
ft :s ft :s ft :s ft :fc ft :g ft :fc
©oo© o©o© nmr, co oc oo oo oo CM CM CM CM~
2 e 2 socos 2 2 5= 2 C 2 C 2C«s 2C2 C 2 C 2COrfCOtJ C0i^C0>4 CQrfCOi^ COiJCOh-? COm-COm1
C0>-)C0
i- Mu boosoc£0X0
436 Technologic Papers of the Bureau of Standards. vol. it
It should be remembered, however, that some of the panels
were not loaded so as to produce maximum moments in somecritical sections. Panel C was not loaded so as to produce maxi-
mum positive moments and panels E and F were not loaded so
as to give the maximum negative moments. The values of Kfor gage lines E40N and E4E would probably have been doubled
by loading the adjacent panels. The experimental momentcoefficients for a concrete structure are generally small, particu-
larly when the test is not carried to destruction. The total
moment accounted for by the measured stresses in this test varies
from about 0.03 to over 0.05Wb for various conditions of loading.
These values compare favorably with results of other tests. Thelower the stresses and the smaller the percentage of reinforce-
ment the smaller are the coefficients. Under such conditions the
concrete carries a relatively large proportion of the tensile
stresses, and the steel stresses, upon which the coefficients are
based, are therefore reduced. The fact that the concrete did
carry a considerable proportion of the stress is brought out
clearly by a comparison of the stresses in gage lines at cracks-
and at a short distance from the cracks. (See Table 6.) That
the formation of a crack across a gage line affects the stress maybe seen in Figure 17. Between series 15 and 16 the load on
panel D was increased from 190 to 285 lbs. /ft.2, or 50 per cent,
whereas the stresses in gage lines D5E, D6E, D7E, and D8E in-
creased from 2,500 to 8,200 lbs./in.2
, or 228 per cent. Figure 12
shows that a crack occurred within or close to these gage lines
between series 15 and 16. Due to this same change in load the
stresses in gage lines D29N, D39N, and D49N actually decreased
about 12 per cent. This decrease was undoubtedly due to the
formation of a crack in panel C which permitted the rotation of
the girder and relieved the stresses in panel D. Gage line C40Nin panel C, which was crossed by this crack, showed the expected
increase in stress with load.
The coefficients as they appear in the table are not proposed
for use in design. Observed stresses are always too small for
two reasons. The observed deformation is the mean over the
full gage length and is less than the maximum value at the
crack. The concrete may not crack immediately and will there-
fore carry part of the tensile stresses which may later be trans-
ferred to the steel. However, the coefficients here given may be
of value in showing the relative amounts of bending moment
Larson ~\
Peirenko]Test of Hollow Tile and Concrete Floor. 437
carried in the directions of the short and the long spans, respec-
tively, and also the proportions carried at various sections.
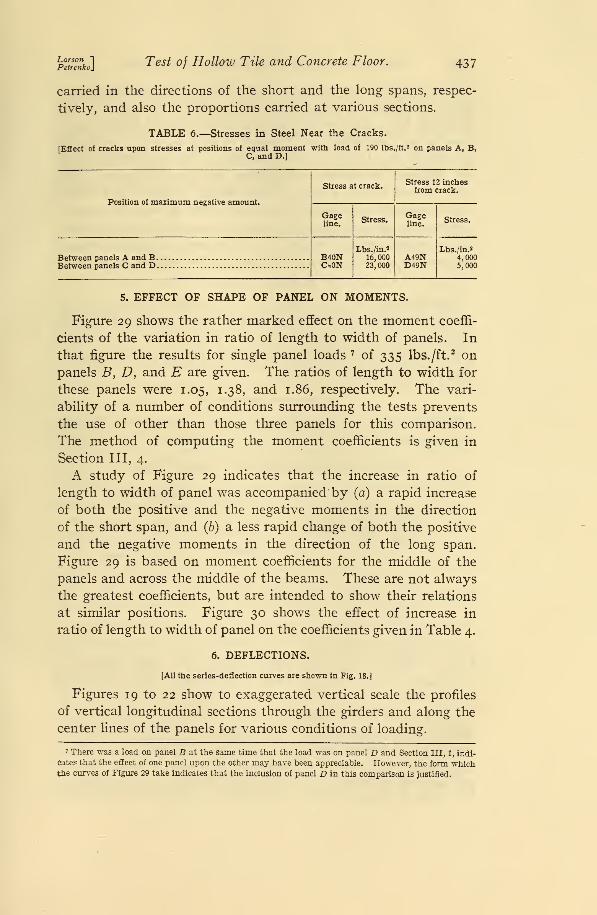
TABLE 6.—Stresses in Steel Near the Cracks.
[Effect of cracks upon stresses at positions of equal moment with load of 190 lbs./ft. 2 on panels A, B,C, and D.]
Position of maximum negative amount.
Between panels A and B.Between panels C and D.
Stress at crack.
Gageline.
B40NCtON
Stress.
Lbs./in.3
16,00023,000
Stress 12 inchesfrom crack.
Gageline.
A49ND49N
Stress.
Lbs./in.«
4,0005,000
5. EFFECT OF SHAPE OF PANEL ON MOMENTS.
Figure 29 shows the rather marked effect on the moment coeffi-
cients of the variation in ratio of length to width of panels. In
that figure the results for single panel loads 7 of 335 lbs./ft.2 on
panels B, D, and E are given. The ratios of length to width for
these panels were 1.05, 1.38, and 1.86, respectively. The vari-
ability of a number of conditions surrounding the tests prevents
the use of other than those three panels for this comparison.
The method of computing the moment coefficients is given in
Section III, 4.
A study of Figure 29 indicates that the increase in ratio of
length to width of panel was accompanied by (a) a rapid increase
of both the positive and the negative moments in the direction
of the short span, and (6) a less rapid change of both the positive
and the negative moments in the direction of the long span.
Figure 29 is based on moment coefficients for the middle of the
panels and across the middle of the beams. These are not always
the greatest coefficients, but are intended to show their relations
at similar positions. Figure 30 shows the effect of increase in
ratio of length to width of panel on the coefficients given in Table 4.
6. DEFLECTIONS.
[All the series-deflection curves are shown in Fig. 18.]
Figures 19 to 22 show to exaggerated vertical scale the profiles
of vertical longitudinal sections through the girders and along the
center lines of the panels for various conditions of loading.
7 There was a load on panel B at the same time that the load was on panel D and Section III, 1, indi-
cates that the effect of one panel upon the other may have been appreciable. However, the form whichthe curves of Figure 29 take indicates that the inclusion of panel D in this comparison is justified.
438 Technologic Papers of the Bureau of Standards.. vol. n
The results of measurements showed that deflections diminished
with the increase of the ratio of sides (panels B, D, and E). Butit should be noted that the panels tested are not directly com-
parable, as they differ in thickness (5.58, 6.81, and 7.30 inches
for panels B, D, and E, respectively). The supporting beamsare different in general dimensions and reinforcement. Also,
while panels B and E were loaded singly, panel D was loaded
simultaneously with panel B, and this may account for certain
influence on the stresses and deflections in panel D, as two diago-
nally opposite panels can not be considered as independent of
one another. (See earlier conclusions on this subject.)
(a) EFFECT OF TIME.
The deflection curves of Figure 18 for singly loaded panels E,
F, and B show that at all points the time under load had the
same effect on deflections as on the stresses; that is, the deflec-
tions increased rapidly, and then more and more slowly when the
load remained constant.
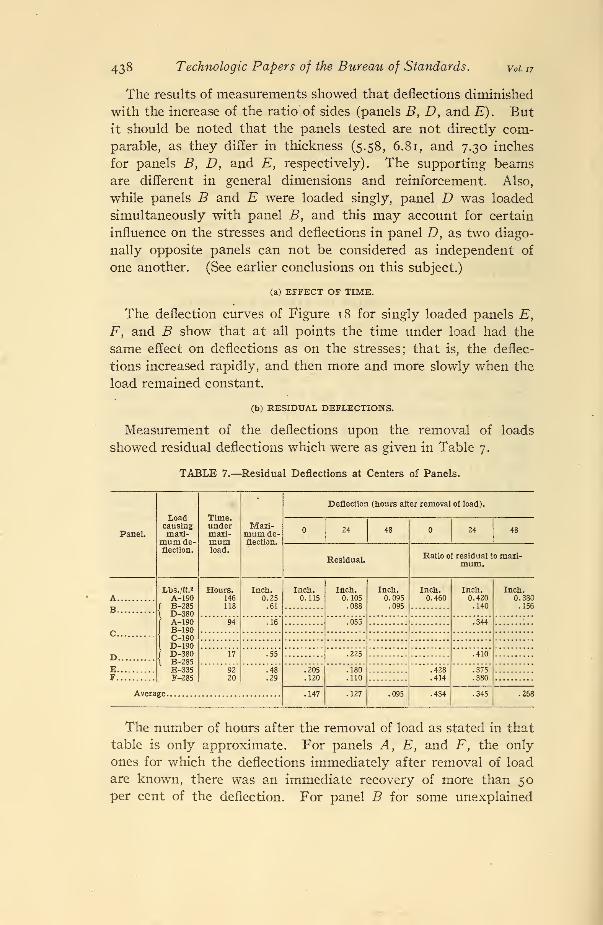
(b) RESIDUAL DEFLECTIONS.
Measurement of the deflections upon the removal of loads
showed residual deflections which were as given in Table 7.
TABLE 7.—Residual Deflections at Centers of Panels.
Loadcausingmaxi-
mum de-flection.
Time,undermaxi-mumload.
Maxi-mum de-flection.
Deflection (hours after removal of load).
Panel.24 48 24 48
Residual.Ratio of residual t
mum.omaxi-
ALbs./ft.'
A-190/ B-285\ D-380f A-190
B-1901 C-190I D-190/ D-380\ B-285
E-335F-285
Hours.146118
Inch.0.25.61
Inch.0.115
Inch.0.105.088
Inch.0.095.095
Inch.0.460
Inch.0.420.140
Inch.0.380.156
94 .16 .055 .344
C
17 .55 .225 .410
E 9220
.48
.29.205.120
.180
.110.428.414
.375
.380F
Avera .147 .127 .095 .434 .345 .268
The number of hours after the removal of load as stated in that
table is only approximate. For panels A, Eyand F, the only
ones for which the deflections immediately after removal of load
are known, there was an immediate recovery of more than 50per cent of the deflection. For panel B for some unexplained
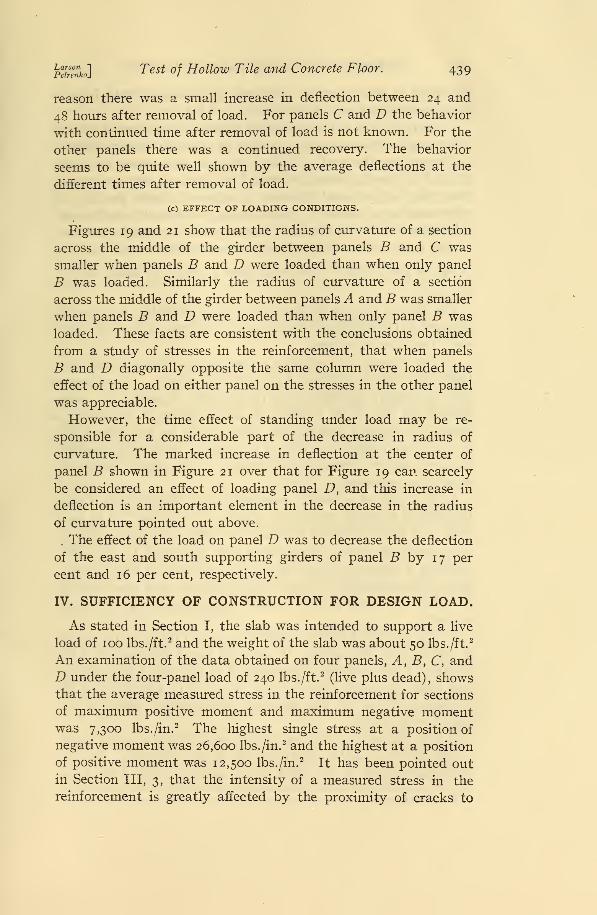
pTtrenko]Test of Hollow Tile and Concrete Floor. 439
reason there was a small increase in deflection between 24 and
48 hours after removal of load. For panels C and D the behavior
with continued time after removal of load is not known. For the
other panels there was a continued recovery. The behavior
seems to be quite well shown by the average deflections at the
different times after removal of load.
Ce) EFFECT OF LOADING CONDITIONS.
Figures 19 and 21 show that the radius of curvature of a section
across the middle of the girder between panels B and C was
smaller when panels B and D were loaded than when only panel
B was loaded. Similarly the radius of curvature of a section
across the middle of the girder between panels A and B was smaller
when panels B and D were loaded than when only panel B was
loaded. These facts are consistent with the conclusions obtained
from a study of stresses in the reinforcement, that when panels
B and D diagonally opposite the same column were loaded the
effect of the load on either panel on the stresses in the other panel
was appreciable.
However, the time effect of standing under load may be re-
sponsible for a considerable part of the decrease in radius of
curvature. The marked increase in deflection at the center of
panel B shown in Figure 21 over that for Figure 19 can scarcely
be considered an effect of loading panel D, and this increase in
deflection is an important element in the decrease in the radius
of curvature pointed out above.
. The effect of the load on panel D was to decrease the deflection
of the east and south supporting girders of panel B by 17 per
cent and 16 per cent, respectively.
IV. SUFFICIENCY OF CONSTRUCTION FOR DESIGN LOAD.
As stated in Section I, the slab was intended to support a live
load of 100 lbs. /ft.2 and the weight of the slab was about 50 lbs. /ft.
2
An examination of the data obtained on four panels, A, B, C, andD under the four-panel load of 240 lbs./ft.
2(live plus dead), shows
that the average measured stress in the reinforcement for sections
of maximum positive moment and maximum negative momentwas 7,300 lbs. /in.
2 The highest single stress at a position of
negative moment was 26,600 lbs. /in.2 and the highest at a position
of positive moment was 12,500 lbs./in.2
It has been pointed out
in Section III, 3, that the intensity of a measured stress in the
reinforcement is greatly affected by the proximity of cracks to
44° Technologic Papers of the Bureau of Standards. vou n
the point of measurement. The average measured stress in gage
lines crossed by cracks was about 19,500 lbs./in.2
A study of data of tests of simple beams having about the samepercentage of reinforcement as that of the slab here considered
indicates that the load at failure (that is, at a stress of 40,000
lbs./in.2 in the reinforcement) would be about 33 per cent greater
than the load required to cause a stress of 18,000 lbs./in.2
If
after reaching a stress of 18,000 lbs./in.2 in the slab under con-
sideration the rate of increase of stress were the same as for those
simple beams, the load required to cause failure would be 1.33
X240, or 319 lbs./ft.2 This would give a factor of safety of ^^>
or 2.13.
For several reasons it seems that there probably was greater
strength in the slab than would appear from this method of analy-
sis. These are as follows
:
1. The stresses on which the estimated ultimate load wasbased were those produced by negative moment. The stresses
due to positive moment were considerably smaller and conse-
quently as far as the collapse of the structure is concerned a
reserve of strength was present which would be available when-
ever the yield point in positions of negative moment is reached.
No such reserve strength was present in the simple beams on
which the comparison is based.
2. In a test of a similar construction at Waynesburg, Ohio, 8
the reserve strength referred to under (1) was found to be very
large. It is not possible to state just what percentage this re-
serve strength in the Waynesburg test amounted to, but after
reaching a stress of 40,000 lbs./in.2 in positions of negative mo-
ment, approximately 100 per cent additional load was required
to bring the stress in the positive reinforcement to the same
amount.
3. The estimated factor of safety, 2.13, was based on the results
of the test of six panels. It must be borne in mind that the
position of the negative reinforcement in the rest of the building
was more favorable (see footnote on p. 431) and therefore the
moments resisted by the negative reinforcement might be ex-
pected to be higher.
It is of interest to point out that present practice would assign
a considerably smaller working load to this structure. By the
recommendations of the final (19 16) report of the Joint Com-
* B. S. Tech. Paper No. 220.
p£™ko] Test of Hollow Tile and Concrete Floor. 441
mittee on Concrete and Reinforced Concrete 9 the safe total
live and dead load for this slab would be 59 lbs./ft.2for panels
A and B and 56 lbs./ft.2for panels C and D.
In the test of panel E no adjacent panels were loaded. Under
the maximum test load of 383 lbs./ft.2
(live and dead) -the maxi-
mum observed tensile stresses in the slab reinforcement in the
short span were 27,000 lbs. /in.2 due to positive moment, and
7,000 lbs. /in.2 due to negative moment. The maximum stresses
in the long span were 13,000 lbs. /in.2 due to positive moment
and 19,200 lbs./in.2 due to negative moment.
The recommendation of the final (19 16) report of the joint
committee would make no recognition of strength added to this
panel by the reinforcement in the direction of the long span,
since that span is more than 1.5 times the short span. The
total allowable live and dead load by that recommendation
would be 39 lbs./ft.2
For positive moment the maximum stress in the long span
was about one-half as great as that in the short span. For nega-
tive moment the maximum stress in the long span was more
than twice as great as that in the short span. The sum of the
maximum positive and maximum negative moments resisted in
the direction of the long span appears to have been about 50
per cent of that resisted in the short span.
The highest tensile stress found in panel F under the test
load of 335 lbs./ft.2 was 19,500 lbs./in.
2 This was a negative-
moment stress in the slab reinforcement extending in the direc-
tion of the long span.
The highest stress due to positive moment was in the direction
of the short span and amounted to 14,000 lbs./in.2 This panel
had no column at the southeast corner and a comparison with
design standards is difficult.
The previous analysis is a discussion of the stresses observed in
the reinforcement of the slab. Because of lack of information as
to the modulus of elasticity and strength of the concrete the ob-
served deformations in the concrete are of less significance than are
those in the reinforcement. However, the information available
is sufficient to show that the compressive stresses in the concrete
and in the tiles were not critical nor more severe relatively than
those in the steel. The maximum observed unit deformation
was 0.0005 and this occurred at a position of negative moment in
9 Representing American Society of Civil Engineers, American Railway Engineering Association, Ameri-can Society for Testing Materials, and American Concrete Institute and Portland Cement Association.
442 Technologic Papers of the Bureau of Standards. Vol. IT
panel C at a place where, as pointed out in Section III, 3, the
stress in the reinforcement was unusually large on account of the
proximity of a crack in the concrete.
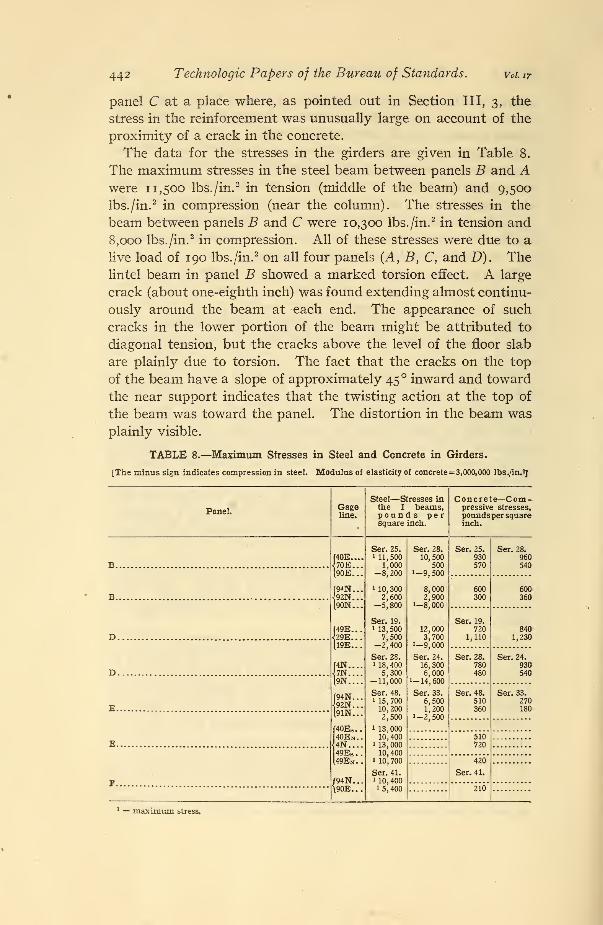
The data for the stresses in the girders are given in Table 8.
The maximum stresses in the steel beam between panels B and Awere 11,500 lbs./in.
2 in tension (middle of the beam) and 9,500
lbs. /in.2 in compression (near the column). The stresses in the
beam between panels B and C were 10,300 lbs./in.2 in tension and
8,000 lbs./in.2 in compression. All of these stresses were due to a
live load of 190 lbs./in.2 on all four panels (A, B, C, and D). The
lintel beam in panel B showed a marked torsion effect. A large
crack (about one-eighth inch) was found extending almost continu-
ously around the beam at each end. The appearance of such
cracks in the lower portion of the beam might be attributed to
diagonal tension, but the cracks above the level of the floor slab
are plainly due to torsion. The fact that the cracks on the top
of the beam have a slope of approximately 45 ° inward and toward
the near support indicates that the twisting action at the top of
the beam was toward the panel. The distortion in the beam wasplainly visible.
TABLE 8.—Maximum Stresses in Steel and Concrete in Girders.
[The minus sign indicates compression in steel. Modulus of elasticity of concrete=3,000,000 lbs./in.2]
Panel.Gageline.
Steel—Stresses inthe I beams,pounds persquare inch.
Concrete—Com-pressive stresses,
poundsper squareinch.
Bf40E....hOE...190E...
[9*N...•U2N...[90N...
(49E...429E...119E...
(4N....^7N....l9N....
f94N...{92N...[91N...
(40E3 ..40EN ..
|4N....49ES .-
149Es..
/94N...\90E...
Ser. 25.i 11,500
1,000-8,200
i 10,3002,600
-5,800
Ser. 19.
113,5007,500
-2,400
Ser. 28.1 18, 400
5.300-11,000
Ser. 48.i 15, 70010, 200
2,500
113,00010, 400
l 13, 00010,400
i 10, 700
Ser. 41.i 10, 400!5,400
Ser. 28.
10,500500
1-9,500
8,0002,900
1-8,000
12,0003,700
1-9,000
Ser. 24.
16, 3006,000
1-14,600
Ser. 33.
6,5001,200
1-2,500
Ser. 25.
930570
Ser. 28.
960540
B600300
600360
D
Ser. 19.
7201,110
8401, 230
D
Ser. 28.
780480
Ser. 24.
930540
E
Ser. 48.
510360
Ser. 33.
270180
510720E
420
Ser. 41.
P210
maximum stress.
pTtrZo] Test of Hollow Tile and Concrete Floor. 443
The greatest tensile and compressive stresses in the I-beam
reinforcement were found in the beam between the panels A and D.
These stresses were 18,400 lbs./in.2 for tension (middle of the beam)
and 14,600 lbs. /in.2 for compression (near the column). The
maximum tensile stress corresponded to the live load of .190 lbs. /ft.2
on all four panels and the maximum compressive stress to the load
of 285 lbs. /ft.2 on panel A and 308 lbs. /ft.
2 on panel D. The fact
that the maximum tension did not correspond to the maximumload on adjacent panels may be due to the time effect and to the
cracks.
In this and other cases, as may be seen from the table, maximumtension never came simultaneously with the maximum compres-
sion and the advent of either one of these maxima was accom-
panied by the decrease of other stress. The stresses in the beambetween the panels D and C were 13,500 lbs. /in.
2 (tension) and
9,000 lbs./in.2 (compression).
The maximum stresses in the beams in panel E were 15,700,
13,000, 13,000 and 10,700 lbs./in.2 (tension) and 2,500 lbs./in. 2
(compression). These were due to a single panel load and would
probably be doubled by loading adjacent panels to the sameintensity.
In panel F the only measured stress available for comparison
with these was 10,400 lbs./in.2 (tension) and corresponded to a
single panel load of 284 lbs. /ft.2
The average maximum recorded compressive stress in concrete
(assuming the modulus of elasticity of concrete in the beams
3,000,000 lbs./in.2) was about 600 lbs./in.
2 and the maximumrecorded (in panel D) 1,230 lbs./in.
2 From the preceding con-
siderations it appears that the structure has a factor of safety over
2 as based on a single loading extending over a limited period of
time, although its actual value is not known. However, the
estimated factor of safety is considerably below those obtaining
for reinforced concrete structures designed according to good
practice, and the building, therefore, can not be expected to have
as large reserve strength. Also, even under normal loads, morestrain effects, such as visible tension cracks, will be present.
The effect of time under constant load, though being the greatest
during the first few days, can not be considered as negligible after-
wards. It has been found from other tests that the increase of
deformations in a loaded structure is liable to go on for a very
considerable length of time. No attempt was made in this test
444 Technologic Papers of the Bureau of Standards. vol. 17
to study the effect of repeated loading, which would be expected
with time to lower the resistance of the floor.
An inspection of the building after three and one-half years of
service showed in a number of panels diagonal cracks extending
from the columns several feet toward the middle. Cracks were
found also across some of the beam stems. These panels had live
loads of from 25 to 35 lbs. /ft.2
, although they may have had greater
loads at some previous time.
V. BIBLIOGRAPHY.
A list of field tests of floors in reinforced concrete buildings,
most of which are of flat-slab construction, will be found below.
The periodicals or institutions referred to in the bibliography
are designated by the following numbers
:
(1) Proceedings National Association of Cement Users and of its successors the Amer-ican Concrete Institute.
(2) University of Illinois, Engineering Experiment Station.
(3) Indiana Engineering Society.
(4) Proceedings Pacific Northwest Society of Civil Engineers.
(5) Transactions American Society of Civil Engineers.
(6) Journal of the Engineering Institute of Canada.
(7) Bulletin on Flat Slabs by Corrugated Bar Co.
(8) Engineering and Contracting.
(9) Engineering News.
(10) Engineering Record.
(11) American Architect.
1. C. Bach and O. Graf: Versuche mit allseitig aufliegenden, quadratischen undrechteckigen Eisenbetonplatten, Deutscher Ausschuss fur Eisenbeton, 30, Berlin,
1915, 309 pp. These laboratory tests were made in Stuttgart, 1911 to 1914, under
the direction of Bach and Graf. Fifty-two slabs supported on four sides and 35 con-
trol strips supported as beams were tested to failure. The tests are reported in
detail, without attempt, however, to explain or analyze the results. Analyses of
the results have been made later by Suenson and by Nielsen; see E. Suenson, Kryds-
armerede Jaernbetonpladers Styrke, Ingenioeren (Copenhagen), 1916, Nos. 76, 77,
and 78; N. J. Nielsen, Krydsarmerede Jaernbetonpladers Styrke, Ingenioeren, 1920,
pp. 723-728.
2. Deere & Webber Building, Minneapolis, 1910, 4-way, 9 panels, (1) 1910, (2)
Bull., 64, 1911, (9) December 22, 1910, (8) December 22, 1910.
3. Test of rubber model flat slab, 1911, 9 panels, (1) 1912, p. 219, (7) 1912.
4. Powers Building, Minneapolis, 1911, 2-way, 4 panels, (1) 1912, p. 61, (9) April
18, 1912, (10) April 20, 1912.
5. Franks Building, Chicago, 1911, 4-way, 4 panels, (1) 1912, p. 160.
6. Barr Building test panel, St. Louis, 1911, 2-way supported on beams, (1) 1912,
P- *33-
7. St. Paul Bread Co. Building, 1912, 4-way, 1 panel, (5) 1914, p. 1376.
8. Larkin Building, Chicago, 1912, 4-way, 5 panels, (1) 1913, (10) January, 1913.
9. Northwestern Glass Co. Building, Minneapolis, 1913, 4-way, 4 panels, (5) 1914,
p. 1340.
10. Worcester (Mass.) test slab, 1913, (2) Bull., 84, 1916.
pSrenko] Test of Hollow Tile and Concrete Floor. 445
11. Shredded Wheat Factory, Niagara Falls, N. Y., 1913, 2-way, 9 panels, (1) 1914,
(2) Bull., 84, 1916.
12. International Hall, Chicago, 1913, 4-way, 4 panels, (5) 1914, pp. 1433-1437.
13. Soo Line Terminal, Chicago, 1913, 4-way, 4 and 5 panels, (2) Bull., 84, 1916,
(9) August 16, 1913.
14. Curtis Ledger Factory, Chicago, 1913, 2-way at columns, 4-way elsewhere, 4
panels, (2) Bull., 84, 1916.
15. Schulze Baking Co. Building, Chicago, 1914, 4-way, 4 panels, (2) Bull., 84,
1916.
16. Schwinn Building, 1914-15, long-time test, 4-way, 1 panel, (1) 1917, p. 45.
17. Sears Roebuck Building, Seattle, 1915, 2-way, (4) January and February, 1916.
18. Bell Street Warehouse, Seattle, 1915, 4-way, 4 panels, (4) 1916, (10) May 13,
1916.
19. Eaton Factory, Toronto, Ont., about 1916, 4-way, 4 panels, (6) April, 1919.
20. S.-M.-I. slab, Purdue University (1917), circumferential reinf., 4 panels, (1)
1918.
21. Sanitary Can Building, Maywood, 111., 1917, 2-way, 4 panels, (1) 1917, p. 172,
and 1921, p. 500.
22. Shonk Building, Maywood, 111., 1917, 4-way, 4 panels, (1) 1917, p. 172, and
192 1, p. 500.
23. Western Newspaper Union Building, Chicago, 1917, 4-way, 4 panels, (1) 1918,
p. 291, (2) Bull., 106, 1918.
24. Slabs J and S, Purdue University, 1917, 2-way, 4 panels each, (1) 1918, p. 174,
also 192 1, p. 500.
25. Slab R, Purdue University, 1917, circumferential reinf., 4 panels, (1) 1917,
p. 172.
26. Arlington Building, Washington, D. C, 1918, 2-way tile and concrete sup-
ported on beams. B. S. Tech. Paper No. 226.
27. Whitacre test slab, Waynesburg, Ohio, 1920, 2-way tile and concrete supported
on beams, 18 panels, (11) August 11, 1920, and March 16, 1921. B. S. Tech. Papers
No. 220.
28. Channon Building, Chicago, 1920, circumferential reinf., 4 panels, (1) 192 1,
p. 500.
29. Jersey City Dairy Co. Building, Jersey City, N. J., 1913, 2-way, 1 panel, tested
by Corrugated Bar Co., Buffalo, N. Y. Not published.
Washington, September 26, 1922.


![higiene y panela: cambios en el discurso y las políticas ... · [ 200 ] Departamento de Antropología · Facultad de Ciencias Humanas natalia robledo escobar · Higiene y panela:](https://img.pdfslide.us/doc/110x75/5c4af17d93f3c31f4f7d9151/higiene-y-panela-cambios-en-el-discurso-y-las-politicas-200-departamento.jpg)