Embed Size (px)
Citation preview
Available online at www.sciencedirect.com
Procedia Engineering 2 (2010) 000–000
ProcediaEngineering
www.elsevier.com/locate/procedia
ISAB-2010
Load-unload response ratio and its application to estimate future seismicity of Qiandao Lake region
Shuai Yuana, b,*, Xiangchu Yina, c, Naigang Lianga
a State Key Laboratory of Nonlinear Mechanics, Institute of Mechanics, Chinese Academy of Sciences, Beijing 100190, China bGraduate University of Chinese Academy of Sciences, Beijing 100049, China
c Institute of Earthquake Science, China Earthquake Administration, Beijing 100036, China
Received 14 July 2010; revised 29 July 2010; accepted 31 July 2010
Abstract
LURR (Load-Unload Response Ratio) has been introduced briefly in this paper and future seismicity of Qiandao Lake region has been predicted in terms of LURR for the purpose of SFT (Submerged Floating Tunnel) project. © 2010 Published by Elsevier Ltd. Keywords: LURR (load-unload response ratio); Qiandao Lake region; estimation of future seismicity
1. Introduction
The earthquake, a natural phenomenon which causes much massive destruction, can bring about lots of casualties and losses of properties and to predict the time, location and magnitude of the earthquake is one of the best ways to mitigate earthquake disasters. So earthquake prediction has much important practical significance. The seismogenic process is very complex, but from the viewpoint of mechanics, its physical essence lies in the damage process of the focal media which is a mechanical process [1]. Based on the thoughts above, Yin et al. [2-12] putted forward the method of Load-Unload Response Ratio (LURR) which can depict quantitatively the extent to which the focal media is approaching instability.
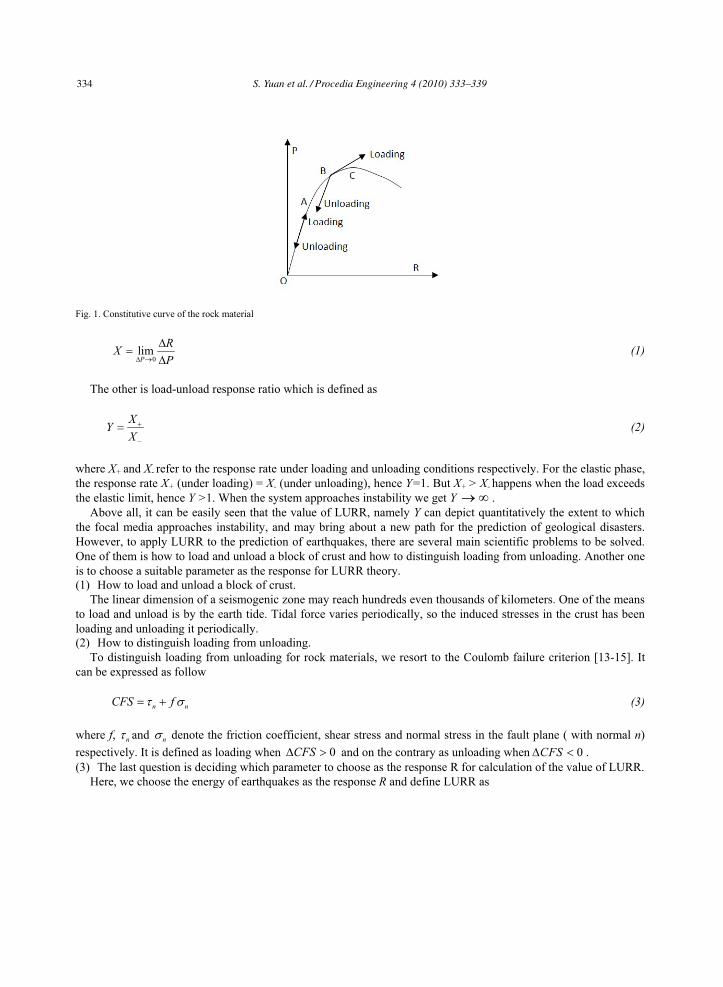
From macroscopic perspectives, the mechanical behaviors of a certain material can be comprehensively described by the constitutive curve (In Fig. 1 the ordinate denotes general load P and the abscissa is the response R to p and they are stress and strain respectively in one-dimensional stress-strain state.) If a material is loaded gradually it will endure regimes of elasticity, damage and failure in succession. What characterizes the elastic phase is its reversibility namely the loading and unloading processes are reversible. On the other hand, it is irreversible for the phase of damage in which it behaves distinctly under loading and unloading conditions and just on this disparity between loading and unloading processes we base the theory of LURR [1-6]. In the theory of LURR we need to define two parameters at first. One is response rate defined as
* Corresponding author. Tel.: +86-10-82543926; fax: +86-10-82543977. E-mail address: [email protected]
Procedia Engineering 4 (2010) 333–339
www.elsevier.com/locate/procedia
1877-7058 c© 2010 Elsevier Ltd. All rights reserved.doi:10.1016/j.proeng.2010.08.038
2 S. Yuan et al. / Procedia Engineering 2 (2010) 000–000
Fig. 1. Constitutive curve of the rock material
0limP
RXP� �
��
� (1)
The other is load-unload response ratio which is defined as
XYX
�
�
� (2)
where X+ and X- refer to the response rate under loading and unloading conditions respectively. For the elastic phase, the response rate X+ (under loading) = X- (under unloading), hence Y=1. But X+ > X- happens when the load exceeds the elastic limit, hence Y >1. When the system approaches instability we get Y �� .
Above all, it can be easily seen that the value of LURR, namely Y can depict quantitatively the extent to which the focal media approaches instability, and may bring about a new path for the prediction of geological disasters. However, to apply LURR to the prediction of earthquakes, there are several main scientific problems to be solved. One of them is how to load and unload a block of crust and how to distinguish loading from unloading. Another one is to choose a suitable parameter as the response for LURR theory. (1) How to load and unload a block of crust.
The linear dimension of a seismogenic zone may reach hundreds even thousands of kilometers. One of the means to load and unload is by the earth tide. Tidal force varies periodically, so the induced stresses in the crust has been loading and unloading it periodically. (2) How to distinguish loading from unloading.
To distinguish loading from unloading for rock materials, we resort to the Coulomb failure criterion [13-15]. It can be expressed as follow
n nCFS f� � � ����������������������������������������������������������������������������������������������������������������������������������������������������� (3)
where f, n� and n denote the friction coefficient, shear stress and normal stress in the fault plane ( with normal n) respectively. It is defined as loading when 0CFS� and on the contrary as unloading when 0CFS� � . (3) The last question is deciding which parameter to choose as the response R for calculation of the value of LURR.
Here, we choose the energy of earthquakes as the response R and define LURR as
334 S. Yuan et al. / Procedia Engineering 4 (2010) 333–339
S. Yuan et al. / Procedia Engineering 2 (2010) 000–000 3
1
1
Nmi
im N
mi
i
EY
E
�
�
� �
� �
� �� �� ��� �� �� �
(4)
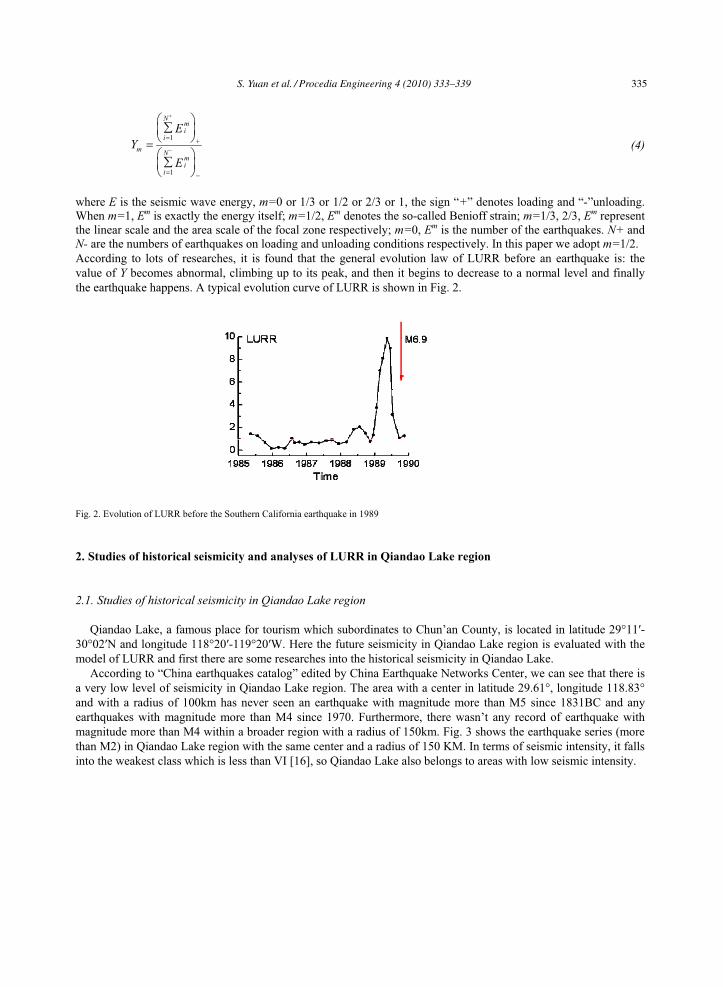
where E is the seismic wave energy, m=0 or 1/3 or 1/2 or 2/3 or 1, the sign “+” denotes loading and “-”unloading. When m=1, Em is exactly the energy itself; m=1/2, Em denotes the so-called Benioff strain; m=1/3, 2/3, Em represent the linear scale and the area scale of the focal zone respectively; m=0, Em is the number of the earthquakes. N+ and N- are the numbers of earthquakes on loading and unloading conditions respectively. In this paper we adopt m=1/2. According to lots of researches, it is found that the general evolution law of LURR before an earthquake is: the value of Y becomes abnormal, climbing up to its peak, and then it begins to decrease to a normal level and finally the earthquake happens. A typical evolution curve of LURR is shown in Fig. 2.
Fig. 2. Evolution of LURR before the Southern California earthquake in 1989
2. Studies of historical seismicity and analyses of LURR in Qiandao Lake region
2.1. Studies of historical seismicity in Qiandao Lake region
Qiandao Lake, a famous place for tourism which subordinates to Chun’an County, is located in latitude 29°11�-30°02�N and longitude 118°20�-119°20�W. Here the future seismicity in Qiandao Lake region is evaluated with the model of LURR and first there are some researches into the historical seismicity in Qiandao Lake.
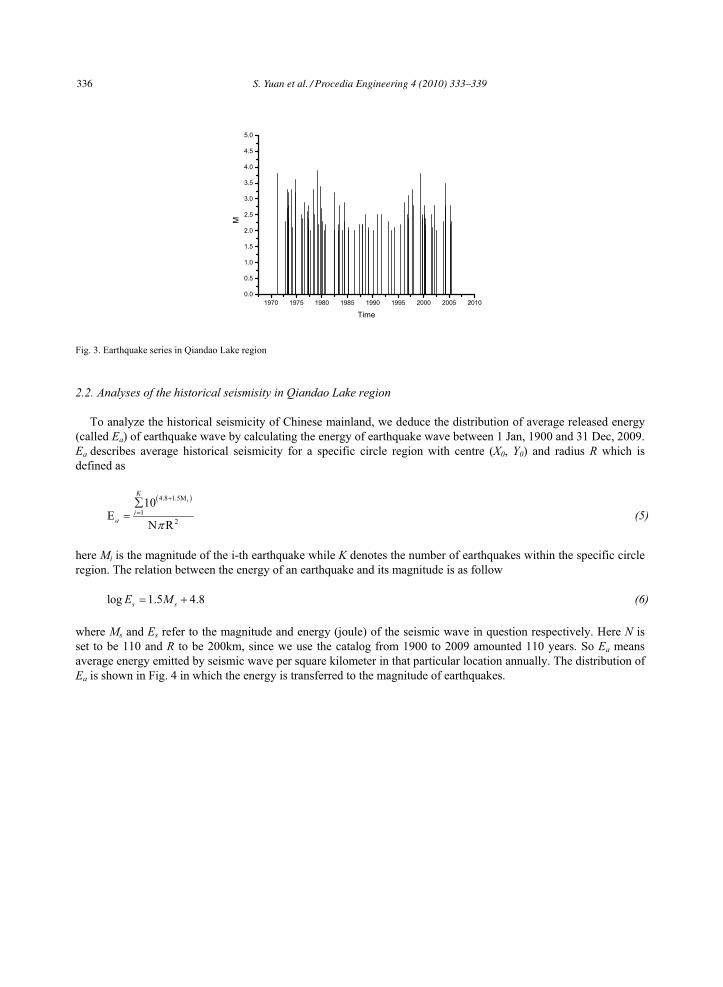
According to “China earthquakes catalog” edited by China Earthquake Networks Center, we can see that there is a very low level of seismicity in Qiandao Lake region. The area with a center in latitude 29.61°, longitude 118.83° and with a radius of 100km has never seen an earthquake with magnitude more than M5 since 1831BC and any earthquakes with magnitude more than M4 since 1970. Furthermore, there wasn’t any record of earthquake with magnitude more than M4 within a broader region with a radius of 150km. Fig. 3 shows the earthquake series (more than M2) in Qiandao Lake region with the same center and a radius of 150 KM. In terms of seismic intensity, it falls into the weakest class which is less than VI [16], so Qiandao Lake also belongs to areas with low seismic intensity.
S. Yuan et al. / Procedia Engineering 4 (2010) 333–339 335
4 S. Yuan et al. / Procedia Engineering 2 (2010) 000–000
1970 1975 1980 1985 1990 1995 2000 2005 2010
0.0
0.5
1.0
1.5
2.0
2.5
3.0
3.5
4.0
4.5
5.0
M
Time
Fig. 3. Earthquake series in Qiandao Lake region
2.2. Analyses of the historical seismisity in Qiandao Lake region
To analyze the historical seismicity of Chinese mainland, we deduce the distribution of average released energy (called Ea) of earthquake wave by calculating the energy of earthquake wave between 1 Jan, 1900 and 31 Dec, 2009. Ea describes average historical seismicity for a specific circle region with centre (X0, Y0) and radius R which is defined as
� �4.8 1.5M
12
10E
N R
iK
ia �
�
��
� (5)
here Mi is the magnitude of the i-th earthquake while K denotes the number of earthquakes within the specific circle region. The relation between the energy of an earthquake and its magnitude is as follow
log 1.5 4.8s sE M� � (6)
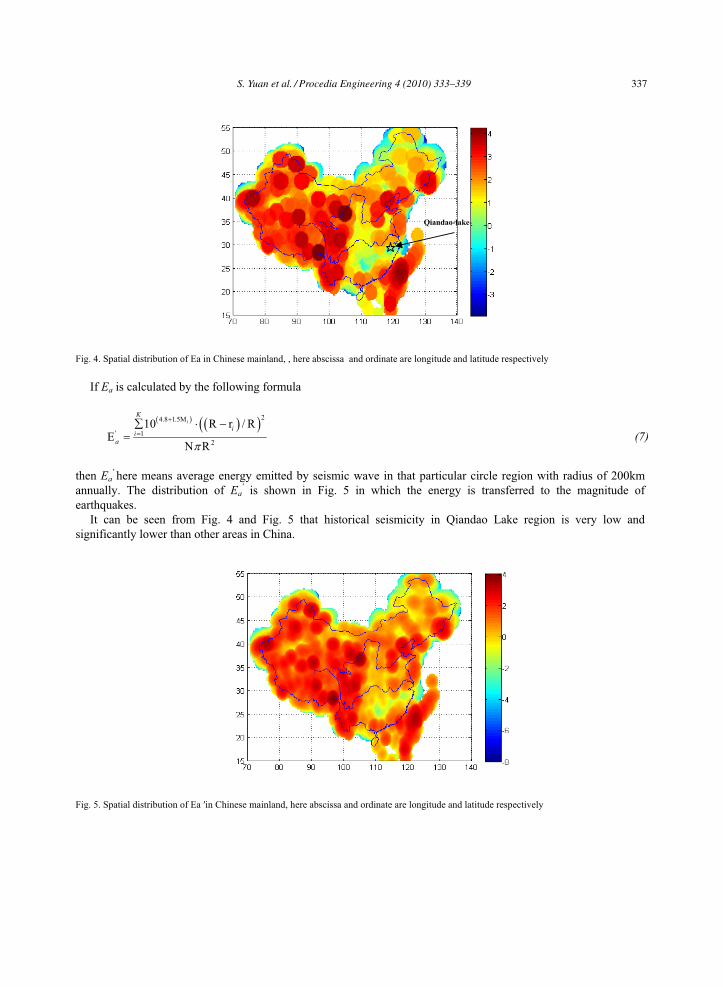
where Ms and Es refer to the magnitude and energy (joule) of the seismic wave in question respectively. Here N is set to be 110 and R to be 200km, since we use the catalog from 1900 to 2009 amounted 110 years. So Ea means average energy emitted by seismic wave per square kilometer in that particular location annually. The distribution of Ea is shown in Fig. 4 in which the energy is transferred to the magnitude of earthquakes.
336 S. Yuan et al. / Procedia Engineering 4 (2010) 333–339
S. Yuan et al. / Procedia Engineering 2 (2010) 000–000 5
Fig. 4. Spatial distribution of Ea in Chinese mainland, , here abscissa and ordinate are longitude and latitude respectively
If Ea is calculated by the following formula
� � � �� �24.8 1.5M
' 12
10 R r / RE
N R
iK
ii
a �
�
�� � �
� (7)
then Ea
� here means average energy emitted by seismic wave in that particular circle region with radius of 200km annually. The distribution of Ea
� is shown in Fig. 5 in which the energy is transferred to the magnitude of earthquakes.
It can be seen from Fig. 4 and Fig. 5 that historical seismicity in Qiandao Lake region is very low and significantly lower than other areas in China.
Fig. 5. Spatial distribution of Ea �in Chinese mainland, here abscissa and ordinate are longitude and latitude respectively
Qiandao-lake-
Qiandao-lake-
S. Yuan et al. / Procedia Engineering 4 (2010) 333–339 337
6 S. Yuan et al. / Procedia Engineering 2 (2010) 000–000
2.3. Analyses of seismicity in Qiandao Lake region by LURR
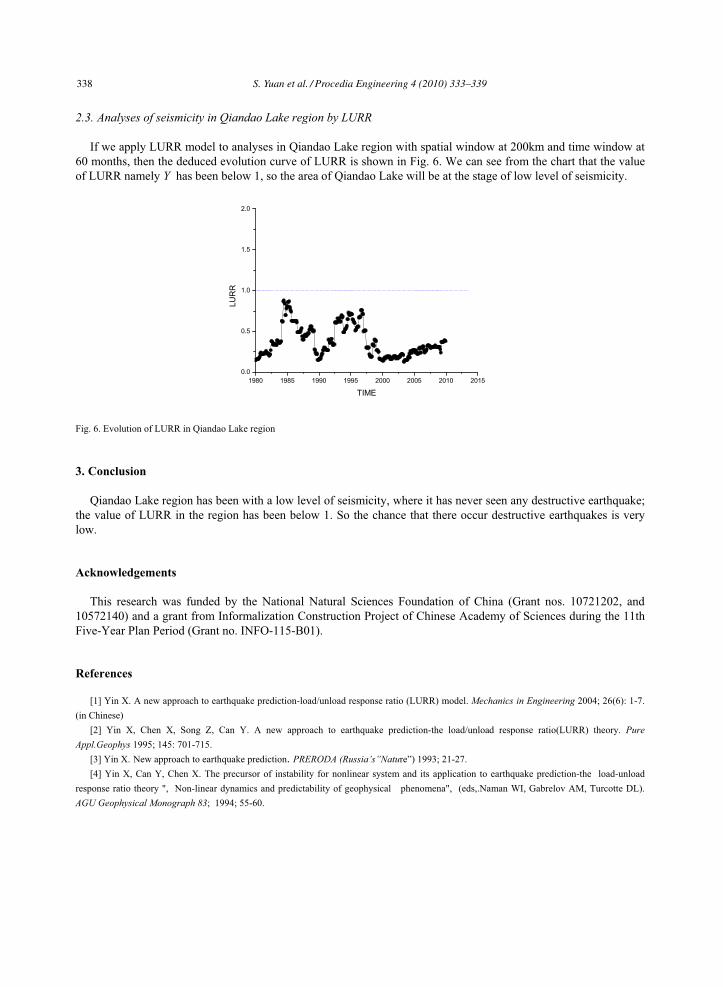
If we apply LURR model to analyses in Qiandao Lake region with spatial window at 200km and time window at 60 months, then the deduced evolution curve of LURR is shown in Fig. 6. We can see from the chart that the value of LURR namely Y has been below 1, so the area of Qiandao Lake will be at the stage of low level of seismicity.
1980 1985 1990 1995 2000 2005 2010 2015
0.0
0.5
1.0
1.5
2.0
LURR
TIME
Fig. 6. Evolution of LURR in Qiandao Lake region
3. Conclusion
Qiandao Lake region has been with a low level of seismicity, where it has never seen any destructive earthquake; the value of LURR in the region has been below 1. So the chance that there occur destructive earthquakes is very low.
Acknowledgements
This research was funded by the National Natural Sciences Foundation of China (Grant nos. 10721202, and 10572140) and a grant from Informalization Construction Project of Chinese Academy of Sciences during the 11th Five-Year Plan Period (Grant no. INFO-115-B01).
References
[1] Yin X. A new approach to earthquake prediction-load/unload response ratio (LURR) model. Mechanics in Engineering 2004; 26(6): 1-7. (in Chinese)
[2] Yin X, Chen X, Song Z, Can Y. A new approach to earthquake prediction-the load/unload response ratio(LURR) theory. Pure Appl.Geophys 1995; 145: 701-715.
[3] Yin X. New approach to earthquake prediction. PRERODA (Russia’s”Nature”) 1993; 21-27. [4] Yin X, Can Y, Chen X. The precursor of instability for nonlinear system and its application to earthquake prediction-the load-unload
response ratio theory ", Non-linear dynamics and predictability of geophysical phenomena", (eds,.Naman WI, Gabrelov AM, Turcotte DL). AGU Geophysical Monograph 83; 1994; 55-60.
338 S. Yuan et al. / Procedia Engineering 4 (2010) 333–339
S. Yuan et al. / Procedia Engineering 2 (2010) 000–000 7
[5] Yin X, Wang Y, Pang K, Bai Y, Wang H, Yin X. Development of a new approach to earthquake prediction-load/unload response ratio (LURR) theory. Pure Appl.Geophys 2000; 157: 2365-2383.
[6] Yin X, Zhang L, Zhang H, Yin C, Wang Y, Zhang Y, et al. LURR’s twenty years and its perspective. Pure and Applied Geophysics 2006; 163(11-12): 2317–2341.
[7] Yin X, Zhang L, Zhang Y, Pang K, Wang H, Song Z et al. The peak point of LURR and its significance. Concurrency Computat.: Pract. Exper 2009.
[8] Yu H. Experimental research on precursors of brittle heterogeneous media and earthquake prediction methods. PhD Thesis of The Graduate School of the Chinese Academy of Sciences 2004. (in Chinese)
[9] Tong J. The Analysis of Landslide in Terms of Load/unload Response Ratio. PhD Thesis in Institute of Geology, Chinese Seismological Bureau; 2004. (in Chinese)
[10] Can Y(2005). Exploring the Underlying Mechanism of Load/Unload Response Ratio Theory and Its Application to Earthquake Prediction. PhD Thesis of The University of Queensland, Australia, 2005.
[11] Zhang H. Prediction of Catastrophic Failure in Heterogeneous Brittle Media-Study and Practice of Load/Unload Response Ratio (LURR). PhD Thesis of The Graduate School of the Chinese Academy of Sciences, 2006. (in Chinese)
[12] Zhang L. Study on Damage Evolution of Heterogeneous Brittle Media in Seismogenic Conditions and Earthquake Prediction. PhD Thesis of The Graduate School of the Chinese Academy of Sciences; 2009. (in Chinese)
[13] Harries RA. Introduction to special section: stress triggers, stress shadows, and implication for seismic hazard. J. Geophys. Res 1998; 103: 24347-24358.
[14] Resernberg PA, Simpson RW. Response of regional seismicity to the static stress change produced by the loma preita earthquake. Science 1992; 255: 1687-1690.
[15] Harries RA. Earthquake stress triggers, stress shadows, and seismic hazard. Current Science 2000; 79: 1215-1225. [16] Seismic Intensity Zoning Map of China. Beijing: China Seismology Press, 1991. (in Chinese)
S. Yuan et al. / Procedia Engineering 4 (2010) 333–339 339