Embed Size (px)
Citation preview

© 2002 Compressor Controls Corporation FwdPrev Rew Menu
CompressorsCompressors

© 2002 Compressor Controls Corporation FwdPrev Rew Menu
Cost of Operation
Compressor Operation
Compressor Control
Compressors Compressors
Maintenance costsOperating costsEnergy savings
Downtime costsCommissioning costs
Lifecycle costs
Centrifugal compressorsAxial compressors
Compressor system classificationsDeveloping the compressor curve
The surge phenomena

© 2002 Compressor Controls Corporation FwdPrev Rew Menu
Costs of repairs - materials and labor
Repairs are expensive
$20,000 $50,000
$10,000 $25,000
$200,000 $750,000
Axial air blower20,000 hp
Seals
Bearings
Rotor Assembly
Process gas compressor 3,000 hp
Compressors
© 2002 Compressor Controls Corporation FwdPrev Rew Menu
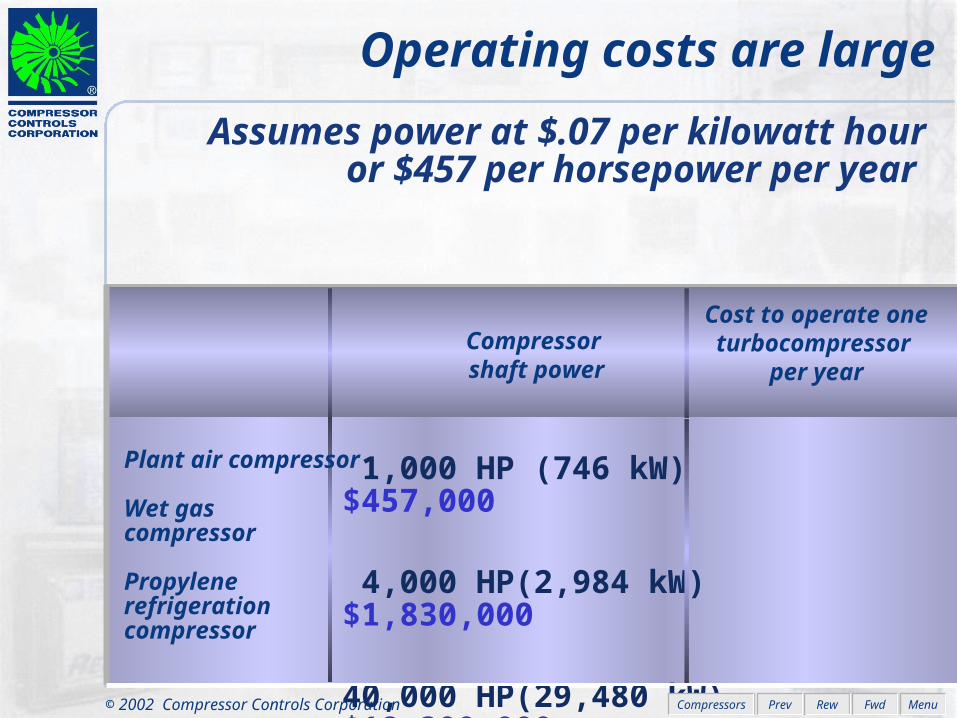
Operating costs are large
Assumes power at $.07 per kilowatt hour or $457 per horsepower per year
1,000 HP (746 kW) $457,000
4,000 HP(2,984 kW) $1,830,000
40,000 HP(29,480 kW) $18,300,000
Cost to operate one turbocompressor
per year
Plant air compressor
Wet gas compressor
Propylene refrigeration compressor
Compressor shaft power
Compressors

© 2002 Compressor Controls Corporation FwdPrev Rew Menu
Energy savings from reduced recycle or blow-off
40,000 HP (29 МW) $1,200,000
15,000 HP (11.2 МW) $155,000
1,500 HP (1.1 МW) $78,000
Actual energy savings result from improved Antisurge and Capacity Control
Compressor shaft power
Actual achieved savings
Propylene refrigeration
FCCU air blower
Centac air compressor
Compressors

© 2002 Compressor Controls Corporation FwdPrev Rew Menu
Less than one year pay-backs* typical by reducing recycle of blow-off
Pa
y-b
ac
k P
eri
od
(M
on
ths
)
Reduced Recycle (Per Cent of Maximum Compressor Flow)
* Assumes electro motor power At $0.05 US per kilowatt hour or turbine power at $327 per horsepower per year.
12
11
10
9
8
7
6
5
4
3
2
1
0 5 10 15 20 25 30 35
Pay-back approximately 1
Month with 15% Reduction 1000 HP
3,500 HP
20,000 HP
Pay-back less than 10
Months with 15% Reduction
Pay-back less than 6
Months with 15% Reduction
Available energy savings can be predicted
Compressors
© 2002 Compressor Controls Corporation FwdPrev Rew Menu
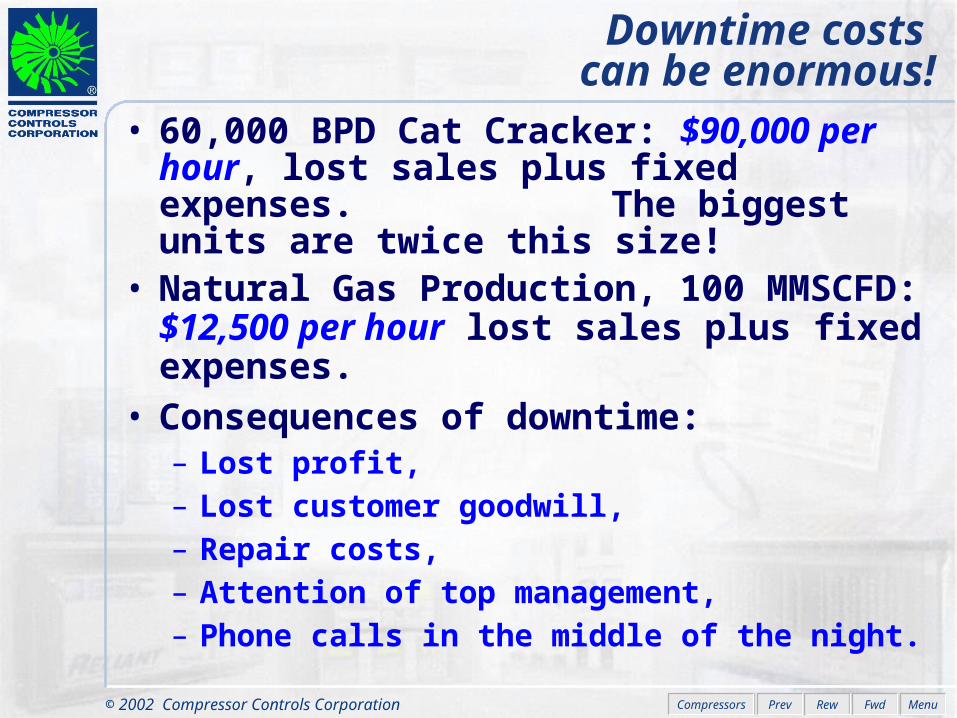
Downtime costs can be enormous!
• 60,000 BPD Cat Cracker: $90,000 per hour, lost sales plus fixed expenses. The biggest units are twice this size!
• Natural Gas Production, 100 MMSCFD: $12,500 per hour lost sales plus fixed expenses.
• Consequences of downtime: – Lost profit, – Lost customer goodwill, – Repair costs, – Attention of top management,– Phone calls in the middle of the night.
Compressors
© 2002 Compressor Controls Corporation FwdPrev Rew Menu
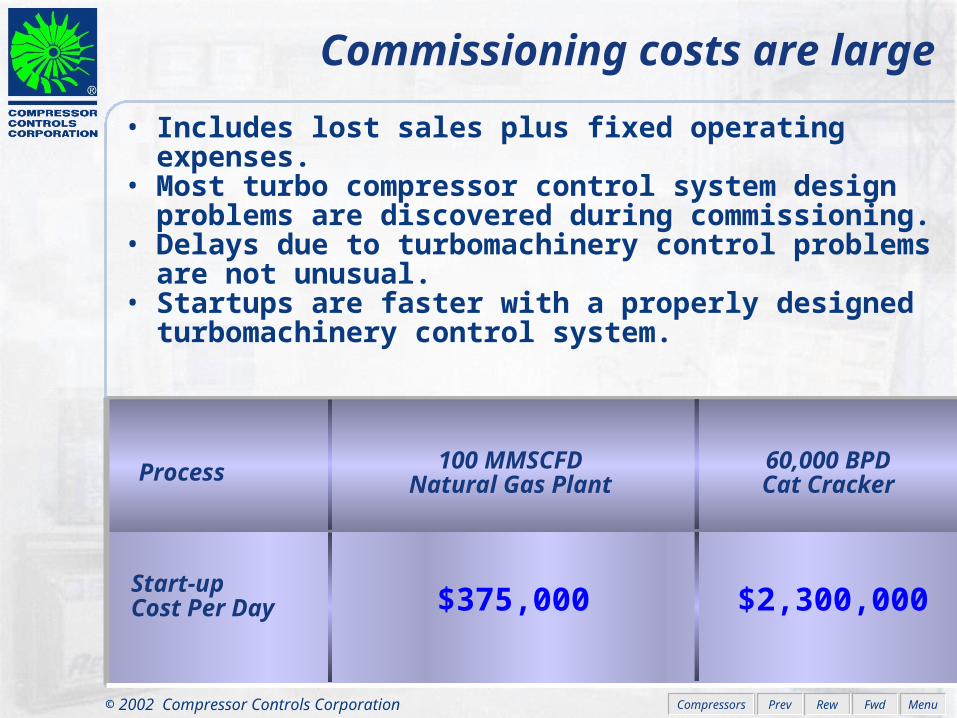
$2,300,000$375,000
100 MMSCFDNatural Gas Plant
60,000 BPDCat Cracker
Start-up Cost Per Day
Process
Commissioning costs are large
• Includes lost sales plus fixed operating expenses.• Most turbo compressor control system design
problems are discovered during commissioning.• Delays due to turbomachinery control problems
are not unusual.• Startups are faster with a properly designed
turbomachinery control system.
Compressors
© 2002 Compressor Controls Corporation FwdPrev Rew Menu
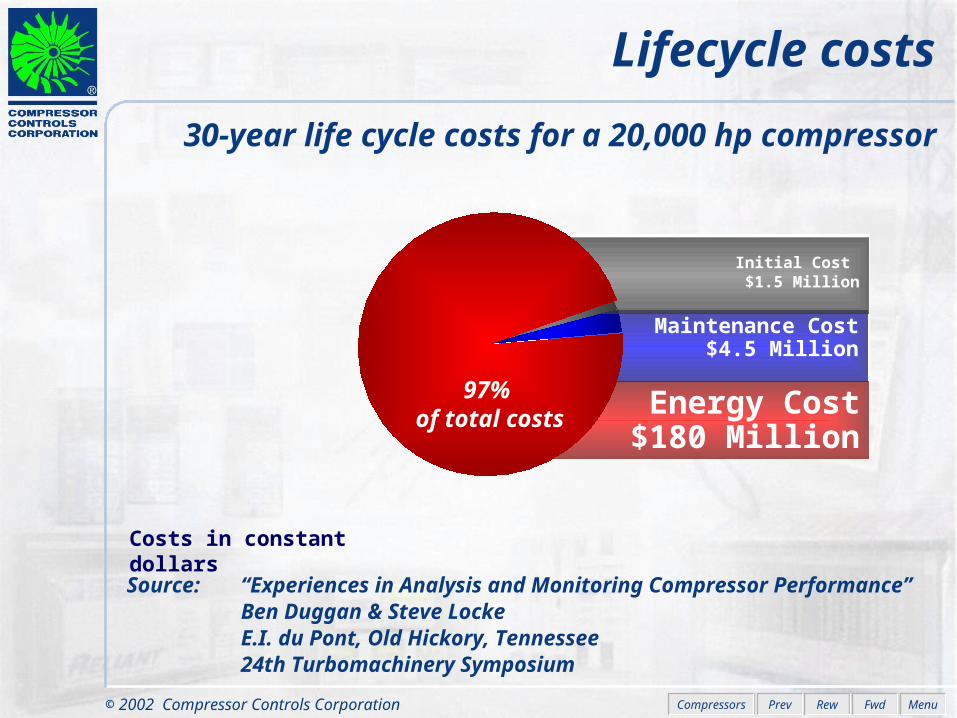
Lifecycle costs
30-year life cycle costs for a 20,000 hp compressor
Costs in constant dollars
Source: “Experiences in Analysis and Monitoring Compressor Performance”Ben Duggan & Steve LockeE.I. du Pont, Old Hickory, Tennessee24th Turbomachinery Symposium
Maintenance Cost$4.5 Million
Initial Cost $1.5 Million
Energy Cost$180 Million
97% of total costs
Compressors

© 2002 Compressor Controls Corporation FwdPrev Rew Menu
Lifecycle costsLifecycle costs
Source: “Experiences in Analysis and Monitoring Compressor Performance”Ben Duggan & Steve LockeE.I. du Pont, Old Hickory, Tennessee24th Turbomachinery Symposium
30-year costs per a 1,000 hp
What can we control?
0.0
5.0
10.0
15.0
Initial Cost Maintenance Energy Lost Production
$ Millions
?
Controllable
UncontrollableCosts in constant dollars
Compressors
© 2002 Compressor Controls Corporation FwdPrev Rew Menu
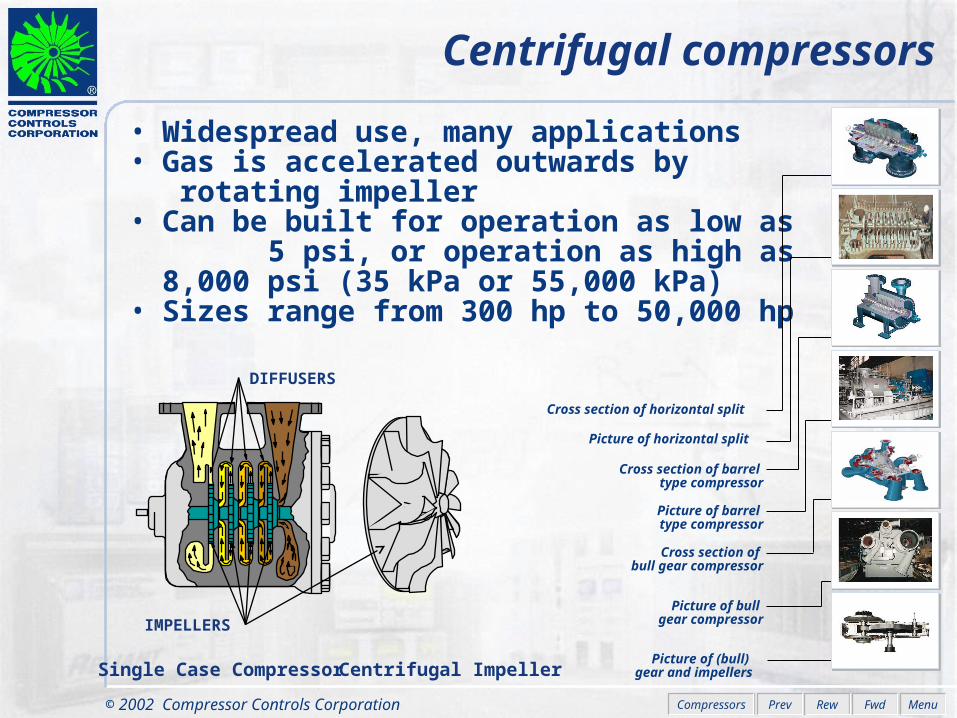
• Widespread use, many applications• Gas is accelerated outwards by
rotating impeller• Can be built for operation as low as
5 psi, or operation as high as 8,000 psi (35 kPa or 55,000 kPa)
• Sizes range from 300 hp to 50,000 hp
Centrifugal compressors
Single Case Compressor Centrifugal Impeller
IMPELLERS
Picture of horizontal split
Cross section of barrel type compressor
Picture of barrel type compressor
Cross section of bull gear compressor
Picture of (bull) gear and impellers
Picture of bull gear compressor
Cross section of horizontal split
DIFFUSERS
Compressors

© 2002 Compressor Controls Corporation FwdPrev Rew Menu
Compressor inlet nozzle
Thrust bearing
Journal bearing
Shaft and labyrinth seal
Impeller inlet labyrinth seals
Discharge volutes
Impellers
Drive coupling
Casing (horizontally split
flange) Compressor discharge nozzle
Cross section of horizontal split
Picture of Horizontal Split Compressors

© 2002 Compressor Controls Corporation FwdPrev Rew Menu
Picture of horizontal split
CompressorsCross Section of Horizontal Split

© 2002 Compressor Controls Corporation FwdPrev Rew Menu
Cross section of barrel type compressor
CompressorsPicture of Barrel Type

© 2002 Compressor Controls Corporation FwdPrev Rew Menu
Picture of barrel type compressor
CompressorsCross Section of Barrel Type

© 2002 Compressor Controls Corporation FwdPrev Rew Menu
Compressor volutes
Gear casing
Pinion shafts
Journal bearing
Impellers
Drive coupling
Labyrinth seals
Main gear
Inlet guide vanes
Cross section of bull gear compressor
CompressorsIntegrally GearedGear and Impellers

© 2002 Compressor Controls Corporation FwdPrev Rew Menu
Picture of bull gear compressor
CompressorsGear and ImpellersCross section

© 2002 Compressor Controls Corporation FwdPrev Rew Menu
Picture of (bull) gear and impellers
CompressorsIntegrally GearedCross Section

© 2002 Compressor Controls Corporation FwdPrev Rew Menu
Axial compressors
• Gas flows in direction of rotating shaft• Can be built for lower pressures only 10 to
100 psi (0.7 to 6.8 Bar)• High flow rate • Efficient• Not as common as centrifugals
RotorBlades
Casing
StatorBlades
Stator BladesRotor Blades
Casing
Shaft
CompressorsPicture of AxialCross Section
© 2002 Compressor Controls Corporation FwdPrev Rew Menu
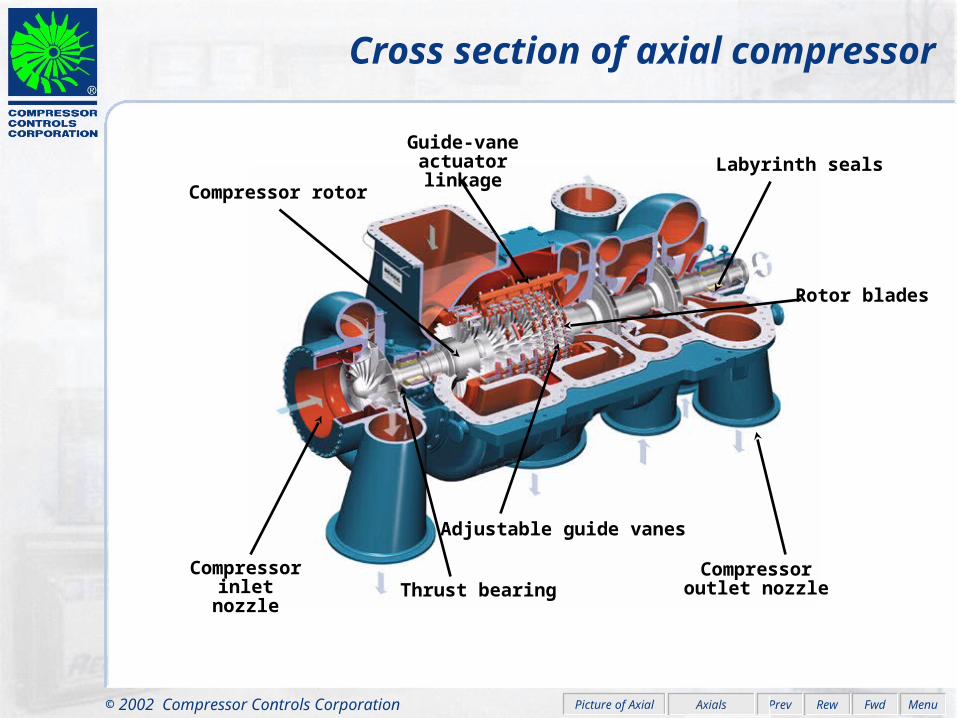
Compressor outlet nozzle
Rotor blades
Labyrinth sealsGuide-vane
actuator linkage
Compressor rotor
Compressor inlet nozzle Thrust bearing
Adjustable guide vanes
Cross section of axial compressor
AxialsPicture of Axial

© 2002 Compressor Controls Corporation FwdPrev Rew Menu
Picture of axial compressor
AxialsCross Section

© 2002 Compressor Controls Corporation FwdPrev Rew Menu
Single-Section, Three-Stage Single-Case, Two-Section, Six-Stage
Two-Case, Two-Section, Six-Stage
Series Network
Parallel Network
Compressor system classifications
Compressors

© 2002 Compressor Controls Corporation FwdPrev Rew Menu
Developing the compressor curve
Pd Discharge Pressure (P2)Pc Differential Pressure (Pd - Ps) or (P2 - P1) Rc Pressure Ratio (Pd/Ps) or (P2/P1) Hp Polytropic HeadRc
Qs, normalQs, massQs, vol
Compressor curve for a specific
speed N1
Rprocess,1
Q1
Rc1
Rprocess,2
Q2
Rc2
Compressors

© 2002 Compressor Controls Corporation FwdPrev Rew Menu
Stable zoneof operation
Developing the compressor curve
Minimum speed
Power limit
Maximum speed
Process limit
Qs, vol
Adding control margins
Stonewall orchoke limit
Surge limit
Rc
Actual availableoperating zone
Compressors

© 2002 Compressor Controls Corporation FwdPrev Rew Menu
Bernoulli’s law
• pstatic + 1/2v2 + gH = Constant
• The term gH is negligible for the wing
• Then: pstatic + 1/2v2 = Constant
• Due to the shape of the wing: v2 < v1 thus p2 > p1
v1, p1
v2, p2
• As a result there is p or “Lift”
Lift
• And the plane can fly
How an airplane wing develops lift
Compressors
© 2002 Compressor Controls Corporation FwdPrev Rew Menu
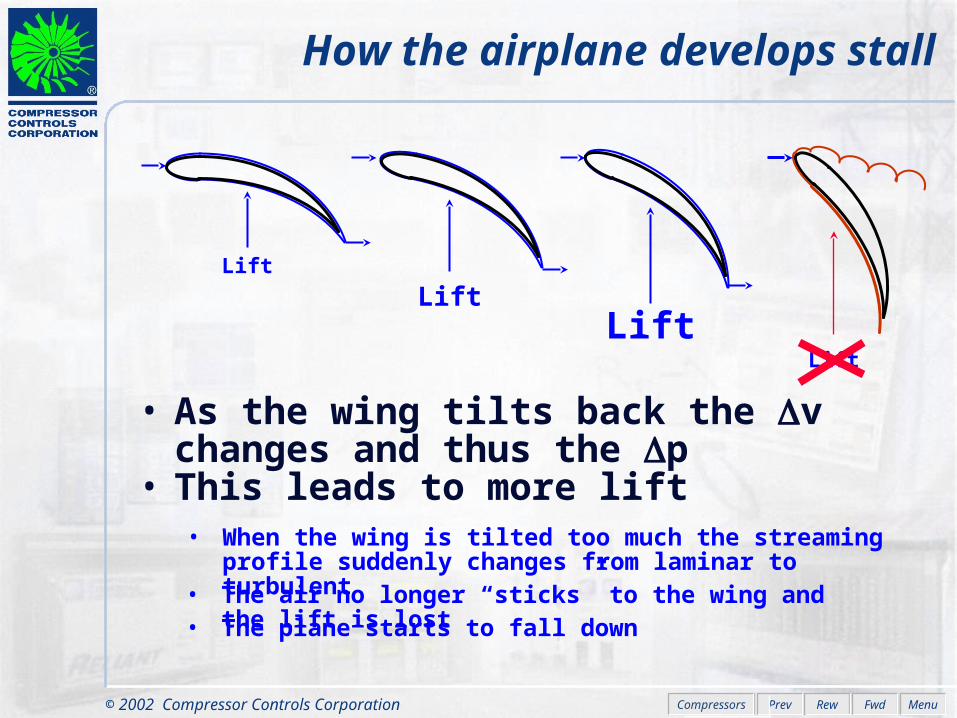
• As the wing tilts back the v changes and thus the p
• This leads to more lift
Lift
LiftLift
• When the wing is tilted too much the streaming profile suddenly changes from laminar to turbulent
Lift
• The air no longer “sticks” to the wing and the lift is lost• The plane starts to fall down
How the airplane develops stall
Compressors

© 2002 Compressor Controls Corporation FwdPrev Rew Menu
• From A to B…….20 - 50 ms…………….. Drop into surge• From C to D…….20 - 120 ms…………… Jump out of
surge• A-B-C-D-A……….0.3 - 3 seconds……… Surge cycle
• Compressor reaches surge point A• Compressor loses its ability to make
pressure• Suddenly Pd drops and thus Pv > Pd• Compressor surges -“Plane goes to stall”
Qs, vol
Pd
Machine shutdownno flow, no pressure
• Electro motor is started• Machine accelerates
to nominal speed• Compressor reaches
performance curveNote: Flow goes up faster because pressure is the integral of flow
• Pressure builds• Resistance goes up• Compressor “rides” the curve• Pd = Pv + Rlosses
• Because Pv > Pd the flow reverses• Compressor operating point goes to
point B
• Result of flow reversal is that pressure goes down
• Pressure goes down => less negative flow• Operating point goes to point C
• System pressure is going down• Compressor is again able to
overcome Pv• Compressor “jumps” back to
performance curve and goes to point D
• Forward flow is re-established Pd = Compressor discharge pressurePv = Vessel pressureRlosses = Resistance losses over pipe
• Compressor starts to build pressure• Compressor “rides” curve towards surge• Point A is reached• The surge cycle is complete
Developing the surge cycle on the compressor curve
Pd
Pv
Rlosses
B A
C
D
Compressors

© 2002 Compressor Controls Corporation FwdPrev Rew Menu
• Rapid flow oscillations • Thrust reversals• Potential damage
FLOW
PRESSURE
TEMPERATURE
TIME (sec.)
1 2 3
TIME (sec.)
1 2 3
TIME (sec.)
1 2 3
Major Process Parameters during Surge
• Rapid pressure oscillations with process instability
• Rising temperatures inside compressor
Operators may fail to recognize surge
Compressors

© 2002 Compressor Controls Corporation FwdPrev Rew Menu
Surge description
• Flow reverses in 20 to 50 milliseconds• Surge cycles at a rate of 0.3 s to 3 s
per cycle• Compressor vibrates• Temperature rises• “Whooshing” noise• Trips may occur• Conventional instruments and human
operators may fail to recognize surge
Compressors
© 2002 Compressor Controls Corporation FwdPrev Rew Menu
Some surge consequences
• Unstable flow and pressure• Damage in sequence with increasing
severity to seals, bearings, impellers, shaft
• Increased seal clearances and leakage
• Lower energy efficiency• Reduced compressor life
Compressors

© 2002 Compressor Controls Corporation FwdPrev Rew Menu
Factors leading to onset of surge
• Startup• Shutdown• Operation at reduced throughput• Operation at heavy throughput with:
– Trips– Power loss– Operator errors– Process upsets– Load changes– Gas composition changes– Cooler problems– Filter or strainer problems– Driver problems
• Surge is not limited to times of reduced throughput.
• Surge can occur at full operation
Compressors
© 2002 Compressor Controls Corporation FwdPrev Rew Menu
Protection #2: Recycle Trip
Protection #3: Safety On
Compressor ControlCompressor ControlObjectives
Antisurge Control
Performance Control
Other topics
Loadsharing
Major challenges of Compressor ControlLocation of the
surge limit
High speed ofapproaching surge
Control loop interactions
Loadsharing of multiple
compressors
Protection #1: PI Control
Basic antisurge Control System
Compressor Networks
Base Loading Parallel
Compressors
Equal Flow Division System
Equidistant Loadsharing System
Compressor Efficiency
Fall-back strategiesPressure Override Control (POC)Flow Measuring Devices (FMD’s)
Antisurge Control Valve
Piping lay-out considerations
Dynamic simulation single compressorDynamic simulation parallel compressors
Influence of controller execution time
Output linearization
The tight shut-off line

© 2002 Compressor Controls Corporation FwdPrev Rew Menu
Objectives (user benefits)
1. Increase reliability of machinery and process• Prevent unnecessary process trips and
downtime• Minimize process disturbances • Prevent surge and surge damage • Simplify and automate startup and shutdown
2. Increase efficiency of machinery and process• Operate at lowest possible energy levels• Minimize antisurge recycle or blow-off• Minimize setpoint deviation• Maximize throughput using all available
horsepower• Optimize loadsharing of multiple units
Compressor Control

© 2002 Compressor Controls Corporation FwdPrev Rew Menu
Major challenges of Compressor ControlMajor challenges of Compressor Control
Location of the surge limitHigh speed of
approaching surgeControl loop interactions
Loadsharing of multiple compressors
Compressor Control

© 2002 Compressor Controls Corporation FwdPrev Rew Menu
Calculating the distance between the SLL and the compressor operating point
The Ground Rule– The better we can measure the distance to surge, the
closer we can operate to it without taking risk
The Challenge
– The Surge Limit Line (SLL) is not a fixed line in the most commonly used coordinates. The SLL changes depending on the compressor inlet conditions: Ts, Ps, MW, ks
Conclusion– The antisurge controller must provide a distance to surge
calculation that is invariant of any change in inlet conditions
– This will lead to safer control yet reducing the surge control margin which means:
• Bigger turndown range on the compressor
• Reduced energy consumption during low load conditions
Major Challenges

© 2002 Compressor Controls Corporation FwdPrev Rew Menu
Commonly used (OEM provided) coordinate systems of the compressor map
• Typical compressor maps include: (Qs, Hp), (Qs, Rc), or (Qs, pd) coordinates, where:
Qs = Suction flow and can be expressed as actual or standard volumetric flowHp = Polytropic HeadRc = Compressor Ratio (pd / ps)pd = Discharge pressure of the compressorps = Suction pressure of the compressorks = Exponent for isentropic compression
• These maps are defined for (1) specific set
of inlet conditions: ps, Ts, MW and ks
Major Challenges
© 2002 Compressor Controls Corporation FwdPrev Rew Menu
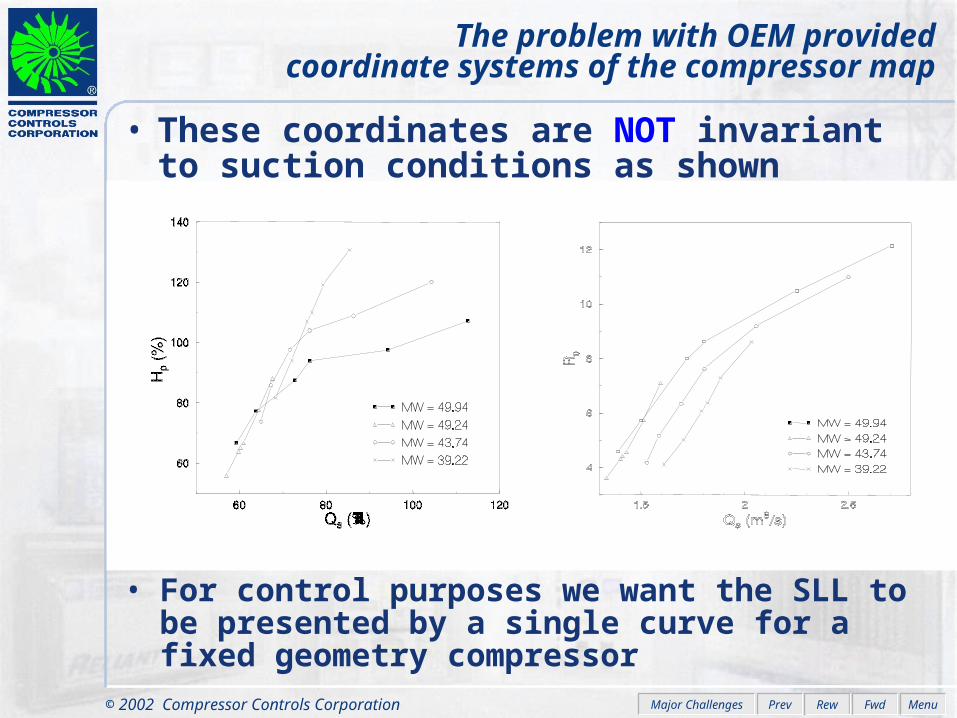
• These coordinates are NOT invariant to suction conditions as shown
The problem with OEM providedcoordinate systems of the compressor map
• For control purposes we want the SLL to be presented by a single curve for a fixed geometry compressor
Major Challenges
© 2002 Compressor Controls Corporation FwdPrev Rew Menu
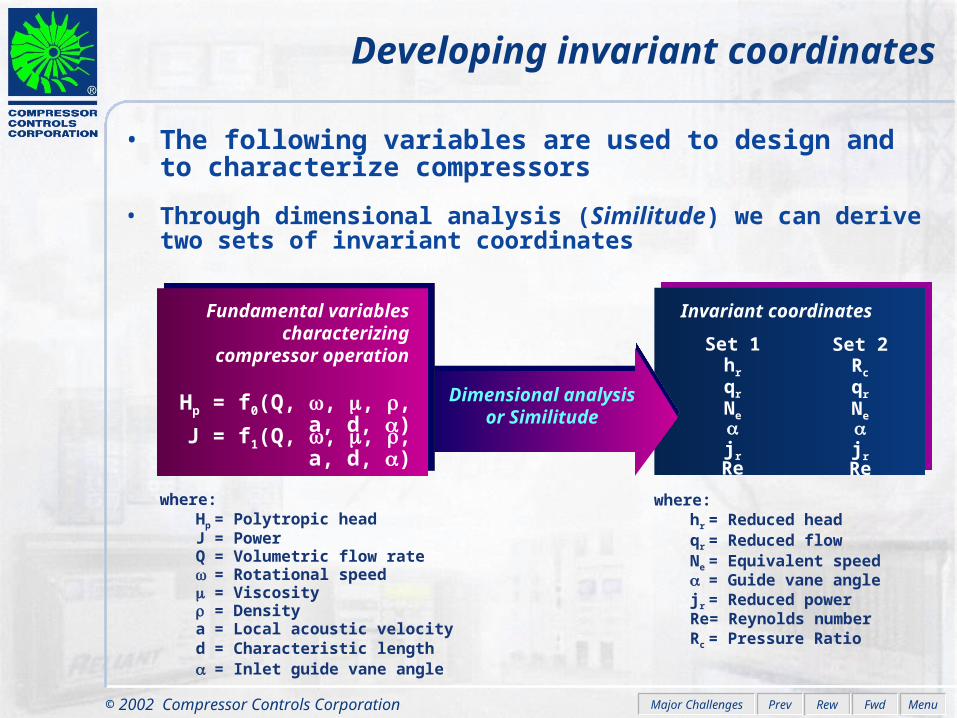
Developing invariant coordinates
where:Hp= Polytropic headJ = PowerQ = Volumetric flow rate = Rotational speed = Viscosity = Densitya = Local acoustic velocityd = Characteristic length = Inlet guide vane angle
Dimensional analysisor Similitude
where:hr = Reduced headqr = Reduced flowNe = Equivalent speed = Guide vane anglejr = Reduced powerRe= Reynolds numberRc = Pressure Ratio
• The following variables are used to design and to characterize compressors
Fundamental variables characterizing
compressor operation
Hp = f0(Q, , , , a, d, )
J = f1(Q, , , , a, d, )
Set 1hr
qr
Nejr
Re
Set 2Rc
qr
Nejr
Re
Invariant coordinates
• Through dimensional analysis (Similitude) we can derive two sets of invariant coordinates
Major Challenges

© 2002 Compressor Controls Corporation FwdPrev Rew Menu
NOT invariant coordinates (Hp, Qs) Invariant coordinates (hr, qr2)
where:Hp = Polytropic headQs = Volumetric suction flowhr = Reduced headQr
2 = Reduced flow squared
Coordinates (Hp ;Qs) and (hr ;qr2)
Major Challenges

© 2002 Compressor Controls Corporation FwdPrev Rew Menu
Coordinates (Rc ;Qs) and (Rc ;qr2)
NOT invariant coordinates (Rc, Qs)
qr2
Invariant coordinates (Rc, qr2)
where:Rc = Pressure ratioQs = Volumetric suction flowQr
2 = Reduced flow squared
Major Challenges

© 2002 Compressor Controls Corporation FwdPrev Rew Menu
Coordinates (Rc ;jr) and (Rc ;Ne2)
Invariant coordinates (Rc, jr) Invariant coordinates (Rc, Ne2)
where:Rc = Pressure ratiojr = Reduced powerNe
2 = Equivalent speed squared
Major Challenges
© 2002 Compressor Controls Corporation FwdPrev Rew Menu
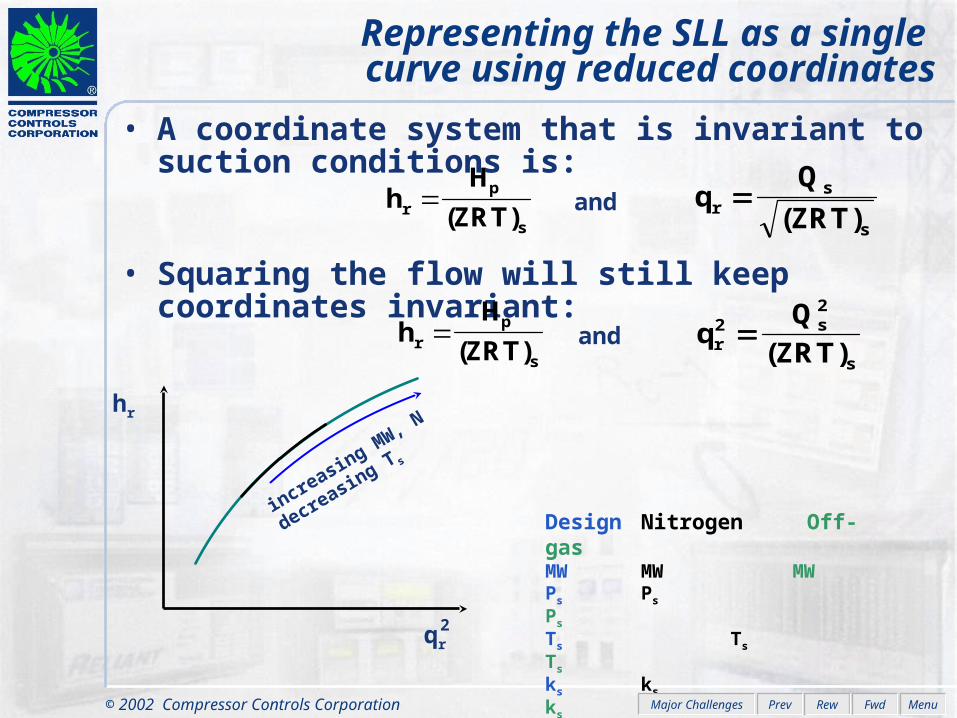
• A coordinate system that is invariant to suction conditions is:
hH
(ZRT)rp
s
and qQ
ZRTrs
s
( )
• Squaring the flow will still keep coordinates invariant:
hH
(ZRT)rp
s
and qQ
ZRTrs
s
22
( )
increasing MW, N
decreasing T s
qr2
hr
Representing the SLL as a single curve using reduced coordinates
Design Nitrogen Off-gas MW MW MWPs Ps Ps
Ts Ts Ts
ks ks ks
Major Challenges

© 2002 Compressor Controls Corporation FwdPrev Rew Menu
qr2 =
Qs2
(ZRT)s
where:R = Ru / MWRu = Universal gas constantR = Specific gas constantMW = Molecular Weight of the gasps = Suction pressureK = Orifice plate constantpo,s = Differential pressure across orifice plateTs = Temperature of the gas in suctionZs = Compressibility of gas in suction of
compressor
=
K . Zs . Ru . Ts
MW
po,s. ps
(ZRT)s
= po,s
ps
The antisurge controller calculates qr2 using ps and po,s
transmitters
Calculating qr2 (reduced flow squared)
Major Challenges

© 2002 Compressor Controls Corporation FwdPrev Rew Menu
hr = Hp
(ZRT)s
where:R = Ru / MWRt = Td / Ts Temperature ratioRc = pd / ps Pressure ratio Ru = Universal gas constantR = Specific gas constantMW = Molecular Weight of the gasPd = Discharge pressureps = Suction pressureZs = Suction compressibility = Exponent for polytropic compression
=
Zs . Ru . Ts
MW
Rc-1.
(ZRT)s
= Rc
-1
The antisurge controller calculates hr using pd, ps, Td and Ts transmitters
log(Rt)
log(Rc)For polytropic compression Rt = Rc
thus =
Calculating hr (reduced head)
Major Challenges
© 2002 Compressor Controls Corporation FwdPrev Rew Menu
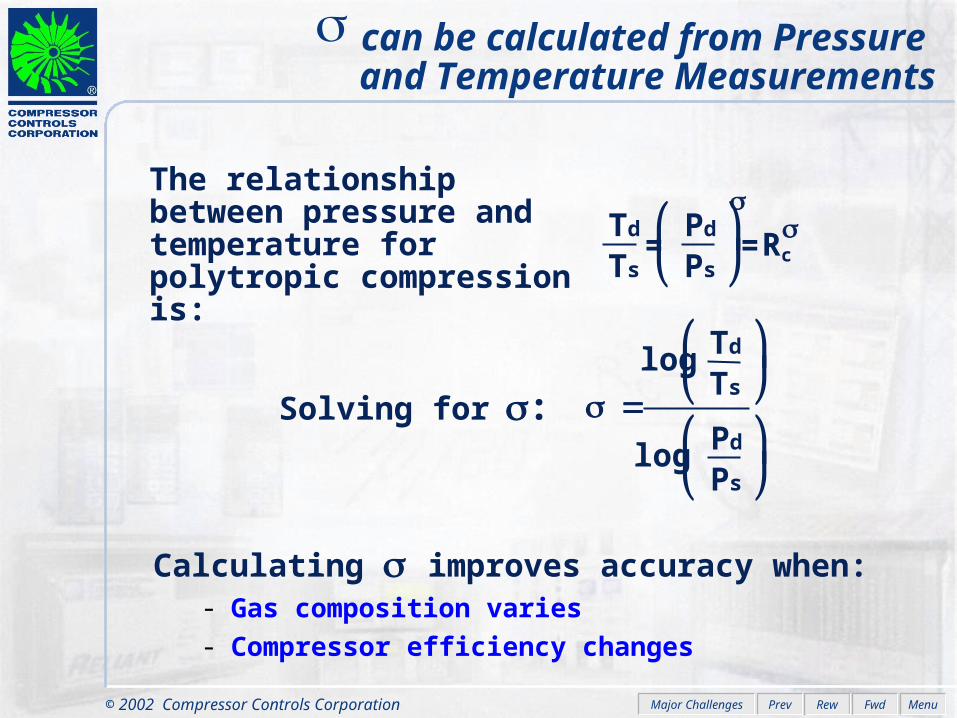
The relationship between pressure and temperature for polytropic compression is:
Calculating improves accuracy when:- Gas composition varies- Compressor efficiency changes
Solving for:
can be calculated from Pressure and Temperature Measurements
Ts
Td = =
Ps
Pd
Rc
log
log
Ts
Td
Ps
Pd
Major Challenges

© 2002 Compressor Controls Corporation FwdPrev Rew Menu
• The surge parameter is defined as: S
fq
sr
r op
12
(h )
,
• The function f1 returns the value of qr2 on
the SLL for input hr
hr
qr,SLL2
• Non-linearity in the Surge Limit Line can be accommodated using a function based on a piecewise characterization of either map axis
qr2
hr
Building the Surge Limit Line
Major Challenges

© 2002 Compressor Controls Corporation FwdPrev Rew Menu
qr2
hr
qr,op2
• The function f1 returns the value of qr on the SLL for input hr
2
hr
qr,SLL2
• As a result: Ss = qr,op2
qr,SLL2
OP
OP = Operating Point
• Ss < 1stable operating zone
Ss < 1• Ss = 1
surge limit line (SLL)
S s = 1
• Ss > 1surge region
Ss > 1
The surge parameter Ss
Major Challenges

© 2002 Compressor Controls Corporation FwdPrev Rew Menu
Introducing the distance between the operating point and the Surge Control Line
• Step 1 Introduce parameter: d = 1 - Ss
qr2
hr
Ss < 1
Ss > 1
Ss = 1d = 0
d > 0
d < 0
• Step 2 Introduce parameter: DEV = d - surge margin
DEV = 0
Surge margin
DEV > 0
DEV < 0
• The parameter DEV is independent of the size of the compressor and will be the same for each compressor in the plant
- Operating Point
Benefits:One standard surge parameter in the plantNo operator confusion:
DEV > 0 GoodDEV = 0 Recycle LineDEV < 0 Bad
Major Challenges

© 2002 Compressor Controls Corporation FwdPrev Rew Menu
• Reduced Head hr can be replaced by Rc while keeping the coordinate system invariant to suction conditions
• The surge parameter Ss now becomes Ss =f1(Rc)
qr,op2
where the function f1( ) returns the value of qr,SLLon the SLL for the input Rc
2
• This eliminates the need for Td and Ts transmitters for control
Important Note: CCC still strongly recommends Td and Ts transmitters as well as rotational speed N for compressor monitoring purposes
Simplifying the surge parameterby replacing hr with Rc
Major Challenges

© 2002 Compressor Controls Corporation FwdPrev Rew Menu
• An antisurge algorithm can be designed around two transmitters: po and pc
• The parameter Ss =f1(Rc)
qr2
is invariant to inlet conditions and speed
• For two transmitters choose the function: f1 to be (Rc - 1)
Ss =f1(Rc)
qr2
=Rc - 1
po
ps
pd
ps
- 1( ) . ps
po
= =pd - ps
po
= po
pc
• Selecting the specific function for f1(Rc) to be (Rc - 1) keeps the map invariant to inlet conditions and speed
The simplest CCC surge parameter
Major Challenges

© 2002 Compressor Controls Corporation FwdPrev Rew Menu
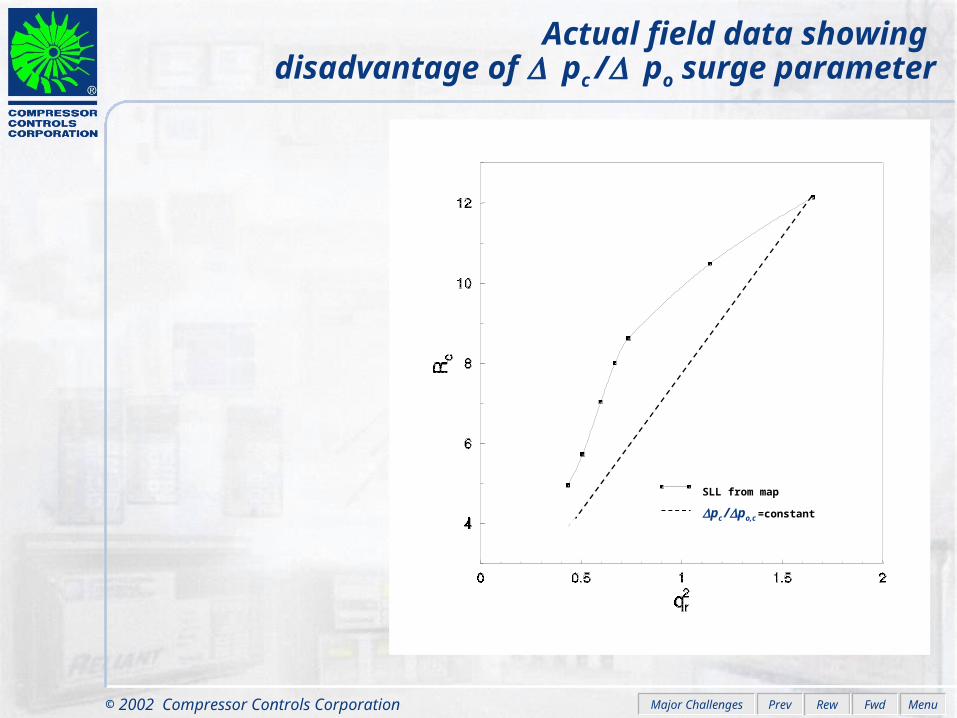
• The SLL is rarely a straight line in the coordinates qr2 and
Rc • The parameter pc /po represents a straight line in the
invariant coordinates qr2 and Rc
• The pc /po approach results in loss of turn down and unnecessary recycle
qr2
Rc
Actual Surge Limit Line (SLL)
SLL calculated by antisurge controller using pc /po = constant
Loss of operating envelope
Disadvantage of the pc /po surge parameter
Major Challenges
© 2002 Compressor Controls Corporation FwdPrev Rew Menu
SLL from map
pc /po,c =constant
Actual field data showing disadvantage of pc /po surge parameter
Major Challenges

© 2002 Compressor Controls Corporation FwdPrev Rew Menu
Calculating equivalent flows when suction flow is measured
Major Challenges

© 2002 Compressor Controls Corporation FwdPrev Rew Menu
Surge Protection of multi-section compressors
Discharge Flow measured
• A multi-section compressor has one or more ports between the suction and discharge where sidestreams can be withdrawn or injected.
• This generally requires the calculation of Equivalent Flow Measurements for all but the first or last section or the calculation of proximity to surge from Combined Mass Flow rates.
• If a single recycle valve is used to protect more than one section of the compressor, Valve Sharing should be employed to ensure adequate protection under changing process conditions.
Suction Flow measured
Major Challenges
© 2002 Compressor Controls Corporation FwdPrev Rew Menu
Equivalent Flow Measurements
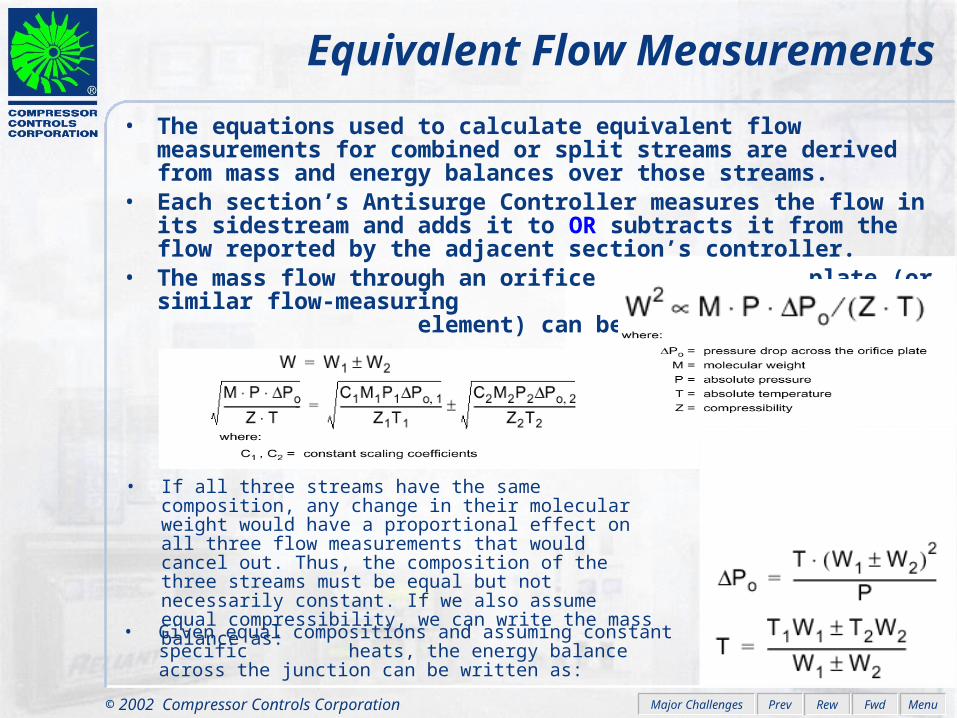
• The equations used to calculate equivalent flow measurements for combined or split streams are derived from mass and energy balances over those streams.
• Each section’s Antisurge Controller measures the flow in its sidestream and adds it to OR subtracts it from the flow reported by the adjacent section’s controller.
• The mass flow through an orifice plate (or similar flow-measuring element) can be calculated as:
• Given equal compositions and assuming constant specific heats, the energy balance across the junction can be written as:
• If all three streams have the same composition, any change in their molecular weight would have a proportional effect on all three flow measurements that would cancel out. Thus, the composition of the three streams must be equal but not necessarily constant. If we also assume equal compressibility, we can write the mass balance as:
Major Challenges

© 2002 Compressor Controls Corporation FwdPrev Rew Menu
• If Controller’s Mode fA 64 is selected, the Controller uses its standard formula and compensating inputs to calculate the squared, normalized side-stream mass flow:
Combined Mass Flow
• Mode fA 64 should be used only if the molecular weights and compressibilities of the streams are constant (but not necessarily equal), or at least nearly enough so to achieve good results using a worst-case composition.
• The compensating pressure and temperature measurements should correspond to the sidestream conditions.
• That pressure will usually be either the suction or discharge pressure, unless there is a valve between the orifice and compressor.
• This sidestream flow is added to the mass flow (Wc) reported by
a specified Adjacent Section Controller:
Major Challenges

© 2002 Compressor Controls Corporation FwdPrev Rew Menu
• Each section of a compressor should be equipped with its own Antisurge Controllers even if there is only one recycle path and control valve for the entire machine.
Valve Sharing
• The Master Controller protects the entire compressor from surge by selecting the highest of several PI and RT responses. The response of a valve-sharing is used to manipulate the recycle valve.
Major Challenges

© 2002 Compressor Controls Corporation FwdPrev Rew Menu
Calculating equivalent flows when discharge flow is measured
Major Challenges

© 2002 Compressor Controls Corporation FwdPrev Rew Menu
Coping with the high speed of approaching surge
• Increase overall system speed of response wherever feasible– Transmitters– Valves– Controllers– System Volumes
• Specialized Control Responses– Automated open loop (Recycle Trip)– Control loop decoupling– Adaptive surge control line– Adaptive gain
Major Challenges

© 2002 Compressor Controls Corporation FwdPrev Rew Menu
• Performance curves are usually very flat near surge
• Even small changes in compressor pressure differential cause large flow changes
• The speed of approaching surge is high; in only 0.4 seconds, PO dropped by 14%, with a 2% change in Pc
Pd
Qs
AD
100%
0
100%
0
100%
0
1 SEC.
Po A CDB
The approach to surge is fast
Pd A C D
B
Pc A C D
B
Major Challenges

© 2002 Compressor Controls Corporation FwdPrev Rew Menu
For a 2% increase in pressure differential (Pc), flow rate Po dropped 9% in 0.3 sec.
100%
0
0
Po
Pc
100%
1 sec.
The approach to surge is fast another example
Major Challenges

© 2002 Compressor Controls Corporation FwdPrev Rew Menu
Antisurge ControlAntisurge Control
Protection #1: PI ControlProtection #2: Recycle Trip
Protection #3: Safety OnOutput linearization
The tight shut-off line
Basic antisurge Control System
Compressor Control

© 2002 Compressor Controls Corporation FwdPrev Rew Menu
Surge parameter based on invariant coordinates Rc and qr
– Flow measured in suction (Po)– Ps and Pd transmitters used to calculate Rc
1UIC
VSDS
Compressor
1FT 1
PsT1
PdT
• The antisurge controller UIC-1 protects the compressor against surge by opening the recycle valve
DischargeSuction
• Opening of the recycle valve lowers the resistance felt by the compressor
• This takes the compressor away from surge
Basic Antisurge Control System
Rc
qr2
Rprocess
Rprocess+valve
Antisurge Control

© 2002 Compressor Controls Corporation FwdPrev Rew Menu
A
Rc
B • When the operating point crosses the SCL, PI control will open the recycle valve
• PI control will give adequate protection for small disturbances
SLL = Surge Limit Line
SCL = Surge Control Line
qr2
Antisurge Controller Operation Protection #1 The Surge Control Line (SCL)
• PI control will give stable control during steady state recycle operation
• Slow disturbance example
Antisurge Control

© 2002 Compressor Controls Corporation FwdPrev Rew Menu
Adaptive Gain Enhancing the Effectiveness of the PI Controller
A
Rc
B
• When the operating point moves quickly towards the SCL, the rate of change (dS/dT) can be used to dynamically increase the surge control margin.
• This allows the PID controller to react earlier.
• Smaller steady state surge control margins can be used w/o sacrificing reliability.
• Fast disturbance exampleQ2
Antisurge Control

© 2002 Compressor Controls Corporation FwdPrev Rew Menu
Antisurge Controller Operation Protection #2 The Recycle Trip® Line (RTL)
Benefits:– Energy savings due
to smaller surge margins needed
– Compressor has more turndown before recycle or blow-off
– Surge can be prevented for virtually any disturbance
SLL = Surge Limit LineRTL= Recycle Trip® Line
SCL = Surge Control Line
Output to Valve
Time
Recycle Trip® Response
PI Control Response
PI Control Recycle Trip®
Action
+
To antisurge valve
Total Response
Rc
Q2
OP
Antisurge Control

© 2002 Compressor Controls Corporation FwdPrev Rew Menu
Improving the accuracy of Recycle Trip® open loop control
• Recycle Trip® is the most powerful method known for antisurge protection
• But, open loop control lacks the accuracy needed to precisely position the antisurge valve
• Open loop corrections of a fixed magnitude (C1) are often either too big or too small for a specific disturbance
• The rate of change (derivative) of the compressor operating point has been proven to be an excellent predictor of the strength of the disturbance and the magnitude required from the Recycle Trip® response
• Therefore, the magnitude of actual step (C) of the Recycle Trip® response is a function of the rate of change of the operating point or d(Ss)/dt
Antisurge Control

© 2002 Compressor Controls Corporation FwdPrev Rew Menu
d(Ss)dt
C = C1Td
Output to valve
Time
where:• C = Actual step to the valve• C1 = Constant - also defines
maximum step• Td = Scaling constant• d(Ss)/dt = Rate of change of the
operating point
Medium disturbance
PI ControlRecycle Trip®
Total
Large disturbanceOutput to valve
Time
PI Control
Recycle Trip®
Total
Benefits• Maximum protection
– No surge– No compressor damage
• Minimum process disturbance– No process trips
Recycle Trip®
Response calculation:
100%
0%
Recycle Trip® based on derivative of Ss
Antisurge Control
© 2002 Compressor Controls Corporation FwdPrev Rew Menu
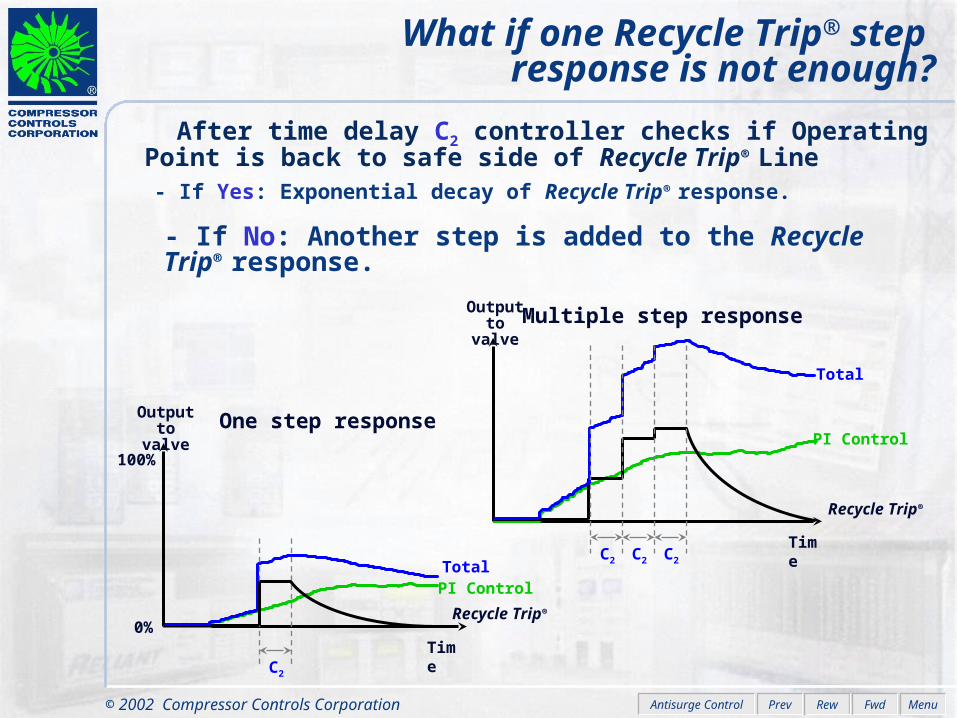
After time delay C2 controller checks if Operating Point is back to safe side of Recycle Trip® Line- If Yes: Exponential decay of Recycle Trip® response.
Output to valve
Time
One step response
PI Control
Recycle Trip®
Total
100%
0%
C2
Multiple step responseOutput to valve
Time
PI Control
Recycle Trip®
Total
C2 C2 C2
What if one Recycle Trip® step response is not enough?
- If No: Another step is added to the Recycle Trip® response.
Antisurge Control

© 2002 Compressor Controls Corporation FwdPrev Rew Menu
Additional surge margin
• Benefits of Safety On® response:- Continuous surging is avoided- Operators are alarmed about surge
• Compressor can surge due to:– Transmitter calibration
shift– Sticky antisurge valve
or actuator– Partially blocked
antisurge valve or recycle line
– Unusually large process upset
Antisurge Controller Operation Protection #3
The Safety On® Response (SOL)
Rc
qr2
SLL - Surge Limit LineRTL - Recycle Trip® LineSCL - Surge Control Line
New SCL
New RTL
SOL - Safety On® Line
Antisurge Control

© 2002 Compressor Controls Corporation FwdPrev Rew Menu
Built-in surge detector
Pressure and Flow Variations During a Typical Surge Cycle
100%
100%
0%
0%
Pd
Po
20 to 50 milli-seconds
1 TO 2 SECONDS
• Surge signature should be recorded during commissioning.
• Rates of change for flow and pressure transmitters should be calculated.
• Thresholds should be configured slightly more conservative than the actual rates of change during surge.
• Surge is detected when the actual rates of change exceed the configured thresholds
• The following methods have been used:– Rapid drops in flow and pressure– Rapid drop in flow or pressure– Rapid drop in flow only – Rapid drop in pressure only
• When surge is detected a Safety On® response is triggered
• A digital output can be triggered upon a configurable number of surge cycles
Antisurge Control

© 2002 Compressor Controls Corporation FwdPrev Rew Menu
Increase compressor system reliability and availability with fall-back strategies
• Over 75% of the problems are in the field and not in the controller
• The CCC control system has fall-back strategies to handle these field problems
• The controller continuously monitors the validity of its inputs
• If an input problem is detected the controller ignores this input and automatically switches to a fall-back mode
• Benefits– Avoids nuisance trips– Alarms operator of latent failures– Increases machine and process availability
Antisurge Control

© 2002 Compressor Controls Corporation FwdPrev Rew Menu
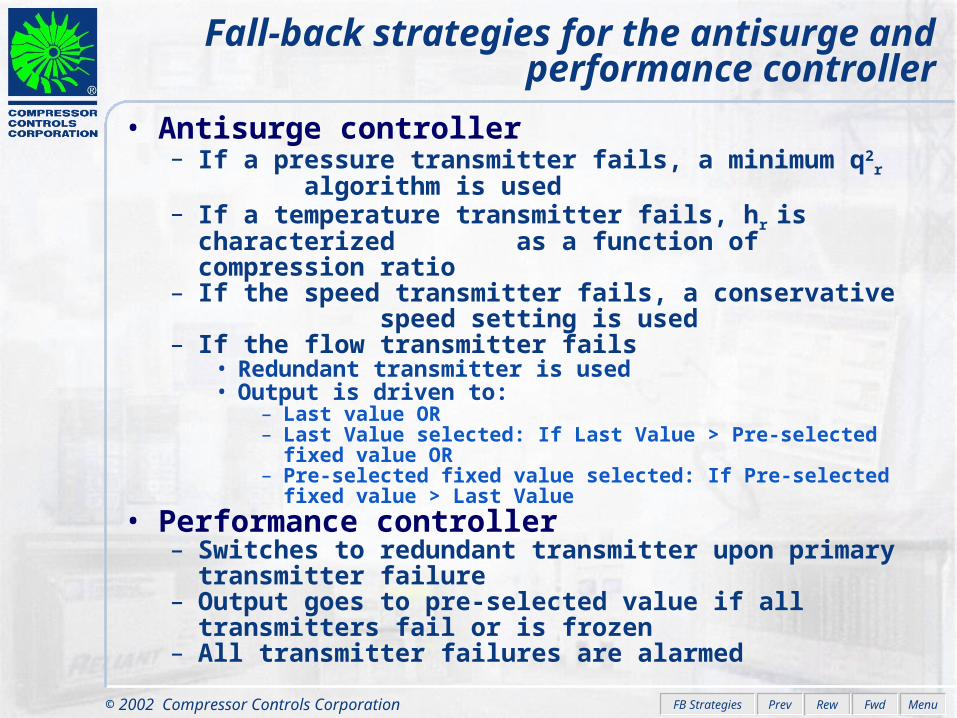
Fall-back strategies for the antisurge and performance controller
• Antisurge controller– If a pressure transmitter fails, a minimum q2r algorithm is
used– If a temperature transmitter fails, hr is characterized as a
function of compression ratio– If the speed transmitter fails, a conservative speed
setting is used– If the flow transmitter fails
• Redundant transmitter is used• Output is driven to:
– Last value OR– Last Value selected: If Last Value >Pre-selected fixed value OR
Pre-selected fixed value selected: If Pre-selected fixed value>Last Value
• Performance controller– Switches to redundant transmitter upon primary
transmitter failure– Output goes to pre-selected value if all transmitters fail or
is frozen• All transmitter failures are alarmed
Antisurge Control

© 2002 Compressor Controls Corporation FwdPrev Rew Menu
Controller output
Flow ratethrough
valve
Valve trim
quick opening
Controller output
Notes• Used to improve controllers operation
when non-linear valves are used• Used on retrofits to avoid additional investment in new valve• Works well with equal percentage characteristics• Works less satisfactory with quick opening characteristics
• For antisurge control a linear valve is preferred
• Linear valve gives the same dynamic flow response over its complete stroke
• Existing valve has equal percentage trim
• Controller output is characterized as mirror image in the linear valve line
• Dynamic flow response becomes linear
• Existing valve has quick opening trim
• Controller output is characterized as mirror image in the linear valve line
• Dynamic flow response becomes linear
Valve trimequal percentage
Controller output
Output linearization
Antisurge Control

© 2002 Compressor Controls Corporation FwdPrev Rew Menu
Controlleroutput
Flow ratethrough
valve
• Many antisurge valves have the following characteristic:
• from 0% to low clamp value the flow rate through the valve is (almost) zero and does not change
• Once the low clamp is reached the characteristic is linear
• Typical low clamp value can be 5% - we will use the 5% as the value throughout in this example
0% to the valve
Low clamp on controller output
Dynamic control range
TSL = Tight Shut-off Line
B
Rc
qr2
SLL RTLSCL
SOL
C
PI Control
Controlleroutput
The Tight Shut-off Line (TSL)
A
A Time
BC
Antisurge Control

© 2002 Compressor Controls Corporation FwdPrev Rew Menu
Performance ControlPerformance Control
Discharge throttlingSuction throttling
Adjustable guide vanesSpeed variationLimiting Control
Blow-off or recycle
Interacting Antisurge &Performance Loops
Loop Decoupling
Compressor Control

© 2002 Compressor Controls Corporation FwdPrev Rew Menu
• Also called:– Throughput control– Capacity control– Process control
• Matches the compressor throughput to the load
• Can be based on controlling:– Discharge pressure– Suction pressure– Net flow to the user
Compressor Performance Control
Performance Control

© 2002 Compressor Controls Corporation FwdPrev Rew Menu
PIC - SP
• Compressor operates in point A
Pd
qr2
Shaft power
qr2
Curve 1
ARprocess + Rvalve
• Required power in point A is P1
Curve 1
P1
• Pressure is controlled by blow-off
• Point B represents the point that would deliver the pressure for Rprocess
Curve 2
Rprocess
B
• Required power in point B is P2
Curve 2
P2
• Power loss is P1 - P2• Qloss represents energy
waste
Qloss
Notes• Most inefficient control
method• Regularly found in plant
air systems• Rare in other systems• Not recommended
Notes• Curve 2 represents:
- Lower speed on variable speed systems
- IGVs closed on variable geometry compressors
- Inlet throttle valve closed on fixed speed compressors
Performance Control by blow-off or recycle
PT
1
PIC1
Process
Performance Control

© 2002 Compressor Controls Corporation FwdPrev Rew Menu
• Compressor operates in point A
Pd
qr2
Shaft power
qr2
Curve 1
ARprocess + Rvalve
• Required power is P1
Curve 1
P1
• Pressure is controlled by pressure drop over valve
PIC - SP
Pressure loss across valve
• Opening of valve would reduce resistance to Rprocess
Rprocess
• Lower resistance would require less speed and power
Curve 2
Curve 2
P2
• Power loss is P1 - P2Notes:• Extremely inefficient
(consumes approx. the same power for every load)
• Rarely used• Not recommended
Notes:• Curve 2 represents:
- Lower speed on variable speed systems
- IGVs closed on variable geometry compressors
- Inlet throttle valve closed on fixed speed compressors
Performance Control by discharge throttling
PT
1
PIC1
Process
Performance Control

© 2002 Compressor Controls Corporation FwdPrev Rew Menu
• Inlet valve manipulates suction pressure
Pd
qr2
Shaft power
qr2
• Changing suction pressure generates a family of curves
Suction valve open
Suction valve throttled
• Pressure is controlled by inlet valve position
PIC - SP
• Compressor operates in point A for given Rprocess
A
Rprocess
• Required power is P1
P1
Notes• Common on electric
motor machines• Much more efficient
than discharge throttling
• Power consumed changes proportional to the load
• Throttle losses are across suction valve
Performance Control by suction throttling
PT
1
PIC1
Process
Performance Control

© 2002 Compressor Controls Corporation FwdPrev Rew Menu
• Change of guide vanes angle results in different compressor geometry
Pd
qr2
Shaft power
qr2
• Different geometry means different performance curve
min
OP
max
• Pressure is controlled by inlet guide vane position
PIC - SP
• Compressor operates in point A for given Rprocess
A
Rprocess
• Required power is P1
P1
PT1
PIC1
Process
Notes:• Improved turndown• More efficient than
suction throttling • Power consumed is
proportional to the load• Power loss on inlet
throttling is eliminated
Performance Control by adjustable guide vanes
Performance Control

© 2002 Compressor Controls Corporation FwdPrev Rew Menu
• Changing speed generates a family of curves
Pd
qr2
Shaft power
qr2
Nmin
NOP
Nmax
• Pressure is controlled by speed of rotation
PIC - SP
• Compressor operates in point A for given Rprocess
A
Rprocess
• Required power is P1
P1
PT1
PIC1
Process
SIC1
Notes• Most efficient:
(Power f(N)3) • Steam turbine, gas
turbine or variable speed electric motor
• Typically capital investment higher than with other systems
• No throttle losses
Performance Control by speed variation
Performance Control

© 2002 Compressor Controls Corporation FwdPrev Rew Menu
• While controlling one primary variable, constrain the performance control on another variable
• Exceeding limits will lead to machine or process damage
• Performance controller controls one variable and can limit two other variables.
Limiting control to keep the machine in its stable operating zone
CONTROL BUT DO NOT EXCEED
Discharge Pressure Max. Motor Current
Suction Pressure Max. Discharge Pressure
Net Flow Min. Suction Pressure
Suction Pressure Max. Discharge Temperature
Performance Control

© 2002 Compressor Controls Corporation FwdPrev Rew Menu
N4
D
• Primary variable Pd
PIC-SP
• Limiting variable PowerPower limit • Compressor operates in point A for R1 at N1
N1
A
R1
Qs, vol
Rc
• Process resistance changes from R1 to R2
B
R2
• PIC will speed machine up to N2 in order to control pressure Pd
N2
• Machine hits power limit• Compressor operates in
point B for R2 at N2
• Process resistance decreases further to R3
R3
• PIC would like to speed machine up to N4 and operate in point D
• However power limiting loop takes control and controls machine at speed N3
• Compressor will operate in point C for R3 at N3
N3
C
Benefits:• Maximum protection
– No machinery damage• Maximize production
– Machine can be pushed to the limits without risk of damage
Note: Same approach for othervariables (pressures,temperatures, etc.)
Power limiting with the Performance Controller
Performance Control

© 2002 Compressor Controls Corporation FwdPrev Rew Menu
1UIC
VSDS
Compressor
1FT 1
PsT1
PdT
• The antisurge controller can be configured to limit:- Maximum discharge pressure (Pd)- Minimum suction pressure (Ps) - Both maximum Pd and minimum Ps
• This does NOT conflict with antisurge protection
DischargeSuction
Limiting Ps or Pd using the Antisurge Controller
Performance Control

© 2002 Compressor Controls Corporation FwdPrev Rew Menu
• Interaction starts at B• Performance controller on
discharge pressure reduces performance to bring pressure back to setpoint
• Unless prevented, PIC can drive compressor to surge
• Antisurge controller starts to operate at B
• Even if surge is avoided, interaction degrades pressure control accuracy
• Results of interaction– Large pressure deviations
during disturbances– Increased risk of surge
AC
Po
PIC-SP
Rc
Ps
SLL
SC
L
B
Interacting Antisurge & Performance Loops
Performance Control

© 2002 Compressor Controls Corporation FwdPrev Rew Menu
Performance & Antisurge Controller’s interaction
• Both controllers manipulate the same variable - the operating point of the compressor
• The controllers have different and sometimes conflicting objectives
• The control action of each controller affects the other
• This interaction starts at the surge control line - near surge - and can cause surge
Performance Control

© 2002 Compressor Controls Corporation FwdPrev Rew Menu
Ways to cope with Antisurge andPerformance Loop interactions
• De-tune the loops to minimize interaction. Result is poor pressure control, large surge control margins and poor surge protection
• Put one loop on manual, so interaction is not possible. Operators will usually put the Antisurge Controller on manual. Result - no surge protection and often partially open antisurge valve
• Decouple the interactions. Result - good performance control accuracy, good surge protection and no energy wasted on recycle or blow off
Performance Control

© 2002 Compressor Controls Corporation FwdPrev Rew Menu
Disturbance comes from the discharge side
• Pd,2 increases• Ps,2 remains constant• Rc,2 increases• Section 2 moves towards surge
Disturbance
• The system is oscillating• Slowing down the
controller tuning would lead to:- Increased risk of surge
• Compressor damage• Process trips
- Bigger surge margins• Energy waste
Interacting Antisurge Control Loops
Rc,2
qr,22
RRc,1
qr,12
R
RR
Antisurge controller UIC-1 will open the recycle valve to protect section 1 against surge
• Pd,1 decreases• Ps,1 increases• Rc,1 decreases• Section 1 moves away from surge
Opening of recycle valve on section 1 caused Pd,1 = Ps,2 to decreaseResult:
• Ps,2 decreases• Pd,2 remains constant• Rc,2 increases• Section 2 moves towards surge
Antisurge controller UIC-2 will open the recycle valve to protect section 2 against surge
• Pd,2 decreases• Ps,2 increases• Rc,2 decreases• Section 2 moves away from surge
Opening of recycle valve on section 2 caused Ps,2 = Pd,1 to increaseResult:
• Pd,1 increases• Ps,1 remains constant• Rc,1 increases• Section 1 moves towards surge
1
PIC
2UIC
1UIC
VSDS
Section 1 Section 2
Performance Control

© 2002 Compressor Controls Corporation FwdPrev Rew Menu
• All CCC controllers are connected on a serial network
1
PIC
2UIC
1UIC
VSDS
Section 1 Section 2
Serial network
Serial network
• This allows them to coordinate their control actions• When UIC-2 opens the recycle valve:
- Section 2 will be protected against surge- Section 1 will be driven towards surge
• How much section 1 is driven towards surge depends on how much the recycle valve on section 2 is opened
• The output of UIC-2 is send to UIC-1 to inform UIC-1 about the disturbance that is arriving
• UIC-1 anticipates the disturbance by immediately opening its valve
Note: The same applies when the antisurge valve on section 1 is opened first
Loop Decoupling between multiple Antisurge Controllers
Performance Control

© 2002 Compressor Controls Corporation FwdPrev Rew Menu
FAMode
PI RT
Loop Decoupling
Antisurge Controller UIC-1
Analog Inputs
DEV1
FAMode
PI RT
Antisurge Controller UIC-2
Analog Inputs
DEV2
• Antisurge controller UIC-2 opens its valve to protect section 2 against surge
To antisurge valve 2
+
• UIC-1 is protecting section 1 against surge using PI and Recycle Trip®
+
To antisurge valve 1
• UIC-2 reports PI and Recycle Trip® output to UIC-1
• Loop decoupling block multiplies reported PI and Recycle Trip® values with decoupling gain M2
PI2 . M2
+
RT2 . M2
• Loop decoupling value is added to output to antisurge valve 1
+
• Loop decoupling values of other controllers (performance and antisurge) are added to output to antisurge valve 1
From other controllers
PIn . Mn
+
RTn . Mn
• Each controller has its own decoupling gain Mn to allow for tuning of relative loop gains between different controllers
• UIC-1 reports its PI and Recycle Trip values to UIC-2
• Same decoupling takes place
Loop Decoupling
PI1 . M1
+
RT1 . M1
PIn . Mn
+
RTn . Mn
+
From other controllers
Benefits• Avoids control system oscillations• Allows faster tuning of control system• Reduced risk of surge• Allows closer operation to surge limits
without taking risk
Loop Decoupling simplified Block Diagram
VSDS
Section 1 Section 2
Serial network 2
UIC
1
UIC
Performance Control

© 2002 Compressor Controls Corporation FwdPrev Rew Menu
LoadsharingLoadsharing
Compressor Networks
Base Loading Parallel Compressors
Equal Flow Division System
Equidistant Loadsharing System
Compressor Efficiency
Compressor Control

© 2002 Compressor Controls Corporation FwdPrev Rew Menu
• Compressors are often operated in parallel and sometimes in series
• The purposes of networks include:– Redundancy– Flexibility– Incremental capacity additions
• Often each compressor is controlled, but the network is ignored
• Compressor manufacturers often focus on individual machines.
• A “network view” of the application is essential to achieve good surge protection and good performance control of the network.
Compressor networks
Loadsharing

© 2002 Compressor Controls Corporation FwdPrev Rew Menu
Control system objectives for compressors in parallel:
• Maintain the primary performance variable (pressure or flow)
• Optimally divide the load between the compressors in the network, while:– Minimizing risk of surge– Minimizing energy consumption– Minimizing disturbance of starting and stopping
individual compressors
Compressor networks
Loadsharing

© 2002 Compressor Controls Corporation FwdPrev Rew Menu
Process
PIC1
1UIC
VSDS
Compressor 1
2UIC
VSDS
Compressor 2
HIC1
Suction header
Swing machine
Base machine
Notes• All controllers act
independently• Transmitters are
not shown
Base Loading Flow Diagram for Control Process
Loadsharing

© 2002 Compressor Controls Corporation FwdPrev Rew Menu
Rc,1
qr,12
Rc,2
qr,22
Compressor 1 Compressor 2
• Machines operate at same Rc since suction and discharge of both machines are tied together
PIC-SP
• Base load one or more compressors and let the other(s) absorb the load swings
Swing machine Base machine
• Base machine is fully loaded and runs without recycle
QC,2= QP,2
• Swing machine can be running with recycle
QC,1QP,1
where:QP = Flow to processQC= Total compressor flowQC - QP = Recycle flow
• Load could be re-divided to eliminate recycle
QP,1
QP,1 + QP,2 = QP,1 + QP,2
Notes:• Base loading is inefficient• Base loading increases the risk of surge
since compressor #1 will take the worst of any disturbance
• Base loading requires frequent operator intervention
• Base loading is NOT recommended
Base Loading Parallel Compressor Control
QP,2
Loadsharing

© 2002 Compressor Controls Corporation FwdPrev Rew Menu
Process
PIC1
1UIC
Compressor 1
VSDS
Compressor 2
Suction header
Notes• Performance controllers
act independent of antisurge control
• Higher capital cost due to extra Flow Measurement Devices (FMD)
• Higher energy costs due to permanent pressure loss across FMD’s
1FIC
2FIC
2UIC
outout
out
RSPRSP
RSPRSP
RSPRSP
outout
RSPRSP
Equal Flow Division Loadsharing Flow Diagram for Control Process
VSDS
Loadsharing

© 2002 Compressor Controls Corporation FwdPrev Rew Menu
• Machine 2 operates with recycle while machine 1 still has turn down
• Machines operate at same Rc since suction and discharge of both machines are tied together
• Equal flow division might work if both machines are identical
• Machines are never identical except by coincidence
• Bias relay on remote setpoint would only work if curves have same steepness
Notes:• Requires additional capital investment in
FMD’s• Requires additional energy due to
permanent pressure loss across FMD’s• Poor pressure control due to positive
feedback in control system (see next)• Equal flow division is NOT recommended
Rc,1
qr,12
Rc,2
qr,22
PIC-SP
QP,1 QP,2QC,2
Equal flow Equal flowQP,1 = QP,2
Equal Flow Division Loadsharing Parallel Compressor Control
Compressor 1 Compressor 2
where:QP = Flow to processQC= Total compressor flowQC - QP = Recycle flow
Loadsharing

© 2002 Compressor Controls Corporation FwdPrev Rew Menu
Q2
Rc
N1
N3
N2
• In a typical master-slave control scheme the slave needs to be approx. 5 times faster than the master
A
• The machine is operating in point A
• This is the intersection of 4 lines:• Resistance line R1• Performance curve N1• PIC-SP• FIC-SP = Output of
PIC
R1
PIC-SP
FIC-SP
• Process disturbance causes the resistance to change from R1 to R2
R2
• As a result the machine moves to point B
B
• Since the PIC is slow it does not move its output yet which is the FIC-SP
• The FIC reacts fast and will try to maintain its SP
• The FIC will speed up the machine to point C at speed N3
C
• The disturbance is amplified
• Positive feedback system
• Only as the PIC starts to reduce its output to control pressure the FIC-SP comes down and the pressure is restored
D
Notes• Causes instability near surge• Poor pressure control due to
positive feedback in control system
PIC1
OUTRSP
FIC1
OUTRSP
Master Slave
SIC1
Dynamic Response / Pressure To Flow Cascade
• Pressure controller (PIC) provides Remote SetPoint (RSP) for Flow controller (FIC)
Loadsharing
• The FIC provides the RSP for the speed controller (SIC), suction throttle valve or guide vanes
• The PIC is the master and the FIC is the slave
Master Slave

© 2002 Compressor Controls Corporation FwdPrev Rew Menu
Notes• All controllers are
coordinating control responses via a serial network
• Minimizes recycle under all operating conditions
Process
1UIC
VSDS
Compressor 1
VSDS
Compressor 2
Suction header
1
LSIC
2UIC
out
RSP
Serial network
out
RSP
2
LSIC
1
MPIC
Serial network
Serial network
Equidistant LoadsharingFlow Diagram for Control Process
Loadsharing

© 2002 Compressor Controls Corporation FwdPrev Rew Menu
• Machines operate at same Rc since suction and discharge of both machines are tied together
PIC-SP
• The DEV is a dimensionless number representing the distance between the operating point and the Surge Control Line
• Lines of equal DEV can be plotted on the performance curves as shown
0.10.2
0.3
DEV = 00.1
0.2
0.3
• Machines are kept at the same relative distance to the Surge Control Line (SCL)
• This means in practice the same DEV for both machines
DEV1 DEV2
• Recycle will only start when all machines are on their SCL
• Since DEV is dimensionless all sorts of machines can be mixed: small, big, axials, centrifugals
• The DEV will be the same for all machines but they will operate at different speeds and flow rates
SCL = Surge Control LineRc,1
qr,12
Rc,2
qr,22
Compressor 1 Compressor 2
Dev1 = Dev2
Q1 = Q2
N1 = N2
Notes:• Maximum turndown (energy savings) without recycle or blow-off• Minimizes the risk of surge since all machines absorb part of
the disturbance• Automatically adapts to different size machines• CCC patented algorithm
Equidistant LoadsharingParallel Compressor Control
Loadsharing

© 2002 Compressor Controls Corporation FwdPrev Rew Menu
Process
1AUIC
VSDS
Section 1
VSDS
Section 1
Suction Header
A
LSIC
outout
RSP
Serial network
RSP
B
LSIC
1
MPIC
Serial network
Serial network
Section 2
Section 2
2AUIC
1BUIC
1BUICSerial
network
Serial network
outout
Train B
Train A
• How to operate equidistant from the Surge Control Line (SCL) when there is more than one section per machine ???
• Select per train -- in the loadsharing controller -- the section closest to the SCL
• By selecting the section closest to the SCL it is guaranteed that the other section on the same train is not in recycle
Equidistant Loadsharing for multi-section compressors
• Share the load -- equal DEV’s for both trains -- on the section closest to the SCL
Loadsharing

© 2002 Compressor Controls Corporation FwdPrev Rew Menu
Loadsharing Controller
Loop Decoupling
FAMode
PI RT
Loop Decoupling
+
Antisurge Controller
Analog Inputs
+
DEV
To antisurge valve To performance control element
Primaryresponse
DEV DEV
Primaryresponse
To performance control element
DEV > 0
Don’t change output
x
Yes
No
Primary response
Primary response
Don’t change output
No
x
YesApply
loadsharing gain
To antisurge valve
DEV 0
Compressors in Parallel the primary response
Master Controller
PV
SP
PID
Loadsharing
• Master controller controls the main Process Variable (PV) via its PID control block
• The output of the master controller PID goes to the primary response block in the loadsharing controller
• In the primary response block the controller checks if the machine is close to the SCL:
– Yes: don’t reduce capacity - keep output constant
– No: reduce capacity as necessary• Apply loadsharing gain M0• The output of the master controller goes
via the primary response block directly to the performance control element
• In order to check if the machine is close to the SCL the primary response block needs the DEV
• The DEV is reported by the antisurge controller
• When the machine is close to the SCL the master controller will no longer reduce performance to control the primary variable
• The master controller will start to open the recycle valve to control the primary variable
• If DEV <= 0 apply loadsharing gain• Output goes to antisurge valve

© 2002 Compressor Controls Corporation FwdPrev Rew Menu
Loadsharing Controller
Loop Decoupling
Loadbalancing
FAMode
PI RT
+
Antisurge Controller
Analog Inputs
Average
+
SPPV
DEV from other loadsharing controllers
DEV1
To antisurge valve-1 To performance control element
PID
PV
SP
Primaryresponse
• Both antisurge controllers report their DEV to the loadsharing controller
DEV1
PI(One-Sided)
SP
PV
Primaryresponse
FAMode
PI RT
Loop Decoupling
+
Antisurge Controller
DEV2
To antisurge valve-2
DEV2
Primaryresponse
• The lowest DEV is selected: the section closest to the SCL
<
• The selected DEV is reported to:
- Primary control response blocks
- Load balancing block
- Master controller averaging block
Selecting the section closest to SCL for parallel operation
Master Controller
Loop Decoupling
Loadsharing

© 2002 Compressor Controls Corporation FwdPrev Rew Menu
( E
ffic
ien
cy )
Q
HP
user
0% 100%Compressor Capacity
Recycle or Blow-off point
Compressor Efficiency
Loadsharing
© 2002 Compressor Controls Corporation FwdPrev Rew Menu
Other topicsOther topics
Load Balancing ResponcePressure Override Control (POC)Flow Measuring Devices (FMD’s)
Antisurge Control ValvePiping lay-out considerations
Dynamic simulation single compressorDynamic simulation parallel compressors
Influence of controller execution time
Compressor Control
Fall-back strategies

© 2002 Compressor Controls Corporation FwdPrev Rew Menu
Increase compressor system reliabilityand availability with fall-back strategies
• Over 75% of the problems are in the field and not in the controller
• The CCC control system has fall-back strategies to handle these field problems
• The controller continuously monitors the validity of its inputs
• If an input problem is detected the controller ignores this input and automatically switches to a fall-back mode
Benefits– Avoids nuisance trips– Alarms operator of latent failures– Increases machine and process
availability
FB Strategies
© 2002 Compressor Controls Corporation FwdPrev Rew Menu
• Antisurge controller– If a pressure transmitter fails, a minimum q2
r algorithm is used
– If a temperature transmitter fails, hr is characterized as a function of compression ratio
– If the speed transmitter fails, a conservative speed setting is used
– If the flow transmitter fails• Redundant transmitter is used• Output is driven to:
– Last value OR– Last Value selected: If Last Value > Pre-selected fixed value OR– Pre-selected fixed value selected: If Pre-selected fixed value >
Last Value• Performance controller
– Switches to redundant transmitter upon primary transmitter failure
– Output goes to pre-selected value if all transmitters fail or is frozen
– All transmitter failures are alarmed
Fall-back strategies for the antisurge and performance controller
FB Strategies
© 2002 Compressor Controls Corporation FwdPrev Rew Menu
Loop Decoupling
FAMode
PI
Loop Decoupling
+
Analog Inputs
+
DEV
To antisurge valve To performance control element
PID
Loadbalancing
PV
PV
SP
Primaryresponse
DEV DEV
DE
V
DEV from other loadsharing controllers
Primaryresponse
Average
SP
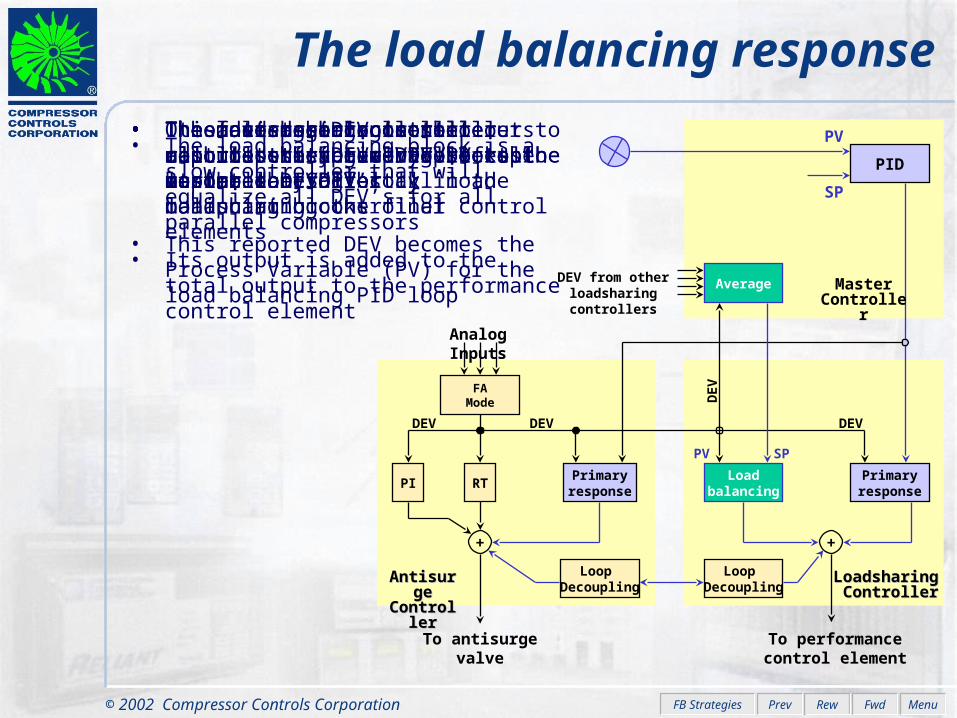
The load balancing response
Loadsharing Loadsharing ControllerController
Antisurge Antisurge ControllerController
Master Controller
FB Strategies
• The fast master controller controls the primary process variable by directly manipulating the final control elements
• In order to balance the machines they need to be kept at the same DEV
• The antisurge controller reports the actual DEV to the load balancing block in the loadsharing controller
• This reported DEV becomes the Process Variable (PV) for the load balancing PID loop
• The loadsharing controller reports this DEV PV also to the master controller
• Other loadsharing controllers also report their DEV PV to the master controller
• The master controller calculates the average of all reported DEV PV’s
• This average DEV is sent out to all loadsharing controllers to become the SP for all load balancing blocks
• The load balancing block is a slow controller that will equalize all DEV’s for all parallel compressors
• Its output is added to the total output to the performance control element
RT

© 2002 Compressor Controls Corporation FwdPrev Rew Menu
The Pressure Override Control (POC) response
FB Strategies
• When a large disturbance occurs it can happen that the performance control element (e.g. speed) is too slow to keep the pressure under control
• The operating point rides the curve and the pressure rises sharply
• There is a high chance to exceed the relief valve setting and trip the process
• The CCC master controller has a Pressure Override Control (POC) mode that will open the antisurge valve to get the disturbance under control quickly
• Opening of the antisurge valve is much faster than a reduction in speed
• As soon as the operating point drops under the POC-SP line the antisurge valves start to close again
• The primary PID loop will stabilize the operating point on the PIC-SP line
Benefits• Fast response during fast upsets• Avoid process trips due to lack of
response in performance control elements
• Allows closer operation to process limits without taking risk
Loop Decoupling
FAMode
PI
Loop Decoupling
+
Analog Inputs
+
DEV
To antisurge valve To performance control element
PID
Loadbalancing
PV
PV
SP
Primaryresponse
DEV DEV
DE
V
DEV from other loadsharing controllers
Primaryresponse
Average
SP
Loadsharing Loadsharing ControllerController
Antisurge Antisurge ControllerController
Master Controller
RT
PI(One-Sided)
SP
PV
POC-SP
Rc
qqrr22
PIC-SP
Relief valve setting

© 2002 Compressor Controls Corporation FwdPrev Rew Menu
• Main selection criteria for FMD in antisurge control system:– Repeatability– Sufficient signal-to-noise ratio
• Accuracy of the FMD is not critical• FMD delays must be absolutely minimal• Present state-of-the-art limits the choice of FMD to
head flow meters or to other devices that are based on the principle of velocity measurement:– Orifice plates– Venturi’s– Pitot tubes– etc.
• Recommended flow range for FMD and transmitter is maximum compressor flow
• Recommended p corresponding to Qmax, compressor is 10” WC (250 mmH2O) or more
Flow Measuring Device (FMD) selection criteria
FB Strategies

© 2002 Compressor Controls Corporation FwdPrev Rew Menu
• The preferred location of the FMD:- Suction of compressor - As close to the inlet flange as
possible
VSDS
Compressor
DischargeSuction
minimum possible
• Less preferable location of the FMD:- Discharge of compressor - As close to the discharge flange as
possible
minimum possible
• Selection of the location should be based on:- Necessity of surge detection
• Often more difficult with flow measured in discharge- Capital cost of flow measuring device- Operating cost of the FMD (permanent pressure loss)
Flow Measuring Device (FMD) location
FB Strategies

© 2002 Compressor Controls Corporation FwdPrev Rew Menu
REMOVE
Remove Blow-OffValve and installa Blank Flange to
block old Blow-Off Line
Remove Check Valve
IR CENTAC
Install Flow
Element
Install Check Valve
To Header
Install Blow-off Valve and Positioner Here
VentSilencer
10 Dia. 5 Dia.
Adding Flow MeasurementAdding Flow Measurement
FB Strategies

© 2002 Compressor Controls Corporation FwdPrev Rew Menu
• The speed of approaching surge is high• The transmitter type and brand should
be selected based on two major factors:– Reliability– Speed of response
• Desired rise time for p (flow) transmitters is 200 ms or less– Pressure step is 100%– The first order response (63%) is less
than 200 ms• Desired rise time for pressure
transmitters is 500 ms or less
Response time of the FMD transmitter
FB Strategies
In only 400 ms, PO dropped by 14%, with a 2% change in Pc
100%
0
100%
0
100%
0
1 SEC.
Po A CDB
Pd A C D
B
Pc A C D
B
Time
Actual pressure
Transmitter output
63% response1- (1/e)
1 is less than 200 ms

© 2002 Compressor Controls Corporation FwdPrev Rew Menu
• Knowing the flow is essential to determine the distance between the operating point and the SCL
• Damping the po (flow) transmitter destroys essential information
Damping the po (flow) transmitter can paralyze the complete antisurge control system!!!
The effect of damping the po (flow) transmitter
FB Strategies
50
0-50
0
1.25 2.50 3.75 5Time (seconds)
FlowStart of Surge
Actual Flow
= 16.0 s
= 1.70 s
= 0.20 s = 0.03 s

© 2002 Compressor Controls Corporation FwdPrev Rew Menu
• Criteria for antisurge valve sizing based on CCC’s experience– Provide adequate antisurge protection for worst possible
disturbances– Provide adequate antisurge protection in all operating
regimes– Sized to provide flow peaks greater than what is required
in steady state to operate on the Surge Control Line– Sized to avoid choke zone– Not be oversized from controllability point of view
• Take point A at the intersection of the maximum speed performance curve and the Surge Limit Line (SLL)
• Calculate Cv,calc (or equivalent) for point A
• Select standard valve size using the following criteria:
1.8 . Cv, calc < Cv,selected < 2.2 . Cv, calc
Rc
QQvolvol
A
Sizing the antisurge control valve
FB Strategies

© 2002 Compressor Controls Corporation FwdPrev Rew Menu
A
Rc
An alternative method yielding excellent results is:
• Take design point of the compressor point A
• Draw a horizontal line through the design point
• Take point B at intersection of maximum speed performance curve and the horizontal line
B• Calculate Cv,calc in point B
• Select standard valve size using the following criteria: 0.9 . Cv, calc < Cv,selected < 1.1 . Cv, calc
Sizing the antisurge control valve - alternative method
FB Strategies
QQvolvol

© 2002 Compressor Controls Corporation FwdPrev Rew Menu
Antisurge valve stroke speed• Antisurge valve must have speed of response adequate for antisurge
protection for all disturbances• Recommended full stroke times:
– Size Close to open Open to close– 1” to 4” 1 second < 3 seconds– 6” to 12” 2 seconds < 5 seconds– 16” and up 3 seconds < 10 seconds
• Closing time needs to be the same order of magnitude to assure the same loop gain in both directions
Antisurge valve characteristic• Normally control valves are selected to be open 80% to 90% for
design conditions• Antisurge valves can operate anywhere between 0% and 100%• In order to have an equal loop-gain over the whole operating range a
linear valve is required• This will allow for the fastest tuning leading to smaller surge margins
Stroke speed and characteristic of the antisurge valve
FB Strategies

© 2002 Compressor Controls Corporation FwdPrev Rew Menu
• Most normal control valves can be made to perform as required for antisurge control
• The following steps help improve the performance of the valve– Install positioner– Minimize tubing length between I/P and valve
positioner– Install volume booster– Minimize volume and resistance between
volume booster and actuator– Increase air supply line to 3/4” or more– Increase size of air connection into the actuator– Drill additional holes in actuator - avoids
pulling a vacuum
Improving the performance of the antisurge valve
FB Strategies

© 2002 Compressor Controls Corporation FwdPrev Rew Menu
• Piping lay-out influences the controllability of the the total system
• The primary objective of the antisurge controller is to protect the compressor against surge
• This is achieved by lowering the resistance the compressor is feeling
• The resistance is lowered by opening the antisurge valve
• Dead-time and time-lag in the system needs to be minimized
• This is achieved by minimizing the volume between three flanges– Discharge flange of the
compressor– Recycle valve flange– Check valve flange
VSDS
Compressor 1volume to be
minimized
Piping lay-out consideration when designing an antisurge control system
FB Strategies

© 2002 Compressor Controls Corporation FwdPrev Rew Menu
Section 1 Section 2
• In order to protect section 1 the antisurge valve needs to be opened• The volume between compressor discharge, check valve and
antisurge valve determines the dead time and lag time in the system
Large volume
• Large volume significantly decreases the effectiveness of the antisurge protection
• Result– Poor surge protection– Large surge margins– Energy waste– Process trips because of surge
Note: This specific piping layout
is found on many wet gas compressors in FCCU’s
Using a single antisurge valve increases recycle lag time
FB Strategies

© 2002 Compressor Controls Corporation FwdPrev Rew Menu
Section 1 Section 2
• The piping lay-out for section 2 is excellent for surge protection• Minimum volume between the three flanges
Small volume
• The piping lay-out for section 1 is not ideal• Large volume to be de-pressurized decreases ability of the control
system to protect the machine against surge• Result
- Poor surge protection- Large surge margins- Energy waste- Process trips because of surge
Sharing recycle coolers degrades surge protection
FB Strategies

© 2002 Compressor Controls Corporation FwdPrev Rew Menu
Compressor 1
• Compressor 1 has ideal piping lay-out for surge protection• Minimum volume between the three flanges
Compressor 2Minimum volume
• The piping lay-out for compressor 2 is commonly found in the industry
• The cooler creates additional volume and decreases the effectiveness of the antisurge control system
Increased volume due
to cooler
• The piping lay-out for compressor 2 can be acceptable if the additional volume does not create excessive dead time and lag in them
• Result- Increased surge margins- Energy waste
Installing recycle valve upstream from
cooler improves control response
FB Strategies

© 2002 Compressor Controls Corporation FwdPrev Rew Menu
• Compressor has ideal piping lay-out for surge protection
• Minimum volume between the three flanges for all sections
Recycle lines configured for optimum surge protection
Minimum volume
Section 2 Section 3Section 1
Process
Suction
FB Strategies

© 2002 Compressor Controls Corporation FwdPrev Rew Menu
• Lay-out #1 has minimum volume between the flanges and is the best lay-out for antisurge control purposes
Section 2 Section 3Section 1
Process
Suction
Section 1 Section 2 Section 3
Suction
Process
Lay-out #1: Compressor with
recycle lines optimally configured for
antisurge control
Lay-out #2: Compressor with
coolers upstream of recycle take-off
• When selecting lay-out #2 the residence time of the gas in the “surge” volume should be verified to check acceptable time delays are not exceeded
• These two piping lay-outs are most common for antisurge control
• Lay-out #2 requires one cooler less and thus the capital investment is lower• Lay-out #2 will require bigger surge control margins
Which antisurge piping configuration do you choose???
FB Strategies

© 2002 Compressor Controls Corporation FwdPrev Rew Menu
Analog controller
SLLSCL
100%
0%
Controlleroutput
100%
0%
• Leading engineering contractor performed evaluation of execution time influence on ability to protect compressor from surge
• Dynamic simulation of compressor was built
• Digital controllers are compared against analog controller on simulation
• Analog controller has no execution time and is immediate
• Analog controller tuned for minimum overshoot
• Digital controllers get exact same tuning parameters
• Digital controllers get exact same disturbance
Operatingpoint
Time
Time
Influence of controller execution time
FB Strategies

© 2002 Compressor Controls Corporation FwdPrev Rew Menu
Analog controller
SLLSCL
100%
0%
100%
0%
100%
Controlleroutput
Operatingpoint
Digital controller(2 executions per second)
Time
Time
Time
Time
• Compressor surged• Large process upset would have resulted
Analog vs. digital controller at 2 executions per second
FB Strategies
SLLSCL
0%
100%
0%Tuning same as analog controller

© 2002 Compressor Controls Corporation FwdPrev Rew Menu
Controlleroutput
Operatingpoint
100%
0%
100%
0%
Time
Time
• Compressor surged• Large process upset would have resulted
Analog vs. digital controller at 3 executions per second
Digital controller(3 executions per second)
FB Strategies
SLLSCL
Analog controller
SLLSCL
0%
100%
0%Tuning same as analog controller

© 2002 Compressor Controls Corporation FwdPrev Rew Menu
100%
100%
0%
100%
0%
Time
Time
• Compressor almost surged• Control system would have to be set up with
bigger surge control margin
Analog vs. digital controller at 10 executions per second
Controlleroutput
Operatingpoint
FB Strategies
SLLSCL
Analog controller
SLLSCL
0%
100%
0%Tuning same as analog controller
Digital controller(10 executions per second)
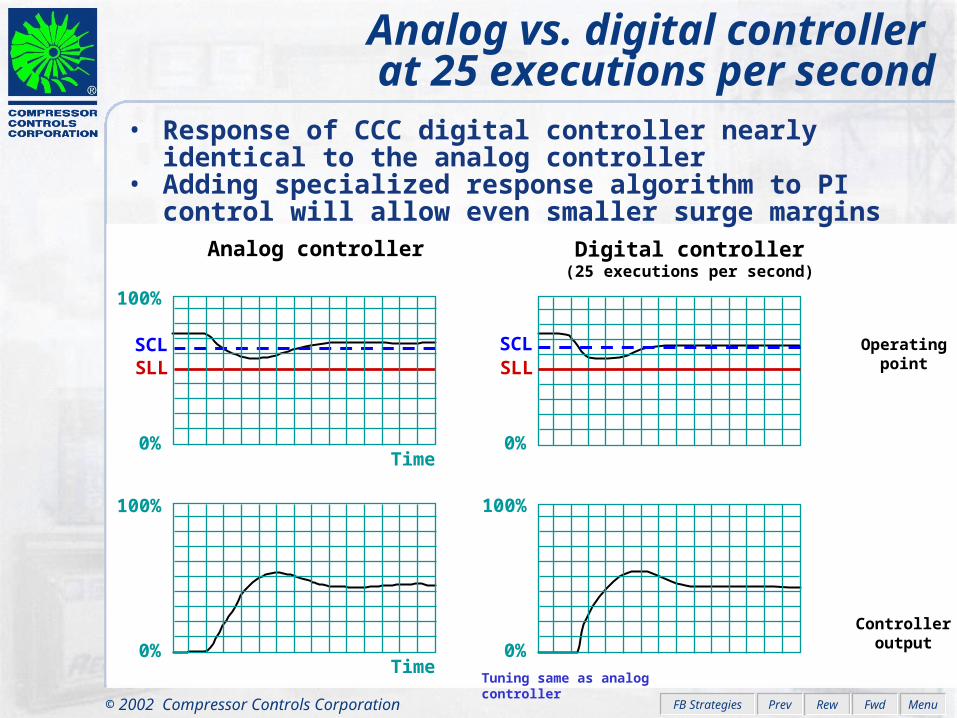
© 2002 Compressor Controls Corporation FwdPrev Rew Menu
100%
0%
100%
0%
Time
Time
Controlleroutput
Operatingpoint
• Response of CCC digital controller nearly identical to the analog controller
• Adding specialized response algorithm to PI control will allow even smaller surge margins
Analog vs. digital controller at 25 executions per second
Digital controller(25 executions per second)
FB Strategies
SLLSCL
Analog controller
SLLSCL
0%
100%
0%Tuning same as analog controller

© 2002 Compressor Controls Corporation FwdPrev Rew Menu
Process
HIC1
Load
1UIC
VSDS
Compressor 1
VSDS
Compressor 2
1
LSIC
2UIC
out
RSP
Serial network
out
RSP
2
LSIC
1
MPIC
Serial network
Serial network
Dynamic simulation: parallel compressors
FB Strategies
Suction

© 2002 Compressor Controls Corporation FwdPrev Rew Menu
Simplified P&ID for Compressors Operating in Parallel
FB Strategies

© 2002 Compressor Controls Corporation FwdPrev Rew Menu
Simplified Diagram of Parallel Load-Sharing Algorithms
FB Strategies

© 2002 Compressor Controls Corporation FwdPrev Rew Menu
Simplified P&ID for Compressors Operating in Series
FB Strategies
The End

© 2002 Compressor Controls Corporation FwdPrev Rew Menu
Simplified Diagram of Series Load-sharing Algorithms
FB Strategies
![Reliability demonstration test for load-sharing systems with exponential … · load-sharing systems are studied in [21–23]. Though load-sharing plays an important role in system](https://img.pdfslide.us/doc/110x75/61277d39a5fd5c5284375127/reliability-demonstration-test-for-load-sharing-systems-with-exponential-load-sharing.jpg)