Embed Size (px)
Citation preview

12 Seismological Research Letters Volume 79, Number 1 January/February 2008
INTRODUCTION
Global Positioning System (GPS) geodesy is a well-known tool to measure the long-term surface deformation of the Earth at various temporal and spatial scales, and it is widely used in studies of geodynamics. GPS dual-frequency geodetic-quality receivers are typically sampled at rates of 15 to 30 s and ana-lyzed in a batch mode over intervals from one hour to 24 hours. Recently, 1-Hz or greater rate sampled continuous GPS has been recognized as useful in combination with seismometers to capture the long-period seismic waves from large earthquakes and to detect volcano inflation and tsunamigenic landsliding (Bock et al. 2000; Larson et al. 2003; Bock et al. 2004; Mattia et al. 2004). Modern GPS receivers are capable of sampling at rates as high as 50 Hz (Genrich and Bock 2006).
The impact of heavy pedestrian movement on a highway suspension bridge has not yet been documented by precise observations, nor has it been modeled, although the impact of vehicles and wind was observed and used to constrain theo-retical analysis (Nakamura 2000; Roberts et al. 2004; Guo et al. 2005). A large crowd can gather on a highway suspension bridge under extreme natural or human-generated condi-tions like earthquakes or power blackouts ( Julavits 2003); an unpredicted response to the crowd was observed on a foot-bridge (Strogatz et al. 2005). Using GPS observations, here we evaluate the deflection of a large suspension bridge that con-nects Brooklyn with Staten Island at the mouth of upper New York Bay under the load of marathon runners and under the load of vehicles. Furthermore, by combining GPS and accel-erometer data, we find that the runners excited the vibrations of the bridge at a modal frequency of 2.8 Hz, vastly different from the first vertical frequency of 0.13 Hz excited by vehicles. Our results provide a new constraint on theoretical models since the deflection caused by a distributed crowd is sensitive to the bridge properties untested by a conventional concentrated load such as a truck. These new observations can help predict a bridge’s response to very-long-wavelength disturbances that
might arise during earthquakes (Allam and Datta 2002; Smyth et al. 2003). Additionally, we show that GPS observations can be efficiently analyzed in real time using individual data epochs (Bock et al. 2000) with the same precision as multiepoch kine-matic methods requiring postprocessing.
GPS SYSTEMS AND ACCELEROMETERS ON THE BRIDGE
We deployed 5-Hz GPS instruments and 100-Hz force-balance accelerometers (FBA) on the suspension bridge to observe load response from human, traffic, and environmental loads, both static and dynamic. Our experiment was motivated by the New York City Marathon, which has started every year since 1976 in Staten Island, with the first two miles almost entirely on the bridge (the marathon was within the confines of Central Park in 1970–1975). More than 30,000 marathon runners crossed the bridge within about one-half hour on 7 November 2004. We pursued two goals: 1) to assess the response of the bridge to a variety of factors (sudden impact of runners, heavy traffic, ambient temperature, and wind); and 2) to elucidate an opti-mal combination of both methods, GPS and FBA, for struc-tural response analysis (Smyth and Wu 2007).
We started observations before the marathon on 6 November 2004 at 00:00 EST and finished on 7 November at 16:00 EST. Regular traffic was stopped on 7 November from 00:00 EST to about 11:00 EST. The marathon runners were on the bridge on 7 November between about 10:00 and 10:40 EST.
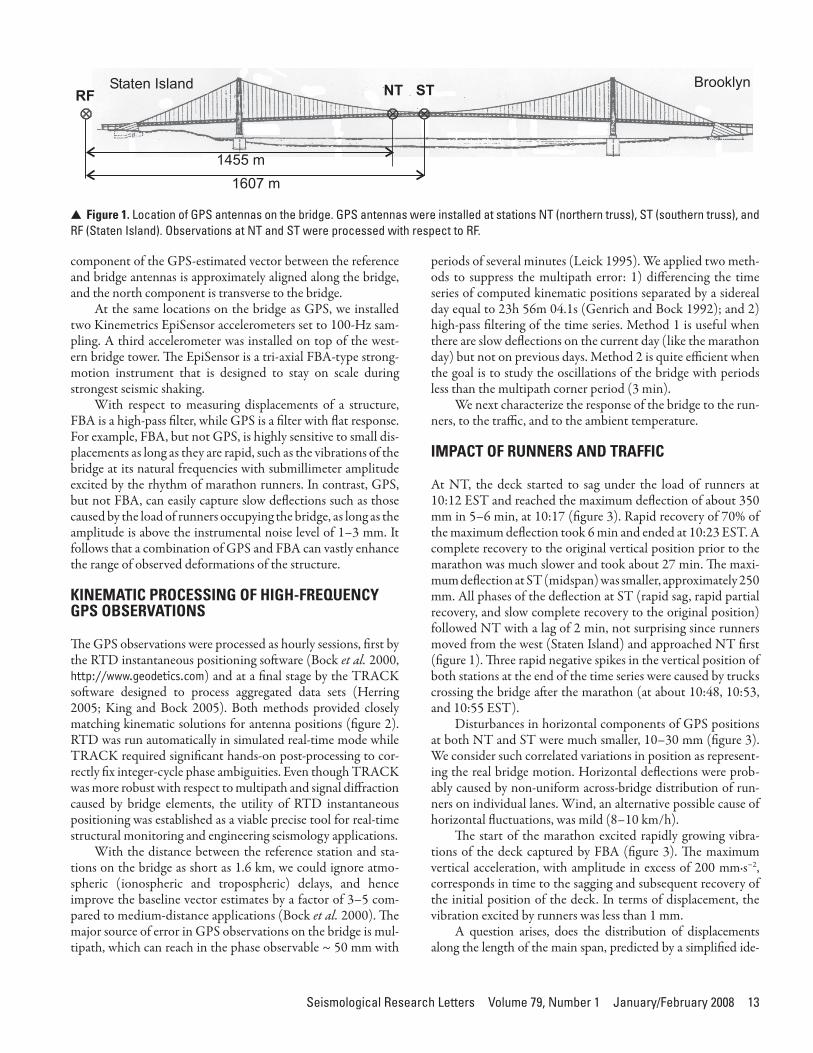
We used three GPS systems, each consisting of the Thales Navigation microZ-CGRS dual-frequency receiver and the Dorne–Margolin antenna with choke rings. The 128-MB solid-state memory in the receiver allowed us to collect the data at a 5-Hz sampling rate for up to 42 hours without downloading. Two systems were deployed on the upper deck of the bridge, with one system at midspan on the south side of the deck, station ST, and the other 150 m to the west of midspan on the north side, station NT (figure 1). The third system served as reference and was installed 1.6 km away from midspan on top of a building, station RF. The antennas on the bridge were mounted on three-legged aluminum-braced geodetic monuments, with the top 3 m above the roadbed to avoid obstructions of the sky caused by moving vehicles. The azimuth of the bridge is 71° so that the east
load response on a large suspension bridge during the nYc marathon revealed by gps and accelerometersMikhail G. Kogan, Won-Young Kim, Yehuda Bock, and Andrew W. Smyth
Mikhail G. Kogan,1 Won-Young Kim,1 Yehuda Bock,2 and Andrew W. Smyth3
1. Lamont-Doherty Earth Observatory, Columbia University2. Cecil H. and Ida M. Green Institute of Geophysics and Planetary
Physics, Scripps Institution of Oceanography3. Department of Civil Engineering and Engineering Mechanics,
Columbia University
Seismological Research Letters Volume 79, Number 1 January/February 2008 13
component of the GPS-estimated vector between the reference and bridge antennas is approximately aligned along the bridge, and the north component is transverse to the bridge.
At the same locations on the bridge as GPS, we installed two Kinemetrics EpiSensor accelerometers set to 100-Hz sam-pling. A third accelerometer was installed on top of the west-ern bridge tower. The EpiSensor is a tri-axial FBA-type strong-motion instrument that is designed to stay on scale during strongest seismic shaking.
With respect to measuring displacements of a structure, FBA is a high-pass filter, while GPS is a filter with flat response. For example, FBA, but not GPS, is highly sensitive to small dis-placements as long as they are rapid, such as the vibrations of the bridge at its natural frequencies with submillimeter amplitude excited by the rhythm of marathon runners. In contrast, GPS, but not FBA, can easily capture slow deflections such as those caused by the load of runners occupying the bridge, as long as the amplitude is above the instrumental noise level of 1–3 mm. It follows that a combination of GPS and FBA can vastly enhance the range of observed deformations of the structure.
KINEMATIC PROCESSING OF HIGH-FREQUENCY GPS OBSERVATIONS
The GPS observations were processed as hourly sessions, first by the RTD instantaneous positioning software (Bock et al. 2000, http://www.geodetics.com) and at a final stage by the TRACK software designed to process aggregated data sets (Herring 2005; King and Bock 2005). Both methods provided closely matching kinematic solutions for antenna positions (figure 2). RTD was run automatically in simulated real-time mode while TRACK required significant hands-on post-processing to cor-rectly fix integer-cycle phase ambiguities. Even though TRACK was more robust with respect to multipath and signal diffraction caused by bridge elements, the utility of RTD instantaneous positioning was established as a viable precise tool for real-time structural monitoring and engineering seismology applications.
With the distance between the reference station and sta-tions on the bridge as short as 1.6 km, we could ignore atmo-spheric (ionospheric and tropospheric) delays, and hence improve the baseline vector estimates by a factor of 3–5 com-pared to medium-distance applications (Bock et al. 2000). The major source of error in GPS observations on the bridge is mul-tipath, which can reach in the phase observable ~ 50 mm with
periods of several minutes (Leick 1995). We applied two meth-ods to suppress the multipath error: 1) differencing the time series of computed kinematic positions separated by a sidereal day equal to 23h 56m 04.1s (Genrich and Bock 1992); and 2) high-pass filtering of the time series. Method 1 is useful when there are slow deflections on the current day (like the marathon day) but not on previous days. Method 2 is quite efficient when the goal is to study the oscillations of the bridge with periods less than the multipath corner period (3 min).
We next characterize the response of the bridge to the run-ners, to the traffic, and to the ambient temperature.
IMPACT OF RUNNERS AND TRAFFIC
At NT, the deck started to sag under the load of runners at 10:12 EST and reached the maximum deflection of about 350 mm in 5–6 min, at 10:17 (figure 3). Rapid recovery of 70% of the maximum deflection took 6 min and ended at 10:23 EST. A complete recovery to the original vertical position prior to the marathon was much slower and took about 27 min. The maxi-mum deflection at ST (midspan) was smaller, approximately 250 mm. All phases of the deflection at ST (rapid sag, rapid partial recovery, and slow complete recovery to the original position) followed NT with a lag of 2 min, not surprising since runners moved from the west (Staten Island) and approached NT first (figure 1). Three rapid negative spikes in the vertical position of both stations at the end of the time series were caused by trucks crossing the bridge after the marathon (at about 10:48, 10:53, and 10:55 EST).
Disturbances in horizontal components of GPS positions at both NT and ST were much smaller, 10–30 mm (figure 3). We consider such correlated variations in position as represent-ing the real bridge motion. Horizontal deflections were prob-ably caused by non-uniform across-bridge distribution of run-ners on individual lanes. Wind, an alternative possible cause of horizontal fluctuations, was mild (8–10 km/h).
The start of the marathon excited rapidly growing vibra-tions of the deck captured by FBA (figure 3). The maximum vertical acceleration, with amplitude in excess of 200 mm∙s−2, corresponds in time to the sagging and subsequent recovery of the initial position of the deck. In terms of displacement, the vibration excited by runners was less than 1 mm.
A question arises, does the distribution of displacements along the length of the main span, predicted by a simplified ide-
STNTRF
1455 m
1607 m
BrooklynStaten Island
Figure 1. ▲ Location of GPS antennas on the bridge. GPS antennas were installed at stations NT (northern truss), ST (southern truss), and RF (Staten Island). Observations at NT and ST were processed with respect to RF.

14 Seismological Research Letters Volume 79, Number 1 January/February 2008
alization using second-order deflection theory, agree with GPS observations? A simple theoretical model of the suspension bridge assumes that the bridge deck is an elastic beam held by vertical suspenders, which are steel cables connected to the main cable. The main cable is relatively flexible, it is supported by towers, and it is anchored to the ground at its ends. It should be noted that this basic model ignores the fact that the main span is attached to side spans through the cable and tower support system. Advanced mathematical models of linear and nonlinear modal bridge prop-erties were stimulated by the collapse in 1940 of the Tacoma Narrows suspension bridge, Washington, USA, caused by violent torsional oscillations (Lazer and McKenna 1990).
A simplified equation for η, vertical deflection of the deck at abcissa x aligned along the bridge, is (Podolny 1999):
EIη′′′′ = p + Hpy′′ + Hη′′ (1)
where E = modulus of elasticity of stiffening-truss steel (206,850
MPa), I = moment of inertia of deck cross-section (51.786 m4), H = horizontal component of cable tension under dead and
live loads, Hp = horizontal component of cable tension under total live
load, p = live load intensity per unit length, y = vertical distance from cable support on the tower at a
point where η is measured, and derivatives are taken with respect to x.
TRACK RTD
Start: 07-Nov-2004 10:00 ESTGPS Station NT
-200
-100
0
100
200
Mill
imet
ers
-200
-100
0
100
200
Mill
imet
ers
-300
-200
-100
0
100
200
Mill
imet
ers
0 600 1200 1800 2400 3000Seconds
North
East
Vertical
-200
-100
0
100
200
Mill
imet
ers
-200
-100
0
100
200
Mill
imet
ers
-300
-200
-100
0
100
200
Mill
imet
ers
0 600 1200 1800 2400 3000Seconds
Figure 2. ▲ Kinematic GPS solutions for the marathon by two methods: RTD and TRACK. Uncorrected for multipath. The RTD instantaneous positions, obtained by replaying the data in a real-time scenario, contain 36 solution epochs out of 18,000 that were flagged on-the-fly as outliers (seen as spikes in the figure). For the sake of a complete dataset obtainable only in after-the-fact post-processing, the analysis described in this paper was performed using TRACK. However, the utility of the RTD software was established as a viable, precise, real-time technology for bridge and related monitoring applications.

Seismological Research Letters Volume 79, Number 1 January/February 2008 15
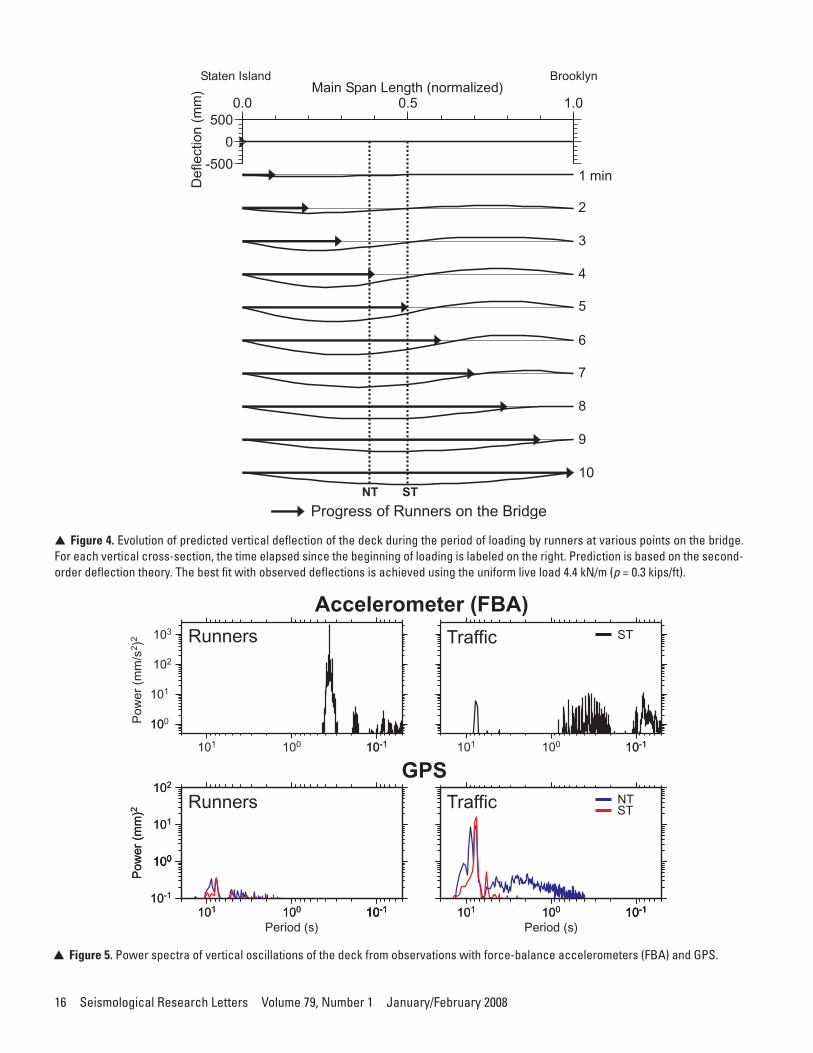
The solution of equation 1 by the iterative Fourier method (Timoshenko and Young 1965) explains well the evolution of deflection with time at NT and ST at a loading stage (figure 4). The best fit to the observed amplitude of sagging is achieved for a value of uniform live load p = 4.4 kN/m (0.3 kips/ft). This value of p reflects a scenario of runners occupying all six lanes of the upper deck, with the average weight of a runner 64 kg (140 lbs) and the average spacing between runners along the lane 0.85 m (2.8 ft). The worst-known parameter is I, whose value cannot be simply associated with the moment of inertia of the stiffening truss. The double-deck cross-section has a stiff-ening truss connecting the upper and lower roadways, trans-verse beams, stringers, and cross-frames such that it behaves as a stiff rectangular tube (Podolny 1999). A ratio of maximum deflections at both stations is sensitive to a value of I, with a best-fitting value of 52 m4 (6,000 ft4). Perhaps the two most interesting facts revealed by the theoretical solution are: 1) the maximum deflection occurs at quarter-span; and 2) deflection of the fully loaded bridge is less than the maximum observed at partial loading.
The phase of unloading the bridge at the end of the mara-thon is more complicated because the number of runners per
lane per unit length and the number of occupied lanes was changing at this phase. Clearly, the unloading was slower than the loading as evidenced by both GPS and FBA (figure 3).
RESOLVING POWER OF GPS AT HIGH FREQUENCIES
It is reasonable to ask, what is the smallest amplitude of oscilla-tion of the bridge deck that can be resolved by GPS? For shorter periods, less than 1 min, the limiting factor is the measurement noise with periods about 0.5 s and the 1-sigma variation of 2–3 mm in all three components at ST (see also Langbein and Bock 2004). Station NT is noisier at such short periods. The limiting factor to resolve an amplitude of the “slow” oscillation (periods longer than 2 min) is the residual multipath: 4–6 mm in horizontal components, 15 mm in the vertical.
The specific resolving capacity of GPS and FBA in a wide range of periods is illustrated with the power spectra of time series collected at midspan during the marathon and during intense regular traffic the day before (figure 5). A peak in the vertical spectrum of GPS and FBA observations with a period of 7.7 s, both at NT and ST, is persistent when the traffic is on
-200
-100
0
100
200
Mill
imet
ers
-200
-100
0
100
200
Mill
imet
ers
-300
-200
-100
0
100
200
Mill
imet
ers
0 600 1200 1800 2400 3000Seconds
North
East
Vertical
-200
-100
0
100
200
Mill
imet
ers
-200
-100
0
100
200
Mill
imet
ers
-300
-200
-100
0
100
200
Mill
imet
ers
0 600 1200 1800 2400 3000Seconds
-400
-200
0
200
400
mm
s·-2
0 600 1200 1800 2400 3000 3600Seconds
-400
-200
0
200
400
mm
s·-2
-400
-200
00
200
400
mm
s·-2
Vertical
East
NorthNT ST
GPSStart: 07-Nov-2004 10:00 EST
Station ST
Accelerometer (FBA)(A) (B)
10:00 10:30 11:00 10:00 10:30 11:00
Figure 3. ▲ A: Three components of deflection of the bridge deck under load of runners from GPS solution. Corrected for multipath. B: Three components of vibrations of the deck excited by runners, measured by the force-balance accelerometer (FBA).
16 Seismological Research Letters Volume 79, Number 1 January/February 2008
-500
0
500
Def
lect
ion
(mm
)
0.0 0.5 1.0Main Span Length (normalized)
Staten Island Brooklyn
NT ST
Progress of Runners on the Bridge
1 min
2
3
4
5
6
7
8
9
10
Figure 4. ▲ Evolution of predicted vertical deflection of the deck during the period of loading by runners at various points on the bridge. For each vertical cross-section, the time elapsed since the beginning of loading is labeled on the right. Prediction is based on the second-order deflection theory. The best fit with observed deflections is achieved using the uniform live load 4.4 kN/m (p = 0.3 kips/ft).
10-110-1100101 10-110-1100101
Period (s)
NTSTTraffic
10-1
100100
101
102
Pow
er(m
m)2
10-110-110010110-1
100100
101
102
Pow
er(m
m)2
10-110-1100101
Period (s)
Runners
GPS
10100
101
102
103
Pow
er(m
m/s
2 )2
10-110-1100101
Runners
Accelerometer (FBA)
10-110-1100101
Traffic ST
Figure 5. ▲ Power spectra of vertical oscillations of the deck from observations with force-balance accelerometers (FBA) and GPS.

Seismological Research Letters Volume 79, Number 1 January/February 2008 17
the bridge and is notably inconspicuous during the marathon. The power spectra of both horizontal components are much smaller in magnitude than the vertical component. The higher-frequency modes captured by the accelerometer are also quite different during the marathon as compared with the modes excited by the traffic: an isolated peak at a period of 0.36 s (fre-quency 2.8 Hz) dominates during the marathon yet is incon-spicuous when the bridge is occupied by traffic. Remarkably, this period is close to the beat rate of runners, about 0.4 s assum-ing a speed of 10 km/h and a step length of 1 m. We argue that the vibration excited by runners is associated with the natural frequencies of the bridge since its period is remarkably stable throughout the whole marathon, with variations less than 0.3% (compatible with an error of the estimate). Fortunately, the phase of steps of individual runners is incoherent over a distance spanning several runners, so that a small proportion of runners who step in phase can excite resonant oscillations at only a small amplititude.
GPS and FBA can also be compared in the time domain after conversion of GPS displacements to accelerations with appropriate filtering. Both the amplitude and phase of the 7.7-s mode agree well between the FBA and GPS (figure 6).
OPTIMAL FUSION OF GPS AND ACCELEROMETER DATA
To best capitalize on the displacement and acceleration mea-surement redundancy at the midspan of the bridge, it is possible to use a recently developed data processing technique (Smyth et al. 2006; Smyth and Wu 2007) that achieves a fusion of the information contained in each signal to yield improved displace-ment and velocity estimates. The procedure, which involves a multirate formulation of Kalman filtering and smoothing on the state-space measurement equation, also suppresses measure-ment noise, given estimates of the noise covariance. A compari-son segment of just over 40 seconds of the GPS-measured mid-span vertical displacement versus the displacement estimated by data fusion is shown in figure 7 for the marathon event. It is noteworthy that the procedure not only greatly reduces the GPS measurement noise, but it clearly injects the 2.7-Hz vibra-tions seen in the FBA data (corresponding to displacement oscillations of only 1–2 mm) into the displacement data. This is particularly interesting because the 2.7-Hz frequency content is above the 2.5-Hz Nyquist frequency of the GPS sampling.
THERMAL DEFORMATION OF THE BRIDGE FROM GPS DATA
The slowest variations in the vertical position of the bridge deck revealed by GPS occur at periods of several hours, showing strong correlation with air temperature (figure 8). Estimation by linear regression gives factors of –22 and –25 mm/°C at NT and ST respectively.
Theoretical temperature dependence of a sag in the suspen-sion cable can be approximately estimated from the formula for a parabolic cable shape (Podolny 1999):
S LfL
= +
183
2
(2)
where L = length of main span (1,298 m), S = length of suspension cable between towers, and f = sag of cable (124 m).We find the temperature dependence of the sag equal to –31 mm/°C. This factor must be corrected for the temperature change in the height of the tower, equal to +3 mm/°C. Hence the observed diurnal variation in the bridge deck elevation at midspan can be explained by the thermal behavior of the sus-pension cables and towers.
Deviations of the vertical deflection from linear dependence on temperature are less than 0.1 m; therefore the additional deflection caused by the traffic does not exceed that value.
-20
0
20
mm
GPS
-400
-200
0
200
400
-20
-10
0
10
20
1200 1210 1220 1230Seconds
mm
.s-2
mm
.s-2
FBA-f, GPS-2d FBA
7-Nov-04 10:20 EST
Dis
pla
cem
ent
Acc
eler
atio
n
Runners
FBAFBA-filtered (FBA-f)
GPS 2nd derivative (GPS-2d)
Legend for accelerations:
-20
0
20
mm
GPS
-400
-200
0
200
400
-20
-10
0
10
20
mm
.s-2
2250 2260 2270 2280Seconds
FBA-f, GPS-2d FBA
mm
.s-2
6-Nov-04 03:37 EST
Traffic
Dis
pla
cem
ent
Acc
eler
atio
n
Figure 6. ▲ Oscillations associated with the natural frequencies of the bridge, excited by runners and by traffic. Displacements are shown as observed with GPS. Accelerations are shown in three manners: 1) observed with FBA; 2) FBA low-pass filtered with a corner period of about 1 s; and 3) the second derivative of GPS displacements.

18 Seismological Research Letters Volume 79, Number 1 January/February 2008
1010 1020 1030 1040120
140
160
180
200
1025 1026
170
160
GPS measuredGPS+FBA fused by Kalman filter
10:17 EST
Marathon 07-Nov-2004
Dis
plac
emen
t (m
m)
Time (seconds)
Seconds
mm
45.8
45.9
46.0
46.1
46.2
46.3
0 12 0 12
NT
Air Temperature
NT
47.0
47.1
47.2
47.3
47.4
47.5
Ele
vatio
n(m
)
ST
ST0
5
10
15
20
Tem
pera
ture
C°
hours EST6-Nov-2004 7-Nov-2004
Figure 7. ▲ GPS measured displacements, and GPS + FBA displacements fused by Kalman filter.
Figure 8. ▲ Variations of one-hour averaged elevations of NT and ST, and variations in one-hour averaged air temperature. Hourly GPS solutions were performed by GAMIT (King and Bock 2005) with respect to station RF (figure 1).

Seismological Research Letters Volume 79, Number 1 January/February 2008 19
CONCLUSION
Our results demonstrate that a combination of 5-Hz GPS and 100-Hz force-balance accelerometers (FBA) on the bridge allowed us to estimate the response of the bridge to such factors as marathon runners, regular traffic, and air temperature in the range of periods impossible to span by GPS or FBA alone. For example, the vibrations excited by runners are small in terms of displacements, yet large in terms of accelerations; therefore FBA is efficient in contrast to GPS. On the other hand, the slow deflection under a load of runners is large in terms of displace-ments while the corresponding accelerations are very small; therefore GPS is efficient but FBA is not. Both methods, how-ever, have adequate sensitivity to capture the symmetric vertical vibrations of the bridge deck at a period of 7.7 s.
ACKNOWLEDGMENTS
Initial funding for this project was provided by the Center for Hazards and Risk Research, The Earth Institute at Columbia University. GPS systems used on the bridge were contributed by Jet Propulsion Laboratory through the efforts of David Stowers. Use of the RTD software was provided by Scripps Institution of Oceanography, under license to Geodetics, Inc. The GPS part of the project would be impossible without the devoted work of Bernard Gallagher (Lamont-Doherty Earth Observatory Machine Shop). Thomas A. Herring (MIT) advised on the use of TRACK utility.
REFERENCES
Allam, S. M., and T. K. Datta (2002). Response spectrum analysis of suspension bridges for random ground motion. Journal of Bridge Engineering 7 (6), 325–337.
Bock, Y., R. M. Nikolaidis, P. J. de Jonge, and M. Bevis (2000). Instantaneous geodetic positioning at medium distances with the Global Positioning System. Journal of Geophysical Research 105 (B12), 28,223–28,253.
Bock, Y., L. Prawirodirdjo, and T. I. Melbourne (2004). Detection of arbitrarily large dynamic ground motions with a dense high-rate GPS network. Geophysical Research Letters 31, L06604, doi:10.1029/2003GL019150.
Genrich, J. F., and Y. Bock (1992). Rapid resolution of crustal motion at short ranges with the Global Positioning System. Journal of Geophysical Research 97, 3,261–3,269.
Genrich, J. F., and Y. Bock (2006). Instantaneous geodetic positioning with 10–20 Hz GPS Measurements: Noise characteristics and impli-cations for monitoring networks. Journal of Geophysical Research 111 (B3), B03403, doi:10.1029/2005JB003617.
Guo, J., L. Xu, L. Dai, M. McDonald, J. Wu, and Y. Li (2005). Application of the real-time kinematic Global Positioning System in bridge safety monitoring. Journal of Bridge Engineering 10 (2), 163–168.
Herring, T. A. (2005) GLOBK, Global Kalman Filter VLBI and GPS Analysis Program. Ver. 5.11. Cambridge: Massachusetts Institute of Technology.
Julavits, R. (2003). Point of collapse. The Village Voice. August 27–September 2.
King, R. W., and Y. Bock (2005). Documentation for the GAMIT GPS Analysis Software. Rel. 10.2.
Langbein, J., and Y. Bock (2004). High-rate real-time GPS network at Parkfield: Utility for detecting fault slip and seismic displacements. Geophysical Research Letters 31, L15S20, doi:10.1029/2003GL019408.
Larson, K., P. Bodin, and J. Gomberg (2003). Using 1-Hz GPS data to measure deformations caused by the Denali fault earthquake. Science 300, 1,421–1,424.
Lazer, A. C., and P. J. McKenna (1990). Large-amplitude periodic oscilla-tions in suspension bridges: Some new connections with nonlinear analysis. SIAM Review 32 (4), 537–578.
Leick, A. (1995). GPS Satellite Surveying. New York: Wiley.Mattia, M., M. Rossi, F. Guglielmino, M. Aloisi, and Y. Bock (2004).
The shallow plumbing system of Stromboli Island as imaged from 1 Hz instantaneous GPS positions. Geophysical Research Letters 31, L24610, doi:10.1029/2004GL021281.
Nakamura, S. (2000). GPS measurement of wind-induced suspension bridge girder displacements. Journal of Structural Engineering 126 (12), 1,413–1,419.
Podolny, W. (1999). Cable-suspended bridges. In Structural Steel Designer’s Handbook, ed. R. L. Brockenbrough and F. S. Merritt, 15.1–15.100. New York: McGraw-Hill.
Roberts, G. W., X. Meng, and A. H. Dodson (2004). Integrating a global positioning system and accelerometers to monitor the deflection of bridges. Journal of Surveying Engineering—ASCE 130 (2), 65—72.
Smyth, A. W., J.-S. Pei, and S. F. Masri (2003). System identification of the Vincent Thomas suspension bridge using earthquake records. International Journal of Earthquake Engineering & Structural Dynamics 32, 339–367.
Smyth, A., and M. L. Wu (2007). Multi-rate Kalman filtering for the data fusion of displacement and acceleration response in dynamic system monitoring. Mechanical Systems and Signal Processing 21 (2), 706–723.
Smyth, A. W., M. Wu, and M. Kogan (2006). Data fusion of GPS displace-ments and acceleration response measurements for large scale bridges. 4th World Conference on Structural Control and Monitoring San Diego, California, 11–13 July 2006.
Strogatz, S. H., D. M. Abrams, A. McRobie, B. Eckhardt, and E. Ott (2005). Crowd synchrony on the Millenium Bridge. Nature 438 (3), 43–44.
Timoshenko, S. P., and D. H. Young (1965). Theory of Structures. New York: McGraw-Hill.
Lamont-Doherty Earth ObservatoryColumbia University
Palisades, New York 10964 [email protected]
(M.G.K.)