Embed Size (px)
Citation preview

Office of Energy Efficiency and Renewable Energy
Office of Electricity Delivery and Energy Reliability
Load Participation in Ancillary Services
WORKSHOP REPORT
DECEMBER 2011

i
Notice: This report was prepared as an account of work sponsored by an agency of the United States
government. Neither the United States government nor any agency thereof, nor any of their employees,
makes any warranty, express or implied, or assumes any legal liability or responsibility for the accuracy,
completeness, or usefulness of any information, apparatus, product, or process disclosed, or represents
that its use would not infringe privately owned rights. Reference herein to any specific commercial product,
process, or service by trade name, trademark, manufacturer, or otherwise does not necessarily constitute
or imply its endorsement, recommendation, or favoring by the United States government or any agency
thereof. The views and opinions of authors expressed herein do not necessarily state or reflect those of the
United States government or any agency thereof.

ii
About this Report This report was drafted by the U.S. Department of Energy under the support of Henry Kelly and Carla
Frisch in the Office of Energy Efficiency and Renewable Energy and Pat Hoffman and Dan Ton in the
Office of Electricity Delivery and Energy Reliability. Principal authors were Brendan Kirby (Independent),
Mark O’Malley (UCD), Ookie Ma (EERE), Peter Cappers (LBNL), Dave Corbus (NREL), Sila Kiliccote (LBNL),
Omer Onar (ORNL), Michael Starke (ORNL), and Dan Steinberg (NREL) with contributions from
presentations by Terry Boston (PJM), Aaron Breidenbaugh (EnerNOC), Ron Dizy (Enbala), Paul Feldman
(MISO / WECC), Don Kujawski (PJM), Jonathan Lowell (ISO-NE), Wendell Miyaji (Comverge), Mark
Patterson (ERCOT), Mark Petri (ANL), Rob Pratt (PNNL), Scott Simms (BPA), DeWayne Todd (Alcoa), and
Henry Yoshimura (ISO-NE).

iii
This page intentionally left blank.

iv
Contents About this Report .......................................................................................................................................... ii
Acronyms ..................................................................................................................................................... vi
Executive Summary ....................................................................................................................................... 1
1. Introduction .............................................................................................................................................. 3
1.1 Process and Subgroups ....................................................................................................................... 4
2. Background ............................................................................................................................................... 5
2.1 Power System Reliability ..................................................................................................................... 5
2.1.1 Regulation and Spinning Reserve................................................................................................. 6
2.1.2 Balancing areas ............................................................................................................................ 8
2.1.3 Load participating in ancillary services ........................................................................................ 8
2.2 Ancillary Service Requirements .......................................................................................................... 8
2.3 Demand Response Types .................................................................................................................... 8
3. Workshop Findings.................................................................................................................................. 10
3.1 Existing Experience ........................................................................................................................... 11
3.2 Future Ancillary Service Requirements ............................................................................................. 14
3.3 Characterizing Demand Response .................................................................................................... 15
3.3.1 Technical potential ..................................................................................................................... 15
3.3.2 Cost of load participating in ancillary services ........................................................................... 16
3.3.3 Forecasting load participation in ancillary services ................................................................... 17
3.4 Ancillary Service Prices ...................................................................................................................... 17
4. Barriers .................................................................................................................................................... 18
4.1 Enabling Technology ......................................................................................................................... 19
4.1.1. Demand-side ............................................................................................................................. 19
4.1.2 System operator ......................................................................................................................... 19
4.1.3 Communications ........................................................................................................................ 20
4.2 Institutional ....................................................................................................................................... 20
4.2.1 Terminology, Rules and Policies ................................................................................................. 20
4.2.2 Compensation and value of service. .......................................................................................... 21
5. Opportunities .......................................................................................................................................... 21
5.1 Enabling Customers .......................................................................................................................... 22
5.2 Sharing Information and Best Practices ............................................................................................ 22

v
5.3 Contributing to Codes and Standards ............................................................................................... 22
5.4 Assessing the Resource and Collecting Data ..................................................................................... 22
5.5 Modeling and Running Simulations .................................................................................................. 23
5.6 Conducting Technology Research and Development ....................................................................... 23
References .................................................................................................................................................. 24
Appendix ..................................................................................................................................................... 26
A. Workshop Participants ....................................................................................................................... 26
A.1 Attendees ...................................................................................................................................... 26
A.2 Speakers and Presenters .............................................................................................................. 27
A.3 Facilitators .................................................................................................................................... 27
A.4 Note Takers ................................................................................................................................... 27
A.5 Planning Team .............................................................................................................................. 28

vi
Acronyms AC Air Conditioning ACE Area Control Error AGC Automatic Generation Control AHAM Association of Home Appliance Manufacturers ANL Argonne National Laboratory ASHRAE American Society of Heating, Refrigerating and Air-Conditioning Engineers BPA Bonneville Power Administration CAISO California Independent System Operator CPP Critical Peak Pricing CPR Critical Peak Rebate CSP Curtailment Service Provider DA Day-ahead DLC Direct Load Control DOE U.S. Department of Energy DR Demand Response EERE DOE Office of Energy Efficiency and Renewable Energy ERCOT Electric Reliability Council of Texas FERC Federal Energy Regulatory Commission GO Golden Field Office HA Hour Ahead ISO Independent System Operator ISO-NE ISO of New England LaaR Load as a Resource LBNL Lawrence Berkeley National Laboratory LSE Load Serving Entity MISO Midwest Independent System Operator M&V Measurement and Verification NERC North American Electric Reliability Corporation NREL National Renewable Energy Laboratory NYISO New York Independent System Operator OE DOE Office of Electricity Delivery and Energy Reliability OpenADR Open Automated Demand Response ORNL Oak Ridge National Laboratory PEV Plug-in Electric Vehicle PJM PJM Interconnection PNNL Pacific Northwest National Laboratory RPS Renewable Portfolio Standard RT Real-time RTP Real-time Pricing SNL Sandia National Laboratory TOU Time of Use UCD University College Dublin WECC Western Electricity Coordinating Council

vii
This page intentionally left blank.
1
Executive Summary Load is technically capable of serving as a reliability resource that can assist in the balancing of the
electric grid and provide ancillary services (i.e., reliability services) to the power system. Load
participation in ancillary services has a number of noteworthy benefits. It deepens the pool of reliability
resources available to system operators, increases system flexibility to manage the variable output of
renewable energy resources like wind and solar, enables retail customers to manage their energy costs,
and enhances overall system efficiency. While end-use loads can be used for ancillary services, there
are a number of implementation challenges that need to be addressed before demand-side resources
are routinely deployed alongside more conventional supply-side resources in all regions.
Demand response has a long history. Utilities use demand response to manage peak prices and have
depended upon it for emergency situations when vulnerable to imminent system collapse. In the past
few years, federal regulatory actions have encouraged use of demand response, and subsequently,
there has been increased presence of demand-side resources in energy and capacity markets. However,
in most regions, there is limited participation of loads in providing ancillary services. Bulk system
reliability needs like frequency regulation and spinning reserve are the most valuable ancillary services
and the most technically difficult to provide. They are also amenable to provision by many types of
loads, because the response must be rapid and the energy component of the service is minimal as
compared to conventional demand response.
In principle, the demand response resource is vast. However, there are significant implementation
challenges that must be addressed before it may be fully utilized. Implementation challenges include
both technical and institutional issues. Technical barriers center on the costs of enabling technologies
for communications and control. This barrier is particularly acute for obtaining the aggregated response
of smaller loads that cannot afford the monitoring and communications equipment typically used with
large generations. Alternative means of measurement and verification for real-time telemetry and
settlement are necessary, but it remains to be seen if these alternatives can meet the needs of system
operations. Additional technical barriers include forecasting demand response both for operations and
long-term planning, developing standards for secure communications, and parameterizing loads for
system needs that also respect their individual operating constraints.
Institutional issues are complex. Regulatory authority sits at the local, state, and federal levels, and
implementation resides with individual utilities and ISO/RTOs (where there are organized markets).
There exist many different permutations of regulations and implementations across North America.
Conflicting priorities and lack of experience with new technologies and operational practices have led to
deployment obstacles that either directly prohibit load participation or effectively block it through the
unintended consequences of other regulatory actions and/or incompatibilities with the overlapping
rules of multiple jurisdictional authorities.
With the exception of the largest loads, most retail customers interact with the bulk power system
through retail tariffs or an aggregator. New tariffs must undergo approval through a regulatory process,

2
and there has been minimal progress in utilizing load-based ancillary services through a retail tariff
mechanism. Most ancillary services from load are procured through third party aggregators, who
generally do not need to abide by requirements attached to regulated utilities. However, aggregators
are not permitted to operate in many states, and even where they are permitted, aggregation rules may
be somewhat arbitrary and slow to adoption.
Making a comprehensive assessment of all opportunities and prioritizing them is beyond the scope of
this report. Some of these opportunities include enabling customers through education and tools,
sharing information and best practices, as well as drafting example tariffs and market rules, contributing
to codes and standards, assessing the resource potential and collecting data, modeling and simulations,
and conducting technology research and development.
In summary, technical and institutional issues must be addressed hand-in-hand to affect substantive
development of load participation in ancillary services. To realize the potential of demand response to
provide reliability services to the grid, a number of challenges need to be addressed that will require
coordination among multiple entities, and targeted research and development that fully respects
market conditions and associated regulatory and policy environments.

3
1. Introduction National policy and regulatory drivers to diversify our energy supplies and mitigate the environmental
impact of energy systems will bring about fundamental changes to the power system. New loads like
plug-in electric vehicles (PEV) and advances in communications through widespread implementation of
advanced metering infrastructure should redefine the relationships between electricity providers and
their customers, and bring new challenges and opportunities. Load may be capable of serving as a
reliability resource that can assist in the balancing of the electric grid and provide ancillary services (i.e.,
reliability services) to the power system (FERC, 2011a). Load participation increases the supply of
responsive resources for the grid and can reduce the cost of reliability services to customers in support
of overall system efficiency.
Wind and solar power provide environmental, security, and economic benefits, but they also increase
uncertainty and variability, requiring additional flexibility from the power system (NERC, 2010). As of
November 2011, 29 states and the District of Columbia have passed Renewable Portfolio Standards
(RPS) and an additional 8 have pledged renewable portfolio goals (Figure 1). Load in areas covered by
an RPS represent half of total load served, and the combination of state mandates, federal and state
incentives, price reductions in renewable generation technologies, and societal drivers have led to
substantial renewable capacity development in recent years (Wiser, 2011).
Figure 1: Renewable portfolio standard policies in the United States (DSIRE, 2011).

4
As variable energy-resource renewable technologies increase their contribution to energy supplies, the
need for operational flexibility on the grid is likely to grow in order to maintain electric power quality,
reliability, and system security.
In October 2011, the U.S. Department of Energy (DOE), Office of Energy Efficiency and Renewable
Energy (EERE) and Office of Electricity Delivery and Energy Reliability (OE), hosted a two-day workshop
in Washington, DC to examine technical, institutional, economic, regulatory, and policy issues regarding
the participation of load as a provider of ancillary services (AS). The purpose of the workshop was to
inform DOE’s research priorities on grid reliability needs in the context of today’s power system and
possible future systems with high penetrations of variable generation. Drawing from the workshop
presentations and discussions, this paper summarizes the perspectives of the workshop attendees on
the state of progress, issues, barriers, and potential for load participation in ancillary services.
1.1 Process and Subgroups Over seventy experts (Appendix A) from across the demand response (DR)1 value chain including transmission
system operators, DR aggregators, large customers, technology vendors, university and national laboratory
researchers, state and federal regulators, and consultants to the electric power industry joined DOE staff to
identify and discuss the current barriers to expanded use of DR and what are the future opportunities for AS
from load. The workshop was organized around AS buyers and sellers. The buyers of AS are transmission
system operators, and the sellers of DR-based AS are customer loads and aggregators of those loads. This
second group was divided into large customers and mass market customers, and they were distinguished
primarily by their metering, communications, and control requirements.2 Both large and mass-market
customers may provide DR through a third-party aggregator.
On the first day of the workshop, the three stakeholder groups (i.e., AS buyers, DR-based AS sellers/large
customers, and DR-based AS sellers/mass market customers) met individually to identify common themes and
issues; on the second day of the workshop, the groups came together and presented findings from their
individual breakout sessions to one another. Within each breakout session, there were a number of
presentations. A member of the DOE planning team provided contextual material to ensure that differences in
terminology for grid reliability services did not impose a barrier to discussion of the fundamental issues. Each
breakout session focused on a set of six questions.
1. Is it possible to use demand response for ancillary services?
2. Is it desirable?
3. Is it worth the effort?
4. What is required?
1 Demand response is a general term covering all forms of demand (load) participation in energy, capacity, and/or
ancillary service markets. Here we are concerned with a subset of these where the load (demand) participates specifically in the provision of ancillary services. 2 Metering requirements, comparable to those imposed on conventional generators, may be cost effective for
large industrial and commercial building loads, but are generally not for small commercial and residential loads. The per-unit DR capacity of these loads is low and economically viable implementation may require some form of statistical measurement and verification.

5
5. What are the obstacles?
6. How can the DOE help?
In addition, invited speakers provided specific examples of DR technologies, existing and pilot programs,
and their experiences with either providing or utilizing DR as an AS resource. They also discussed:
Efforts to adjust technical requirements and market rules to enable non-discriminatory access
for load-side resources;
Experience with different types of loads, including characteristics and constraints in providing
response, and;
Perceived technical and non-technical barriers to expanded use of load participating in AS.
Based on the discussions, the groups developed a set of slides and nominated a spokesperson to deliver
each breakout session’s key takeaways to the full workshop. These presentations helped focus and
drove the afternoon discussions on the second day.3
2. Background Load participation in ancillary services increases the available pool of flexible resources, supports
reliability, and reduces costs for all power system users. The increased use of load-side resources for AS
can improve overall system efficiency and may, thereby, reduce emissions from the electricity sector.
By allowing load to provide AS, generators may run at more efficient operating points; and further
emission savings are possible. The Federal Energy Regulatory Commission (FERC) identifies six ancillary
services; the types, names, definitions, and technical requirements differ by region and by market.
However, this workshop has focused on frequency regulation and spinning reserve4 because these are
currently the most expensive ancillary services required by the power system, most amenable to
provision by DR, and technically most challenging to provide (Kirby 2006).
2.1 Power System Reliability The almost instantaneous balance of supply and demand is the fundamental reliability criterion for
electric power systems. If there is any imbalance, the speed of the system (i.e. frequency) will deviate,
downwards for an undersupply and upwards for an oversupply. Conservation of energy requires that a
supply-demand balance must be maintained; and in an electric power system, any imbalance is taken
from, or given to, the kinetic energy stored in the synchronized rotating masses (i.e., generators,
turbines, loads etc.) that make up a synchronous power system (Figure 2). Systems are designed to run
around one nominal frequency of 60 Hz, and the allowable error margin is small, normally ±0.035 Hz in
large systems but larger in some smaller systems5. If the system frequency deviates too far from
3 Presentations for the workshop are currently available through DOE’s ftp site -
ftp://CorpAdmin:[email protected]/Corporate/Load%20Participation%20in%20Ancillary%20Services/. 4 Generally, if load can provide spinning reserve, then it can also provide non-spinning reserve.
5 Smaller systems have relatively small synchronised rotating mass and consequently less stored energy.
Therefore, the same imbalances will result in significantly larger frequency changes. The largest imbalances are typically the sudden loss of a large generator, and for economy–of-scale reasons, individual generators are

6
nominal, the generating units will disconnect causing a cascading failure and, in the worst case, leading
to a system collapse and a large-scale blackout (Bialek, 2007).
Figure 2: A synchronous power system, with a speed of rotation at the system frequency of 60 Hz. The green shaft represents the combined inertia of all synchronized units and the transmission system, and the blue
devices represent interconnected generators.
Therefore, frequency control (i.e., maintaining system frequency within a tight range) is fundamental to
maintaining a reliable and secure electric power system. Frequency control occurs over multiple time
frames, requires supply and demand forecasting, and involves coordination among many different
entities. Planning a power system years in advance and ensuring enough generation and corresponding
transmission to meet demand is the basis of frequency control. Closer to real time operation,
frequency control means that the generation plant(s) and transmission are available and not undergoing
maintenance. In the day-ahead period, frequency control is planned for by scheduling generation and
transmission, typically at an hourly resolution and in advance to meet forecasted demand. Within-the-
hour generation can be dispatched every five minutes, for example, to ensure that supply-demand
balance is maintained. All of this can be achieved with or without formal energy markets. However, at
the shortest time scales, automatic mechanisms must be used to regulate supply-demand balance and
respond to imbalances like the sudden loss of a large generator. These automatic mechanisms are
termed AS to distinguish them from energy products. These AS do involve some small amounts of
energy, but their real value is not in the energy component, but rather in their technical capability to
respond reliably and quickly to maintain balance. Power systems also require other forms of control, in
particular, voltage control; however, this is a much more localized AS and is not as amenable to load-
side participation on the bulk system.
2.1.1 Regulation and Spinning Reserve Regulation and spinning reserve are two reliability services that provide frequency control. FERC defines
regulation as “the capability to inject or withdraw real power by resources capable of responding
typically a larger percentage of the total generation supply on smaller systems. Therefore, the frequency deviations experienced by smaller systems is larger for the loss of a single generator.

7
appropriately to a system operator’s automatic generation control (AGC) signal in order to correct for
actual or expected Area Control Error (ACE) needs" (FERC, 2011b). It operates on time scales below the
shortest energy dispatch interval and is used to compensate for the random, minute-to-minute
variations in aggregate system load that are too fast to be followed by the economic dispatch of the
energy producing generators (Figure 3).6
Figure 3: Regulation compensates for random minute-to-minute variations in net system load (Kirby 2006).
FERC describes spinning reserve as “needed to serve load immediately in the event of a system
contingency. Spinning Reserve Service may be provided by generating units that are on-line and loaded
at less than maximum output and by non-generation resources capable of providing this service.” (FERC,
2007) Spinning reserves responds directly to system frequency deviations or to system operator
commands, depending on the severity of the contingency, to help restore the generation / load balance
after a severe event. The response duration is typically about 10 minutes, but may be over an hour for
rare, serious events. While regulation is adjusted continuously based on the automatic generation cycle
(e.g., 2 to 8 seconds), spinning reserve is called upon relatively infrequently (e.g., every few days in some
areas and once a week or less in others).
6 Frequency regulation (i.e., secondary frequency control) may be confused with frequency response (i.e., primary
frequency control) (FERC, 2011b, page 3, footnote 5). Frequency response differs from frequency regulation. Rather than responding to an AGC dispatch instruction, frequency response involves the automatic, autonomous, and rapid action of a turbine governor’s control to change a generator’s output and of DR resources to change consumption in automatic response to changes in frequency. There are also proposals to develop a market for primary frequency control, which may be an opportunity for load participation in addition to secondary frequency control (Doherty, 2005b).

8
2.1.2 Balancing areas The frequency on a synchronous power system is the same throughout the interconnection, other than
for very short periods of time during major transient incidents. Frequency control is done on a local
basis by balancing authorities, such that in aggregate, frequency is maintained within acceptable limits.
A system operator is necessary to manage it across many different balancing areas, in a centralized
manner. Frequency control can result in power flows between systems, and the transmission
constraints need to be considered in all control actions.
2.1.3 Load participating in ancillary services Maintaining supply-demand balance using the load itself is a valid approach, but traditionally the load
was taken as fixed and normally, system controls resided on the supply-side. In extreme emergency
situations, load is shed from the system using under frequency load-shedding schemes which help to
preserve supply-demand balance and avoid system collapse. However, this type of load participation is
involuntary and uncompensated and is used only as a last resort under unusual and rare circumstances.
To date, there has been some limited load participation in frequency control both in energy and AS
aspects, and implementing controls on the load-side is growing. Driven by improved and widely
available communications systems, load participation is becoming easier and more reliable; and there is
increasing emphasis on opening up the demand side of the market (i.e., customer choice, etc).
2.2 Ancillary Service Requirements There is concern that the need for AS is limited, and supply might exceed demand if load participates. This is
especially a concern for aggregators and equipment suppliers trying to determine if investment in load
participation in AS is worthwhile. With regulation requirements ranging from less than 1%7 to 3% of peak load,
depending on the size of the balancing area (aggregation benefits result in larger balancing areas requiring less
regulation per unit of load than smaller balancing areas), the total North American regulation requirement is 8,000
MW to 24,000 MW. The trends of balancing area consolidation and growth of large independent system
operators (ISOs) and regional transmission operators (RTOs) is tending to reduce the requirement, and increased
performance and capabilities of generation regulation assets may further reduce requirements8. Regulation
requirements also decline with faster energy scheduling. All of the organized markets use 5-minute energy
scheduling, while many of the non-market regions are currently restricted to hourly energy scheduling. Hence,
these regions have larger regulation requirements. This highlights the "volatility" of this requirement and the
legitimacy of the concerns of those tempted to enter this market. Spinning reserve requirements vary from region
to region, depending on reliability rules and the size of reserve sharing pools. There is not as great a concern with
declining spinning reserve requirements as there is with regulation because they are determined by the size of the
largest credible contingency. The total requirement across North America is perhaps 50,000 MW.
2.3 Demand Response Types Figure 4 shows five basic types of DR. All of them can have some impact on power system reliability;
some have a greater impact than others. Energy efficiency reduces consumption during all hours and
7 Currently, the regulation requirement in New England is about 0.25% of peak load.
8 For instance, PJM expects regulation requirements to decline from 1% of load to 0.9% under phase 1
implementation of pay-for-performance.

9
typically reduces the need for generation and transmission. It is not focused on times of greatest power
system stress and may not provide the degree of cost-effective response to specific reliability problems
as more directed alternatives. Price responsive load and peak shaving both target specific hours when
response is desired; the former facilitates voluntary market response to price signals while the latter
utilizes direct control commands. Both types can be used to address capacity inadequacy caused by a
lack of generation or transmission, but they do not directly provide AS. Regulation response and
spinning reserve specifically target power system reliability needs and offer the greatest reliability
benefit per MW (Kirby, 2006).
Figure 4: Five basic types of DR.
The shorter response duration of both regulation and spinning reserves and the less frequent response
deployment of spinning reserves make them a better match to the response capabilities of some
responsive loads as opposed to peak reduction, which has a large energy component.
DR can supply both energy markets (e.g., load following) and ancillary service markets including non-
spinning reserve, but minute-to-minute regulation (AGC) and spinning reserve are the highest value AS.
Although the potential exists, there are a number of implementation challenges that need to be
addressed before demand-side resources are routinely deployed alongside more conventional supply-
side resources in all regions.
All but the largest retail customers interact with the bulk power system through either retail tariffs
which fund regulated DR programs or programs offered by third-party aggregators. Very few of the
current retail programs or tariffs allow for the provision of AS (Cappers, 2011). Where regulated load
serving entities are responsible for providing these DR resources to AS markets, new programs will need
to be developed and then successfully brought through the regulatory process before they can be

10
offered to customers. Aggregators, on the other hand, do not generally need to navigate the regulatory
process to offer such programs, but are not universally allowed to operate in every jurisdiction across
the United States.
3. Workshop Findings There was a surprising degree of consensus on many of the basic DR and AS issues among the diverse
workshop participants. All three subgroups reported out that their participants felt that DR is
technically capable of providing AS response as good as generation. Assuming a comparable
communication infrastructure, DR can have faster response than generation, both to system operator
commands and to price signals. The subgroups also agreed that including DR in the AS supply mix is
desirable. System operators like the larger pool of reliability resources, and both large and small loads
like the prospect of additional income.
All three subgroups agreed that the potential pool of response-capable loads exceeds the power system
requirement for regulation and spinning reserve; and therefore if this pool is developed, there should
be some combination of loads available at all times that can meet the requirement. The opposite
concern that the need for regulation and spinning reserve is too low to justify developing a large
capability to respond was expressed by some. Some feel that the increase in variable renewable
generation (wind and solar) will increase the regulation and spinning reserve requirements. The
expected retirement of coal fired generation in the next few years may also decrease capacity margins
and reduce the supply of AS from generation.
All three subgroups expressed concern with the long-term sustainability of DR programs, though the
concerns are somewhat different across the groups. Some system operators are concerned that DR
resources may not be consistently available years in the future.9 There is a concern that the physical
capability or the interest in load participating in AS may not continue. Conversely, while DR availability
to supply AS may vary with the weather (e.g., residential air conditioning (AC) supplying equivalent
spinning reserve), the ability to supply the reserve may increase when the total system load is highest
(i.e., due to residential and commercial AC) and alternative supplies are least available. This is opposite
for generators whose capacity declines with higher ambient temperatures. Both suppliers of large and
small loads also expressed concerns that AS needs, programs, and prices might not be assured for years
into the future, making it difficult to invest in AS capability. In contrast, there is no guarantee that a
generation resource will be available for AS, but the resource itself will more likely exist for decades and
will always be in the energy supply business.
All three subgroups stated that institutional barriers presented the largest obstacles to increased use of
load participating in AS provision. For example, national energy efficiency standards for water heaters
that focus exclusively on the water heater itself and mandate technologies that unintentionally block AS
9 In an ISO-NE pilot program on DR providing reserves, the response to dispatch instructions over the course of the
pilot was highly variable (Lowell, 2011).

11
provision were cited as flawed because they ignore gains in power system efficiency when water heaters
are controlled for power system reliability (Goldman, 2010).
There was also consensus on some issues that were not raised as critical in any of the subgroups. While
there was agreement that technology can always be improved, technology (with the exception of
statistical measurement and verification (M&V) for large aggregations of small loads and
communications protocols and standards) was not seen as a major immediate barrier. Existing
technology is available to meet current needs. Similarly, while demonstration projects may be useful in
specific instances, it was felt that many technologies have been sufficiently demonstrated and are ready
for implementation. Other technologies could benefit from demonstration projects, but the
demonstration projects need to go beyond addressing the question ‘is it technically feasible to obtain
the desired response?’ Pilot projects that combine technology with market and regulatory issues to
address challenges and hurdles may be more beneficial.
Therefore, workshop participants from all three subgroups agreed that DR can be an effective supplier of
ancillary services, but there were knowledge gaps and implementation difficulties that are detailed in the
subsections below. The participants also identified a number of barriers which are detailed in Section 4.
3.1 Existing Experience Experience using DR resources for AS is limited to the few markets of ERCOT, MISO, PJM, NYISO, as well
as several notable pilot projects in ISO-NE, BPA, and CAISO. PJM has 250 MW of spinning reserve from
DR, and ERCOT obtains half of its spinning reserves from DR. Almost all current experience is with larger
loads. MISO uses DR directly for regulation, and several entities have successful pilot programs where
they have also used DR for regulation, including using water heater control for frequency regulation
(PJM)10 and with specific applications to wind ramps (BPA). Several of the DR programs today have
limited participation for a variety of reasons; some are highlighted in this report. DR is part of the NYISO
Demand-Side Ancillary Services Program where the requirement is one MW available for one hour, but
there are currently no active participants. ISO-NE ran a Demand Response Reserves Pilot Program from
2006 to 2010 that had mixed results, and is currently running an Alternative Technology Regulation Pilot
Program; participation in both pilot programs were relatively low. The need for upward regulation
(reductions in load) and downward regulation (increases in load) can be met by load, although
regulation up is often easier with customers typically signing up for curtailment of certain loads at
certain frequencies per year.
DR from interruptible loads participates in ancillary service markets for contingency reserves in several
different markets, including ERCOT, MISO, PJM, and NYISO. Usually, these programs call on interruptible
loads solely under contingency events (though NYISO co-optimizes contingency reserves into energy
markets under certain conditions) and based on a low frequency threshold or system operator
command. For example, loads in ERCOT are equipped with under-frequency relays set at 59.7 Hz, and
response is within 20 cycles or alternatively, it is at the operators command.
10
As of November, 2011; Enbala Power Networks and Viridity Energy are providing regulating reserves to the PJM market.

12
Different regions have markets that affect regulation and the potential for DR to be used for AS. For
example, DR regions with 5-minute energy markets require less regulation than regions with only hourly
energy markets, and longer regulation response is required in hourly-only energy market areas.
Different markets have different requirements. For instance, CAISO and ERCOT have separate upward
and downward regulation; whereas, MISO and NYISO have bi-directional regulation (i.e., combined
upward and downward). Western Electricity Coordinating Council (WECC) is currently balloting a new
version of the BAL-002 standard which, if passed, will remove the current prohibition against DR
providing spinning reserve (WECC, 2011b).
Figure 5: Distribution of loads in the spring and summer for ERCOT. ERCOT does not procure ancillary services from residential customers, and it is a large untapped resource representing over half of load on the typical peak
summer afternoon (Patterson, 2011).
Several large industrial facilities in the United States currently provide spinning reserves and/or
regulation. Alcoa’s Warrick Operations in Evansville, Indiana, invested in advanced metering
capabilities, data visualization tools, and integrated control systems that allow the plant operators to
dynamically co-optimize business objectives with energy and AS market opportunities (Todd, 2011).
Specifically, Alcoa provides MISO with direct control of 70 MW of industrial process loads (e.g., smelting,
rolling), which allows the company to be a resource providing a host of various energy and AS products,
and an additional 75 MWs of interruptible loads to provide spinning reserves. Alcoa has provided
regulation AS to MISO every hour since the AS markets opened. In ERCOT, there is roughly 2,400 MW of
registered load resource capacity providing various energy and AS (e.g., spinning reserve, non-spinning
reserve, and regulation service) (Patterson, 2011). The majority of the capacity (1030 MW) comes from
individual large electro-chemical process loads which rely on under-frequency relays and/or have an
ability to receive AGC-type signals and provide governor-type frequency response. The remaining
capacity is provided by individual medium-sized industrial facilities (820 MW) of 10 to 50 MW in size and

13
small industrial and commercial facilities (550 MW) that are 10 MW or less, which rely on automation
and control technology to participate as AS resources.
Enbala is currently participating with PJM in investigating how aggregations of many different
commercial and industrial facilities’ loads can be controlled to provide regulation. Specifically, Enbala’s
Power Network focuses on four different end-use areas: production processes, industrial ventilation,
refrigeration, and water/wastewater treatment (Dizy, 2011). Some of these loads cannot be ramped up
or down (i.e., they are either on or off) and can only be cycled on/off a specified number of times over a
certain period of time. ENBALA models the load’s operating constraints into its optimization platform,
and then determines the best way to satisfy the regulation request from the real time health, status,
and flexibility of each of the resources in the ENBALA Power Network. In this way, the network responds
to the regulation request and no individual resource has to respond with the frequency or magnitude
required by the regulation signal.
Figure 6: Ancillary service prices and air conditioning (AC) loads on a single summer weekday (Kirby, 2007).11
Residential and small commercial customers do not presently provide regulation or spinning reserves in
any part of the United States; however, there are certain loads that have been shown via demonstration
projects to be capable of providing these type of AS (Eto, 2007), and products do exist in some markets
(e.g., CAISO Proxy Demand Response) though adoption outside of pilot projects has been minimal. One
of the key challenges for this demographic is that the loads they would rely on have limitations that may
affect the degree to which they can provide AS (Kiliccote, 2011). Loads like air conditioners are weather
dependent, which imposes restrictions on the amount of DR that can be provided throughout the year,
during various points in the summer months, and even within a single summer weekday (Figure 5).
While spinning reserves are required throughout the day and throughout the year, the price of spinning
11
Replacement reserve is another type of ancillary service that is similar to non-spinning reserve.
$0
$10
$20
$30
0:00 6:00 12:00 18:00 0:00
$/M
W-h
r
Air
Co
nd
itio
nin
g L
oa
d (
MW
)
Spinning
Non-Spinning
Replacement
Typical AC Load

14
reserve, reflecting the availability of other resources, shows a strong daily and seasonal pattern.
Spinning reserve prices are high when load is high and generation is required to serve load.
Consequently, the availability of retail loads like air conditioning to provide spinning reserve is highly
correlated with the scarcity of that reserve from conventional resources (Figure 6).
3.2 Future Ancillary Service Requirements There were a number of concerns and questions about the current and future requirements for AS, and
the potential value of load participating in the provision of AS. These statements amounted to a few key
concerns and questions.
What are the physical requirements for AS today, how much AS is needed, and how will that change in a future system using higher penetrations of renewables?
What is the potential value of provision of those ancillary services from demand response resources?
How will demand response impact ancillary service markets and prices?
The first set of questions is discussed in this section and others are address in subsequent sections.
Variable renewables (such as wind and solar) tend to increase the regulation requirement because they
introduce additional variability inside the scheduling interval. CAISO estimates that the 33% California
RPS will increase the regulation requirements by two to four times present levels. WECC is considering
frequency relaxing for balancing standards. Relaxing the acceptable frequency bandwidths may result in
lower regulation requirements (WECCa, 2011). Due to the strong relationship of spinning reserves with
the size of the largest contingency, the requirement is not significantly increased by variable renewables
(Doherty, 2005b).
There is also the possible need to introduce a new AS because of wind and solar ramp events12. With more and
more variable renewable energy coming on the system, a new 1- to 6-hour AS may address ramping from
variable generation and DR may be a player in providing that service. Accurate wind power forecasting may
influence the need for such a service. Figure 7 shows a wind ramp in ERCOT. Wind ramps can be longer than a
few hours. For example, large multiple hour ramps measured in ERCOT from the 10-GW wind fleet indicated
that the largest sustained ramp was just over 50% of the nameplate capacity over a period of more than 12
hours (Wan, 2011). Both MISO and CAISO are considering addressing a new ramping AS. The industry does not
have as much experience with solar generation yet, but many utility operators expect solar variability to be as
great as or greater than wind variability.
12
Wind ramps are non-contingency events that happen over several hours and are much slower than a typical contingency event in which a thermal unit goes offline instantaneously. The aggregation of wind and the spatial diversity of the wind over large areas results in a ramping requirement that occurs over several hours and does not usually trigger frequency excursions. Hence, wind ramps do not directly impact spinning reserve requirements. However, there may be insufficient depth in the real-time energy market to manage large and unexpected ramps. Large wind ramp events are similar to conventional contingencies in that they are relatively rare, so additional reserves that are similar to spinning and non-spinning reserves may be required.

15
Figure 7: ERCOT wind aggregation changes the event characteristics from a contingency to a large ramp.
3.3 Characterizing Demand Response Workshop participants agreed that there is a need to characterize the technical potential of load
participating in AS. Both system operators and response aggregators need to understand how large the
resource is to determine if it can be effective on a large scale. It is difficult to establish practical market
rules that are truly technology neutral and existing market rules may unintentionally discriminate
against new technologies. Market rules and market clearing software are also complex and it is unwise
to adjust them to accommodate a new technology unless it is clear that the technology will be a
significant market participant. Similarly, they need to understand what loads can provide and how that
best matches AS requirements. In particular, given that load resources have different temporal
constraints than conventional capacity, how does that limit or augment their ability to provide AS?
Characterizing the technical potential is a first step towards understanding the realizable potential
before considering the existing market, regulatory, and policy environment.
3.3.1 Technical potential Load participating in the provision of spinning reserves and/or regulation needs to employ some form of
automation and control technology. In broad terms, the load to be controlled will need to have certain
availability requirements which must be well understood to quantify the level of response the load can
provide under a variety of circumstances, time periods, and operating conditions. How quickly these
loads can be altered relative to a signal (i.e., latency13), as well as how quickly (i.e., ramp-rate) and what
the overall limits (i.e., range) are to which they can change their consumption of electricity in response
to the signal, as well as the impact of the frequency with which they are asked to do so, will all dictate
13
Communication latencies may change depending on the communication architecture and transport mechanism. Latency issues related to various before-the-meter, behind-the-meter, and aggregation applications should also be characterized.

16
the amount of response the load can provide. Table 1 provides a sample of various loads within each
customer class which have been either proven, through field demonstrations or pilot programs, or
proposed as being capable of providing spinning reserve and/or regulation with the requisite
automation and control technology employed.
Industrial Commercial Residential
Aluminum Smelting Air Conditioning Air Conditioning Agricultural Pumping Data Centers Clothes Washer/Dryers
Compression Refrigerated Warehouses Dishwasher Electro-Chemical Processing Heating Freezing/Refrigeration
Ventilation Lighting Pool Pump Water/Wastewater Treatment Ventilation Hot Water Heaters
Table 1: Examples of loads capable of providing spinning reserve and regulation.
Characterizing and identifying physical limitations and operational issues of loads is key to successful
participation of loads with response characteristics that are acceptable to the load, but at the same
time, are detectable by the bulk power system. One of the suggestions from the large commercial
customer representatives was to work with the American Society of Heating, Refrigerating and Air-
Conditioning Engineers (ASHRAE) to better define “acceptable” strategies in commercial buildings.
3.3.2 Cost of load participating in ancillary services Having characterized the technical potential of load participating in AS, it is important to also establish a
cost for providing that service. The cost characteristics of responsive load are quite different from that
of generation. For many loads, the per-unit cost of response ($/MWh) increases, often dramatically,
with response duration. This is the opposite of most generation per-unit response costs. For generation,
there is often an initial cost associated with either starting the unit or ramping between output levels.
Continued operation at the new power level can typically be sustained indefinitely at constant cost. This
yields a composite declining cost of response with response duration. Some responsive load may have
little or no startup cost, but cost can rise dramatically with duration. Residential AC has little response
cost for short, infrequent curtailments; however, frequent curtailment for multiple hours is
unacceptable. Similarly, large industrial processes (e.g., aluminum smelting) can be curtailed at
reasonable cost for limited duration, but a multi-hour curtailment can ruin equipment. In both cases, the
response cost rises dramatically with duration. One practical consequence is that co-optimizing AS and
energy from generation typically makes sense while co-optimizing AS, and energy from some loads will
force the service to withdraw from the market.14
14
All power system co-optimization software is built on the assumption that any resource that can supply spinning reserve can also supply energy. If the price of energy gets sufficiently high, the co-optimizer will use the spinning reserve resource for energy. This is fine for almost every generator since it gets paid the high energy price plus the spin price, and it can sustain the higher output for hours. But an aluminum smelter load, for example, cannot stand being curtailed for more than about 2 hours without incurring massive damage. If there is any danger at all of being co-optimized from spinning reserve into multi-hour energy, the aluminum smelter has to drop out of the spinning reserve market. Residential air conditioning has the same limitation. While residential air conditioning is an ideal spinning reserve resource where 10-minute long events typically occur every few days, a residential customer is unlikely to participate in the spinning reserve market if it may be forced to curtail energy consumption

17
The cost of providing AS response from generation resources is typically dominated by their opportunity
cost in the energy market. The cost of providing AS response from loads is typically dominated by the
capital cost of the communications and control equipment, exacerbated if there is also a real-time
telemetry requirement. Opportunity costs exist for load response, but they are typically difficult to
calculate and are specific to the individual load. Participating in regulation or spinning reserves may
result in load being operated under conditions different from what they were designed for. This could
have serious implications for the useful lifetime of the load, requiring earlier replacement or increased
maintenance and cost to keep it running effectively and efficiently. In addition, there may be
implications for product warranties which could be voided due to damage resulting from product use in
a manner that is contrary to original design specifications.
3.3.3 Forecasting load participation in ancillary services During the two-day workshop, the issues of forecasting load participation in AS were discussed,
especially in terms of the system operator’s ability to rely on the resource. Representatives from the
demand side with prior experience in participating in AS markets agreed that forecasting DR potential of
the loads is difficult. However, after this brief agreement, the participants steered the discussion
towards the difficulty of modeling the loads as generators or pseudo generators. In this section, we
explain how load participates in AS and discuss the need for development of methodologies and metrics
to better forecast its participation.
When loads participate in AS markets, they provide offers for specific service(s) into the market a day
ahead or in some cases, two days ahead. These offers are associated with a time interval and include a
ramp rate (MW/min) and a bid amount (MW) for a certain type of product. To develop these offers, a
site has to develop two load forecasts for the same day; one with a load participating in the AS market
and one without participation. The load forecast methods typically include such factors as weather
conditions and typical consumption patterns. Load participation in AS is calculated by subtracting the
load forecast with AS participation from the load forecast without AS participation. The probability or
certainty of loads to deliver AS may depend on many factors, including the nature of the load, the
control algorithms, aggregation issues, etc. As a result, the AS offers from load may be unreliable,
making it difficult for them to deliver the AS as contracted. To mitigate this concern, these resources
need to provide system operators with probability or uncertainty indicators to make them comparable
alternatives to generators. With advancements in controls and communications technologies, resource-
modeling algorithms may improve the accuracy of the forecasts.
3.4 Ancillary Service Prices AS prices were of concern to many of the workshop participants for several reasons. First, AS prices
have declined significantly since 2008 in all regions with AS markets. This may be related to the
economic downturn, and AS prices may return to earlier levels when the demand for electricity returns;
for 6 hours every hot summer afternoon. The basic problem is that generator costs are flat or drop with longer time (they drop if startup costs are included and are spread over the longer response duration). Load has a cost that may be very low for short durations, but it can get extremely high for long durations. The co-optimizer simply does not consider this limitation (Kirby, 2006). This issue also applies to energy-limited storage devices but has been resolve in a few jurisdictions (FERC, 2011b).

18
workshop participants were not sure which trend will prevail. Second, DR must be a lower cost AS
supplier to be attractive and used, and this will necessarily reduce AS prices. The price impacts for AS
could be driven primarily by both supply-side effects and demand effects. This is beneficial for society,
but it reduces the incentive for demand to provide AS response and complicates DR investment analysis.
AS pricing becomes more involved with load participation, and AS prices are currently dominated by the
opportunity costs of generators (see Section 3.3.2) that supply them. If a generator has a $40/MWh
production cost and energy is selling for $50/MWh, then the generator incurs a $10/MW-hr opportunity
cost when it reduces output and forgoes a profitable energy sale to hold capacity in reserve to provide
spinning reserve. A load that stands ready to immediately reduce consumption in response to a
spinning reserve deployment also incurs costs, but they are not as easy to calculate. There are certainly
capital costs for communications and control equipment, and possibly capital cost for modifications to
the load’s process equipment.
Capital costs are not reflected in current AS market prices that are based primarily on opportunity costs.
Opportunity costs themselves depend on each responding load’s process and circumstances. Capturing
the benefits of load participation in AS will be difficult with opportunity-cost-based market rules if costs
are dominated by capital costs. The problem will be less as long as generators continue to supply at least
part of the AS, but prices will likely decline to unsustainable levels during periods when load (and
energy-limited storage, which also has high capital cost but little opportunity cost) provides all of the
required regulation or spinning reserve.15 This problem is important for market designers and regulators
because it may be less expensive to obtain AS response from DR, even including the increased capital
costs, than from generation. But if the low marginal cost of DR collapses the AS price with the current
market design, then the DR will be unable to cover the capital cost and will not supply the ancillary
services, resulting in a loss for all power system consumers.
4. Barriers Barriers to load participation in AS can be subdivided into economic, enabling technology, and
institutional issues. Economic and technical barriers are dealt with first, followed by institutional issues
which were identified at the workshop – by far the biggest obstacle to AS load participation.
15
Three possible methods for ancillary service pricing were identified in the discussion. One method is to require a percentage of the response to come from generation and let the generation set the price for all ancillary service suppliers. ERCOT currently requires generation to supply at least half of the ancillary service response. This method has the disadvantage of possibly forgoing a large and lower cost ancillary service resource and instead using a higher cost provider. A second method is to allow demand response providers to submit unrestricted bids (or bids with a relatively high price cap). This might be acceptable if market monitors and regulators determine that demand response providers are numerous, individually relatively small, and have no market power. A third alternative could be to make regulation and/or spinning reserve regulated services with regulated rates of return. This would make sense only if load (and possibly energy limited storage) became such a dominant resource that there was little likelihood that generation would be required to provide ancillary services in the future and it was not feasible to create competitive markets for the provision of ancillary services.

19
4.1 Enabling Technology While the general consensus around enabling technology was that it was not the major concern, it still is
an important issue. In this section, we report on some of these issues that were discussed during the
workshop. Technical issues include not only addressing technical feasibility for a responsive load to
provide an ancillary service, but also addressing if technology can be improved sufficiently to make it
economic for AS. The enabling technology barriers issues are organized around three topics: demand
side, system operator, and communications.
4.1.1. Demand-side Demand-side discussions included large commercial and industrial facilities as well as mass-market DR
resources. In general, discussion of the various technological issues for the demand-side market outlined
in this section were scattered throughout the two-day workshop.
Demand-side technologies may be less expensive than generation or storage technologies, but require
upfront investment by the customer for operational improvements. Cost and benefits of such improvements
and new technologies, such as thermal energy storage, are not well understood. Any technology that is
installed is required to generate sufficient revenue to pay for itself, which may necessitate participating in
multiple markets (energy, capacity, and/or AS).16 Therefore, technologies should be developed sufficiently to
overcome any limitations to participation across multiple market products.
Another technical barrier identified by the participants was the cost of telemetry and the lack of sub-
metering systems in facilities. Telemetry equipment is required to provide control visibility to the power
system operators, while revenue meters that capture data at longer time intervals are used for
settlement purposes. Sub-metering allows for the smaller loads, which otherwise may get lost in the
noise of the whole building meter, to be compensated for their participation. Sub-metering can also be
used for identifying waste, characterizing loads, and fault detection of various systems. However, a
single piece of technology at each customer’s facility for visibility and settlement is usually preferred to
reduce costs.
4.1.2 System operator Bulk power system discussions were mainly led by ISOs. System operators require load participation in
AS to be sustainable and reliable with technologies that provide operational transparency and visibility
into the resources. Currently, DR resources are regarded as generators and are characterized with the
same parameters as generators. However, unlike a conventional generator, DR availability changes with
season, day of week, and time of day. As discussed earlier, DR often has costs that rise with response
duration while generation costs remain constant or drop if startup costs are included. Also, integration
of AS with the energy market precludes most loads from participating (see Section 3.3.2). Therefore,
new analytical models that can represent DR resources are needed. Operators also need tools that can
handle perceived uncertainty from DR resources. Finally, aggregation technologies and various
architectures associated with getting small loads to participate in AS may have unrecognized latency and
response characterization issues.
16
Similar conclusions reached for energy storage in the recent workshop (DOE, 2011).

20
4.1.3 Communications The workshop attendees generally agreed that with the widespread deployment of cheap and
ubiquitous communications networks (e.g.,Wi-Fi, 3G, and 4G), there was no longer a communication
infrastructure barrier. However, lack of security standards is a major issue for some ISOs because a
common-mode problem with a large aggregation of loads behaving differently than expected due to
communication security issues could potentially create reliability issues. The use of secure
communications over existing infrastructures can lower the cost of implementation. In addition, the use
of existing communications standards, such as Open Automated Demand Response (OpenADR), can
lower the costs of load participation. Customers should leverage existing DR communication and
control systems as much as possible to reduce the cost of their implementations.
4.2 Institutional Participants attempting to provide AS through load response have encountered numerous institutional
barriers. Institutional barriers refer to issues that relate to policies, procedures, regulations, tariffs,
and/or naturally occurring situations created by the implementation process. Particular issues discussed
during the workshop are identified below.
4.2.1 Terminology, Rules and Policies Across the United States, various marketing structures and vertically integrated utilities have a number
of different terminologies, rules, and policies. This is largely due to the differing generation types,
control systems, market sizes, and available resources in each region.
Conflicting state, local, and federal rules can bar the ability of loads to participate. FERC's order 719
requires that ISOs and RTOs create a level playing field in AS markets; however, this may not always be
possible (FERC, 2008). Potential inhibitors include but are not limited to:
Loads cannot be aggregated to provide AS;
Aggregation rules are somewhat arbitrary and slow to adoption;
Operational systems at ISOs are not upgraded for different resources to participate and there is
reluctance to carry out the needed upgrades;
ISO rules limiting each load to being associated with a single curtailment service provider make
it difficult for a new entrant to aggregate multiple loads to provide an ancillary service, creating
an effective barrier to new entrants;
State regulatory commissions often require separate registrations due to the layered rules, and
in some cases have blocked DR participation both at the individual and aggregated level, and;
Different building codes and standards suggested by various organizations such as ASHRAE can
impact the deployment because building codes may cause limitations on load curtailments and
curtailment durations.
At the retail level, load serving entities (LSE) are rate regulated, thus they are unable to offer a rate,
program, or service without first gaining approval from their applicable regulatory authority. As such,
getting these types of AS programs into a tariff structure requires navigating a stakeholder process
where various parties are able to raise concerns that may outright limit the opportunity to offer such

21
programs (if the utility is not directed by its regulator to offer them). Additionally, the regulatory process
may limit the designs of such programs to address these stakeholder concerns, which may limit their
effectiveness and/or marketability.
The ISO markets were designed for generators to sell the needed AS to bolster the reliability of the
system. Minimum sizes in some markets have been established at 1 MW for participation, which is a
barrier to small commercial and residential participants if aggregation is not permitted. Furthermore,
large commercial or industrial users may prefer to bid directly in the market instead of commissioning
with an aggregator. Typically, aggregation is required to come from the same curtailment service
provider (CSP) and LSE, be served from a specific geographic area, and only deliver a single service.
Among the mass market participants, there was a perception that energy efficiency standards may be
competing with the load for AS, especially in the context of water heaters. The concern was targeted to
energy efficiency standards that focus exclusively on the end-use devices and do not reflect larger
power system efficiencies that are realized when loads provide AS. Support for technology
development and guides for end-use operations should be encouraged to address this concern. In
addition, studies that evaluate national standards’ impact on power system benefits are needed.
4.2.2 Compensation and value of service. The potential of utilizing load for AS is being examined by a number of entities. However, a potential
and persistent revenue stream must be available for industry to move forward with development.
Concerns exist over the available market share, treatment of loads, and availability of the load or load
fatigue resulting from frequent use. The logistics of valuing load participation have not been
established. As an example, markets that define regulation or spinning reserve as 5- or 10-minute
services do not reward loads or generators that are able to respond faster. FERC Order 755 addresses
the need to value speed and accuracy of response for regulation and this may help DR providers. If
appliances are adapted with DR capability, there is the question of who will pay for the additional cost,
and there must be a clear value proposition for consumers (i.e., consumers likely will not care about grid
optimization, DR, or AS). Customers may not be willing to pay for a more expensive DR- capable
appliance without receiving a financial benefit. Appliances with DR capability could be offered at a
lower price with manufacturer compensation from the electric power sector. Alternatively, the
appliance could get an EnergyStar rating and thus be eligible for local rebates. As appliances typically
last for 15-20 years, an initial investment in changing standards can result in long lived benefits. There is
an informational gap on how AS by loads will impact power markets. For example, AS may require
different value structures if provided by load.
5. Opportunities The workshop discussions and presentations recognized a number of opportunities for the DOE to
enable load participation in ancillary services. Opportunities include providing policy makers and other
stakeholders accurate information through modeling, analysis, and data collection; supporting
technology research and development to increase capabilities and reduce costs; empowering retail
customers to manage their energy costs and set performance goals; and evaluating portfolio solutions

22
that meet national energy objectives. Although making a comprehensive assessment of all
opportunities and prioritizing them is beyond the scope of this report, the following summarizes the
opportunities that were raised by the workshop participants. These opportunities have been grouped
into six categories: enabling customers, sharing information and best practices, contributing to codes
and standards, assessing the resource potential and collecting data, modeling and simulation, and
conducting technology research and development.
5.1 Enabling Customers Retail customers are the fundamental suppliers of DR, but DR is not their primary business. To expand
the participation of load in AS, there needs to be efforts to educate customers about the value of DR
and their opportunities to sell ancillary services and to provide them the necessary tools to evaluate this
value proposition. As an example, improved industrial assessment tools could allow plant managers to
examine integrated opportunities to reduce energy costs through a combination of DR and energy
efficiency while maintaining or even improving productivity. Multiple entities, including aggregators,
may serve as educational resources.
5.2 Sharing Information and Best Practices Increased access to information and best practices could support decision-makers. There are a number
of pilot programs and demonstration projects across the country. Widely distributing the results of
these activities could minimize duplicative efforts and allow different organizations to build upon each
other’s successes and setbacks. Retail customers could learn about potential opportunities to reduce
energy costs through the provision of AS. System operators’ favorable experience with one type of load
providing AS may encourage them to allow other loads to also provide AS. Regulators could see
approaches taken and proposals made in various regions, as there may be multiple ways to balance the
need for market access with priorities like protection of retail customers. Lastly, assembling a list of
barriers to market entry from the perspective of DR providers could help market designers focus on
eliminating those barriers in future designs through technology neutral AS definitions.
5.3 Contributing to Codes and Standards Codes and standards help ensure that products and processes meet certain performance and safety
requirements. Codes set the requirements, and standards direct the implementation of those requirements.
There are instances in which the primary drivers of codes and standards conflict with other societal benefits.
Participants identified a number of areas of needed investigation. These include temporary relaxation of
ASHRAE comfort standards for short DR curtailments, coordination between end-use appliance and equipment
energy efficiency standards and DR capability, and the Association of Home Appliance Manufacturers (AHAM)
proposal to incorporate EnergyStar credit for DR capable appliances (AHAM, 2011).
5.4 Assessing the Resource and Collecting Data There are many examples of loads well-matched to providing reliability services to the grid. However, a
comprehensive assessment is not available. There is limited information regarding end-use equipment
impacts of providing those services (e.g., service life, maintenance, and energy efficiency); customer
requirements and managing the load’s response while abiding by their operating parameters, and
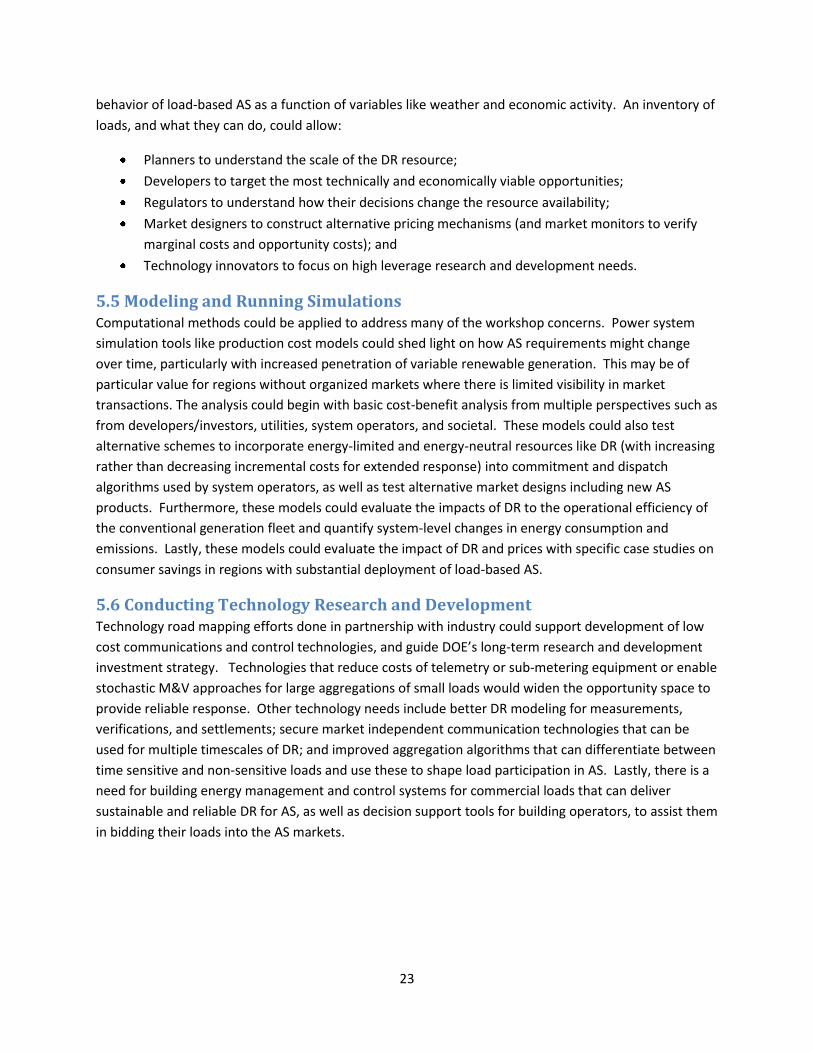
23
behavior of load-based AS as a function of variables like weather and economic activity. An inventory of
loads, and what they can do, could allow:
Planners to understand the scale of the DR resource;
Developers to target the most technically and economically viable opportunities;
Regulators to understand how their decisions change the resource availability;
Market designers to construct alternative pricing mechanisms (and market monitors to verify
marginal costs and opportunity costs); and
Technology innovators to focus on high leverage research and development needs.
5.5 Modeling and Running Simulations Computational methods could be applied to address many of the workshop concerns. Power system
simulation tools like production cost models could shed light on how AS requirements might change
over time, particularly with increased penetration of variable renewable generation. This may be of
particular value for regions without organized markets where there is limited visibility in market
transactions. The analysis could begin with basic cost-benefit analysis from multiple perspectives such as
from developers/investors, utilities, system operators, and societal. These models could also test
alternative schemes to incorporate energy-limited and energy-neutral resources like DR (with increasing
rather than decreasing incremental costs for extended response) into commitment and dispatch
algorithms used by system operators, as well as test alternative market designs including new AS
products. Furthermore, these models could evaluate the impacts of DR to the operational efficiency of
the conventional generation fleet and quantify system-level changes in energy consumption and
emissions. Lastly, these models could evaluate the impact of DR and prices with specific case studies on
consumer savings in regions with substantial deployment of load-based AS.
5.6 Conducting Technology Research and Development Technology road mapping efforts done in partnership with industry could support development of low
cost communications and control technologies, and guide DOE’s long-term research and development
investment strategy. Technologies that reduce costs of telemetry or sub-metering equipment or enable
stochastic M&V approaches for large aggregations of small loads would widen the opportunity space to
provide reliable response. Other technology needs include better DR modeling for measurements,
verifications, and settlements; secure market independent communication technologies that can be
used for multiple timescales of DR; and improved aggregation algorithms that can differentiate between
time sensitive and non-sensitive loads and use these to shape load participation in AS. Lastly, there is a
need for building energy management and control systems for commercial loads that can deliver
sustainable and reliable DR for AS, as well as decision support tools for building operators, to assist them
in bidding their loads into the AS markets.

24
References AHAM (2011). AHAM AND EFFICIENCY ORGANIZATIONS SEEK RECOGNITION OF BENEFITS OF SMART
APPLIANCES FROM ENERGY STAR: http://www.aham.org/ht/a/GetDocumentAction/i/51598. Cappers, P., Mills, A., Goldman, C., Wiser, R. and Eto, J. H. (2011). Mass market demand response and
variable generation integration issues: A scoping study. Lawrence Berkeley National Laboratory, Berkeley, CA. October, 2011. 76 pages. LBNL-5063E.
Bialek, J.W (2007). Why has it happened again? Comparison between the UCTE blackout in 2006 and the blackouts of 2003. IEEE Power Tech, July 1st - 5th, Lausanne, Switzerland. http://ieeexplore.ieee.org/xpls/abs_all.jsp?arnumber=4538291
DOE (2011). Analytic Challenges to Grid-Scale Energy Storage: Workshop Report. Washington, D.C. November 2011.
DSIRE (2011). Renewable Portfolio Standard Policies Summary Map. retrieved November 21, 2011, http://www.dsireusa.org/summarymaps/index.cfm?ee=1&RE=1
Dizy, R. (2011). Presentation to DOE Workshop October 25-26, 2011. Presented at 2011 Department of Energy Load Participation in Ancillary Services Workshop, Washington, D.C. October 2011.
Doherty, R. and O’Malley, M.J., (2005a). A New approach to quantify reserve demand in systems with significant installed wind capacity. IEEE Transactions on Power Systems, Vol. 20, pp. 587 -595.
Doherty, R., Lalor, G. and O’Malley, M.J., (2005b). “Frequency Control in Competitive Electricity Market Dispatch”, IEEE Transactions on Power Systems”, Vol. 20, pp. 1588 - 1596, 2005.
Eto, J. H., Nelson-Hoffman, J., Torres, C., Hirth, S., Yinger, B., Kueck, J., Kirby, B., Bernier, C., Wright, R., Barat, A. and Watson, D. S. (2007). Demand Response Spinning Reserve Demonstration. Lawrence Berkeley National Laboratory, Berkeley, CA. Prepared for Energy Systems Integration, Public Interest Energy Research Program, California Energy Commission. May, 2007. 64 pages. LBNL-62761.
FERC (2011a). 2010 Assessment of Demand Response & Advanced Metering: Staff Report. Federal Energy Regulatory Commission, Washington, D.C. February, 2011. 117 pages.
FERC (2011b) Order 755, Frequency Regulation Compensation in Organized Wholesale Power Markets, Federal Energy Regulatory Commission, Washington, D.C., October 2011
FERC (2008). 2008 Order 719, Wholesale Competition in Regions with Organized Electric Markets. Federal Energy Regulatory Commission, Washington, D.C. October 2008
FERC (2007). 2007 Order 890, Preventing Undue Discrimination and Preference in Transmission Service. Federal Energy Regulatory Commission, Washington, D.C. February 2007
Goldman, C., Reid, M., Levy, R., and Silverstein, A. (2010). Coordination of Energy Efficiency and Demand Response, LBNL-3044E, Ernest Orlando Lawrence Berkeley National Laboratory, January 2010. http://eetd.lbl.gov/ea/ems/reports/lbnl-3044e.pdf
KEMA (2010). Demand Response Reserve Pilot Evaluation: Final Report. KEMA. Prepared for ISO New England. November, 2010. 112 pages.
Kiliccote, S. (2011). Load Participating in Ancillary Services Workshop - Large Customers (DR Sellers). Presented at 2011 Department of Energy Load Participation in Ancillary Services Workshop, Washington, D.C. October 2011.
Kirby, B. (2007). Load Response Fundamentally Matches Power System Reliability Requirements. Presented at IEEE Power Engineering Society General Meeting, Tampa, FL. June 2007.
Kirby, B. (2006). Demand Response For Power System Reliability: FAQ, ORNL/TM 2006/565, Oak Ridge National Laboratory, December 2006
Lowell, J. and Yoshimura, H. (2011). ISO New England - Results of Ancillary Service Pilot Programs. Presented at 2011 Department of Energy Load Participation in Ancillary Services Workshop, Washington, D.C. November 2011.

25
NERC (2010). Special Report: Flexibility Requirements and Potential Metrics for Variable Generation, Implications for System Planning Studies. North American Electric Reliability Corporation, Princeton, NJ, USA. http://www.nerc.com/docs/pc/ivgtf/IVGTF_Task_1_4_Final.pdf,
Patterson, M. (2011). Demand Response in the ERCOT Markets. Presented at 2011 Department of Energy Load Participation in Ancillary Services Workshop, Washington, D.C. November 2011.
Pietch, P. (2011) Demand Response & Smart Grid—State Legislative and Regulatory Policy Action Review: May 2010 – June 2011: An Overview, Association for Demand Response and Smart Grid, June 2011.
Todd, D. (2011). Alcoa - Dynamic Demand Response DOE Workshop - 10/25-10/26. Presented at 2011 Department of Energy Load Participation in Ancillary Services Workshop, Washington, D.C. October 2011.
WECC (2011a) WECC Field Trial of the Balancing Authority ACE Limit Under NERC Project 2007-18 Reliability-Based Control. Western Electricity Coordinating Council Performance Work Group, March 2011.
WECC (2011b). WECC-0083 BAL-002-WECC-1 Meeting Webpage. retrieved December 15, 2011, http://www.wecc.biz/Standards/Development/WECC-0083/WECC-0083%20BAL-002-WECC-1%201-4-2012/default.aspx
Wiser, R and Barbose, G. (2011). The State of the States: Update on the Implementation of U.S. Renewable Portfolio Standards. Lawrence Berkeley National Laboratory. October, 2011.

26
Appendix
A. Workshop Participants
A.1 Attendees Mike Hyland American Public Power Association
Victor Zavala Argonne National Laboratory
Chellury (Ram) Sastry Battelle
Jim McIntosh California ISO
Chris Thomas Citizens Utility Board
Lawrence Kotewa CNT Energy
Raymond Berkebile Comverge
Tim Mount Cornell University
Dan Delurey Demand Response and Smart Grid Coalition
Sam Baldwin Department of Energy (EERE)
Charlton Clark Department of Energy (EERE)
Becca Smith Department of Energy (EERE)
Amitai Bin-Nun Department of Energy (EERE / AAAS)
Mark Philbrick Department of Energy (EERE / AAAS)
Paul Bakke Department of Energy (EERE Golden Field Office)
Phil Overholt Department of Energy (OE)
Dan Cleverdon District of Columbia Public Service Commission
Don Tench Don Tench Energy Consultants
Angela Chuang Electric Power Research Institute
Nancy Riley EnerNOC
Stacy Angel Environmental Protection Agency
David Kathan Federal Energy Regulatory Commission
Shiv Mani Federal Energy Regulatory Commission
Mary Beth Tighe Federal Energy Regulatory Commission
David Najewicz General Electric
Mark Levi General Services Administration
Ed Koch Honeywell
Steve Gabel Honeywell Laboratories
Jamie Link Independent
April Paronish Indiana Office of Utility Consumer Counselor
John Ruiz Johnson Controls
Pete Cappers Lawrence Berkeley National Laboratory
Mike Barber Midwest ISO
Dave Corbus National Renewable Energy Laboratory
Monisha Shah National Renewable Energy Laboratory
Dan Steinberg National Renewable Energy Laboratory
Dave Mohre National Rural Electric Cooperative Association
Donna Pratt New York ISO

27
Clyde Melton North American Electric Reliability Corporation
Ken Corum Northwest Power and Conservation Council
Paul Centolella Ohio Public Utility Commission
Robert Anderson Olivine
Beth Reid Olivine
Jeff Dagle Pacific Northwest National Laboratory
Scott Baker PJM Interconnection
Dave Souder PJM Interconnection
Ralph DeGeeter Public Service Commission of Maryland
Ed DeMeo Renewable Energy Consulting Services
Vipin Gupta Sandia National Laboratory
Paul Hamilton Schneider Electric
Yan Lu Siemens Corporate Research
Philip Hanser The Brattle Group
A.2 Speakers and Presenters DeWayne Todd Alcoa
Mark Petri Argonne National Laboratory
Scott Simms Bonneville Power Administration
Wendell Miyaji Comverge
Lauren Azar Department of Energy
Mike Davis Department of Energy (EERE)
Mark Patterson Electric Reliability Council of Texas
Ron Dizy ENBALA Power Networks
Aaron Breidenbaugh EnerNOC
Paul Feldman Independent Energy Participant
Jonathan Lowell ISO New England
Henry Yoshimura ISO New England
Sila Kiliccote Lawrence Berkeley National Laboratory
Terry Boston PJM Interconnection
Don Kujawski PJM Interconnection
Rob Pratt Pacific Northwest National Laboratory
A.3 Facilitators Mike Hogan Regulatory Assistance Project
Rich Sedano (Lead) Regulatory Assistance Project
Tim Woolf Synapse Energy Economics
A.4 Note Takers Youngsun Baek Oak Ridge National Laboratory
Joe Gracia Oak Ridge National Laboratory
Omer Onar Oak Ridge National Laboratory

28
A.5 Planning Team Carla Frisch Department of Energy (EERE)
Ookie Ma Department of Energy (EERE)
Dan Ton Department of Energy (OE)
Kerry Cheung Department of Energy (OE / AAAS)
Paul Wang E2RG Consulting
Brendan Kirby Independent
Julia Downing SRA International
Mark O'Malley University College Dublin
PIX 12868