Embed Size (px)
Citation preview
LOAD FLOW STUDIES ON STAND ALONE MICROGRID SYSTEM IN
RANAU, SABAH
LUCIAN ZARATANG
A project report submitted in partial
Fulfillment of the requirement for the award of the
Degree of Master of Electrical & Electronic Engineering
Faculty of Electrical & Electronic Engineering
Universiti Tun Hussien Onn Malaysia
JANUARI 2013

v
ABSTRACT
This paper presents the power flow or load flow analysis of Ranau microgrid, a
standalone microgrid in the district of Ranau,West Coast Division of Sabah. Power
flow for IEEE 9 bus also performed and analyzed. Power flow is define as an
important tool involving numerical analysis applied to power system. Power flow
uses simplified notation such as one line diagram and per-unit system focusing on
voltages, voltage angles, real power and reactive power. To achieved that purpose,
this research is done by analyzing the power flow analysis and calculation of all the
elements in the microgrid such as generators, buses, loads, transformers,
transmission lines using the Power Factory DIGSilent 14 software to calculate the
power flow. After the analysis and calculations, the results were analysed and
compared.
vi
ABSTRAK
Kajian ini mengenai laluan kuasa atau laluan beban yang dijalankan ke atas grid
mikro Ranau. Grid mikro Ranau terletak di daerah Ranau, Pantai Barat Sabah.
Laluan kuasa bagi system IEEE 9 bas juga dijalankan dan di analisis. Laluan arus
adalah alat penting yang melibatkan analisis bernombor yang dilakukan ke atas
mana-mana sistem kuasa. Laluan kuasa melibatkan gambarajah segaris dan sistem
per unit(p.u). Ia memfokuskan kepada voltan, sudut voltan, kuasa sebenar (P) dan
kuasa reaktif (Q). Untuk mencapai analisis laluan kuasa yang jitu, analisis dilakukan
terhadap mana-mana sistem kuasa dan pengiraan secara numerikal semua elemen-
elemen yang terdapat di dalam sistem kuasa tersebut. Elemen-elemen tersebut adalah
penjana, bas, beban, pengubah, talian penghantaran menggunakan software Power
Factory DIGSilent 14. Selepas analisis dan pengiraan-pengiraan yang berkaitan,
keputusannya di analisis dan dibandingkan antara kedua-dua sistem terlibat.

vii
CONTENTS
THESIS STATUS APPROVAL
TITLE
DECLARATION
DEDICATION
ACKNOWLEDGEMENT
ABSTRACT
ABSTRAK
CONTENTS
LIST OF TABLES
LIST OF FIGURES
i
ii
iii
iv
v
vi
vii
x
xi
CHAPTER 1 INTRODUCTION
1.1 Project background
1.2 Problem statement
1.3 Project objectives
1.4 Project scopes
1.5 Thesis outline
1.6 Summary
1
1
6
8
8
9
11
viii
CHAPTER 2 LITERATURE REVIEW
2.1 Theories – Microgrid
2.1.1 Voltage Profiling
2.1.2 Fault Analysis
2.1.3 Reactive Power
2.1.4 Real Power
2.2 Power Flow
2.2.1 Power Flow Study Steps
2.2.2 Load Flow Solution
2.2.3 Bus Classifications
2.2.4 Load Bus (P-Q Bus)
2.2.5 Solutions Methods
2.3 Description of Previous Methods
2.3.1 The Newton-Raphson Methods
2.3.2 Newton Trust Region Methods
2.4 DIGSILENT Power Factory 14.0
2.5 Chapter’s Summary
12
12
14
14
15
16
16
17
18
18
19
19
20
20
22
23
25
CHAPTER 3 METHODOLOGY
3.1 Project Methodology
3.2 Expected Results
3.3 Project Planning
3.4 Summary
26
26
32
32
34
CHAPTER 4
RESULT AND ANALYSIS
4.1 Ranau Power System Background
4.2 IEEE9 bus systems
4.3 Ranau Microgrid systems
4.4 Total System Summary for IEEE9 systems
4.5 Total System Summary for Ranau Microgrid
Systems
4.6 IEEE 9 bus system analysis
4.7 Ranau microgrod system analysis
4.8 IEEE9 bus total system summary
4.9 Ranau microgrid total system summary
35
35
37
44
49
51
54
55
55
56
ix
4.10 IEEE9 system analysis for each bus
4.11 Generator data analysis in IEEE9 system
4.12 Analysis of each bus in Ranau microgrid
4.13 Generator data analysis in Ranau microgrid
4.14 Spinning reserve and reliability
4.15 Grid Losses
4.16 Transformer Current Loading
4.17 Transmission Lines Current Loading
4.18 Transmission Lines Performance
4.19 Regulation and Efficiency of a Transmission
Lines
56
67
68
75
78
80
81
83
85
86
CHAPTER 5 DISCUSSION, CONCLUSION AND
RECOMMENDATION
5.1 Discussion
5.1.1 Ranau microgrid in the future
5.2 Conclusion
5.3 Recommendation
87
87
87
88
89
REFERENCES
LIST OF PUBLICATIONS
90
92
x
LIST OF TABLES
3.1 Gantt chart of the work progress in forth semester (March –
July 2012)
33
3.2 Table 3.2: Gant Chart of the work progress for the second
semester (September 2012 – January 2013)
33
4.1 Operating Load Data 39
4.2 Generator Data 40
4.3 Branch data for IEEE 9 bus 42
4.4 Updated branch data for IEEE 9 bus 43
4.5 Load data for IEEE 9 bus system 43
4.6 Branch data for Ranau Microgrid 45
4.7 Branch data for Ranau Microgrid 46
4.8 Branch data for Ranau Microgrid 46
4.9 Load data for Ranau Microgrid 46
4.10 Generator data for IEEE9 system 67
4.11 Generator data for Ranau Microgrid 76
4.12 Example of Load Demand and spinning reserve requirement. 79
4.13 Spinning reserves for IEEE 9 bus and Ranau microgrid 79
4.14 Grid Losses and ratio for IEEE 9 bus and Ranau microgrid 80
4.15 Current loading for transformer in IEEE9 system 82
4.16 Current loading for transformer in Ranau microgrid 82
4.17 Current loading for transmission lines in IEEE9 system 83
4.18 Current loading for transmission lines in Ranau microgrid 84
xi
LIST OF FIGURES
1.1 Ranau, Sabah 1
1.2 Location of Ranau, Sabah 2
1.3 Sabah Grid Interconnection 4
1.4 Ranau Micro Grid Connection Diagram 5
1.5 Model of Main Grid and Micro Grid 7
2.1 Microgrid basic system topology. 12
2.2 Real, Reactive and Complex Power 16
2.3 The Newton-Raphson Method 21
3.1 SSU Ranau 11 kV 27
3.2 Kibbas Feeder 28
3.3 Golf Feeder 28
3.4 Kilimu Feeder 28
3.5 Randagong Feeder 28
3.6 Lohan Feeder 29
3.7 Generator G12 and G11 (G11 out of service) 29
3.8 Generator G8 30
3.9 Generator G8 (side view) 30
3.10 Generator G16 and transformer T3 31
3.11 A diesel tanker supplying diesel to diesel storage unit 32
4.1 Locations of District of Ranau, Sabah
Microgrid with various DER (Distributed Energy Resources).
Energy sources: Diesel Generators
35
4.2 IEEE 9 bus system 37
4.3 Ranau microrid single line diagram 38
4.4 IEEE 9 bus system data 42
xii
4.5 Graph of Load data(P) for IEEE 9 bus system 44
4.6 IEEE 9 bus system load flow results 44
4.7 Ranau microgrid load flow results 45
4.8 IEEE 9 bus, Bus 1 load flow results 47
4.9 IEEE 9 bus, Bus 2 load flow results 48
4.10 IEEE 9 bus system load flow results 54
4.11 Ranau microgrid load flow results 55
4.12 IEEE 9 bus, Bus 1 load flow results 57
4.13 IEEE 9 bus, Bus 2 load flow results 58
4.14 IEEE 9 bus, Bus 3 load flow results 59
4.15 IEEE 9 bus, Bus 4 load flow results 60
4.16 IEEE 9 bus, Bus 5 load flow results 61
4.17 IEEE 9 bus, Bus 6 load flow results 62
4.18 IEEE 9 bus, Bus 7 load flow results 63
4.19 IEEE 9 bus, Bus 8 load flow results 65
4.20 IEEE 9 bus, Bus 9 load flow results 66
4.21 Ranau microgrid Bus 1 load flow results 68
4.22 Ranau microgrid Bus 2 load flow results 69
4.23 Ranau microgrid Bus 3 load flow results 71
4.24 Ranau microgrid Bus 4 load flow results 72
4.25 Ranau microgrid Bus 5 load flow results 74
4.26 Ranau microgrid Bus 6 load flow results 74
4.27 Ranau microgrid Bus 7 load flow results 75
4.28 Graph of generator real power data (P) for Ranau Microgrid 77
4.29 Graph of generator reactive power data (Q) for Ranau
Microgrid
78
4.30 Graph of ratio of spinning reserves/Installed Capacity for
IEEE 9 bus and Ranau microgrid
79
4.31 Graph of Grid Losses for IEEE 9 bus and Ranau microgrid 81
4.32 Ratio of Grid Losses/Installed Capacity for IEEE 9 bus and
Ranau microgrid
81
4.33 Graph of current loading for transformer in IEEE9 system 83
4.34 Graph of current loading for transformer in IEEE9 system 83

xiii
4.35 Graph of current loading for transformer in IEEE9 system 84
4.36 Graph of current loading for transmission lines in Ranau
microgrid.
84
1
CHAPTER 1
INTRODUCTION
1.1 Project background
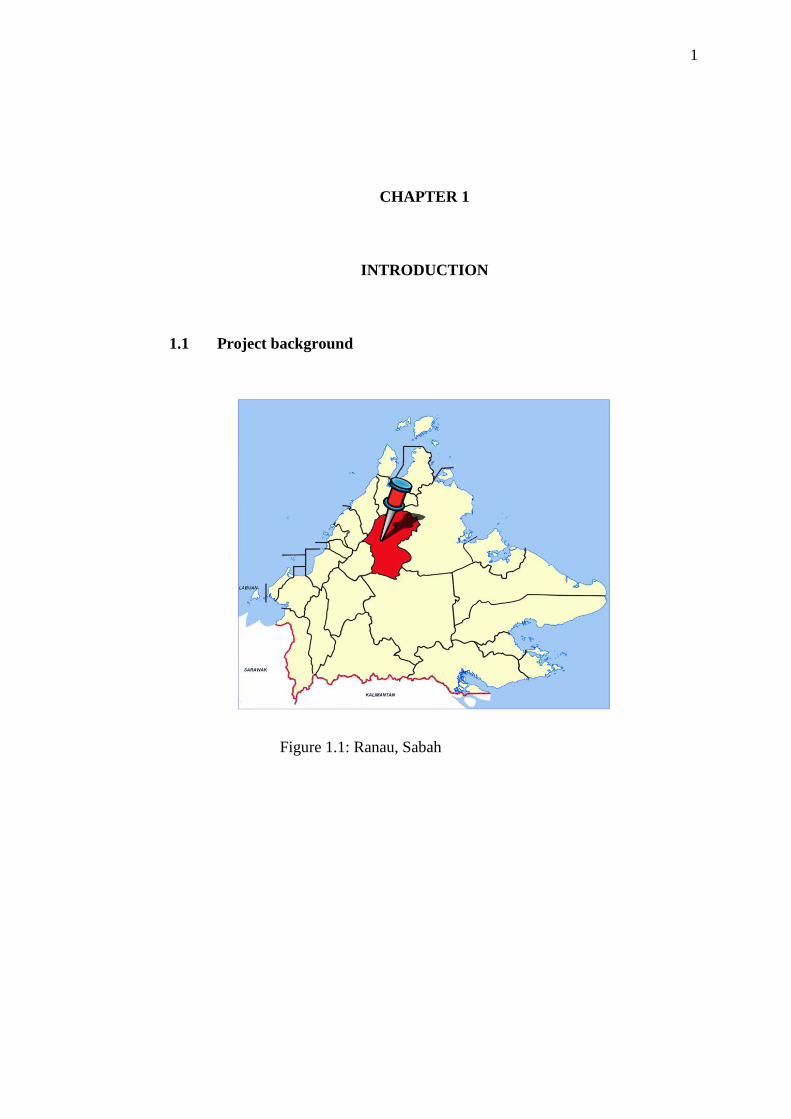
Figure 1.1: Ranau, Sabah
1
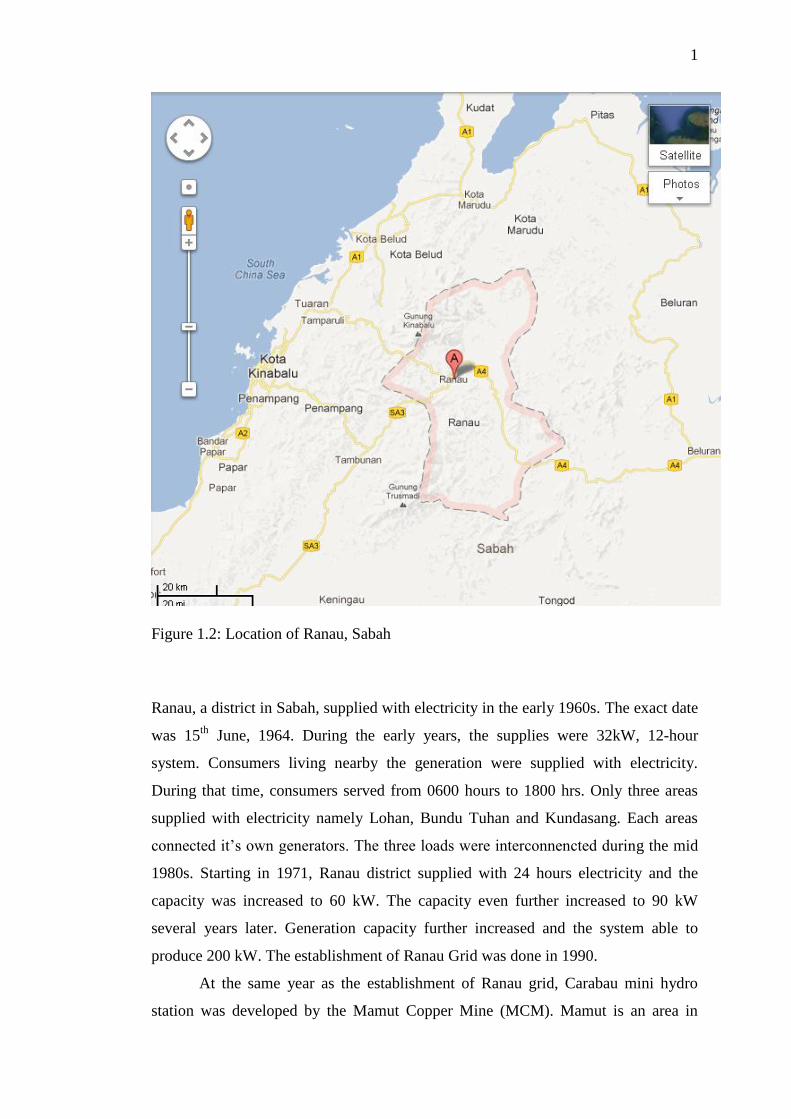
Figure 1.2: Location of Ranau, Sabah
Ranau, a district in Sabah, supplied with electricity in the early 1960s. The exact date
was 15th
June, 1964. During the early years, the supplies were 32kW, 12-hour
system. Consumers living nearby the generation were supplied with electricity.
During that time, consumers served from 0600 hours to 1800 hrs. Only three areas
supplied with electricity namely Lohan, Bundu Tuhan and Kundasang. Each areas
connected it’s own generators. The three loads were interconnencted during the mid
1980s. Starting in 1971, Ranau district supplied with 24 hours electricity and the
capacity was increased to 60 kW. The capacity even further increased to 90 kW
several years later. Generation capacity further increased and the system able to
produce 200 kW. The establishment of Ranau Grid was done in 1990.
At the same year as the establishment of Ranau grid, Carabau mini hydro
station was developed by the Mamut Copper Mine (MCM). Mamut is an area in
2
Ranau which was Sabah largest producer of copper before the mineral finally runs
out. The Carabau hydroelectric commenced into operation in June 15th
, 1991. The
pond located at Kg. Bambangan. The other pone located at Kg. Kimolohing and
known as the ―Head Pond‖. The installed capacity for this hydroelectric is 1000 kW.
In 1996, Naradau mini hydroelectric was built with two dam. They are located at
Mesilau river and Liwagu river.
At September 1st, 1998, Lembaga Lektrik Sabah (LLS) was privatised and
taken over by Sabah Electricity Sendirian Berhad (SESB). At that time, SESB was
100 percent under Tenaga Nasional Berhad (TNB). The privatisation were
commenced in August, 18th
1998. The major objective of the privatisation is to
reduce to disruptions of power supplies commonly in the State of Sabah over three
decades of operations. Another objective is to solve the financial woes for the sector
of electrical generation in the state. As the result of the privatisation, the capacity of
the electrical generation was increased and the distribution also increased to fulfil the
increasing energy demand without burdening the state government. The government
in the other hand will have better financial capacity to support other sectors to
develop the state. The corporate mission for SESB is to supply continuous and
reliable electricity to consumers.
At present Ranau electricity system, the only area serviced with 12-hour
system is Matupang. At Paus village, infrastructures are currently developed to
supply the village with solar powered electricity. About 80 houses will benefit from
this solar powered generator.
In the Ranau district infrastructure masterplan, Rural Electrification
Programme (BELB - Bekalan Elektrik Luar Bandar) currently installing electricity
infrastructures at Melinsou, Segindai and Timbua area.
1.1.1 Brief History
Electricity started in Sabah as early as 1910 supplied by 3 separate organizations. In
1957 these three organizations combined to form North Borneo Electricity Board.
When North Borneo joined Malaysia in 1963 and changed its name to Sabah, this

3
entity was renamed Sabah Electricity Board. On 1st of September 1998 Sabah
Electricity Board was privatized and became Sabah Electricity Sdn. Bhd. (SESB).
1.1.2 About the Company
Sabah Electricity Sdn. Bhd. is an 80% owned subsidiary of Tenaga Nasional Berhad
(TNB) and 20% by the State Government of Sabah. It is a vertically integrated utility
providing reliable generation, transmission and distribution services in the state of
Sabah and the Federal Territory Labuan.
SESB is committed to developing the electricity infrastructure in the state of
Sabah and the Federal Territory Labuan including the implementation of the Rural
Electrification Program. SESB generates, transmits and distributes electricity. It is
the only power utility company in Sabah supplying electricity distributed over a wide
area of 74,000 sq.km. As of August 2011, a total of 456.406 of which 82.8% of the
customers are domestic customers contributing only 31.17% of the sale.
The SESB installed capacity (excluding IPP) of the Sabah Grid which
supplies electricity for major towns from Federal Territory Labuan to Tawau is 430.9
MW and the maximum demand is 830 MW (as of August 2011). The Sabah Grid is
made up of 66kV, 132kV and 275kV which links up all major towns in Sabah and
Federal Territory of Labuan. As of March 2011 the total length of transmission line
in Sabah is 3,263 km. The forecast demand growth of electricity is in a region of
7.7% per annum up to the year 2010. In order to support the growing demand,
various generation, transmission and distribution projects will be implemented.
This project started with characteristics of standalone Ranau microgrid
interconnected system, relative issues of Ranau microgrid. This project also
introduces the basic principle and basic structure of Ranau microgrid and to analyze
the power flow of a separate islanded mode high-voltage microgrid (MG) with
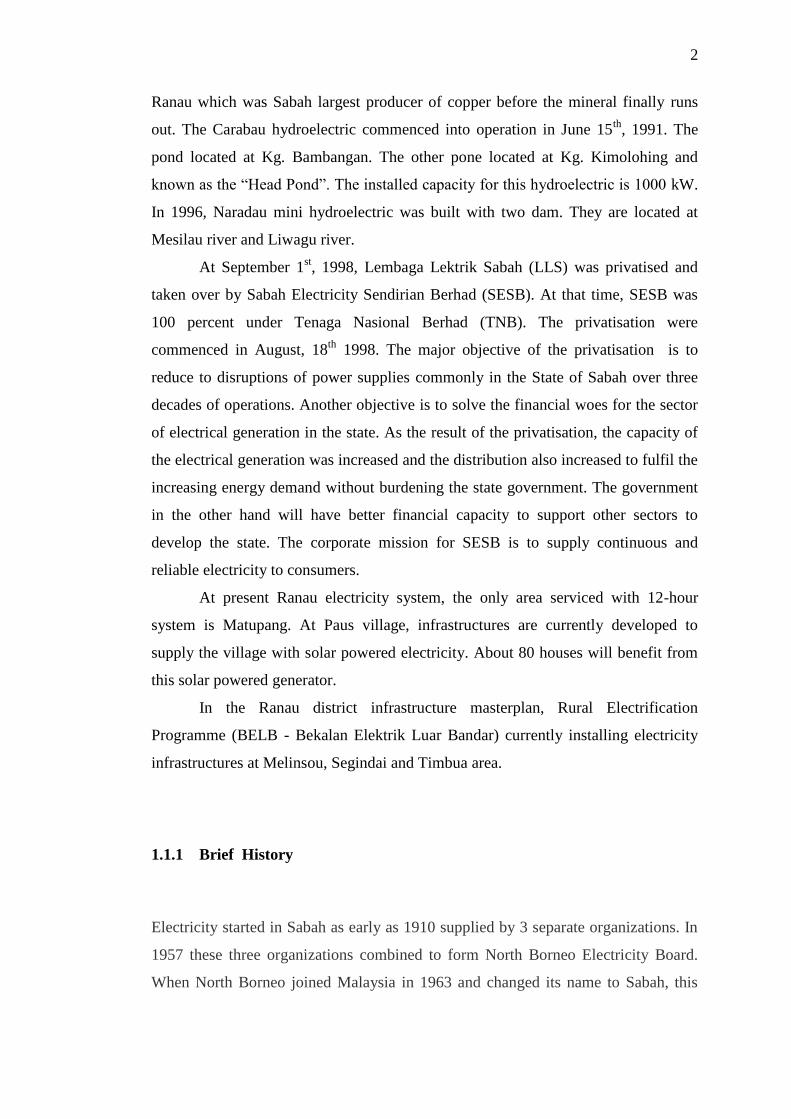
various distributed resources (DRs). Figure 1.1 shows the location of Ranau district,
SABAH. Figure 1.3 shows Sabah Grid Interconnection. Ranau microgrid are not
connected to Sabah grid. Ranau microgrid is only operated on islanded operation,
since several attempts to connect the microgrid to main power grid had failed. Grid-
connected operation are not available.
4
First, related papers and technological reports were extensively surveyed.
Accordingly, twelve different types of DRs and their controllable loads were
considered for integration into six primary feeders.
Figure 1.3: Sabah Grid Interconnection
5
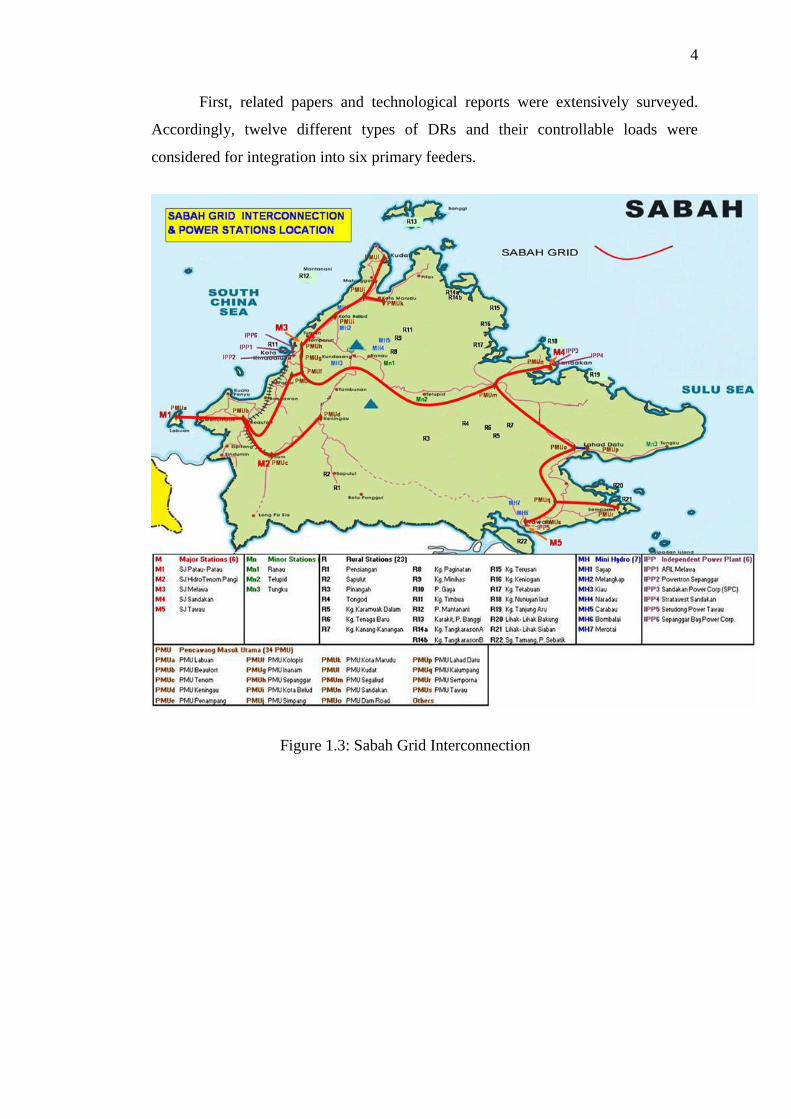
Figure 1.4: Ranau Micro Grid Connection Diagram

6
These DRs include four 1500 kW Cummins diesel engine generators, four
500 kW Cat diesel generators, two 1000 kW Cat diesel generators and two 1500 kW
and 950 kW hydroelectrics. However, not all the generators are available and ready
for generation. Some of the generators are under maintenance due to scheduled
preventive maintenance and corrective maintenance. Most of the generators also due
for servicing by clocking 500 hours of operation.
The Gen3 generator is currently under outage due to unusual noise detected.
Some of its parts particularly the fuel filter was disassembled and reassembled at
Gen8 generator. The Gen18 also not available for operation and was sent to Jayaland,
Keningau for maintenance. Gen19 generator is another generator under outage due to
lubricating oil leak and suffers compression leak.
Current running generator are also under quite bad conditions. Gen 8, Gen12,
Gen13 and Gen20 are suffering lubrication oil leakage. Gen8 and Gen13 are
currently due for major overhaul. Some of the generators which were put on standy
status are not 100 percent ready to operate. There are Gen7, Gen12 and Gen14.
These generators are with lubricating oil leakage and some of are due for major
overhaul maintenance.
As for the Naradau and Carabau hydroelectrics, they are fully dependent on
the weather conditions to generate electricity. Rainy season will increase the dam
capacity and the generation capacity will increased. Dry season will decrease the
dam capacity and the generation capacity will decreased. The installed capacity for
both hydroelectric are 3.72 MW but normally they will generates power of about 0.7
MW.
Simulations will be carried out using PowerFactory DIGSilent 14 tool, of
which the result presented the studies of capacity and power flow of microgrid.
Finally, the program was used to simulate and analyze the power flow of the MG for
one 24-hour period under the islanded operating mode. The outcomes of this paper
should prove helpful for distribution engineers to further understand the behaviors
and characteristics of 11 kV high-voltage Ranau microgrid. Enhancement of
understanding of this Ranau microgrid is important for planning future expansion of
power system as well as to determine the best operation of existing operating system.
1.2 Problem Statement
7
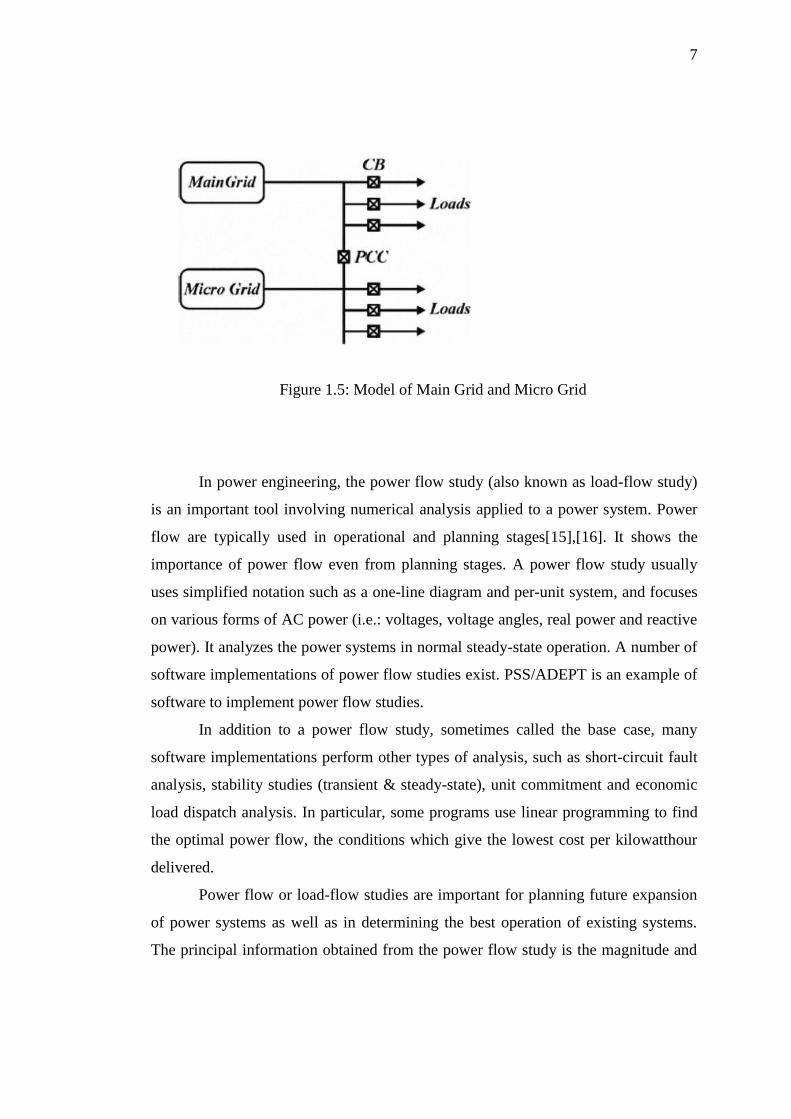
Figure 1.5: Model of Main Grid and Micro Grid
In power engineering, the power flow study (also known as load-flow study)
is an important tool involving numerical analysis applied to a power system. Power
flow are typically used in operational and planning stages[15],[16]. It shows the
importance of power flow even from planning stages. A power flow study usually
uses simplified notation such as a one-line diagram and per-unit system, and focuses
on various forms of AC power (i.e.: voltages, voltage angles, real power and reactive
power). It analyzes the power systems in normal steady-state operation. A number of
software implementations of power flow studies exist. PSS/ADEPT is an example of
software to implement power flow studies.
In addition to a power flow study, sometimes called the base case, many
software implementations perform other types of analysis, such as short-circuit fault
analysis, stability studies (transient & steady-state), unit commitment and economic
load dispatch analysis. In particular, some programs use linear programming to find
the optimal power flow, the conditions which give the lowest cost per kilowatthour
delivered.
Power flow or load-flow studies are important for planning future expansion
of power systems as well as in determining the best operation of existing systems.
The principal information obtained from the power flow study is the magnitude and

8
phase angle of the voltage at each bus, and the real and reactive power flowing in
each line.
Commercial power systems are usually too large to allow for hand solution of
the power flow. Special purpose network analyzers were built between 1929 and the
early 1960s to provide laboratory models of power systems; large-scale digital
computers replaced the analog methods.
As to the large scale microgrid interconnection, new problems as main power
grid plan and designation, dispatching and operation, protection and control will
emerge due to the influence of microgrid upon the steady-state power flow
distribution and the dynamic fault characteristics of the main power grid.[1]
This project will help the power engineers to have a deeper understanding on
this microgrid. Deeper understanding will pave the way for better grid operation. The
authors present the issues relating to the islanded operation of microgrid including
coordination of microsources and storage device to maintain the satisfactory
islanding operation of microgrid. This particular microgrid is only operated on
islanded operation, since several attempts to connect the microgrid to main power
grid had failed.
1.3 Project Objectives
The major objective of this research is to study the power flow of Ranau microgrid.
The other objectives are:
a) To analyze the voltage profiling of Ranau Microgrid under islanded mode of
operation.
b) To study the active power (KW) and reactive power (KVAR) of the microgrid.
c) To study the reliability of Ranau microgrid by using the spinning reserve
analysis.
1.4 Project Scopes
9
This project is primarily concerned with the islanded operation of the microgrid. The
scopes of this project are:
a) To analyze the power flow of Ranau microgrid into PowerFactory DIGSilent 14
software in islanded mode of operation, 11 kV only.
b) To analyze the voltage profiling of 11kV Ranau Microgrid of a separate islanded
mode only since for the time being this microgrid operates in islanded mode.
Several attempts to connect the microgrid to main power grid had failed.
1.5 Thesis outline
The written report was layout as follows:
1. Chapter 1 – Introduction
It briefly discussed on the importance of power flow analysis of a system. Power
flow or load flow is a tool to analyse a system or grid. Power flow analysis will study
the real power, reactive power, voltage, current loading, load analysis and voltage
angles. Power flow or load-flow studies are important for planning future expansion
of power systems as well as in determining the best operation of existing systems.
many software implementations perform other types of analysis, such as short-circuit
fault analysis, stability studies (transient & steady-state), unit commitment and
economic load dispatch analysis
2. Chapter 2 – Literature Review
This chapter reviewed on past researches which have significant contributions to this
study. Many software implementations perform other types of analysis, such as
short-circuit fault analysis, stability studies (transient & steady-state), unit
commitment and economic load dispatch analysis. Studies on microgrid topologies
10
also performed. Among others are DERs, loads, transmission lines, controls and
protections. The terms of voltage profiling and fault analysis also sufficiently
explored. Finally the description of previous methods in power flow explained
briefly. Among the methods are The Newton-Raphson method and Newton Trust
Region Method.
3. Chapter 3 – Methodology
Chapter 3 touched on the methodology of power flow analysis in achieving the
ultimate objective of this study which was power flow analysis. The methodology
was done accordingly by three phases, namely literature review on previous works,
Ranau microgrid data gathering and simulations and results analysis. Project
planning also included in Chapter 3.
4. Chapter 4 – Results
The findings of this study were presented under the Results section of Chapter 4.
This chapter not only showed the graphs and data tables, but brief comments were
also given upon the statistical simulation analysis. And on enhancing the results, they
were neatly organized under different system, first for the IEEE9 system and then
Ranau microgrid. Among the results are active power (P), reactive power (Q),
voltage angles, grid losses (MW), spinning reserves (MW), system reliability,
generation data, load data, installed capacity, current loading for transformer and
transmission lines as well as detailed every bus analysis.
5. Chapter 5 – Conclusion
Chapter 5 provided the conclusion of this study. After the lengthy studies and
simulations, we can conclude which system is better in term of reliability. We also
can compare both systems for capacity and power flow analysis as well as current
loading. It also brought up few potential further works that can be done in improving
the research area.

11
1.6 Summary
The objective of this chapter is to give the readers an understanding of the case
studies involves IEEE9 system and Ranau microgrid. Readers can assess the
performance and reliability of each system by reading the detailed analysis and
conclussions. It also points out the motivation behind the study, giving out its
objectives and scope of work before laying out the thesis outline.
12
CHAPTER 2
LITERATURE REVIEW
2.1 Theories - Microgrid
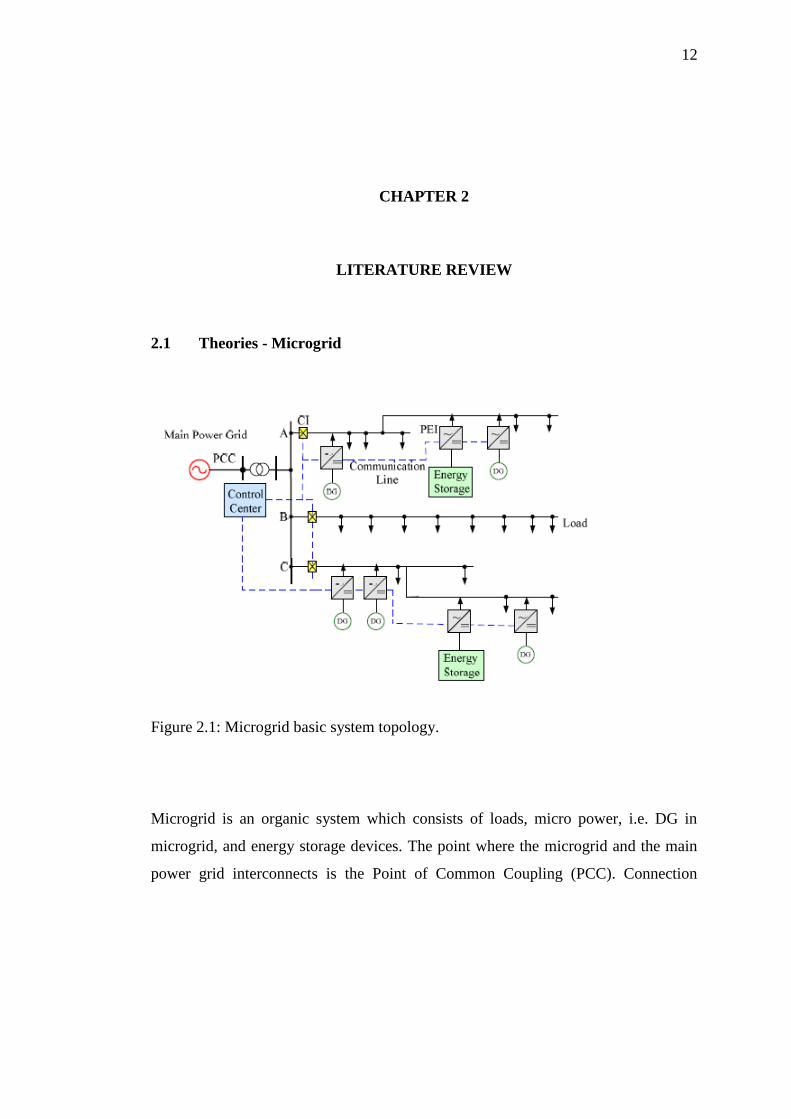
Figure 2.1: Microgrid basic system topology.
Microgrid is an organic system which consists of loads, micro power, i.e. DG in
microgrid, and energy storage devices. The point where the microgrid and the main
power grid interconnects is the Point of Common Coupling (PCC). Connection

13
Interface (CI) which is commonly configured by microgrid specific control switch is
arranged near PCC. Each unit is connected to the microgrid bus via the Power
Electronics Interface (PEI). Energy storage devices which can be battery,
supercapacitor, superconducting energy storage and flywheel will realize the power
balancing adjustment within the microgrid, reducing the influence of DG on the main
power grid significantly and enhancing the controllability of the power flow.
In a typical microgrid, the microsources may be rotating generators or
Distributed Energy Resources (DER) interfaced by power electronic inverters. The
installed DERs may be biomass, fuel cells, geothermal, solar, wind, steam or gas
turbines and reciprocation internal combustion engines. The overall efficiency may
be improved by using combined heat and power sources (CHP)[2].
Loads also can be various, mainly are impedance loads, motors and heat
loads. The connected loads may be critical or non-critical. Critical loads require
reliable source of energy and good power quality. These loads are supported by their
own microsources because they require an uninterrupted supply of energy.
Noncritical loads may be shed when required decided by the microgrid operating
policies. Since the power level of utility grid is higher than that of the microgrid, the
same is dominated mainly by the existing power grid. But the actual performance is
judged when the microgrid works in islanded mode[3].
Within the microgrid, control units are interconnected by communication line
which gathered at the control center to manage the optimal operation and the
coordinated control, dynamically matching the load demand and achieving the power
flow between the microgrid and the main power grid to be adjusted directionally and
quantitatively. It should be pointed out that not all the elements are necessary for the
microgrid, the possible combination depends upon the microgrid size and specific
requirements of local loads on microgrid. Figure 2.1 is a basic microgrid system
topology. Feeder lines in microgrid are usually radial distributed, and DGs are
connected through several points. Power exchange between the microgrid and the
main power grid is conducted via the connecting line. DGs within the microgrid and
the main power grid are interacted through the middle and low-voltage
transformation[1].
As an effective way to solve various problems in modem power systems,
micro grid is increasingly adopted in many developed countries. MGs have become a
14
new development trend in power systems nowadays. Microgrid can operate online,
but also according to the actual fault occurs which planning maintenance etc or run
independently.
Microgrid protection is considered one of the most important challenges
facing the implementation of microgrid. The brittleness of the stand-alone running
microgrid can be defined as natural disasters, strong external disturbance, system
components failure, recessive fault and power quality impact factors, etc.
To this extent, we study the steady-state characteristics of a high-voltage MG
with two different types of DRs, namely, diesel engine generators and hydroelectric
generators. This MG contain renewable and non-renewable DRs under islanded
operating mode, with the assumption that the system is three-phase balanced We
anticipate that the nature of the 11 kV high-voltage MG will be thoroughly
understood after detailed analysis of the power flow under the islanded operation
mode.
Renewable sources of energy such as hydroelectric in Ranau microgrid is
highly dependent on weather conditions and geographical factors. In their ntermittent
nature, hydroelectric are highly variable[4].
Consequently, the incorporation of DRs in this particular MG reduces total
power system loss because no transmission losses are incurred, and DRs usually
offer the advantages of low environmental effects and high efficiency. These can be
operated in grid-connected or islanding modes[5].
2.1.1 Voltage Profiling
During the grid connected mode, main system reactive power resources such as
generation units, switched shunt capacitors and long lines charging may contribute to
the reactive power support of the Micro Grid and help keep the Micro Grid voltage
profile within acceptable ranges. However, Micro Grid Voltage profile control within
an islanded Micro Grid is more critical due to the lack of reactive power support
from upstream main system[6].
2.1.2 Fault analysis
15
The fault analysis of a power system is required in order to provide information for
the selection of switchgear, setting of relays and stability of system operation. A
power system is not static but changes during operation (switching on or off of
generators and transmission lines) and during planning (addition of generators and
transmission lines). Thus fault studies need to be routinely performed by utility
engineers.
Faults usually occur in a power system due to either insulation failure,
flashover, physical damage or human error. These faults, may either be three phase
in nature involving all three phases in a symmetrical manner, or may be
asymmetrical where usually only one or two phases may be involved. Faults may
also be caused by either short-circuits to earth or between live conductors, or may be
caused by broken conductors in one or more phases. Sometimes simultaneous faults
may occur involving both short-circuit and broken conductor faults (also known as
open-circuit faults).
2.1.3 Reactive Power
Voltage 415 V and 11 kV are available on Ranau microgrid system. Reactive power
flow is needed in an alternating-current transmission system to support the transfer of
real power over the systems. In AC system, energy is stored temporarily in inductive
and capacitive elements. On the other hand, real power, P, is the energy to
accomplished desired work. Due to inductive and capacitive elements in the network,
a portion of power flow returned back to source. It is known as reactive power. It
transfers no energy, but have important function in electrical grids.
Reactive power increased as energy stored in capacitive or inductive
elements. It will influence the voltage level on the system. Voltage levels and rective
power should be carefully controlled to allow any system to operate within
acceptable limits.

16
Realpower (P)
Reactivepower (Q)
Complex power (S)
Figure 2.2: Real, Reactive and Complex Power
2.1.4 Real Power
Real power, measured in Watt, both the current and voltage reverse their polarity at
the same time. At any instant, the product of voltage and current is positive,
indicating that the direction of energy flow does not reverse. In this case, only real
power is transferred. Practical loads have resistance, inductance, and capacitance, so
both real and reactive power will flow to real loads. The actual amount of power
being used, or dissipated, in a circuit is called true power or real power.
Active power consumed in the systems, while reactive power moves from
load to source and vice versa, and it is not consumed in the system. If a system has
0.86 power factor then it means that it has 86% active power and 14% reactive
power. Engineers care about apparent power, because even though the current
associated with reactive power does no work at the load, it heats the wires, wasting
energy. Conductors, transformers and generators must be sized to carry the total
current, not just the current that does useful work.
2.2 Power Flow
Power flow analysis is fundamental to the study of power systems. In fact, power
flow forms the core of power system analysis. Load flow studies are carried out to
17
study any interconnected power system. Power flow study plays a key role in the
planning of additions or expansions to transmission and generation facilities. Power
flow analysis is at the heart of contingency analysis and the implementation of real-
time monitoring systems. For a given power network, with known complex power
loads and some set of specifications or restrictions on power generations and
voltages, solve for any unknown bus voltages and unspecified generation and finally
for the complex power flow in the network components.
Such studies facilitate us in determination of best size as well as the most
favourable location for the power capacitors for both power factor improvement and
also for raising the network voltages. The load flow studies also helps us in
determination of best location as well as optimal capacity of the proposed generating
stations, substations and new transmission lines. Thus load flow studies are very
important for planning existing system as well as its future expansion.
For optimized operation of an interconnected system, some informations such
as bus bar voltage levels, machine excitation, tap change and reactive compensation
are required which are provided by load flow studies. The main information obtained
from load flow studies comprises the magnitude and phase angles of bus voltages,
reactive powers of generator buses, active and reactive power flow in transmission
lines, other variable being specified.
For many years, load flow studies were carried out by means of special
purpose analogue computer, called the AC network analyser, but the advent of high
speed digital computers has tended to replace their use for a large system studies.
This change from AC network analyser to the digital computer has resulted in greater
flexibility, economy, accuracy and faster operation. However for system studies of a
more local character, the network analyser is still used, particularly in the initial
planning stages.
2.2.1 Power Flow Study Steps
These are the steps undertaken to study power flow in a system.

18
1. Determine element values for passive network components.
2. Determine locations and values of all complex power loads.
3. Determine generation specifications and constraints.
4. Develop a mathematical model describing power flow in the network.
5. Solve for the voltage profile of the network.
6. Solve for the power flows and losses in the network.
7. Check for constraint violations.
2.2.2 Load Flow Solution
There are four quantities of interest associated with each bus:
1. Real Power, P
2. Reactive Power, Q
3. Voltage Magnitude, V
4. Voltage Angle, δ
At every bus of the system, two of these four quantities will be specified and
the remaining two will be unknowns. Each of the system buses may be classified in
accordance with which of the two quantities are specified.
2.2.3 Bus Classifications
Slack Bus — The slack bus for the system is a single bus for which the voltage
magnitude and angle are specified.

19
The real and reactive power are unknowns.
The bus selected as the slack bus must have a source of both real
and reactive power, since the injected power at this bus must ―swing‖ to take up
the ―slack‖ in the solution.
The best choice for the slack bus (since, in most power systems, many buses have
real and reactive power sources) requires experience with the particular system
under study.
The behaviour of the solution is often influenced by the bus chosen.
2.2.4 Load Bus (P-Q Bus) :
A load bus is defined as any bus of the system for which the real and reactive power
are specified.
Load buses may contain generators with specified real and reactive power
outputs; however, it is often convenient to designate any bus with specified
injected complex power as a load bus.
Voltage Controlled Bus (P-V Bus) :
Any bus for which the voltage magnitude and the injected real power are
specified is classified as a voltage controlled (or P-V) bus.
The injected reactive power is a variable (with specified upper and lower
bounds) in the power flow analysis.
(A P-V bus must have a variable source of reactive power such as a
generator.)
2.2.5 Solution Methods
20
The solution of the simultaneous nonlinear power flow equations requires the use of
iterative techniques for even the simplest power systems. There are many methods
for solving nonlinear equations such as:
Gauss Seidel.
Newton Raphson.
Fast Decoupled.
The electrical power system is currently undergoing major changes. The
nonstop growing energy demand being fed by distributed generation (DG) units. This
in turn, increases the microgrid system modularity and expandability. Then, the need
for power flow analysis is essential. Among the purpose for power flow are
distribution automation, network optimization, Var planning and reliability
assessment. These purposes are to ensure better operated power system.
Power flow also will prove helpful in planning of Energy Management
System (EMS) and power sharing, and stability analysis. Many power flow solutions
and algorithms have been proposed since the early studies of power flow. Most of
them are classified as branch based methods [17],[18].
2.3 Description of previous methods
There are several methods available for power flow analysis. Among the are
Newton-Raphson method and New Trust Region Method.
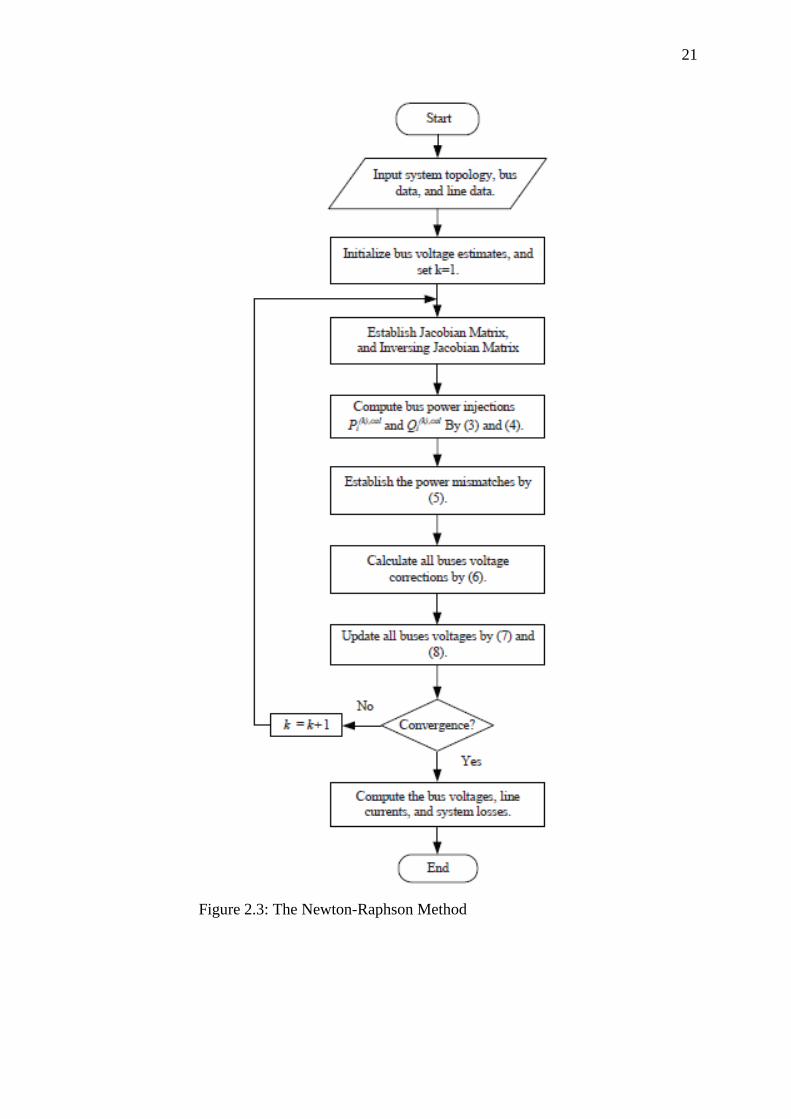
2.3.1 The Newton-Raphson method
The Newton-Raphson method is one of the most commonly used techniques for
solving nonlinear algebraic equations, and presents better convergence than does the
Gauss-Seidel method. Thus, it is popularly applied in power flow analysis. The
iteration numbers of the Newton-Raphson approach is independent of the scale of
system and can solve the problem through a few iterations[7]. However, its Jacobian
matrix requires recalculation and updating in each iterative step[8].
21
Figure 2.3: The Newton-Raphson Method

22
The loads and DRs are assumed to be equivalent injected powers in power
flow analysis. Newton-Raphson method was applied to solve the power flow of the
high-voltage microgrid. A 24-hour operating analysis was explored in detail in this
section, after rigorous engineering analyses and discussions on the voltage profiles,
line flow profiles, and system losses.
This method successfully analyse the voltage profiles, line flow profiles, and
system losses. This method shows the DRs integrated into the distribution network
are clearly helpful to the system voltage profiles. The DRs also proven to share load
demands and lessen the power supply requirement from the upstream utility grid.
system losses also concluded to decrease because of to the incorporation of DRs.
This method is among the most used techniques for solving nonlinear
algebraic equations and better convergences than Gauss-Siedel method[9].
In the case of islanded microgrids, Newton Raphson methods may fail to get
a solution even with starting from a flat initial guess. Typically this situation is due to
the fact that the region of attraction of the power flow solution in the islanded
microgrid is narrow[10]. Moreover, the system is operating close to the boundary
between the solvable and unsolvable region as there is no infinite bus in the system.
2.3.2 Newton Trust Region Method
Traditionally the non-linear equations of the power flow problem are solved using
the Newton Raphson (NR) algorithms. Generally, the NR algorithms provide fast
quadratic convergence characteristics. However they face several challenges when
dealing with distribution systems due to several factors such as the high R/X ratio as
well as the sparse Jacobian matrix inversion.
Newton Trust Region Method three-phase power flow algorithm is
formulated for islanded microgrids. The algorithm is novel since it adapts the real
characteristics of the islanded microgrid operation. All possible operation modes of
DG units (droop, PV, or PQ) have been considered. The problem has been
formulated as a set of nonlinear equations. A globally convergent Newton-trust
region method has been proposed to solve this set of nonlinear equations. The
proposed algorithm is a helpful tool to perform accurate steady state studies of the
islanded microgrid.

23
Newton-Trust region method as an alternative to the NR algorithms. Trust
region methods are simple and powerful tools for solving systems of nonlinear
equations and large scale optimization problems[4]. The proposed algorithm has
been validated by comparing its results with the results of a detailed time-domain
simulation. The results show good convergence characteristics in all operating
conditions. The proposed algorithm is a powerful tool to study the power flow in an
islanded microgrid. This power flow analysis helps to consider the islanded
microgrid in both operational and planning studies.
2.4 DIGSILENT PowerFactory 14.0
The calculation program PowerFactory, as written by DIgSILENT, is a computer
aided engineering tool for the analysis of industrial, utility, and commercial electrical
power systems. It has been designed as an advanced integrated and interactive
software package dedicated to electrical power system and control analysis in order
to achieve the main objectives of planning and operation optimization.
The name DIgSILENT stands for "DIgital SImuLation and Electrical
NeTwork calculation program''. DIgSILENT Version 7 was the world's first power
system analysis software with an integrated graphical one-line interface. That
interactive one-line diagram included drawing functions, editing capabilities and all
relevant static and dynamic calculation features.
The PowerFactory package was designed and developed by qualified
engineers and programmers with many years of experience in both electrical power
system analysis and programming fields. The accuracy and validity of the results
obtained with this package has been confirmed in a large number of
implementations, by organizations involved in planning and operation of power
systems.
In order to meet today's power system analysis requirements, the DIgSILENT
power system calculation package was designed as an integrated engineering tool
which provides a complete 'walk-around' technique through all available functions,

24
rather than a collection of different software modules. The following key-features are
provided within one single executable program:
1 PowerFactory core functions: definition, modification and organization of
cases; core numerical routines; output and documentation functions
2 Integrated interactive single line graphic and data case handling
3 Power system element and base case database
4 Integrated calculation functions (e.g. line and machine parameter calculation
based on geometrical or nameplate information)
5 Power system network configuration with interactive or on-line access to the
SCADA system
6 Generic interface for computer-based mapping systems
By using just a single database, containing all the required data for all
equipment within a power system (e.g. line data, generator data, protection data,
harmonic data, controller data), PowerFactory can easily execute any or all available
functions, all within the same program environment. Some of these functions are
load-flow, short-circuit calculation, harmonic analysis, protection coordination,
stability calculation and modal analysis.
Load flow calculations are used to analyze power systems under steady-state
and nonfaulted (short-circuit-free) conditions. The load flow calculates the active and
reactive power flows for all branches, and the voltage magnitude and phase for all
nodes. The main areas for the application of load flow calculations are:
Calculation of branch loadings, system losses and voltage profiles for system
planning and operation (normal and abnormal conditions).
Contingency analysis, network security assessment (abnormal conditions).
Optimization tasks, i.e. minimizing system losses, minimizing generation costs,
open tie optimization in distributed networks, etc. (normal or abnormal
conditions).
Verification of system conditions during reliability calculations.
Automatic determination of optimal system resupplying strategies.
Optimization of load-shedding (abnormal conditions).
Calculation of steady-state initial conditions for stability simulations or
90
REFERENCES
1. Peng, L., et al. Analysis of acceptable capacity of microgrid connected to the
main power grid. in Electric Utility Deregulation and Restructuring and
Power Technologies (DRPT), 2011 4th International Conference on. 2011.
2. Hatziargyriou, N., et al., Microgrids. IEEE Power and Energy Magazine,
2007.
3. Basak, P., et al. Microgrid: Control techniques and modeling. in Universities
Power Engineering Conference (UPEC), 2009 Proceedings of the 44th
International. 2009.
4. Augustine, N., Economic dispatch for a microgrid considering renewable
energy cost functions IEEE, 2011.
5. Lasseter, R.H., MicroGrids. IEEE Power and Energy Magazine, 2007. 5(4):
p. 78-94.
6. Tabrizi, M.A., G. Radman, and A. Tamersi. Micro Grid Voltage profile
improvement using Micro Grid Voltage Controller. in Southeastcon, 2012
Proceedings of IEEE. 2012.
7. Srinivas, M.S., Distribution load flows: a brief review. IEEE Power
Engineering Society Winter Meeting, 2000. 2: p. 942-945.
8. Scott, B., Review of load-flow calculation methods. Proceedings of the IEEE,
1974. 62: p. 916-929.
9. Wei-Tzer, H. and Y. Wen-Chih. Power flow analysis of a grid-connected
high-voltage microgrid with various distributed resources. in Mechanic
Automation and Control Engineering (MACE), 2011 Second International
Conference on. 2011.
10. Abdelaziz, M.M.A., A Novel and Generalized Three-Phase Power Flow
Algorithm for Islanded Microgrids Using a Newton Trust Region Method.
IEEE Transactions on Power Systems, 2012: p. 1.
91
11. B. J. Kirby, Spinning Reserve From Responsive Loads, Oak Ridge National
Laboratory, March 2003.
12. Lescano, G.A.; Aurich, M.C.; Ohishi, T.; , "Optimal spinning reserve
allocation considering transmission constraints," Power and Energy Society
General Meeting - Conversion and Delivery of Electrical Energy in the 21st
Century, 2008 IEEE , vol., no., pp.1-6, 20-24 July 2008.
13. Savaghebi, M.; Jalilian, A.; Gholami, A.; , "A new approach for transformer
loading capability assessment under non-linear load currents," Industrial
Technology, 2008. ICIT 2008. IEEE International Conference on , vol., no.,
pp.1-5, 21-24 April 2008.
14. G. Swift, S. Zocholl and M. Bajpai, “Adaptive transformer thermal overload
protection,” IEEE Transactions on Power Deliv., vol. 16, no. 4, pp. 516-521,
Oct. 2001.
15. C. S. Cheng and D. Shirmohammadi, “A three phase power flow method for
real time distribution system analysis,” IEEE Trans. Power Syst., vol. 10, no.
2, pp. 671-679, May 1995.
16. S. M. Moghaddas-Tafreshi and E.Mashhour, “Distributed generation
modelling for power flow studies and three phase unbalanced power flow
solution for radial distribution system considering distributed generation,”
Elect. Power Syst. Vol. 79, no. 4, pp. 680-686, Apr.2009.
17. G. W. Chang, S.Y. Chu, and H. L. Wang, “ An improved backward/forward
sweep load flow algorithm for radial distribution systems. “ IEEE Trans.
Power Syst., vol. 22, no. 2, pp. 882-884, May 2007.
18. Y. Zhu and K. Tomsovic, “Development of three-phase unbalanced power
flow using PV and PQ models for distributed generation and study of the
impact of DG models.” IEEE Trans. Power Syst., vol. 22, no. 3, pp,1019-
1025, Aug 2007.