Embed Size (px)
Citation preview

Lo-Q plc Report of the Directors and Consolidated Financial Statements for the year ended 31 October 2010

1
Lo-Q plc
Contents of the Consolidated Financial Statements for the year ended 31 October 2010 Page Company Information 2 Acting Chairman's Report 3 Chief Executive Officers Statement 4 Report of the Directors 7 Report of the Independent Auditors 11 Consolidated Statement of Comprehensive Income 13 Consolidated Statement of Financial Position 14 Company Statement of Financial Position 15 Consolidated Statement of Cash Flow 16 Company Statement of Cash Flow 17 Statement of Changes in Equity 18 Notes to the Consolidated Financial Statements 19

2
Lo-Q plc Company Information for the year ended 31 October 2010 DIRECTORS: J Lillywhite, Acting Non-Executive Chairman T Burnet, Executive (appointed 4 October 2010) L Sim, Executive J Alder, Executive A Bone, Non-Executive D Gammon, Non-Executive (appointed 30 November 2010) SECRETARY: David Venus & Company Thames House Portsmouth Road Esher Surrey KT10 9AD REGISTERED OFFICE: Thames House Portsmouth Road Esher Surrey KT10 9AD REGISTERED NUMBER: 3959429 (England and Wales) AUDITORS: Menzies LLP 3rd Floor, King's House 12-42 Wood Street Kingston Upon Thames Surrey KT1 1TG BANKERS: HSBC Bank plc 26 Broad Street Reading RG1 2BU

3
Lo-Q plc Chairman’s Report for the year ending 31 October 2010 Acting Chairman’s Report The published accounts for Lo-Q show that we had a good year in 2010. Revenues, customers, profits and cash all increased in line with our expectations, despite the challenging general economic climate both in Europe and the United States. Operational activity was the driving force behind a strong performance in Customer parks. Product development also made significant progress in the area of new offerings which will be available, in the near future, to our Park installations as well as to new markets in both leisure and other areas. The Company did not perform to expectation with respect to new park sales and has displayed weaknesses in marketing. Work was done to review our strategic position and the Board recognised the need to develop a cohesive longer term strategy for growth. The Board has acted to address these areas by implementing management changes and appointing a new CEO. In the summer, we were delighted to secure the services of Tom Burnet as our new CEO. Tom joined us in October and is already making his presence felt. Much has been already achieved in developing a strong and cohesive management team that will, I am sure, be able to work together in taking Lo-Q to the next level. The forward strategy is already in outline form and will, along with the changes in sales and marketing, be the subject of further announcement in the near future. I agreed to take on the role of acting Chairman when our previous Chairman left the Company. I would like to take this opportunity to thank all those staff and management at Lo-Q who have worked so hard to produce the results that we have announced and for the support shown to me in this role. John Lillywhite Acting Chairman

4
Lo-Q plc Chief Executive Officers Report for the year ending 31 October 2010 CEO Statement Headlines I am very pleased to be able to report a strong performance by Lo-Q in the year ended 31st October 2010. In spite of the tough prevailing economic conditions across the geographies in which we operate we were able to deliver a 18.4% increase in profit before tax to £2.32m (2009 12 month pro forma: £1.96m) and revenue growth of 15.9% to £20.30m (2009 12 month pro forma: £17.51m). Additionally, we have been able to end the year with a strong net cash position of £6.02m (2009: £4.44m). This outcome was undoubtedly assisted by a combination of factors, but better weather and therefore stronger park attendances certainly bolstered our trading toward the end of the season. Across all our parks, visitor attendance was up an average 9% on the previous year. Another key success driver was the introduction by two clients of a premium Q-bot service which was very positively received by Lo-Q customers with 15% of our users happy to pay more for enhanced service levels and shorter queue times. During the year, we have also been able to invest in future product development and importantly carried out successful technical trials of our new Q-credits wristband based devices in water parks in the UK and Spain during the summer season. Looking ahead, we will be running at least two further large scale operational trials in water parks in the United States during the 2011 season. In April our largest customer, Six Flags, emerged from Chapter 11 bankruptcy proceedings in the US, following a 10 month period of re-organisation. This has had negligible impact on the performance of Lo-Q and we are now encouraged by Six Flags substantial park investment strategy for 2011 with a number of new rides planned across their parks. Perhaps the biggest disappointment of the year was the lack of Park sales success as only two small new parks were added in 2010, one of those installing our Q-bot system, the other deploying the Q-txt product. In terms of our existing business, we did secure the following Q-bot park contract extensions during the year: LEGOLAND® Windsor (UK), for a further three years Dreamworld (Australia), for a further three years Mirabilandia (Italy), for a further four years Dollywood of Tennessee (USA), for a further year, extended post year end for a further 3 years Moreover, Parque Isla Mágica in Seville, Spain, agreed on 26 March 2010 to extend its agreement to a one year rolling contract for the supply of Lo-Q's Q-txt queue management system. Overall however, Q-txt did not perform well during 2010. Performance was below budget and sales were below 2009 levels. In February 2010, Jeff McManus stood down from the role as Chief Executive but continued in the role of part time Chairman of Lo-Q. In July 2010, Jeff ceased to be a Director of the Company and John Lillywhite took over as Acting Chairman. A further announcement about the role of Chairman of the Company will be made in due course. Since my appointment as Chief Executive in October I have undertaken both strategic and operational reviews of our organisation.

5
Lo-Q plc Chief Executive Officers Report for the year ending 31 October 2010 Strategic Review Strategically we have reviewed our current business and the market more generally, taking stock of our position and the opportunities that exist for the future. Premium queuing packages are becoming standard in large parts of the theme park industry. Our Q-bot (VQ2020) product gives a park operator the opportunity to significantly increase the number of guests concurrently using a premium system compared with less sophisticated systems and therefore will maximise revenue to the park whilst improving the guest experience. Over the last 10 years we have developed a substantial track record of revenue and profit generation working closely with park operators and importantly, our existing customer base represents only about 8% of the world’s top ten amusement park corporations in terms of number of attendees. Lo-Q’s customers had about 26 million attendees in 2010 compared to 309 million attendees at the world’s top ten amusement park corporations. The Board and I agree that there remains a substantial opportunity to sell this proven technology to more parks and we will be investing in our Sales organisation to ensure we maximise on this potential. We will continue to invest in research and development of new products. Further to planned operational trials of our Q-Credits wristband technology in two large American Water Parks during the Summer of 2011, we will develop a sales plan to sell the technology to the Water Park market globally for the 2012 season. The product, even in early stages of development, was exceptionally well received by the market at its launch in November 2010. We see great potential to leverage our overhead, global footprint, operational expertise and relationships by targeted acquisition of other technically led organisations working in the Theme, Amusement and Water Park sectors. These sectors have seen substantial change over the last 5-7 years as both corporations and Private Equity houses have started to consolidate the ownership of parks around the world. At the same time, the supply chain has failed to consolidate and we see merit in adding IP in areas that complement our own Queuing excellence to enable us not only to reinforce our position within our existing vertical but also to take our queuing technology to new and growing verticals which have the same need. We have identified a number of potential areas for this strategic expansion and will report further on this in due course. Operational Review We have implemented a new sales process and recruited experienced sales and marketing talent, who have decades of Industry experience in the UK and North America and of course, bring their networks of contacts. These changes have already started to bear fruit and we have in recent weeks signed Heads of Terms for the installation of our Q-bot system with three new theme parks – Blackpool Pleasure Beach in the United Kingdom; Parques de Attracciones in Madrid, part of Parques Reunidos and Heide Park in Germany, part of the Merlin organisation. Moreover, we are in advanced discussions with another park and I am confident that our sales pipeline is growing well in both quality and scale as we look ahead. Whilst new park sales tend to really start to deliver profitability in the second and outer years of operations this is an excellent start to the year. We have also secured a 3 year extension to the Dollywood contract. As well as our attention to the sales function, we have established a prioritised product development roadmap and have a developing technology partnership strategy with some excellent collaboration already getting underway with cashless transaction systems and point of sale vendors. Similarly, we have initiated an HR review of the firm, with a remit to update our policies on staff performance management, training, salaries, benefits and share option schemes and importantly, a new sales incentive scheme. We have also made a number of changes to our Board. David Gammon has been appointed as a new Non Executive Director and we have started our search for a new Chairman. The appointment of Canaccord Genuity as our NOMAD/broker is expected to bring a fresh exposure of Lo-Q to city institutions. Cash and Dividends Recent activity in the currency markets had seen increased volatility between the US dollar and sterling. The policy of the Board is to hedge what it believes to be an appropriate proportion of its dollar exposure and therefore we have not experienced any significant impact on trading performance in the year being reported on or expect any in the current year. It is the view of the board that the payment of a dividend is unlikely in the short to medium term given anticipated new product and other investment requirements. Lo-Q workforce I would like to echo the Chairman’s comments and to recognise the commitment and hard work of the permanent team and seasonal staff, totalling over 600, we employ across our operation. Without their unfailing enthusiasm and hard work, our performance would be impossible.

6
Lo-Q plc Chief Executive Officers Report for the year ending 31 October 2010 Summary and Outlook for 2011 I am confident that 2011, our 10th year of operations, has started well from a sales and pipeline building perspective and that operationally we are well positioned to deliver another strong performance this year. This, combined with an excellent new product in the final stages of development and exciting future technical roadmap to build on, give me confidence as we look forward to the 2011 trading season. Tom Burnet

7
Lo-Q plc Report of the Directors for the year ended 31 October 2010 The directors present their report with the financial statements of the company and the Group for the year ended 31 October 2010. PRINCIPAL ACTIVITY The principal activity of the Group in the period under review was that of development and application of virtual queuing technologies. The Group made a Profit before tax £2,320,586. After taxation a sum of £1,872,509 has been transferred to retained earnings. The Group will continue to develop, market, sell, and operate its virtual queuing technologies. REVIEW OF BUSINESS The results for the period and financial position of the company and the group are as shown in the annexed financial statements and explained in the Acting Chairman’s report and CEO’s statement. DIVIDENDS No dividends will be distributed for the year ended 31 October 2010 KEY PERFORMANCE INDICATORS The Group has a very seasonal cash flow due to its income arising largely from park operations, through the daily renting of Q-bots to park guests. Park attendances peak in the summer months, and so income peaks in these months. The Group watches the cash generated during each week's trading in detail and includes this inflow in the weekly production of cash position modelling. Overhead costs are to a large extent known well in advance and are thus very predictable. Systems or part of systems are sold to finance houses and then leased back in accordance with the park's contract. Little cash is spent on assets other than the large amounts on R&D (in IP origination) and thus the company's profitability translates largely into cash at the bank. RESEARCH AND DEVELOPMENT The Group's research and development activities relate to the development of virtual queuing technologies, by applying state of the art communications and information technology. Up to 31 October 2010 the Group invested £807,980 (2009 – £401,208) into research and development.

8
Lo-Q plc Report of the Directors for the year ended 31 October 2010 DIRECTORS The directors during the period under review were: John Lillywhite, Acting Non-Executive Chairman Tom Burnet, Executive (appointed 4 October 2010) Leonard Sim, Executive Steve Drake, Executive (resigned 30 November 2010) Colin Robertson, Executive (resigned 30 November 2010) Paul Cassar, Executive (resigned 30 November 2010) John Alder, Executive Anthony Bone, Non-Executive Jeff McManus, Chairman (resigned 21 July 2010) The beneficial interests of the directors holding office on 31 October 2010 in the issued share capital of the company were as follows: Ordinary Share Capital £0.01 shares As at 31 October 2010 As at 1 November 2009
or date of appointment Leonard Sim, Executive 4,343,575 4,343,575 Steve Drake, Executive (resigned 30 November 2010) 419,384 419,384 Colin Robertson, Executive (resigned 30 November 2010) 255,000 148,000 Paul Cassar, Executive (resigned 30 November 2010) 137,143 137,143 John Alder, Executive 6,612 6,612 Tom Burnet (appointed 4 October 2010) - - John Lillywhite Acting Non-Executive Chairman 145,500 145,500 Anthony Bone Non-Executive 381,517 381,517 Jeff McManus Chairman (resigned 21 July 2010) 1,054,172 954,172 Details of the directors' share options are disclosed in Note 4. GROUP'S POLICY ON PAYMENT OF CREDITORS It is the Group's objective to obtain the best possible terms for all business and abide by the terms of business agreed. At 31 October 2010 trade creditors represented 41.2 days (2009 - 23 days) purchases for the Group, and 41.2 days (2009 - 27 days) purchases for the company. FINANCIAL INSTRUMENTS Details of the group's financial risk management objectives and policies, including the use of financial instruments, are included within the accounting policies in Note 2 to the financial statements.

9
Lo-Q plc Report of the Directors for the year ended 31 October 2010 SUBSTANTIAL SHAREHOLDINGS As at 7 February 2011 the company had been notified that the following were interested in 3% or more of the ordinary share capital of the company.
Number of Ordinary Shares % of Issued Ordinary Share Capital Leonard Sim, Director 4,343,575 26.76% L R Nominees Limited 1,318,376 8.12% HSDL Nominees Ltd 1,121,458 6.91% Jeffrey Robert McManus 1,054,172 5.17% BNY (OCS) Nominees Limited 748,500 4.61% Barclayshare Nominees Limited 748,186 4.61% TD Waterhouse Nominees (Europe) 692,999 4.27% Ian Keith Johnson 555,000 3.42%
Corporate Governance The directors acknowledge the importance of the 'Principles of Good Governance and Code of Best Practice' published by the London Stock Exchange (usually described as the 'Combined Code') and intend to apply them as appropriate to the company given its size and nature. The company holds Board meetings regularly throughout the year at which financial and other reports are considered. An Audit Committee has been established comprising John Lillywhite and Anthony Bone, both non-executive directors. A Remuneration Committee has also been established comprising John Lillywhite and Anthony Bone which meets as and when necessary but at least annually to review, inter alia, the performance and salaries of the executive directors and other senior members of the company. Going Concern After making appropriate enquiries, the Directors have a reasonable expectation that the Group has adequate resources to continue in operational existence for the foreseeable future. For this reason, they continue to adopt the going concern basis in preparing the accounts. Disabled Employees The Group's policy is one of equal opportunity in the selection, training, career development and promotion of staff. The Group has a policy not to discriminate against disabled employees for those vacancies that they are able to fill and will provide facilities, equipment and training to assist any disabled persons employed. All necessary assistance with initial training courses will be given. Once employed, a career plan will be developed so as to ensure suitable opportunities for each disabled person. Arrangements will be made, wherever possible, for re-training employees who become disabled, to enable them to perform work identified as appropriate to their aptitudes and abilities. Employees The Group's policy is to consult and discuss with employees, by way of meetings and through personal contact by directors and other senior executives, matters likely to affect employees' interests. Information on matters of concern to employees is given in meetings, handouts, letters and reports, which seek to achieve a common awareness on the part of all employees on the financial and economic factors affecting the Group's performance.
10
Lo-Q plc Report of the Directors for the year ended 31 October 2010 STATEMENT OF DIRECTORS' RESPONSIBILITIES The directors are responsible for preparing the Annual Report and the financial statements in accordance with applicable law and regulations. Company law requires the directors to prepare financial statements for each financial year. Under that law the directors have elected to prepare the financial statements in accordance with United Kingdom Generally Accepted Accounting Practice (United Kingdom Accounting Standards and applicable law). Under company law the directors must not approve the financial statements unless they are satisfied that they give a true and fair view of the state of affairs of the company and of the profit or loss of the company for that period. In preparing these financial statements, the directors are required to: - select suitable accounting policies and then apply them consistently; - make judgements and estimates that are reasonable and prudent; - state whether applicable UK Accounting Standards have been followed, subject to any material departures
disclosed and explained in the financial statements; - prepare the financial statements on the going concern basis unless it is inappropriate to presume that the company
will continue in business. The directors are responsible for keeping adequate accounting records that are sufficient to show and explain the company’s transactions and disclose with reasonable accuracy at any time the financial position of the company and enable them to ensure that the financial statement comply with the Companies Act 2006. They are also responsible for safeguarding the assets of the company and hence for taking reasonable steps for the prevention and detection of fraud and other irregularities. STATEMENT AS TO DISCLOSURE OF INFORMATION TO AUDITORS So far as the directors are aware, there is no relevant audit information (as defined by Section 418 of the Companies Act 2006) of which the group's auditors are unaware, and each director has taken all the steps that he ought to have taken as a director in order to make himself aware of any relevant audit information and to establish that the group's auditors are aware of that information. AUDITORS A resolution approving the re-appointment of Menzies LLP will be proposed at the forthcoming Annual General Meeting. ON BEHALF OF THE BOARD: John Alder Director 15 February 2011

11
Lo-Q plc Report of the Independent Auditors to the Members of Lo-Q plc for the year ended 31 October 2010 We have audited the financial statements of Lo-Q plc for the year 31 October 2010 which comprises the Group and Parent Company Statements of Financial Position, the Group Statement of Comprehensive Income, the Group and Parent Company of Statement Cash Flow, the Group and Parent Company Statements of Changes in Equity and the related notes. The financial reporting framework that has been applied in their preparation is applicable law and International Reporting Standards (IFRSs) as adopted by European Union and, as regards the parent company financial statements, as applied in accordance with the provisions of Companies Act 2006. This report is made solely to the company’s members, as a body, in accordance with Chapter 3 of Part 16 of the Companies Act 2006. Our audit work has been undertaken so that we might state to the company’s shareholders those matters we are required to state to them in an auditor’s report and for no other purpose. To the fullest extent permitted by law, we do not accept or assume responsibility to anyone other than the company and the company’s members as a body, for our audit work, for this report, or for the opinions we have formed.
Respective responsibilities of directors and auditors As explained more fully in the Director’s Responsibilities Statement set out on page 10, the directors are responsible for the preparation of the financial statements and for being satisfied that they give a true and fair view. Our responsibility is to audit the financial statements in accordance with applicable law and International Standards on Auditing (UK and Ireland). Those standards require us to comply with the Auditing Practices Board’s Ethical Standards for Auditors. Scope of the audit of the financial statements An audit involves obtaining evidence about the amounts and disclosures in the financial statements sufficient to give reasonable assurance that the financial statements are free from material misstatement, whether caused by fraud or error. This includes an assessment of: whether the accounting policies are appropriate to the group’s and the parent company’s circumstances and have been consistently applied and adequately disclosed; the reasonableness of significant accounting estimates made by the directors; and the overall presentation of the financial statements.
Opinion on financial statements In our opinion:
• the financial statements give a true and fair view of the state of the group’s and of the parent company’s affairs as at 31 October 2010 and of the Group’s profit for the year then ended;
• the group financial statements have been properly prepared in accordance with IFRSs as adopted by the European Union;
• the parent company financial statements have been properly prepared in accordance with IFRSs as adopted by the European Union and as applied in accordance with the provisions of the Companies Act 2006; and
• the financial statements have been prepared in accordance with the requirements of the Companies Act 2006 and, as regards the group financial statements, Article 4 of the IAS Regulation.
Opinion on other matters prescribed by the Companies Act 2006 In our opinion:
• the information given in the Directors’ Report for the financial year for which the financial statements are prepared is consistent with the financial statements.

12
Lo-Q plc Report of the Independent Auditors to the Members of Lo-Q plc for the year ended 31 October 2010 Matters on which we are required to report by exception We have nothing to report in respect of the following: Under the Companies Act 2006 we are required to report to you, if, in our opinion:
• adequate accounting records have not been kept by the parent company, or returns adequate for our audit have not been received from branches not visited by us; or
• the parent company financial statements are not in agreement with the accounting records and returns; or • certain disclosures of directors’ remuneration specified by law are not made; or • we have not received all the information and explanations we require for our audit.
Andrew Denley FCA (Senior Statutory Auditor) For and on behalf of MENZIES LLP Chartered Accountants and Statutory Auditors Kingston upon Thames 15 February 2011
13
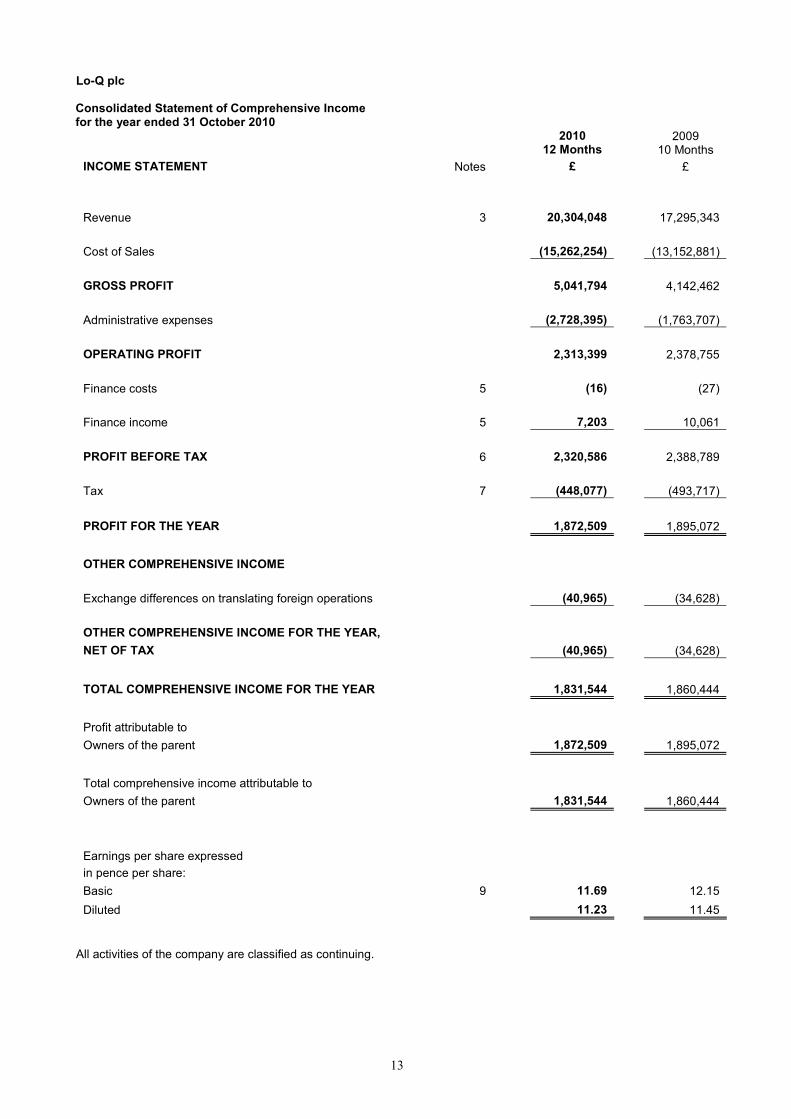
Lo-Q plc Consolidated Statement of Comprehensive Income for the year ended 31 October 2010
2010
12 Months 2009
10 Months
INCOME STATEMENT Notes £ £
Revenue 3 20,304,048 17,295,343
Cost of Sales (15,262,254) (13,152,881)
GROSS PROFIT 5,041,794 4,142,462
Administrative expenses (2,728,395) (1,763,707)
OPERATING PROFIT 2,313,399 2,378,755
Finance costs 5 (16) (27)
Finance income 5 7,203 10,061
PROFIT BEFORE TAX 6 2,320,586 2,388,789
Tax 7 (448,077) (493,717)
PROFIT FOR THE YEAR 1,872,509 1,895,072
OTHER COMPREHENSIVE INCOME
Exchange differences on translating foreign operations (40,965) (34,628)
OTHER COMPREHENSIVE INCOME FOR THE YEAR,
NET OF TAX (40,965) (34,628)
TOTAL COMPREHENSIVE INCOME FOR THE YEAR 1,831,544 1,860,444
Profit attributable to
Owners of the parent 1,872,509 1,895,072
Total comprehensive income attributable to
Owners of the parent 1,831,544 1,860,444
Earnings per share expressed
in pence per share:
Basic 9 11.69 12.15
Diluted 11.23 11.45
All activities of the company are classified as continuing.

14
Lo-Q plc Consolidated Statement of Financial Position for the year ended 31 October 2010
2010 2009
Notes £ £
ASSETS
NON-CURRENT ASSETS
Intangible assets 10 1,203,770 714,642
Property, Plant, Equipment and Installed Systems 11 178,488 64,076
1,382,258 778,718
CURRENT ASSETS
Inventories 13 243,273 415,128
Trade and other receivables 14 828,736 657,044
Tax receivable 1,030 569
Cash and cash equivalents 15 6,018,443 4,438,612
7,091,482 5,511,353
LIABILITIES
CURRENT LIABILITIES
Trade and other payables 16 1,005,118 699,267
Tax payable 208,801 288,270
1,213,919 987,537
NET CURRENT ASSETS 5,877,563 4,523,816
NET ASSETS 7,259,821 5,302,534
SHAREHOLDERS' EQUITY
Called up share capital 17 162,327 158,917
Share premium 5,132,482 5,052,149
Capital redemption reserve 12,473 12,473
Other reserves 129,148 87,148
Retained earnings 1,823,391 (8,153)
Total equity 7,259,821 5,302,534
TOTAL SHAREHOLDERS' EQUITY 7,259,821 5,302,534
The financial statements were approved by the Board of Directors 15 February 2011 and were signed on its behalf by: Tom Burnet Chief Executive Officer
The notes form part of these financial statements

15
Lo-Q plc Company Statement of Financial Position for the year ended 31 October 2010
2010 2009
Notes £ £
ASSETS
NON-CURRENT ASSETS
Intangible assets 10 1,203,524 714,210
Property, Plant, Equipment and Installed Systems 11 149,204 47,732
Investments 12 735 735
1,353,463 762,677
CURRENT ASSETS
Inventories 13 166,746 344,581
Trade and other receivables 14 1,324,115 1,649,979
Cash and cash equivalents 15 5,216,735 3,267,341
6,707,596 5,261,901
LIABILITIES
CURRENT LIABILITIES
Trade and other payables 16 625,516 408,108
Tax Payable 208,689 247,148
834,205 655,256
NET CURRENT ASSETS 5,873,391 4,606,645
NET ASSETS 7,226,854 5,369,322
SHAREHOLDERS' EQUITY
Called up share capital 17 162,327 158,917
Share premium 5,132,482 5,052,149
Capital redemption reserve 12,473 12,473
Other reserves 129,148 87,148
Retained earnings 1,790,424 58,635
Total equity 7,226,854 5,369,322
TOTAL SHAREHOLDERS' EQUITY 7,226,854 5,369,322
The financial statements were approved by the Board of Directors 15 February 2011 and were signed on its behalf by:
Tom Burnet Chief Executive Officer
The notes form part of these financial statements

16
Lo-Q plc Consolidated Statement of Cash Flow for the year ended 31 October 2010
2010
12 Months 2009
10 Months
Notes £ £
Cash flows from operating activities
Cash generated from operations 22 2,987,770 2,172,832
Interest paid (16) (27)
Tax paid (528,007) (13,040)
Net cash from operating activates 2,459,747 2,159,765
Cash flows from investing activities
Purchase of intangible fixed assets (741,252) (309,748)
Purchase of tangible fixed assets (229,610) (36,359)
Interest received 7,203 10,061
Net cash used in investing activities (963,659) (336,046)
Cash flows from financing activities
Share Issue 3,410 4,456
Share Premium 80,333 51,086
Net cash from financing activities 83,743 55,542
Increase in cash and cash equivalents 22 1,579,831 1,879,261
Cash and cash equivalents at beginning of year 4,438,612 2,559,351
Cash and cash equivalents at end of year 22 6,018,443 4,438,612
The notes form part of these financial statements

17
Lo-Q plc Company Statement of Cash Flow for the year ended 31 October 2010
2010
12 Months 2009
10 Months
Notes £ £
Cash flows from operating activities
Cash generated from operations 22 3,222,471 1,645,219
Interest paid (16) (27)
Tax paid (426,819) -
Net cash from operating activates 2,795,636 1,645,192
Cash flows from investing activities
Purchase of intangible fixed assets (741,252) (309,748)
Purchase of tangible fixed assets (194,282) (28,237)
Interest received 5,549 8,851
Net cash used in investing activities (929,985) (329,134)
Cash flows from financing activities
Share Issue 3,410 4,456
Share Premium 80,333 51,086
Net cash from financing activities 83,743 55,542
Increase in cash and cash equivalents 22 1,949,394 1,371,600
Cash and cash equivalents at beginning of year 3,267,341 1,895,741
Cash and cash equivalents at end of year 22 5,216,735 3,267,341

18
Lo-Q plc Statement of Changes in Equity for the year ended 31 October 2010
GROUP Share Retained Share Capital Share Total
capital earnings premium Redem- based
ption payment
reserve reserve
£ £ £ £ £ £
Balance at 1 November 2009 158,917 (8,153) 5,052,149 12,473 87,148 5,302,534
Profit for the year - 1,872,509 - - - 1,872,509
Foreign exchange - (40,965) - - - (40,965)
Issue of share capital 3,410 - 80,333 - - 83,743 Recognition of share-based Payments - - - - 42,000 42,000
Balance at 31 October 2010 162,327 1,823,391 5,132,482 12,473 129,148 7,259,821
£ £ £ £ £ £
Balance at 1 January 2009 153,211 (1,868,597) 5,001,063 12,473 45,607 3,343,757
Profit for period - 1,895,072 - - - 1,895,072
Foreign exchange - (34,628) - - - (34,628)
Issue of share capital 5,706 - 51,086 - - 56,792 Recognition of share-based Payments - - - - 41,541 41,541
Balance at 31 October 2009 158,917 (8,153) 5,052,149 12,473 87,148 5,302,534
COMPANY Share Retained Share Capital Share Total
capital earnings premium Redem- based
ption payment
reserve reserve
£ £ £ £ £ £
Balance at 1 November 2009 158,917 58,635 5,052,149 12,473 87,148 5,369,322
Profit for year - 1,731,789 - - - 1,731,789
Issue of share capital 3,410 - 80,333 - - 83,743 Recognition of share-based Payments - - - - 42,000 42,000
Balance at 31 October 2010 162,327 1,790,424 5,132,482 12,473 129,148 7,226,854
£ £ £ £ £ £
Balance at 1 January 2009 153,211 (1,664,531) 5,001,063 12,473 45,607 3,547,823
Profit for period - 1,723,166 - - - 1,723,166
Issue of share capital 5,706 - 51,086 - - 56,792 Recognition of share-based Payments - - - - 41,541 41,541
Balance at 31 October 2009 158,917 58,635 5,052,149 12,473 87,148 5,369,322

19
Lo-Q plc Notes to the Consolidated Financial Statements for the year ended 31 October 2010 1. ACCOUNTING POLICIES
Basis of preparation Lo-Q plc is a public limited company incorporated in the United Kingdom, whose shares are publicly traded on the AIM market. The Company is domiciled in the United Kingdom and its registered address is Thames House, Portsmouth Road, Esher, Surrey, KT10 9AD. The financial period represents the 52 weeks and 1 day to 31 October 2010 (prior financial year 43 weeks and 5 days to 31 October 2009). The consolidated financial statements for the 52 weeks and 1 day to 31 October 2010 comprise the financial statements of the Company and its subsidiaries ('Group'). The Group's principal activities are the development and application of virtual queuing technologies. STATEMENT OF COMPLIANCE WITH IFRS'S The Group's financial statements have been prepared in accordance with International Financial Reporting Standards (IFRSs) as adopted by the European Union and as applied in accordance with the provisions of the Companies Act 2006. The principal accounting policies adopted by the group are set out below. The following new standard have been adopted during the period It has not been necessary to adopt any new standards during the year ended 31 October 2010. New standards and interpretations not yet adopted A number of new standards, amendments to standards and interpretations are not effective for 2010 and therefore have not been applied in preparing these accounts. The effective dates shown are for periods commencing on the date quoted. Amendments to IFRS 2 Group Cash-settled Share-based Payment Transactions (effective 1 January 2010) Amendments to IFRS 3 Business Combinations (effective 1 July 2010) Amendments to IFRS 5 Non-Current Assets Held for Sale and Discontinued Operations (effective 1 January 2010) Amendments to IFRS 7 Financial Instruments: Disclosures (effective 1 January 2011) Amendments to IFRS 8 Operating Segments (effective 1 January 2010) IFRS 9 Classification and Measurement of Financial Instruments (effective 1 January 2013) Amendments to IAS 1 Presentation of Financial Statements (effective 1 January 2010/2011) Amendments to IAS 7 Statement of Cash Flows (effective 1 January 2010) Amendments to IAS 17 Leases (effective 1 January 2010) IAS 24 Related Party Transactions (revised) (effective 1 January 2011) Amendments to IAS 27 Consolidated and Separate Financial Statements (effective 1 January 2010) Amendments to IAS 32 Classification of Rights Issues (effective 1 February 2010) Amendments to IAS 34 Interim Financial Reporting (effective 1 January 2011) Amendments to IAS 36 Impairment of Assets (effective 1 January 2010) Amendments to IAS 39 Financial Instruments: Recognition and Measurement (effective 1 January 2010) The Group has considered the above new standards, interpretations and amendments to published standards that are not yet effective and concluded that they are either not relevant to the Group or that they would not have a significant impact on the Group's Financial Statements, apart from additional disclosures. Basis of Accounting The financial statements of Lo-Q plc have been prepared in accordance with EU Endorsed International Financial Reporting Standards and IFRIC interpretations (IFRS) and the Companies Act 2006 applicable to companies reporting under IFRS. The financial statements have been prepared under the historical cost convention. The preparation of financial statements in conformity with IFRS requires the use of certain critical accounting estimates. It also requires management to exercise its judgement in the process of applying the accounting policies. The areas involving a higher degree of judgement or complexity, or areas where assumptions and estimates are significant to the financial statements are noted below.

20
Lo-Q plc Notes to the Consolidated Financial Statements for the year ended 31 October 2010
Judgement and estimates The Group makes judgements and assumptions concerning the future that impact the application of policies and reported amounts. The resulting accounting estimates calculated using these judgements and assumptions will, by definition, seldom equal the related actual results but are based on historical experience and expectations of future events. The judgements and key sources of estimation uncertainty that have a significant effect on the amounts recognised in the financial statements are discussed below. Impairment of assets Financial and non-financial assets including other intangibles are subject to impairment reviews based on whether current or future events and circumstances suggest that their recoverable amount may be less than their carrying value. Recoverable amount is based on a calculation of expected future cash flows which includes management assumptions and estimates of future performance. If there is an indication that impairment exists, the recoverable amount of the asset is estimated in order to determine the extent of the impairment loss (if any). Where the asset does not generate cash flows that are independent from other assets, the Group estimates the recoverable amount of the cash-generating unit to which this asset belongs. An intangible asset with an indefinite useful life is tested for impairment annually and whenever there is an indication that the asset may be impaired. Recoverable amount is the higher of the fair value less costs to sell and value in use. In assessing value in use, the estimated future cash flows are discounted to their present value using a pre-tax discount rate that reflects current market assessments of the time value of money and the risks specific to the asset for which the estimates of the future cash flows have not been adjusted. If the recoverable amount of an asset (or cash-generating unit) is estimated to be less than its carrying amount, the carrying amount of the asset (cash-generating unit) is reduced to its recoverable amount. An impairment loss is recognised as an expense immediately, unless the relevant asset is carried at a re-valued amount, in which case the impairment loss is treated as a revaluation decrease. Where an impairment loss subsequently reverses, the carrying amount of the asset (cash-generating unit) is increased to the revised estimate of its recoverable amount, but so that the increased carrying amount does not exceed the carrying amount that would have been determined had no impairment loss been recognised for the asset (cash-generating unit) in prior years. A reversal of an impairment loss is recognised as income immediately unless the relevant asset is carried at a re-valued amount, in which case the reversal of the impairment loss is treated as a revaluation increase. Basis of consolidation The consolidated financial statements incorporate the results of Lo-Q plc and all of its subsidiary undertakings as at 31 October 2010 using the acquisition method of accounting. The results of subsidiary undertakings are included from the date of acquisition. Where necessary, adjustments are made to the financial statements of subsidiaries to bring the accounting policies used in line with those used by the Group. All intra-group transactions, balances, income and expenses are eliminated on consolidation. The acquisition of subsidiaries is accounted for using the purchase method. The cost of the acquisition is measured at the aggregate of the fair value, at the date of exchange, of assets given, liabilities incurred or assumed and equity instruments issued by the Group in exchange for control of the acquiree, plus any costs directly attributable to the business combination. The acquiree’s identifiable assets, liabilities and contingent liabilities that meet the conditions under IFRS3 are recognised at their fair value at the acquisition date. Goodwill arising on acquisition is recognised as an asset and initially measured at cost, being the excess of the cost of the business combination over the Group’s interest in the net fair value of the identifiable assets, liabilities and contingent liabilities recognised.

21
Lo-Q plc Notes to the Consolidated Financial Statements for the year ended 31 October 2010
Subsidiaries Subsidiaries are all entities over which the Group has the power to govern the financial and operating policies generally accompanying a shareholding of more than half of the voting rights. The results of subsidiaries are included in the Group income statement from the date of acquisition.
Revenue Recognition Turnover arises from the development and application of virtual queuing technologies. Turnover represents either total rentals, net of sales taxes, to theme park or attraction guests or the Group’s share of such rental. Total rentals are accounted for where the Group are responsible for the operation within the theme park. Turnover also includes revenue from the financing of installed systems to new or existing theme parks. These systems are then leased back to the Group with the lease costs being recognised within cost of sales during the period or year as they fall due. Interest expense recognition Expense is recognised as interest accrues, using the effective interest method, to the net carrying amount of the financial liability. Employee expenses The Group has applied the requirements of IFRS 2 Share-Based Payment. In accordance with the transitional provisions, IFRS2 has been applied to all grants of equity instruments after 7 November 2002 that were unvested as of 1 January 2007. The Group issues equity-settled share-based payments to full time employees. Equity settled share-based payments are measured at the fair value at the date of grant. The fair value determined at the grant date of the equity-settled share-based payments is expensed on a straight-line basis over the vesting period, based on the Group's estimate of shares that will eventually vest. Fair value is measured by use of a Black-Scholes model for all share options in issue. The expected life used in the model has been adjusted, based on management's best estimate, for the effects of non-transferability, exercise restrictions, and behavioural considerations. Exceptional items Exceptional items are presented in the financial statements where there are material items of income and expense which, because of their nature and the expected rarity of the circumstances, which generate them, they should be presented separately to shareholders so as to enhance their judgement of the current year's financial performance and its comparability with prior years. Commitments under operating leases Operating lease payments are recognised as an expense in the consolidated income statement on a straight-line basis over the lease term.

22
Lo-Q plc Notes to the Consolidated Financial Statements for the year ended 31 October 2010
Property, Plant, Equipment and Installed Systems Items of property, plant and equipment are stated at cost of acquisition or production cost less accumulated depreciation and impairment losses. Depreciation is charged so as to write off the cost or valuation of assets over their estimated useful lives, using the straight-line method, on the following bases:
Plant and machinery 33.3% Office equipment 33.3% Installed Systems 33.3% Furniture and fixtures 20.0%
Inventories Stocks are valued at the lower of cost and net realisable value, after making due allowance for obsolete and slow moving items. Raw materials costs are calculated on a first in first out basis. Work in progress is valued on the basis of the cost of raw materials and labour plus attributable overheads. Net realisable value is based on estimated selling price less additional costs to completion and disposal. Deferred Tax Deferred tax is the tax expected to be payable or recoverable on differences between the carrying amounts of assets and liabilities in the financial statements and the corresponding tax bases used in the computation of taxable profits ("temporary differences") and is accounted for using the balance sheet liability method. Deferred tax liabilities are generally recognised for all taxable temporary differences. Where there are taxable temporary differences arising on subsidiaries, deferred tax liabilities are recognised. Deferred tax assets are generally recognised to the extent that it is probable that taxable profits will be available against which deductible temporary differences can be utilised. Where there are deductible temporary differences arising on subsidiaries, deferred tax assets are recognised only where it is probable that they will reverse in the foreseeable future and taxable profits will be available against which the temporary differences can be utilised. The carrying amount of deferred tax assets is reviewed at each balance sheet date and reduced to the extent that it is no longer probable that sufficient tax profits will be available to allow all or part of the asset to be recovered. Deferred tax is calculated at the tax rates that are expected to apply in the period when the liability is settled or the asset is realised. Research and development In accordance with IAS 38 'Intangible Assets', expenditure incurred on research and development is distinguished as either to a research phase or to a development phase. All advanced research phase expenditure is charged to the income statement. For development expenditure, this is capitalised as an internally generated intangible asset, only if it meets strict criteria, relating in particular to technical feasibility and generation of future economic benefits. Development expenditure is capitalised and amortised within administrative expenses on a straight line basis over its useful economic life, which is considered to be up to a maximum of 5 years. Intellectual property rights Intellectual property rights comprise assets acquired relating to know how, patents and licences and have been capitalised at the fair value of the assets acquired and are amortised within administrative expenses on a straight line basis over their estimated useful economic life of 5 and 7 years. Foreign currency exchange Transactions in currencies other than the functional currency of the Group are recorded at the rates of exchange prevailing on the dates of the transactions. At each balance sheet date, monetary assets and liabilities that are denominated in foreign currencies are retranslated at the rates prevailing on the balance sheet date. Non-monetary assets and liabilities carried at fair value that are denominated in foreign currencies are translated at the rates prevailing at the date when the fair value was determined.

23
Lo-Q plc Notes to the Consolidated Financial Statements for the year ended 31 October 2010
Gains and losses arising on retranslation are included in net profit or loss for the period, except for exchange differences arising on non-monetary assets and liabilities where the changes in fair value are recognised directly in equity. On consolidation, the assets and liabilities of the Group's overseas operations are translated at exchange rates prevailing on the balance sheet date. Income and expense items are translated at the average exchange rates for the period unless exchange rates fluctuate significantly. Exchange differences arising, if any, are classified as equity and movement shown in reserves. Pension Costs Contributions to the Group's defined contribution pension scheme are charged to the profit and loss account in the period/ year in which they become due. Trade and other receivables Trade and other receivables are recognised by the Group and carried at original invoice amount less an allowance for any uncollectible or impaired amounts. An estimate for doubtful debts is made when collection of the full amount is no longer probable. Bad debts are written off when they are identified as being bad. Other receivables are recognised at fair value.
Cash and cash equivalents Cash and cash equivalents comprise cash at bank and in hand and short term deposits. Short-term deposits are defined as deposits with an initial maturity of three months or less. Bank overdrafts that are repayable on demand and form an integral part of the Group's cash management are included as a component of cash and cash equivalents for the purposes of the consolidated cash flow statement. Equity Instruments re share capital Equity instruments are recorded at the proceeds received, net of direct issue costs.

24
Lo-Q plc Notes to the Consolidated Financial Statements for the year ended 31 October 2010 2. FINANCIAL RISK MANAGEMENT
Overview: The Group has exposure to the following risks from its use of financial instruments Liquidity risk; Interest rate risk; Credit risk; and Market risk This note presents information about the Group’s exposure to each of the above risks and the Group’s policies and processes for measuring and managing these risks. The risks are managed centrally following Board approved policies. The Group operates a centralised treasury function in accordance with Board approved policies and guidelines covering funding and management of foreign exchange exposure and interest rate risk. Transactions entered into by the treasury function are required to be in support of, or as a consequence of, underlying commercial transactions. Other than short-term trade receivables and trade payables, as detailed in notes that arise directly from operations the Group’s financial instruments comprise cash. The fair values of these instruments are not materially different to their book values. The objective of holding financial instruments is to raise finance for the Group’s operations and manage related risks. The Group’s activities expose the Group to a number of risks including interest rate risk, credit risk, liquidity risk and currency risk. The Group manages these risks by regularly monitoring the business and providing ongoing forecasts of the impact on the business. LIQUIDITY RISK The Group closely monitors its access to bank and other credit facilities in comparison to its outstanding commitments to ensure it has sufficient funds to meet its obligations as they fall due. The Group finance function produces regular forecasts that estimate the cash inflows and outflows for the next 12 months, so that management can ensure that sufficient financing is in place as it is required. The Groups objective is to maintain a balance between continuity of funding and flexibility through the use of banking arrangements in place. MATURITY ANALYSIS The table below analyses the Group’s financial liabilities on a contractual gross basis based on amount outstanding at the balance sheet date up to maturity date: 31 October 2010
Less than 6 Months
Between 6 months and
1 year
Between 1 and 5 years
Over 5 Years
Total
Maturity analysis £ £ £ £ £
GROUP Trade and other Payables 770,859 - - - 770,859
Total Liabilities 770,859 - - - 770,859
COMPANY Trade and other Payables 578,346 - - - 578,346
Total Liabilities 578,346 - - - 578,346

25
Lo-Q plc Notes to the Consolidated Financial Statements for the year ended 31 October 2010
31 October 2009
Less than 6 Months
Between 6
months and 1 year
Between 1 and 5 years
Over 5 Years
Total
Maturity analysis £ £ £ £ £
GROUP Trade and other Payables 592,760 - - - 592,760
Total Liabilities 592,760 - - - 592,760
COMPANY
297,329 - - - 297,329 Trade and other Payables
- - -
Total Liabilities 297,329 - - - 297,329 The Group would normally expect that sufficient cash is generated in the operating cycle to meet the contractual cash flows as disclosed above through effective cash management. INTEREST RATE RISK The Group’s interest rate variation arises mainly from interest received on Cash deposits. Any contractual agreements entered into at floating rates expose the entity to cash flow risk, while fixed-rate deposits expose the entity to fair value risk. The Group uses a combination of fixed and floating deposits for its cash balances.
The Group has considered the potential impact of falling interest rates on its cash deposits and do not consider this to have a materially significant impact on the accounts and hence no sensitivity analysis is considered necessary. The Group regularly reviews its funding arrangements to ensure they are competitive with the marketplace. The table below shows the Group’s and Company’s financial assets and liabilities split by those bearing fixed and floating rates and those that are non-interest bearing: 31 October 2010
Fixed Rate Floating Rate
Non-interest bearing
Total asset
Total liability
GROUP £ £ £ £ £ Trade and other receivables - - 127,688 127,688 -
Cash 361,817 5,654,341 2,285 6,018,443 -
Total assets 361,817 5,654,341 129,973 6,146,131 -
Trade and other payables - - (770,859) - (775,526)
Total liabilities - - (770,859) - (775,526)

26
Lo-Q plc Notes to the Consolidated Financial Statements for the year ended 31 October 2010
Fixed Rate
Floating Rate
Non-interest bearing
Total asset
Total liability
COMPANY £ £ £ £ £ Trade and other receivables - - 807,713 807,713 -
Cash - 5,214,667 2,068 5,216,735 -
Total assets - 5,214,667 809,781 6,024,448 -
Trade and other payables - - (578,346) - (583,069)
Total liabilities - - (578,346) - (583,069)
31 October 2009
Fixed Rate
Floating Rate
Non-interest bearing
Total asset
Total liability
GROUP £ £ £ £ £ Trade and other receivables - - 92,331 92,331 -
Cash 363,206 4,071,607 3,799 4,438,612 -
Total assets 363,206 4,071,607 96,130 4,530,943 -
Trade and other payables - - (640,578) - (640,578)
Total liabilities - - (640,578) - (640,578)
Fixed Rate
Floating Rate
Non-interest bearing
Total asset
Total liability
COMPANY £ £ £ £ £ Trade and other receivables - - 1,107,902 1,107,902 -
Cash - 3,263,782 3,559 3,267,341 -
Total assets - 3,263,782 1,111,461 4,375,243 -
Trade and other payables - - (351,092) - (351,092)
Total liabilities - - (351,092) - (351,092)
27
Lo-Q plc Notes to the Consolidated Financial Statements for the year ended 31 October 2010
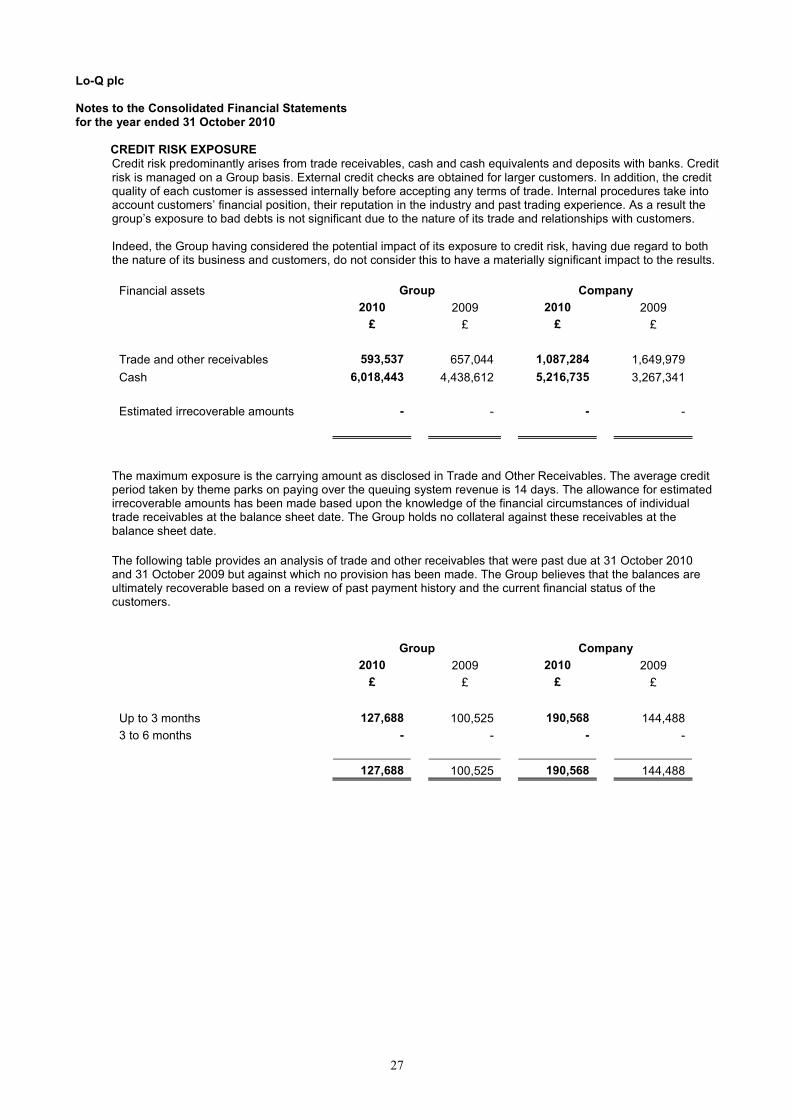
CREDIT RISK EXPOSURE Credit risk predominantly arises from trade receivables, cash and cash equivalents and deposits with banks. Credit risk is managed on a Group basis. External credit checks are obtained for larger customers. In addition, the credit quality of each customer is assessed internally before accepting any terms of trade. Internal procedures take into account customers’ financial position, their reputation in the industry and past trading experience. As a result the group’s exposure to bad debts is not significant due to the nature of its trade and relationships with customers. Indeed, the Group having considered the potential impact of its exposure to credit risk, having due regard to both the nature of its business and customers, do not consider this to have a materially significant impact to the results.
Financial assets Group Company
2010 2009 2010 2009
£ £ £ £
Trade and other receivables 593,537 657,044 1,087,284 1,649,979
Cash 6,018,443 4,438,612 5,216,735 3,267,341
Estimated irrecoverable amounts - - - -
The maximum exposure is the carrying amount as disclosed in Trade and Other Receivables. The average credit period taken by theme parks on paying over the queuing system revenue is 14 days. The allowance for estimated irrecoverable amounts has been made based upon the knowledge of the financial circumstances of individual trade receivables at the balance sheet date. The Group holds no collateral against these receivables at the balance sheet date.
The following table provides an analysis of trade and other receivables that were past due at 31 October 2010 and 31 October 2009 but against which no provision has been made. The Group believes that the balances are ultimately recoverable based on a review of past payment history and the current financial status of the customers.
Group Company
2010 2009 2010 2009
£ £ £ £
Up to 3 months 127,688 100,525 190,568 144,488
3 to 6 months - - - -
127,688 100,525 190,568 144,488

28
Lo-Q plc Notes to the Consolidated Financial Statements for the year ended 31 October 2010
CAPITAL RISK MANAGEMENT The Group’s objectives when managing capital are to safeguard the Group’s ability to continue as a going concern in order to provide returns for shareholders and benefits for other stakeholders and to maintain an optimal capital structure to reduce the cost of capital. In order to maintain or adjust the capital structure, the Group may adjust the amount of dividends paid to shareholders, return capital to shareholders, issue new shares or sell assets to reduce debt. FOREIGN CURRENCY EXPOSURE The Group has overseas operations in the USA, Canada, Italy and Australia and as such is exposed to the risk of foreign currency fluctuations. The main operating currencies of its operations are in Sterling, US Dollars, Canadian Dollars and Euros. The Group's currency exposure comprises the monetary assets and liabilities of the Group that are not denominated in the operating or 'functional' currency of the operating unit involved. At the period end Lo-Q plc, which reports in Sterling had bank balances of £1,056,894 (2009 - £992,579) denominated in US Dollars, £32,918 (2009 - £335,455) denominated in Canadian Dollars and £333,277 (2009 - £72,258) in Euros. The Group manages risk by its subsidiaries matching revenue and expenditure in their local currency wherever possible. The Group tries to keep foreign inter company balances as low as possible to avoid translation adjustments. Given the nature of the Groups’ operations and their management of foreign currency exposure they limit the potential down side risk as far as practicably possible. To show the impact of the fluctuation of the USD exchange rate on the Group financial statements, the table below shows how the period ended 31 October 2010 results would have been impacted by exchange rates of +/-$0.10.
2010 2009
Actual Actual
$1.5953 $1.4953 $1.6903 $1.603:£1 $1.503:£1 $1.703:£1
£ £ £
Group net assets 7,259,821 7,674,354 7,455,515 5,302,534 5,479,571 5,148,400
Group turnover 20,304,048 20,816,930 18,643,740 17,295,343 18,035,577 16,177,351
Group profit for the year 1,872,509 2,068,021 1,638,628 1,895,072 2,072,109 1,740,938
The Groups policy is to utilise forward contracts where appropriate. The Group substantially managed its exposure in 2010 by entering into GBP/USD forward contracts to mitigate the risk of foreign currency fluctuation. There were no forward contacts outstanding at 31 October 2010 (2009: £662,690). The fair value of a forward contract is considered equal to the value paid.

29
Lo-Q plc Notes to the Consolidated Financial Statements for the year ended 31 October 2010 3. BUSINESS AND GEOGRAPHICAL SEGMENTS
Segmental analysis The Group’s operating segments under IFRS have been determined with reference to the information presented in the management accounts reviewed by the Board of Directors. The principle revenue generating activity of the Group is the operation of virtual queuing technologies for a theme park or other attraction. The Group has entered into agreements with theme park operators to allow theme park or attraction guests to make ride and show reservations when they visit a theme park or other attraction.
The sale of the technology and infrastructure used within the theme park or attraction to allow guests to make these ride or show reservations is a related revenue stream to the Group as typically the Group will enter into sale and leaseback transactions to finance the equipment used within a theme park or attraction. The Board considers that given the scale and nature of its present operations, it currently has a single operating and therefore reportable segment: Rentals to guests, where the theme park or attraction operates the Group’s products and the related sale of the system to third party lessors of the equipment and infrastructure installed in that park or attraction.
The Groups revenues, costs, assets, liabilities, currency exposure and cash flows are therefore totally attributable to this segment. The definition and reporting of segments will be assessed as the Group develops the relative scale or number of operating segments. Entity Wide Disclosures Analyses of the Groups external revenues and non current assets by geographical location are detailed below:
Revenue Non Current Assets
2010
12 Months 2009
10 Months 2010
2009
£ £ £ £
UK 612,211 1,480,201 1,310,941 766,462
Other Europe 317,756 113,582 41,787 56,221
Australia 93,393 51,579 - 82,532
USA and Canada 19,280,688 15,649,981 49,606 33,926
20,304,048 17,295,343 1,402,334 939,141
Revenue generated in each of the geographical locations is generally in the local currency of the theme park or attraction based in that location. Major Customers The Group has entered into agreements with theme parks, theme park groups and attractions to operate the product in single or multiple theme parks or attractions within the theme park group. The ultimate revenue of the business is derived from theme park or attraction guest rentals and no single guest forms a significant proportion of the revenue of the Group. However, the ability to generate guest rentals is fully dependant on the Group maintaining and developing agreements with theme parks or attraction owners to operate the Q-bot or Q-txt product. The Group does have an agreement with a single theme park group where sales to guests of that theme park group account for a significant and material amount of total revenue of the Group.

30
Lo-Q plc Notes to the Consolidated Financial Statements for the year ended 31 October 2010
4. EMPLOYEES AND DIRECTORS
2010
12 months 2009
10 months
£ £
Wages and Salaries 3,004,467 2,483,814
Social security costs 317,908 271,223
Defined contribution pension costs 45,749 32,581
Share based payment transactions 42,000 41,541
3,410,124 2,829,159
The average monthly number of employees, by activity, during the year was made up as follows:
2010
12 months 2009
10 months
Operations 11 12
Research & Development 10 7
Sales 3 2
Finance & Administration 11 11
Seasonal Staff 179 198
214 230
Summary of Directors emoluments
2010 2009 2010 2009
Salary Fees(1) Bonus Other Total
10 MonthsTotal
Pension Contri-butions
Pension Contri-butions
£ £ £ £ £ £ £ £ Non - Executive Directors
Anthony Bone (1) - 24,500 - - 24,500 19,125 - -
John Lillywhite (1) - 19,500 - - 19,500 15,500 - -
Executive Directors
John Alder (2,3) 99,560 - 15,603 9,418 124,582 34,673 5,431 769
Tom Burnet (4) 14,667 - - 23 14,690 - 1,107 -
Paul Cassar (3) 77,000 - 9,820 679 87,499 32,797 5,600 1,200
Steve Drake 104,500 - 11,721 481 116,702 100,493 7,440 5,533
Jeff McManus (1,5) 84,954 16,250 - - 101,204 95,000 3,458 4,000
Colin Robertson 104,500 - 12,916 472 117,888 100,918 6,253 6,253
Leonard Sim 109,175 - 12,700 1,786 123,661 106,817 7,940 5,950 (1) Fee Payments in respect of the services provided by Jeff McManus, John Lillywhite and Anthony Bone were
paid to Jeff McManus Ltd, Barnwell Ltd and IXXI Ltd respectively. (2) John Alder is a USA resident and is part of the Lo-Q Inc healthcare program (3) Appointed 3 August 2009. (4) Appointed 4 October 2010. (5) Resigned 21 July 2010.

31
Lo-Q plc Notes to the Consolidated Financial Statements for the year ended 31 October 2010
Share Option Scheme The share options of the directors are set out below:
31 October 2009
Exercised in the period
Leavers 31 October 2010
Exercise Price
Date from which
Exercisable
Expiry Date
S Drake 4,903 - 4,903 100.5p 22/10/2004 21/10/2011 6,018 - 6,018 18p 08/10/2003 07/10/2012 100,000 - - 100,000 25p (1) (1) J McManus 100,000 (100,000) - - 25p - - 180,000 - (180,000) - 38.5p (3) (3) C Robertson 100,000 (100,000) - - 25p (1) (1) 100,000 (50,000) - 50,000 25p 11/04/2009 10/04/2019 L Sim 100,000 - - 100,000 25p (1) (1) J Alder 15,000 - - 15,000 28.5p 30/09/2009 30/09/2018 75,000 - - 75,000 57.5p (2) (2) P Cassar 17,604 - - 17,604 100.5p 22/10/2004 21/10/2011 100,000 - - 100,000 25p (1) (1)
(1) Options vest in four equal tranches on the 1
st, 2
nd, 3
rd and 4
th anniversaries of the grant, subject to the
achievement of performance targets for the financial years 2008, 2009, 2010 and 2011 and expire on the 10th
anniversary of the grant. (2) Options vest in three equal tranches on the 1
st, 2
nd and 3
rd anniversaries of the grant, subject to the
achievement of performance targets for the financial years 2009, 2010 and 2011 and expire on the 10th
anniversary of the grant. (3) Options vest in four tranches (three tranches of 50,000 Shares and one tranche of 30,000) subject to the
achievement of certain performance targets in relation to the average mid-market price of the Company’s shares, on or before 31 December 2010.

32
Lo-Q plc Notes to the Consolidated Financial Statements for the year ended 31 October 2010 5. NET FINANCE INCOME
2010 2009
12 Months
£ 10 Months
£
Finance income:
Bank interest received 7,203 10,061
Finance costs:
Bank interest (16) (27)
Net finance income 7,187 10,034
6. PROFIT BEFORE TAX
The profit before tax is stated after charging/(crediting)
2010 2009
12 Months
£ 10 Months
£
Hire of plant and machinery 3,210 2,834
Other operating leases 131,690 86,512
Depreciation - owned assets 115,198 24,593
Intellectual Property Rights amortisation 41,807 25,202
Development costs amortisation 210,317 110,599
Auditors' remuneration 23,150 21,550
Auditors' remuneration for non audit work 4,550 6,900
Foreign exchange differences 35,950 (111,362)
Auditors’ Remuneration
During the period the following services were obtained from the Group's auditor at a cost detailed below
2010 2009
12 Months
£ 10 Months
£
Audit Services
- Fees Payable to Company's auditor of the parent Company and
consolidated accounts 21,650 20,000
Non Audit Service
- Review of interim accounts 1,500 1,550
- Other services pursuant to legislation 950 4,250
- Tax compliance and advisory service 3,600 2,650
27,700 28,450
33
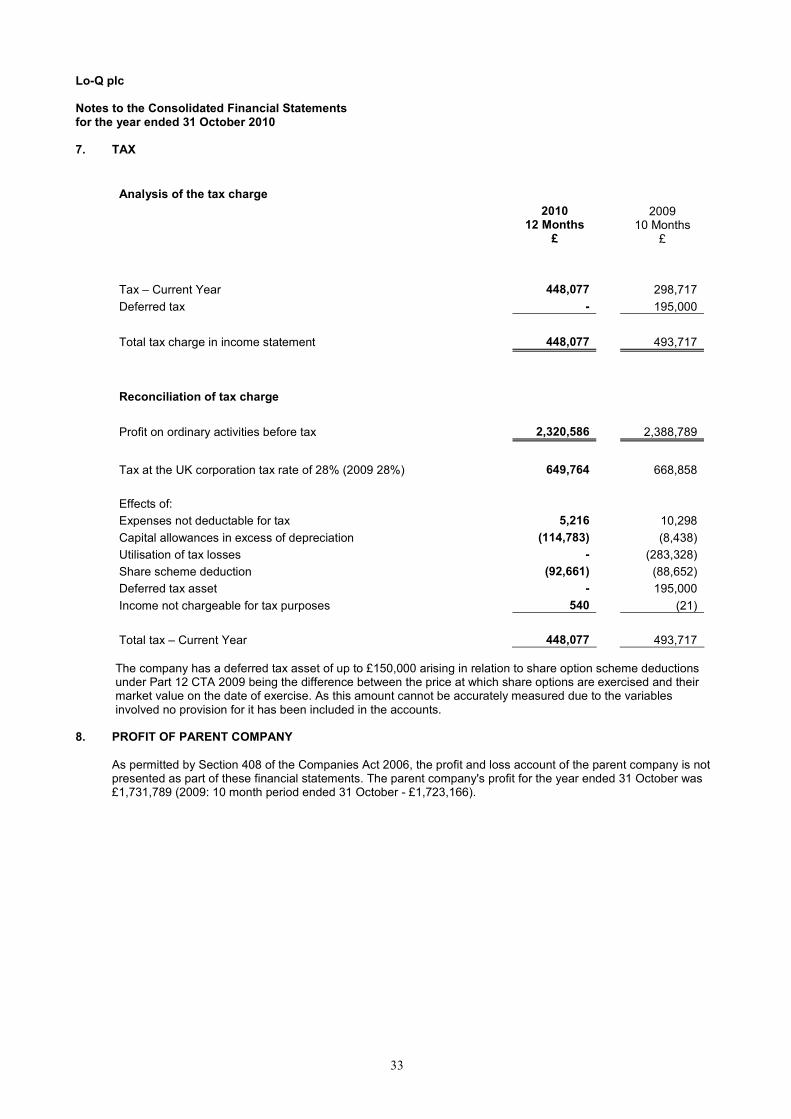
Lo-Q plc Notes to the Consolidated Financial Statements for the year ended 31 October 2010 7. TAX
Analysis of the tax charge
2010 2009
12 Months
£ 10 Months
£
Tax – Current Year 448,077 298,717
Deferred tax - 195,000
Total tax charge in income statement 448,077 493,717
Reconciliation of tax charge
Profit on ordinary activities before tax 2,320,586 2,388,789
Tax at the UK corporation tax rate of 28% (2009 28%) 649,764 668,858
Effects of:
Expenses not deductable for tax 5,216 10,298
Capital allowances in excess of depreciation (114,783) (8,438)
Utilisation of tax losses - (283,328)
Share scheme deduction (92,661) (88,652)
Deferred tax asset - 195,000
Income not chargeable for tax purposes 540 (21)
Total tax – Current Year 448,077 493,717 The company has a deferred tax asset of up to £150,000 arising in relation to share option scheme deductions under Part 12 CTA 2009 being the difference between the price at which share options are exercised and their market value on the date of exercise. As this amount cannot be accurately measured due to the variables involved no provision for it has been included in the accounts.
8. PROFIT OF PARENT COMPANY
As permitted by Section 408 of the Companies Act 2006, the profit and loss account of the parent company is not presented as part of these financial statements. The parent company's profit for the year ended 31 October was £1,731,789 (2009: 10 month period ended 31 October - £1,723,166).

34
Lo-Q plc Notes to the Consolidated Financial Statements for the year ended 31 October 2010 9. EARNINGS PER SHARE
Basic earnings per share is calculated by dividing the earnings attributable to ordinary shareholders by the weighted average number of ordinary shares outstanding during the period. Diluted earnings per share is calculated by dividing the net profit attributable to ordinary shareholders after adjustments for instruments that dilute basic earnings per share by the weighted average of ordinary shares outstanding during the year (adjusted for the effects of dilutive instruments). The following reflects the income and share data used in the total operations and diluted earnings per share computations.
2010
Weighted Per -share
Earnings average amount
£ number pence
12 Months of
shares
Basic EPS
Earnings attributable to ordinary shareholdings 1,872,509 16,014,856 11.69
Effect of dilutive securities
Options 663,776
Diluted EPS
Adjusted earnings 1,872,509 16,678,632 11.23
2009
Weighted Per -share
Earnings average amount
£ number pence
10 Months of
shares
Basic EPS
Earnings attributable to ordinary shareholdings 1,895,072 15,596,756 12.15
Effect of dilutive securities
Options 949,332
Diluted EPS
Adjusted earnings 1,895,072 16,546,088 11.45

35
Lo-Q plc Notes to the Consolidated Financial Statements for the year ended 31 October 2010 10. INTANGIBLE ASSETS
Group Intellectual
Patent Property Development
Costs Rights Costs Totals
£ £ £ £
COST OR VALUATION
At 1 November 2009 - 159,492 831,496 990,988
Additions 203,125 - 538,127 741,252
At 31 October 2010 203,125 159,492 1,369,623 1,732,240
AMORTISATION
At 1 November 2009 - 50,476 225,870 276,346
Amortisation for year 9,909 31,898 210,317 252,124
At 31 October 2010 9,909 82,374 436,187 528,470
NET BOOK VALUE
At 31 October 2010 193,216 77,118 933,436 1,203,770
At 31 October 2009 - 109,016 605,626 714,642
Company Intellectual
Patent Property Development
Costs Rights Costs Totals
£ £ £ £
COST OR VALUATION
At 1 November 2010 - 159,492 830,710 990,202
Additions 203,125 - 538,127 741,252
At 31 October 2010 203,125 159,492 1,368,837 1,731,454
AMORTISATION
At 1 November 2010 - 50,476 225,516 275,992
Amortisation for year 9,909 31,898 210,131 251,938
At 31 October 2010 9,909 82,374 435,647 527,930
NET BOOK VALUE
At 31 October 2010 193,216 77,118 933,190 1,203,524
At 31 October 2009 - 109,016 605,194 714,210

36
Lo-Q plc Notes to the Consolidated Financial Statements for the year ended 31 October 2010
INTANGIBLE ASSETS
Group Intellectual
Property Development
Rights Costs Totals
£ £ £
COST OR VALUATION
At 1 January 2009 126,367 553,623 679,990
Additions 33,125 277,873 310,998
At 31 October 2009 159,492 831,496 990,988
AMORTISATION
At 1 January 2009 25,274 115,271 140,545
Amortisation for Period 25,202 110,599 135,801
At 31 October 2009 50,476 225,870 276,346
NET BOOK VALUE
At 31 October 2009 109,016 605,626 714,642
At 31 December 2008 101,093 438,352 539,445
Company Intellectual
Property Development
Rights Costs Totals
£ £ £
COST OR VALUATION
At 1 January 2009 126,367 552,837 679,204
Additions 33,125 277,873 310,998
At 31 October 2009 159,492 830,710 990,202
AMORTISATION
At 1 January 2009 25,274 115,076 140,350
Amortisation for Period 25,202 110,440 135,642
At 31 October 2009 50,476 225,516 275,992
NET BOOK VALUE
At 31 October 2009 109,016 605,194 714,210
At 31 December 2008 101,093 437,761 538,854

37
Lo-Q plc Notes to the Consolidated Financial Statements for the year ended 31 October 2010 11. PROPERTY, PLANT, EQUIPMENT AND INSTALLED SYSTEMS
Group
Installed Plant and Office Furniture
Systems machinery Equipment & fixtures Totals
£ £ £ £ £
COST
At 1 November 2009 15,857 33,516 187,046 25,777 262,196
Additions 159,194 1,155 67,111 2,150 229,610
At 31 October 2010 175,051 34,671 254,157 27,927 491,806
DEPRECIATION
At 1 November 2009 1,507 32,302 143,387 20,924 198,120
Charge for the year 77,299 1,179 34,617 2,103 115,198
At 31 October 2010 78,806 33,481 178,004 23,027 313,318
NET BOOK VALUE
At 31 October 2010 96,245 1,190 76,153 4,900 178,488
At 31 October 2009 14,350 1,214 43,659 4,853 64,076
Company Installed Plant and Office Furniture
Systems machinery Equipment & fixtures Totals
£ £ £ £ £
COST
At 1 November 2009 15,857 8,257 141,126 21,321 186,561
Additions 146,037 1,155 44,940 2,150 194,282
At 31 October 2010 161,894 9,412 186,066 23,471 380,843
DEPRECIATION
At 1 November 2009 1,507 6,962 111,417 18,943 138,829
Charge for the year 64,142 1,179 26,509 980 92,810
At 31 October 2010 65,649 8,141 137,926 19,923 231,639
NET BOOK VALUE
At 31 October 2010 96,245 1,271 48,140 3,548 149,204
At 31 October 2009 14,350 1,295 29,709 2,378 47,732

38
Lo-Q plc Notes to the Consolidated Financial Statements for the year ended 31 October 2010 PROPERTY, PLANT, EQUIPMENT AND INSTALLED SYSTEMS
Group
Installed Plant and Office Furniture
Systems machinery Equipment & fixtures Totals
£ £ £ £ £
COST
At 1 January 2009 - 33,516 168,344 23,977 225,837
Additions 15,857 - 18,702 1,800 36,359
At 31 October 2009 15,857 33,516 187,046 25,777 262,196
DEPRECIATION
At 1 January 2009 - 31,252 122,799 19,476 173,527
Charge for the period 1,507 1,050 20,588 1,448 24,593
At 31 October 2009 1,507 32,302 143,387 20,924 198,120
NET BOOK VALUE
At 31 October 2009 14,350 1,214 43,659 4,853 64,076
At 31 December 2008 - 2,264 45,545 4,501 52,310
Company Installed Plant and Office Furniture
Systems machinery Equipment & fixtures Totals
£ £ £ £ £
COST
At 1 January 2009 - 8,257 128,746 21,321 158,324
Additions 15,857 - 12,380 - 28,237
At 31 October 2009 15,857 8,257 141,126 21,321 186,561
DEPRECIATION
At 1 January 2009 - 5,912 97,288 18,133 121,333
Charge for the period 1,507 1,050 14,129 810 17,496
At 31 October 2009 1,507 6,962 111,417 18,943 138,829
NET BOOK VALUE
At 31 October 2009 14,350 1,295 29,709 2,378 47,732
At 31 December 2008 - 2,345 31,458 3,188 36,991

39
Lo-Q plc Notes to the Consolidated Financial Statements for the year ended 31 October 2010 12. INVESTMENTS Company Investment in Subsidiaries £ COST At 1 November 2009 and 31 October 2010 735
NET BOOK VALUE At 31 October 2010 735
At 31 October 2009 735
Name Country of incorporation % Ownership interest % Voting Rights Lo-Q Inc United States of America 100 100 Lo-Q Service Canada Inc Canada 100 100 Lo-Q Trustees Limited United Kingdom 100 100
The trade for both Lo-Q Inc and Lo-Q Service Canada Inc is that of the application of virtual queue technologies
Lo-Q Trustees Limited is dormant.
40
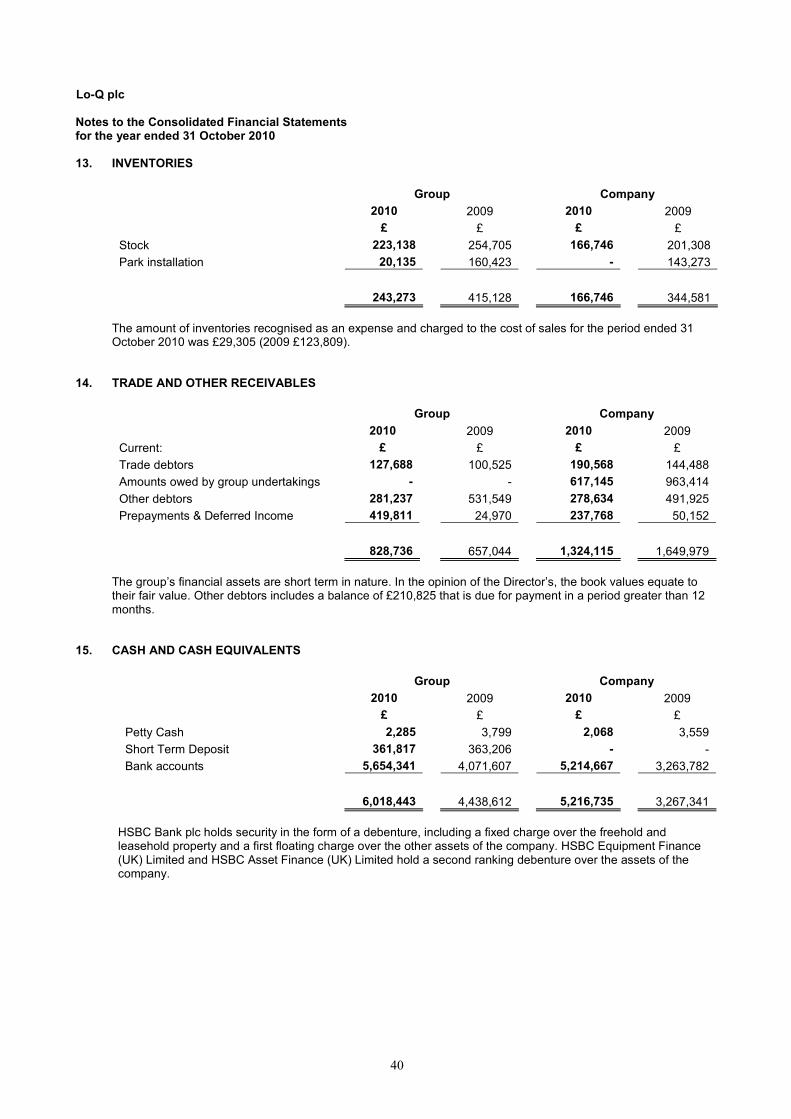
Lo-Q plc Notes to the Consolidated Financial Statements for the year ended 31 October 2010 13. INVENTORIES
Group Company
2010 2009 2010 2009
£ £ £ £
Stock 223,138 254,705 166,746 201,308
Park installation 20,135 160,423 - 143,273
243,273 415,128 166,746 344,581
The amount of inventories recognised as an expense and charged to the cost of sales for the period ended 31 October 2010 was £29,305 (2009 £123,809).
14. TRADE AND OTHER RECEIVABLES
Group Company
2010 2009 2010 2009
Current: £ £ £ £
Trade debtors 127,688 100,525 190,568 144,488
Amounts owed by group undertakings - - 617,145 963,414
Other debtors 281,237 531,549 278,634 491,925
Prepayments & Deferred Income 419,811 24,970 237,768 50,152
828,736 657,044 1,324,115 1,649,979
The group’s financial assets are short term in nature. In the opinion of the Director’s, the book values equate to their fair value. Other debtors includes a balance of £210,825 that is due for payment in a period greater than 12 months.
15. CASH AND CASH EQUIVALENTS
Group Company
2010 2009 2010 2009
£ £ £ £
Petty Cash 2,285 3,799 2,068 3,559
Short Term Deposit 361,817 363,206 - -
Bank accounts 5,654,341 4,071,607 5,214,667 3,263,782
6,018,443 4,438,612 5,216,735 3,267,341
HSBC Bank plc holds security in the form of a debenture, including a fixed charge over the freehold and leasehold property and a first floating charge over the other assets of the company. HSBC Equipment Finance (UK) Limited and HSBC Asset Finance (UK) Limited hold a second ranking debenture over the assets of the company.

41
Lo-Q plc Notes to the Consolidated Financial Statements for the year ended 31 October 2010 16. TRADE AND OTHER PAYABLES
Group Company
Current: 2010 2009 2010 2009
£ £ £ £
Trade creditors 185,263 27,462 258,624 43,844
Social security and other taxes 44,980 58,689 41,510 57,016
Sundry creditors 1,123 1,350 34 559
Accruals 769,085 563,948 320,625 259,773
VAT 4,667 47,818 4,723 46,916
1,005,118 699,267 625,516 408,108
The Group financial liabilities are short-term in nature. In the opinion of the directors the book values equate to their fair value.
17. CALLED UP SHARE CAPITAL Authorised: Number: Class: Nominal 2010 2009 Value: £ £ £ 1,100,000,000 Ordinary Share Capital £0.01 11,000,000 11,000,000
Allotted, issued and fully paid: Number: Class: Nominal 2010 2009 Value: £ £ £ 16,232,667 Ordinary Share Capital £0.01 162,327 158,917 (2009 – 15,891,667)
During the period 341,000 shares with a nominal value of £3,410 were allotted and issued as part of existing share options being exercised. These are detailed in note 21.

42
Lo-Q plc Notes to the Consolidated Financial Statements for the year ended 31 October 2010
Share Option Schemes
At 31 October 2010 the following share options were outstanding in respect of the ordinary shares:
Scheme Number of Shares
Period of option Price per share
EMI Scheme 43,900 22 January 2002 to 21 October 2011 100.5p 12,800 8 October 2003 to 7 October 2012 18.0p 15,000 6 April 2005 to 5 April 2014 6.0p 40,000 29 March 2006 to 28 March 2015 3.5p 14,500 9 May 2007 to 8 may 2016 8.25p 350,000 (1) 25.0p 70,000 25 June 2010 to 24 June 2019 57.5p US Scheme 4,755 22 October 2002 to 21 October 2011 100.5p 24,000 6 April 2005 to 5 April 2014 6.0p 50,000 29 March 2006 to 28 March 2015 3.5p 26,500 9 May 2007 to 8 May 2016 8.25p 15,000 30 September 2009 to 29 September 2018 28.5p 75,000 (2) 57.5p
(1) Options vest in four equal tranches on the 1st, 2
nd, 3
rd and 4
th anniversaries of the grant, subject to the
achievement of performance targets for the financial years 2008, 2009, 2010 and 2011 and expire on the 10th
anniversary of the grant. (2) Options vest in three equal tranches on the 1
st, 2
nd and 3
rd anniversaries of the grant, subject to the
achievement of performance targets for the financial years 2009, 2010 and 2011 and expire on the 10th
anniversary of the grant

43
Lo-Q plc Notes to the Consolidated Financial Statements for the year ended 31 October 2010 18. PENSION COMMITMENTS
The Group operates a defined contribution pension scheme in the UK and USA. The assets of each scheme are held separately from those of the Group in an independently administered fund. The pension charge represents contributions payable by the Group to the fund and amounted to £51,180 (2009 - £32,581). Contributions amounting to £nil (2009 - £nil) were payable to the fund and are included in creditors.
19. RELATED PARTY DISCLOSURES
Ultimate controlling party There is no ultimate controlling party. Subsidiaries Management charges of £3,359,242 (2009 10 months - £2,169,127) were received from Lo-Q Inc and £326,062 (2009 10 months- £167,419) from Lo-Q Service Canada Inc during the period, both 100% subsidiaries of Lo-Q plc. The US and the Canadian subsidiaries owed the parent company £410,226 and £206,919 respectively at 31 October 2010. Other related parties IXXI Limited, a company in which Anthony Bone, a Lo-Q plc director, is a director invoiced the company in respect of directors fees £24,500 (2009 - £19,125) of which £nil (2009 - £2,104) was outstanding at the period end.
Barnwell Limited, a company in which John Lillywhite, a Lo-Q plc director, is a director invoiced the company in respect of directors fees £19,500 (2009 - £15,500) of which £nil (2009 - £1,533) was outstanding at the period end. All of the above outstanding amounts are included within trade creditors. Key management compensation The key management of the company staff are considered to be the directors and their remuneration is as follows:
2010
12 Months 2009
10 Months Director's remuneration 730,226 505,322
Director's contribution to pension scheme 37,229 23,706
Share based payments 40,192 35,132
807,647 564,160

44
Lo-Q plc Notes to the Consolidated Financial Statements for the year ended 31 October 2010 20. RECONCILIATION OF MOVEMENTS IN SHAREHOLDERS' EQUITY
Group 2010
12 Months 2009
10 Months
£ £
Profit for the financial year / period 1,872,509 1,895,072
Issued Share Capital 3,410 5,706
Share based payment 42,000 41,541
Share Premium 80,333 51,086
Foreign Exchange (40,965) (34,628)
Net addition to shareholders' funds 1,957,287 1,958,777
Opening shareholders' funds 5,302,534 3,343,757
Closing shareholders' funds 7,259,821 5,302,534
Company 2010
12 Months 2009
10 Months
£ £
Profit for the financial year / period 1,731,789 1,723,166
Issued Share Capital 3,410 5,706
Share Premium 80,333 51,086
Share based payment 42,000 41,541
Net addition to shareholders' funds 1,857,532 1,821,499
Opening shareholders' funds 5,369,322 3,547,823
Closing shareholders' funds 7,226,854 5,369,322

45
Lo-Q plc Notes to the Consolidated Financial Statements for the year ended 31 October 2010 21. SHARE-BASED PAYMENT TRANSACTIONS
Equity settled share option schemes For details of share option schemes in place during the year see note 17. Details of the number of share options and the weighted average exercise price (WAEP) outstanding during the year are as follows:
2010 2009
No WAEP(pence) No WAEP(pence) Outstanding at the beginning of the period 1,269,955 30.90 1,558,021 21.82
Granted during the year - - 160,000 57.50
Exercised during the year (341,000) 19.34 (445,566) 5.31
Leavers (187,500) 39.26 (2,500) 95.15
Outstanding at the end of the year 741,455 31.72 1,269,955 30.95
Exercisable at the end of the year 491,455 21.10 632,455 9.34
The weighted average share price at the date of exercise for share options exercised during the period was £1.029 (2009 - £0.758). The fair values were calculated using the Black-Scholes valuation method. The inputs to the model were as follows:
2010 2009
Weighted average share price (pence) 22.26 22.26
Expected volatility % 65.00 65.00
Expected life 2.00 2.00
Risk free rate (%) 3.60 3.60
Dividend yield (%) - -
Expected volatility was determined by calculating the historic volatility of the Groups share price over the period since flotation.
22. NOTES TO CASH FLOW - RECONCILIATION OF PROFIT BEFORE TAX TO CASH GENERATED FROM OPERATIONS Group
2010 12 Months
2009 10 Months
£ £
Profit before tax 2,320,586 2,388,789
Depreciation charges 367,322 160,394
Share based payment 42,000 41,541
Foreign exchange (40,965) (34,628)
Finance costs 16 27
Finance income (7,203) (10,061)
2,681,756 2,546,062
Decease/(Increase) in inventories 171,855 (108,104)
Increase in trade and other receivables (171,692) (584,229)
Increase in trade and other payables 305,851 319,103
Cash generated from operations 2,987,770 2,172,832

46
Lo-Q plc Notes to the Consolidated Financial Statements for the year ended 31 October 2010
Company 2010
12 Months 2009
10 Months
£ £
Profit before tax 2,120,149 2,165,314
Depreciation charges 344,748 153,138
Share based payment 42,000 41,541
Finance costs 16 27
Finance income (5,549) (8,851)
2,501,364 2,351,169
Decrease/(Increase) in inventories 177,835 (231,029)
Decrease/(Increase) in trade and other receivables 325,864 (592,595)
Increase in trade and other payables 217,408 117,674
Cash generated from operations 3,222,471 1,645,219
RECONCILIATION OF NET CASH FLOW TO MOVEMENTS IN NET FUNDS AND ANALYSIS OF NET FUNDS
The amounts disclosed on the cash flow statement in respect of cash and cash equivalents are in respect of these balance sheet amounts.
Group
At 1 November
2009 Cash Flow Exchange At 31 October
2010
movement
£ £ £ £
Cash in hand & at bank 4,438,612 1,620,796 (40,965) 6,018,443
4,438,612 1,620,796 (40,965) 6,018,443
Company
At 1 November
2009 Cash Flow Exchange At 31 October
2010
movement
£ £ £ £
Cash in hand & at bank 3,267,341 1,949,394 - 5,216,735
3,267,341 1,949,394 - 5,216,735

47
Lo-Q plc Notes to the Consolidated Financial Statements for the year ended 31 October 2010
23. CONTINGENT LIABILITIES
The Company is in the process of defending an Employment Tribunal claim for unfair dismissal from an ex-director who left during the year. The matter is being handled by the company's legal advisers and the tribunal has not yet commenced. The information usually required by IAS 37 is not disclosed on the grounds that it may prejudice the outcome of the litigation. No provision has been made in respect of the claim
24. COMMITMENTS UNDER OPERATING LEASES
Total of future minimum operating lease payments under non-cancellable operating leases:
Group 2010 2009
£ £
Land & Buildings
Less than one year 39,164 120,799
Within 2 to 5 years 1,813 30,454
40,977 151,253
Other
Less than one year 495,502 855,243
Within 2 to 5 years 506,878 699,734
1,002,381 1,554,977
Company
Land & Buildings
Less than one year 26,813 101,360
Within 2 to 5 years 1,813 28,626
28,626 129,986
Other
Less than one year 466,916 361,845
Within 2 to 5 years 506,878 699,734
973,794 1,061,579
Operating leases within ‘Land & Buildings’ include the leases of company and Group offices. Operating leases within ‘Other’ principally relate to the leaseback element of the Sale & Leaseback transaction relating to the sale of equipment to theme parks as installations.