Embed Size (px)
Citation preview

Our Food Story:
Understanding the market dynamics of fruit and vegetable production,
distribution and produce outlets in Northland
Peter Bruce-Iri Eloise Neeley
LocalFoodNorthland
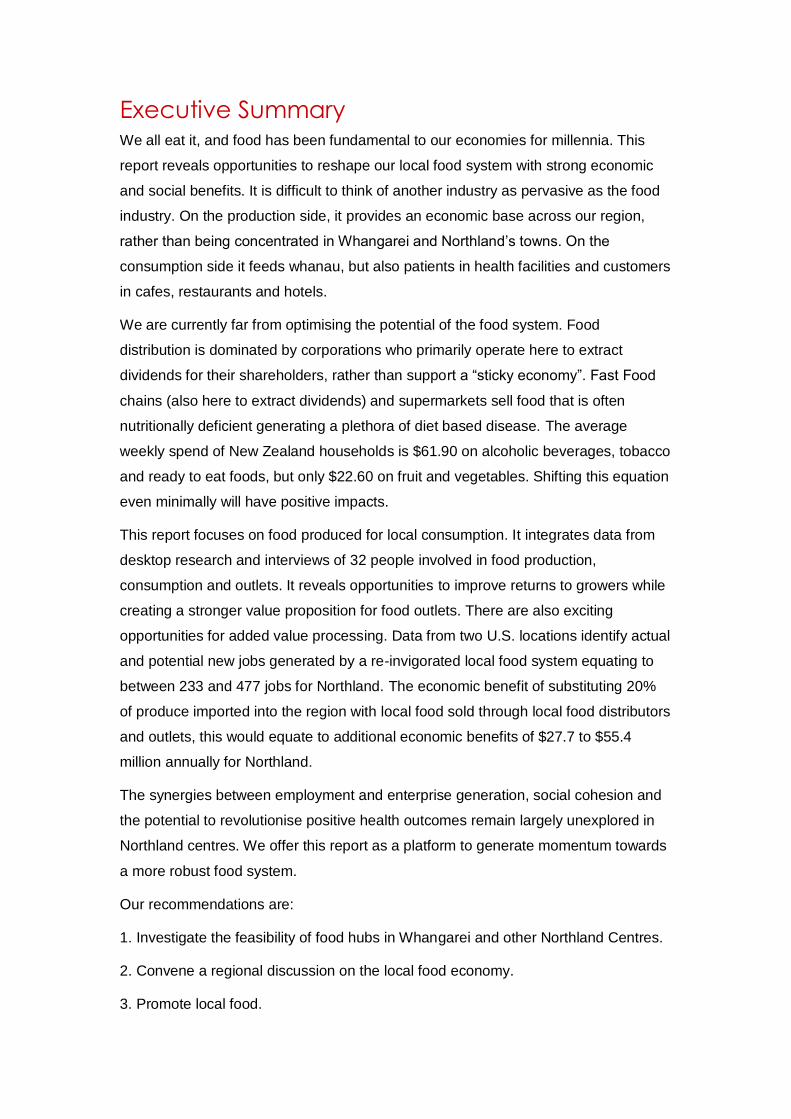
Executive Summary We all eat it, and food has been fundamental to our economies for millennia. This
report reveals opportunities to reshape our local food system with strong economic
and social benefits. It is difficult to think of another industry as pervasive as the food
industry. On the production side, it provides an economic base across our region,
rather than being concentrated in Whangarei and Northland’s towns. On the
consumption side it feeds whanau, but also patients in health facilities and customers
in cafes, restaurants and hotels.
We are currently far from optimising the potential of the food system. Food
distribution is dominated by corporations who primarily operate here to extract
dividends for their shareholders, rather than support a “sticky economy”. Fast Food
chains (also here to extract dividends) and supermarkets sell food that is often
nutritionally deficient generating a plethora of diet based disease. The average
weekly spend of New Zealand households is $61.90 on alcoholic beverages, tobacco
and ready to eat foods, but only $22.60 on fruit and vegetables. Shifting this equation
even minimally will have positive impacts.
This report focuses on food produced for local consumption. It integrates data from
desktop research and interviews of 32 people involved in food production,
consumption and outlets. It reveals opportunities to improve returns to growers while
creating a stronger value proposition for food outlets. There are also exciting
opportunities for added value processing. Data from two U.S. locations identify actual
and potential new jobs generated by a re-invigorated local food system equating to
between 233 and 477 jobs for Northland. The economic benefit of substituting 20%
of produce imported into the region with local food sold through local food distributors
and outlets, this would equate to additional economic benefits of $27.7 to $55.4
million annually for Northland.
The synergies between employment and enterprise generation, social cohesion and
the potential to revolutionise positive health outcomes remain largely unexplored in
Northland centres. We offer this report as a platform to generate momentum towards
a more robust food system.
Our recommendations are:
1. Investigate the feasibility of food hubs in Whangarei and other Northland Centres.
2. Convene a regional discussion on the local food economy.
3. Promote local food.

Table of Contents
Executive Summary ......................................................................................... ii
Introduction ...................................................................................................... 1
Part one: The Food system and value network ................................................ 2 Food systems in Northland .................................................................................... 2
Food chains ........................................................................................................... 4
Part two: Production and market dynamics in Northland ................................. 7 1. Production ......................................................................................................... 7
2. Consumption in Northland ............................................................................... 10
3. Market dynamic insights from growers ............................................................. 12
Discussion ........................................................................................................... 17
Case study 1: Tamarillo Growers Association ...................................................... 19
Part three: Distribution systems ..................................................................... 21 1. Grower to customer distribution ....................................................................... 21
2. Co-operatives, markets and “vege box” initiatives ............................................ 21
3. Corporate distributors ...................................................................................... 22
Case study 2: New World Remuera ..................................................................... 23
Gleanings from interviewees ................................................................................ 24
Case study 3: Northland Natural Foods Co-operative (NNFC) ............................. 25
Case study 4: Fresh Food Collective ................................................................... 26
Case Study 5: Local Distributor Penguin .............................................................. 27
Part four: Outlets ............................................................................................ 29 Cafes, restaurants, takeaways, kitchens and caterers ......................................... 29
Food retailers ....................................................................................................... 29
Gleanings from buyer interviewees ...................................................................... 29
Part five: Reshaping Food Systems ............................................................... 36 Food systems in society 4.0 ................................................................................. 38
Case study 6: the White Dog Café ....................................................................... 39
Economic impacts................................................................................................ 40
Social enterprise as a transitional tool.................................................................. 41
Food systems and health ..................................................................................... 42
Leveraging Internet capabilities to enhance food systems ................................... 44
Food hubs ........................................................................................................... 46
Conclusions and recommendations ............................................................... 51 Recommendations ............................................................................................... 53
Further research .................................................................................................. 54
References .......................................................................................................... 55
Appendix 1: Research Methods ........................................................................... 59
Appendix 2: Household expenditure .................................................................... 61
Research team .................................................................................................... 62

page 1
Introduction
This research is a collaboration between Local Food Northland, and NorthTec. Local
Food Northland is a new organisation established to promote and establish
community-led sustainable food systems for Northland. Amongst its aspirations are
to contribute to a connected and cohesive, prosperous Northland by:
building local resilience back into the Northland economy
stemming the leakage of wealth from the region
rebuilding local economies
addressing food security and poverty at a community level
providing and distributing healthy locally based fresh food at a community
level through a range of channels
enhancing employment opportunities at a local community level
creating stronger supply and processing capability for value-add and export.
Our food systems are very complex. A better understanding of these dynamics is
foundational to enhance any improvements. Initial observations are of a system that
is largely devoid of any system-level planning, enabling the profit-motive to shape the
commercial landscape. This has negative impact on those growers at the base of the
supply chain, and frightening downstream impacts on the health of consumers.
To help us understand the system, we started with desktop analysis as a first step to
developing interview processes for growers, distributors and outlets. These
interviews happened from December 2015 to February 2016 and stimulated themes
for further research. Data analysis and discussion is threaded through each part of
the report.
This report was first distributed as a draft to interviewees as an additional validity
check.
We welcome feedback on the recommendations presented. You can provide
feedback by email to [email protected].

page 2
Part one: The Food system and value network
Food systems in Northland
The Oxford Martin Programme (2015) defines a food system as “all those activities
involving the production, processing, transport and consumption of food”. For the
purposes of this document our focus is on production, distribution and consumer
outlets. In the Northland context, the consumption of produce is also of special
interest to health professionals (Carne & Mancini, 2012).
Along with the issues of sustainability, health, nutrition and food safety, the Oxford
Martin Programme (2015) also recognises governance and economics as important
dimensions of the food system. Northland’s food system appears to have evolved
without any collective conscious design enabling market dynamics to shape it.
In her book, Trading Cultures, Adrienne Puckey (2011) asks how did the Far North
“start out as a bread basket in the late 1700s and become an economic basket case
by the 1900s?” Both Māori and Pākeha have strong gardening heritage. Māori
successfully faced the challenge of adapting tropical crops to Aotearoa and then
centuries later quickly mastered the production of crops introduced by Europeans.
Early European arrivals often depended on Māori food production for their very
survival.
Over 100 years ago my (Peter’s) great-grandfather in Te Kopuru produced his own
milk, eggs and produce, and sold some. For most of the twentieth century, home
gardens and orchards were significant sources of produce. In the first half of the
century, local growers supplied the majority of the retailed produce that could be
grown here.
With the advent of supermarkets and more sophisticated supply systems, the
proportion of locally grown produce has declined as much produce is sourced out of
region.
This trend has disadvantaged local growers. Returns are not much better than they
were 20 years ago in dollar terms, but when inflation adjusted, grower’s returns are
eroded significantly. Consequently, the number of growers in the region has sharply
declined.
Up until the late 1930s, most distribution was local. In 1938 Tom Walder was a
private agent and commission buyer for Whangarei retailers making twice weekly
trips to Auckland. He joined with Auckland’s Turners & Growers to create subsidiary

page 3
company Turners & Walder. Auctions began in 1956 according to Ron Corder (1989,
pg 5 & 6)
…as the protective regulations to rail were removed and with more relaxation
in the regulations to road transport which also coincided with the advent of
supermarkets and the demise of the old greengrocer so did business at these
depots decline with buyers coming to attend the auction at Whangarei.
Now distribution systems are dominated by the supermarket supply chains, South
African company Bidvest and 73% German owned Turners & Growers. Locally
owned distributors Penguin Wholesalers have been operating in Northland for 40
years, remaining steadfast in the face of increasing multinational corporate
competition.
Producers Distributors Outlets
Multinational corporations e.g. Dole
Multinational corporations e.g. Bidvest (South African) and Turners & Growers (Germany)
Multinational Fast Food, McDonalds, Pizza Hut, Subway
Australian supermarket chain (Countdown)
Out of region growers
Local distributors (e.g. Penguin)
NZ owned supermarket chains (Foodstuffs).
Markets using national supply chains
Local growers
Home gardeners
Locally owned retailers
Cooperatives
Growers and farmers markets
Table 1: Examples of producers, distributors and outlets in Northland’s food system
The Supermarket duopoly dominates produce retailing. Countdown is owned by the
Australian owned Progressive Enterprises. The dominant position of supermarkets
has enabled them to dictate terms to growers. Thus, an increasingly globalised food
loca
l fo
od
ch
ain
……
……
….
glo
ba
lised
fo
od c
ha
in

page 4
chain has emerged characterised by power-differences, complexity, “capital
concentration, spatial and temporal independence, dependence on symbols and
reliance on expert systems” (Feagan, 2007, pg 25).
Food chains
Food chains are the food system manifestation of supply chains. Globalised food
chains are long food chains (LFC), while localised food chains are short food chains
(SFC).
SFCs generate closer relationships between producers and consumers enabling the
re-socialising of food. SFC offer consumers food with known provenance and
enhanced quality. Critically, SFCs open opportunities for revitalising rural
communities (Marsden, Banks, & Bristow, 2000). Face to face interactions between
producers and consumers collapse the power-differences inherent in complex,
globalising LFCs. (Feagan, 2007).
A common characteristic, however, is the emphasis upon the type of
relationship between the producer and the consumer in these supply chains,
and the role of this relationship in constructing value and meaning, rather
than solely the type of product itself (Marsden, Banks, & Bristow, 2000, pg
425).
From the 1980s the significance of supply chains in globalised commerce spawned
the development of supply chain management disciplines characterised by the linear
and sequential metaphor of the chain. Another metaphor is the upstream (supplier)
and downstream (customer) characterisation of the supply chain, with its inference of
a one-way flow (Sherer, 2005).
As an example, the home garden is an example of a very short food chain. By
contrast a fast food multinational importing avocado from Mexico typifies a long food
chain.
By contrast, reconceptualising the supply chain as a value chain shifts the focus from
the extraction of value to sharing value. LFCs are typically more extractive.
Participants in the value chain, from the producer through to the retailer strive to
create value, by finding economies in the value chain and delivering greater value to
customers. Some of the created value can be shared among value chain partners.
To achieve this, parties in the value chain need to develop trust, learn to collaborate
and be more transparent. Purchasers tend to develop longer-term relationships with
suppliers rather than pursue the cheapest price.

page 5
Susan Sherer (2005) suggests a move from a supply chain focus to value networks
enabling a fuller expression of the value equation. Reconceptualising the supply
chain as a value network shifts the focus from the exchange of goods and services to
a broader consideration of relevant elements of sustainability, financial, social and
environmental. For example respondents in the Whangarei Growers Market research
found value in the “atmosphere”, social contact, in the freshness of the food and
availability of organic or spray free food (Bruce, Patrick, & Romer, 2014). In this
case, the value network extends to health and health providers, local government
and those promoting Whangarei, and those wanting to support local producers and
the local economy.
The food system, dominated by LFCs has created a food environment deleterious to
health.
Currently takeaways and dairies cluster around schools, particularly in the
poorest neighbourhoods. In fact there are more fast food outlets and
convenience stores (like dairies, whose sales overwhelmingly comprise pies,
soft drinks and sweets) in poor areas generally. Primary schools seem to
attract more stores, although secondary schools were surrounded by higher
levels of unhealthy food advertisements. The upshot of this is that the
average child in Auckland has to walk less than 350 metres from the school
gate to the nearest dairy, and under 400 metres to the nearest fast food
outlet. Given what we know about the impact of sugary, fatty and salty food
on the developing brain, it is hard not to draw a comparison with drug lords
targeting the youngest and most vulnerable members of our society to get
them hooked. It reminds you of the stated goal of one of the largest cola
bottlers in the world, articulated in the 1990s, to ensure that there was cola for
sale within 100 metres of every consumer on earth (Morgan & Simmons,
2013).
Coca Cola’s marketers aspire to make their brand even more ubiquitous. “Through
the stories we tell, we will provoke conversations and earn a disproportionate share
of popular culture” (Forward Marketing, 2012).
Marketers are now using the fragrance of food to attract consumers adding the
olfactory channel to the audio and visual (Michail, 2015).
The environment influences people’s diet. Inuit eat a lot of Arctic wildlife. From a
young age, most of the food children are exposed to in the media is nutritionally
deficient. A 2007 study of television advertising in New Zealand found that 66% of

page 6
food advertisements featured high fat, salt and sugar foods (Jenkin, Wilson, &
Hermanson, 2009). A U.S. study found that 3 to 5 year olds “have emerging
knowledge of brands that are relevant to their lives”. In the U.S. four out of five
children recognise the McDonald’s brand by the time they are three.
As these children enter the adult world, and they become responsible for preparing
food other drivers emerge. In 1953 the first T.V. dinners came on the market in the
United States. A U.S survey found a rapidly increasing number of convenience foods
entering the market. Sixty-one percent of consumers surveyed indicated that
“reduced time” and “less effort” to prepare were the primary reasons for purchasing
convenience foods (McAlister & Cornwell, 2010).
Our food environment features prominent brands, promoted by persuasive
marketing, and an increasing diet of processed and convenience foods. There may
also be an addictive aspect driving consumption. Caroline Davis calls this a “modern
and “toxic” food environment and therein the ubiquitous triggers for over-
consumption” manifesting binge eating disorders (Davis, 2013).
Trenton Smith (of Otago University) and Attila Tasnádi identify deep capture as the
discursive practices of the food industry that shape public opinion in the industry’s
favour. They link this to the obesity epidemic (Smith & Tasnádi, 2014).

page 7
Part two: Production and market dynamics in
Northland This section attempts to first provide an overview of vegetable and fruit production in
New Zealand. Next comes a section on consumption. Most of this data is sourced
through desktop research.
Following this is a section using primary research based on interviews of growers to
help us understand market dynamics.
1. Production
Of four key climatic factors for optimal growth, Northland leads the country in two,
heat units (expressed as degree days) and freedom from ground frosts. Northland
has 551,397ha of arable land (Harmsworth, 1996) with 9,000 ha of elite free draining
soils (Currie, 1986).
Heat units Ground frost days
Rainfall (mm) Sunshine hours
rank rank rank rank
Northland 1 1997 1 2 3 1759 7 2162
BoP 2 1905 3 24 4 1266 3 2420
Hawke’s Bay 3 1807 11 63 12 747 4 2329
Gisborne 4 1748 5 28 8 1029 5 2294
Auckland 5 1736 2 12 6 1142 8 2149
Waikato 6 1518 10 53 5 1192 10 2047
Table 2: Comparison of key climatic data of Northland and selected regions (adapted from Horticulture New Zealand, 2013)
This video from Northland Inc (2005) summarises Northland’s horticultural production
The following three tables summarises the main crops grown here.
Northland (m2)
Auckland (m2)
NZ (m2) Northland as % of NZ production
Tomatoes 108,791 482,674 1,180,883 9.2%
Lettuce/salad greens 21,405 63,107 238,103 9%
Other 20,863 101,668 269,331 7.7%
Cucumbers 17,933 144,404 268,525 6.7%
Table 3: Indoor vegetable production for Northland, Auckland and New Zealand 2012 (Statistics New Zealand, 2013a)
We can assume that Northland’s heat supports strong production of indoor vegetable
crops.

page 8
Northland (ha)
Auckland (ha)
NZ (ha) Northland as % of NZ production
Kumara 1,204 14 1,228 98%
Melons (water, rock) 53 5 273 19.4%
Other 64 220 1,781 3.6%
Pumpkin 31 239 1,048 3.0%
Sweet corn 84 38 4,664 1.8%
Cabbage 7 269 793 0.9%
Cauliflower 7 240 852 0.8%
Broccoli 14 431 1,977 0.7%
Carrots 6 194 2,047 0.3%
Cooking herbs 1 88 314 0.3%
Green beans 2 53 1,186 0.2%
Potatoes 22 1,444 11,578 0.2%
Tomatoes (outdoor) 1 6 669 0.1%
Squash 5* 6501**
Onions 5* 1621 5,718 0.09%
Table 4: Outdoor vegetable production for Northland, Auckland and New Zealand 2012 (Statistics New Zealand, 2013a)
* 2011 figures
** 2014 figures
Given that Northland’s population is 3.6% of the New Zealand population (2013
census figures), using a crude per capita calculation we grow more than enough
kumara and melons for local consumption, but the other main crops, with the
probable exception of sweet corn are undersupplied and probably imported.

page 9
Northland (ha)
Auckland (ha)
NZ (ha) Northland as % of NZ production
Avocados* 1450 3893 37.2%
Mandarins 211 62 691 30.5%
Macadamia 56 65 195 28.7%
Persimmons 28 25 154 18.2%
Olives 201 250 1,657 12.1%
Oranges 76 9 696 10.9%
Tangelos 6 67 9.0%
Other fruit 29 29 396 7.3%
Grapefruit/goldfruit 2 6 32 6.3%
Chestnuts 6 37 142 4.2%
Kiwifruit* 472 12,081 3.9%
Blueberries 21 15 579 3.6%
Strawberries 1 121 220 0.5%
Apples* 25 8417 0.3%
Wine grapes* 82 33761 0.2%
Table 5: Fruit production for Northland, Auckland and New Zealand 2012 (Statistics New Zealand, 2013a)
* 2014 figures from Statistics New Zealand
Northland’s natural assets also support adequate local supplies of most fruits. Apples
are a notable exception.
Northland 1994 Northland 2014 Change
apples 118 25 -93
kiwifruit 715 472 -243
avocados 331 1450 1,119
wine grapes 27 82** 55
citrus 295**
olives 146* 150 4
onions 38 5*** -33
potatoes 102 22** -80
squash 952 5*** -947
totals 2429 2506 -77****
Table 6 from : Comparison of area (ha) planted in selected crops in Northland between 1994 and 29014 (adapted from Statistics New Zealand, 2015)
* 2002 figures
** 2012 figures
*** 2011 figures
**** excluding citrus

page 10
The figures in table 6 indicate limited growth in the area of land in horticultural
production over a period of two decades. A notable exception is the huge increase in
avocado plants. This has been almost balanced by the collapse of squash exports.
No figure was available for citrus in 1994, but anecdotally, areas planted have
declined. Over the same time period the area planted in these crops in New Zealand
grew by 22,280 ha to a total of 80,208 ha - 38% growth (Statistics New Zealand,
2015b).
2. Consumption in Northland
Table 7 and 8 reveal the top selling vegetables and fruits in New Zealand. We can
assume that consumption patterns are similar in Northland.
Rank Comments
1 Potatoes volumes grown in Northland are declining
2 Tomatoes
3 Lettuce
4 Mushrooms very small quantities are grown locally
5 Kumara Northland is the largest producer by far
6 Carrots
7 Capsicums
8 Onions volumes grown in Northland are declining
9 Broccoli
10 Cucumbers
11 Pumpkins
12 Spinach
13 Fresh veg combos
14 Cabbage
15 Cauliflower
16 Beans
17 Courgettes
18 Fresh herbs
19 Asparagus no evidence of commercial crops in Northland
20 Sweet corn earliest corn in the summer grown in Northland
Table 7: adapted from Top 20 vegetables based on household expenditure (Vegetables New Zealand, 2015)

page 11
Rank Comments
1 Bananas very small quantities are grown locally for sale
2 Apples and pears volumes grown in Northland are declining
3 Berryfruit, kiwifruit and grapes (fresh or chilled)
4 Citrus fruit volumes grown in Northland are declining and have had to compete with cheap imports
5 Stone fruit a marginal crop in Northland
6 Canned, bottled and frozen fruit
7 Other fresh or chilled fruit
8 Dried fruit
Table 8: Ranking of top selling fruits (Statistics New Zealand, 2013b)
Commercial sensitivities make quantifying consumption levels in Northland
problematic. Using data in the public domain from Statistics New Zealand we can
extrapolate levels of consumption. This also provides insights to the household
spend on fruit and vegetables relative to other purchases.
Figure 1: Selected items of NZ weekly household expenditure, 2013
Average weekly household expenditure data for 2013 reveals that weekly
expenditure of fruit and vegetables was $9.30 and $13.30. The total spend, $22.60
represents two percent of net household expenditure. The data also exposes high
levels of expenditure on ready to eat food ($32.30) and alcoholic beverages ($21.40).
See Appendix two for more detail. This data is New Zealand data, as data for
Northland is not available on the Statistics New Zealand website.
$22.60
$32.30
$21.40
fruit and vegetables ready to eat foods alcoholic beverages

page 12
Household expenditure data enables an estimation of the annual expenditure on fruit
and vegetables in Northland. Table 9 reveals annual household expenditure of $69.3
million on fruit and vegetables.
No. of Dwellings
Weekly vegetable spend
Weekly fruit spend
Weekly total F&V spend
Annual total F&V spend
$13.30 $9.30 $22.60
Northland 58,947 $783,995.10 $548,207.10 $1,332,202.20 $69,274,514.40
Far North 21,369 $284,207.70 $198,731.70 $482,939.40 $25,112,848.80
Whangarei 29,778 $396,047.40 $276,935.40 $672,982.80 $34,995,105.60
Kaipara 7,800 $103,740.00 $72,540.00 $176,280.00 $9,166,560.00
Table 9: Estimation of expenditure on fruit and vegetables in Northland (Statistics New Zealand, 2015a)
This is an approximation that can be either inflated or deflated by further
consideration and refinement of the data. As Northland’s income levels are 80.4%
less than the national average, it can be assumed that consumption is proportionally
less.
With the exception of large export crops, horticulture production has been diminished
in Northland over the last five decades with the establishment, then dominance of
supermarkets in horticulture supply chains. Supermarkets import a high proportion of
produce into the region.
Further research can quantify existing and potential horticultural levels. This will
consist of:
The estimated $69.3 million of fruit and vegetables consumed, minus the
crops not produced commercially here (e.g. bananas)
Crops exported further south or internationally
Fruit and vegetables used by restaurants, cafes and fast food outlets
Fruit and vegetables consumed by non-residents.
The potential for horticulture in Northland is significant.
3. Market dynamic insights from growers
So far, our desktop analysis explores Northland’s productive capability, its current
production levels of the size of the market. This reveals a significant ongoing
opportunity for local growers. But what is the marketplace reality?
We interviewed 15 Northland growers in December 2015 and February 2016. Most
were from the Whangarei District, with a few from the Far North and Kaipara

page 13
Districts. They grow a wide range of fruit and vegetables. Some specialise in a
limited number of products, while others grow a wide range of fruit or vegetables,
with some producing both.
The focus of our interviews was to achieve a better understanding of market
dynamics. Market outlets for the growers include gate sales, farmers/growers
markets, direct sales to wholesale customers, distributors, supermarkets and the
Auckland auctions. There was also a small quantity of processed product.
Figure 2: The range of produce destinations
This figure illustrates the range of percentages of produce going to each of major
markets identified above. For example the top row indicates that for the growers that
sell through the markets the grower with the lowest percentage of their total
production sold there is 10% and for the highest, 90%.
Only one grower relies on a single market channel. Others have 2 to 4 channels.
Determining returns
We asked growers to approximate the percentage they received of a typical retail
price for the items they sell through these market channels. The typical retail price is
a nominal price – for example a $2 head of broccoli as sold at a supermarket.
This is problematic. Prices vary with the seasons and availability. Recent New
Zealand research (Pearson et al., 2014) identified that produce from farmers/growers
markets was significantly cheaper than supermarkets. A further complication is that
prices at supermarkets near farmers/growers markets were marginally cheaper than
those more distant from markets, inferring the dynamics of competition. Prices also
vary from supermarket to supermarket. Growers generally appeared comfortable with

page 14
sharing information about margins, but there was some hesitation, especially around
the “wholesale” prices paid by distributors. The researchers are confident, that while
the returns reported are approximate, they help to illustrate comparisons of market
channels.
A draft of this report has been circulated widely to enable critique of these
assumptions.
All of these outlets have some associated costs. These are summarised later.
Figure 3: Approximate range of returns through the main marketing channels
Gate sales
Gate sales did not feature prominently. One grower sold approximately 3% of
produce through the gate at approximately 60% of retail value.
Farmers/growers markets
Most of those interviewed sold produce through farmers or growers markets.
Approximated returns were reported between 50% and over 100% of a typical retail
price. Amber Pearson’s research (2014) determined an ideal weekly “food basket”
cost $76 from farmers or growers markets and $124 at nearby supermarkets.
Research based on the Whangarei Growers Market (WGM) identified a range of
pricing strategies with the market servicing different demographics, ranging from
bargain hunters to those prepared to pay premium prices for the values they are
seeking in their food (Bruce et al., 2014).

page 15
Stallholders are also comfortable selling seconds – a practice not seen at
supermarkets. One grower sells his premium niche produce at double the typical
supermarket price.
The direct contact between growers and purchasers at markets enables feedback on
pricing strategies and quality. One grower reported starting at the WGM with a low
cost pricing strategy, but raising that price from $1.50 to $2.50 over time, enabling a
far better return on costs. In this manner the grower Is able to gauge the appropriate
price point directly from customer responses.
The market also self-regulates on price. For example prices charged for produce
with relatively short peak harvest periods such as blueberries or sweet corn may
fluctuate depending on grower competition within the market itself
Direct sales to wholesale customers
Wholesale customers for growers are mostly cafés and restaurants. This was the
market category growers appeared most reluctant to report. Returns are
approximated at 30 to 70% of typical retail price. Some growers described their
returns as “wholesale plus”.
Cafes and restaurants require targeted marketing. Some growers have established
close and trusting relationships with cafés and restaurants enabling a stable market
to develop.
Some growers are wary of this outlet based on previous experience. They were
especially concerned about slow or defaulted payments and erratic ordering patterns.
Distributors
Distributors include Turners and Growers, Bidvest and local distributors such as
Penguin. Returns approximate from 30 to 50%. Distributors have the advantage of
being able to take large quantities. Sometimes there are two businesses involved in
the distribution chain.
Supermarkets
Supermarkets both in Northland and as far south as Wellington return between 35
and an estimated 50% to the grower.

page 16
Dealing with supermarkets is problematic for growers given the power imbalance. A
grower with an established relationship with a supermarket was told the price he
would receive would drop by 23%. As he had other market channels open to him, he
was able to refuse the price drop. The supermarket relented and maintained the
original price. This grower has two main products. The supermarket has hundreds
but was clearly prepared to compromise the grower’s chances making a reasonable
from his labours.
Auckland auctions
The auctions are used primarily used to sell surplus produce as returns are generally
lower and transport costs are high.
Co-ops and Community Supported Agriculture (CSA)
Only one interviewee sold a small volume of produce through a co-op. We are not
aware of any CSAs in Northland. These appear to be good options to generate new
market channels for growers.
Market channel
Advantages Disadvantages
gate sales low sales costs, outlet for seconds, no middle men
low volumes
markets direct contact with customers, good returns and potential to increase returns, no middle men
time commitments on weekends or evenings, cost of sales including staff and vehicles
wholesale opportunity to create longer term supply relationships, no middle men
lower returns than markets, often requires delivery, bad debts are a major demotivator
distributors no marketing investment required, may collect produce enabling grower to focus on core business
lower returns than markets
supermarkets potential to create a long term supply agreement, no middle men
supermarkets have a reputation for using their market dominance to dictate terms to growers, lower returns
auctions good option for surpluses low, unpredictable returns, crate, transport and commission costs
Table 10: Advantages and disadvantages of the main market channels
page 17
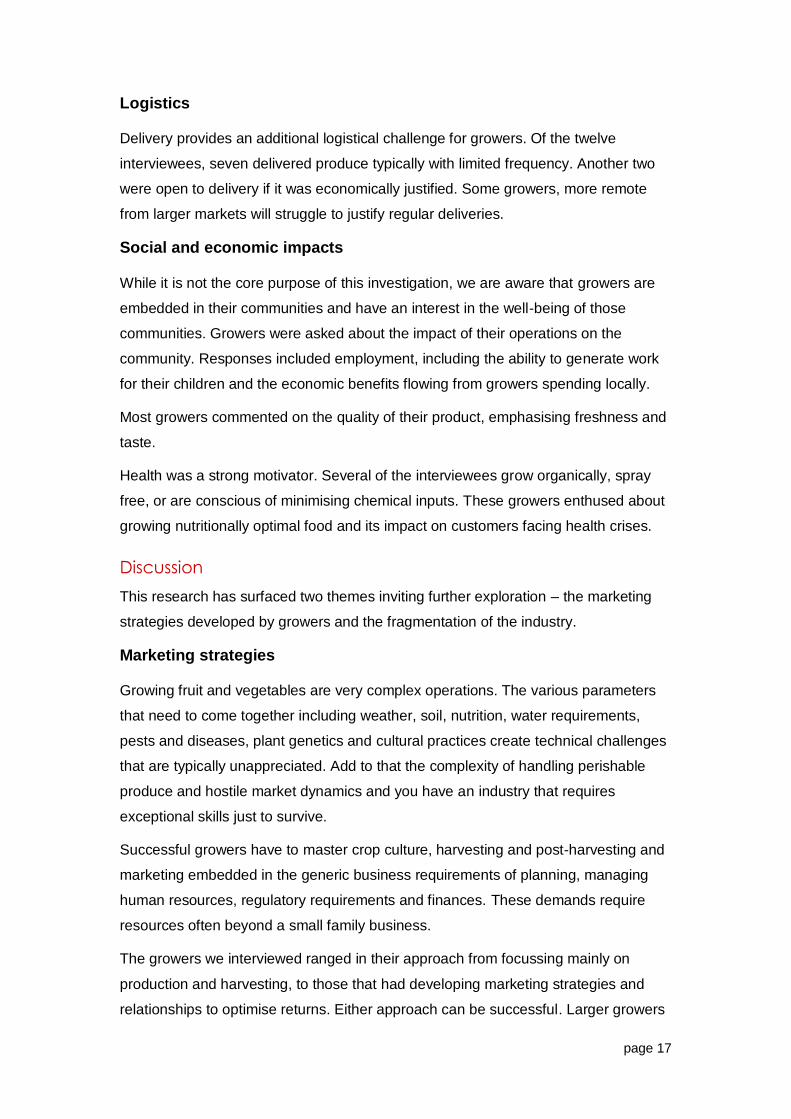
Logistics
Delivery provides an additional logistical challenge for growers. Of the twelve
interviewees, seven delivered produce typically with limited frequency. Another two
were open to delivery if it was economically justified. Some growers, more remote
from larger markets will struggle to justify regular deliveries.
Social and economic impacts
While it is not the core purpose of this investigation, we are aware that growers are
embedded in their communities and have an interest in the well-being of those
communities. Growers were asked about the impact of their operations on the
community. Responses included employment, including the ability to generate work
for their children and the economic benefits flowing from growers spending locally.
Most growers commented on the quality of their product, emphasising freshness and
taste.
Health was a strong motivator. Several of the interviewees grow organically, spray
free, or are conscious of minimising chemical inputs. These growers enthused about
growing nutritionally optimal food and its impact on customers facing health crises.
Discussion
This research has surfaced two themes inviting further exploration – the marketing
strategies developed by growers and the fragmentation of the industry.
Marketing strategies
Growing fruit and vegetables are very complex operations. The various parameters
that need to come together including weather, soil, nutrition, water requirements,
pests and diseases, plant genetics and cultural practices create technical challenges
that are typically unappreciated. Add to that the complexity of handling perishable
produce and hostile market dynamics and you have an industry that requires
exceptional skills just to survive.
Successful growers have to master crop culture, harvesting and post-harvesting and
marketing embedded in the generic business requirements of planning, managing
human resources, regulatory requirements and finances. These demands require
resources often beyond a small family business.
The growers we interviewed ranged in their approach from focussing mainly on
production and harvesting, to those that had developing marketing strategies and
relationships to optimise returns. Either approach can be successful. Larger growers

page 18
are more likely to have greater surpluses and therefore a greater need to rely on
market channels that are less lucrative.
There was evidence that some growers had experimented with direct marketing but
had abandoned it.
In asking how growers can be better supported leads us to the second theme,
industry fragmentation.
Industry fragmentation
Given the complexities facing growers, how have they organised themselves for
collaborative support and how have other agencies supported them? This report
cannot answer these questions, but can pose questions for further research.
There are three factors that, we believe, lead to fragmentation:
The complexity of the industry as outlined above.
The dynamics of power in the market place.
The survival imperative.
The dynamics of power
Power imbalances distort communication. If we perceive we have less power, our
communication will be more guarded and we will be inclined to accept less than is
fair. The following extract is from a paper exploring power in the context of fair trade
with developing economies. While our growers don’t suffer the same privations as
commodity producers in developing world economies, the underlying human and
institutional dynamics are the same.
Fairness and justice in trading is partly about price, which for commodities is
influenced partly by the balance of supply and demand. But price is not the
only ingredient of fair trading practices. Other trading practices reflect gross
imbalances in market power between producers and their customers,
especially the large retail chains. These include a lack of any commitment to
long- term trading relations, or demands for fees, discounts and credit terms,
or compliance with costly standards without a price premium, all of which
favour suppliers with deep pockets (Tallontire & Vorley, 2005, page 4).
Policy and policy changes from large companies can reshape the business
landscape. An interviewee talked about the impact of policy changes by a distributor.

page 19
“[the distributor] instituted an 80/20 rule, that is 80% of produce is bought by
20% of outlets so just focused on them and didn’t allow small grocers to
survive through bringing in minimum orders of $3,000 per week.”
Grower efforts to organise
Market dynamics over the last four or five decades have shaped the current food
system. How have growers responded? While exporters tend to have strong industry
structures, the local produce scene remains more fragmented. Notable exceptions
include the various kumara growers’ collectives and the New Zealand Tamarillo
Growers Association Inc.
Case study 1: Tamarillo Growers Association
Tamarillos are grown commercially in Ecuador, Colombia and New Zealand, with
approximately 45% of the national crop grown in Northland. The red variety was
developed in New Zealand and we are the only country where it is grown
commercially.
The tamarillo industry suffered a body blow when the tomato/potato psyllid arrived
from America in 2006. The psyllid is a vector for a bacteria that kills plants, causing
some orchards to lose 90% of their trees. This crisis and relatively poor returns for
growers gave impetus to the development of the Tamarillo Growers Association, an
incorporated society operating as a co-operative.
Figure 4: Tamarillos
Maungatapere grower, Robin Nitschke is the chair of the association. Robin is
passionate about the development of the industry and the efficacy of co-operatives in
advancing the interests of members. The TGA is active in developing marketing
opportunities, based on its increasing control on the national crop. Its subsidiary is

page 20
adding further value by developing a range of processed products, sauces, jams,
relishes and vinegars. Heather Nitschke is continuously innovating to improve
recipes and face-to-face feedback from customers at the Whangarei Growers
Market, as they return their empty jars and bottles, is invaluable for ongoing
refinements. These processed products have excellent export potential with the TGA
on the verge of lucrative export contracts.
The TGA displays an impressive capability for learning. Conversations between
growers surface new thinking. They then experiment themselves and engage with
institutional support to research solutions to improve crop culture and market
opportunities.
The Whangarei Growers Market (WGM) was initiated 17 years ago in response to
the demise of local Whangarei auctions. The WGM has grown significantly and
provided growers with better returns, a venue for retail and wholesale customer
engagement and association with a strong local brand (Bruce et al., 2014).
The Northland Natural Foods Cooperative, described later provides another example
of how other growers can organise.
The survival imperative
An interviewee suggests there has been a large decline in the number of growers,
not only in Northland but New Zealand wide. Those remaining are resilient, but under
increasing pressure as returns generally fail to keep up with inflation. When business
people are under pressure they tend to be drawn more into operations at the
expense of the business development focus. They will have even less energy to lend
to industry collaboration. As the dynamics in the wider system becomes dominated
by monopolies or duopolies, power displaces trust in the supply chain. Supply chain
participants may well respond by competing with other suppliers and attempting to
guard advantage, rather than collaborate.
Support for growers
If the broader community values locally produced food and its consequent benefits,
how might they better support growers? A direct support is to purchase food from
local growers and ask food sellers if they support local growers. It is beyond the
scope of this research to identify current support initiatives, but recommendations will
follow at the end of the report.
page 21
Part three: Distribution systems Distribution systems range from roadside stalls at small scale, through to
multinational distribution specialists. In the Northland context, we define distribution
systems as conduits to the business or retail consumer. Any sales outlet for a grower
can be regarded as a distribution system.
1. Grower to customer distribution
Roadside stalls provide growers with an on-property retail space with low running
costs. Many of these still run on trust. The customer deposits money and takes their
goods, often when there is no staff present.
On property retailing scales up the roadside stall with the addition of retail staff. An
example is the Huanui Orchard store.
Direct sales to business customers enable growers to bypass middlemen.
2. Co-operatives, markets and “vege box” initiatives
Cooperatives - in true co-operatives the producer and consumer work together to
create value for each other. They are characterised by transparency and
cooperation.
Farmers and growers markets
Farmers markets are defined as “direct agricultural markets, based on face-to-face
links between producers and consumers” (Hinrichs, 2000, pg. 295). The Localise
website lists 26 markets in Northland (McKegg, 2014, p. 2015).
Community supported agriculture (CSA) groups are well established in the United
States with an estimated 4,000 to 6,000 CSA farms in the US (Ernst, 2013). There is
no evidence of CSAs in Northland.
In basic terms, a CSA consists of a community of individuals who pledge support to a
farm operation so that the farmland becomes, either legally or vicariously, the
community’s farm. Growers and consumers partner together to share the risks and
benefits of food production. Members (or shareholders) of the farm or garden pledge
in advance to cover the anticipated costs of the farm operation, including the farmer’s
salary. In return, members receive shares in the farm’s bounty throughout the
growing season, plus the satisfaction gained from reconnecting to the land (Ernst,
2013, pg. 1).
“Veggie box” enterprises have emerged recently, most notably Ooooby, operating
out of Auckland. Nadia Lim extended her “My Food Bag” into Whangarei. Laura
Cate’s Fresh Food Collective, started in Whangarei in 2014 and now has over 1200
members. They can opt for a $10 or $20 box of produce weekly.

page 22
3. Corporate distributors
Supermarkets have complex supply chains, that in some cases they operate
themselves. Countdown (Progressive Enterprises) is an Australian owned company.
The Auckland Produce Centre is operated by another Australian Company,
Freshmax (Maurer, 2013). Foodstuffs operate New World, Pak n Save and Four
Square supermarkets. The company is New Zealand owned and operates as
“several independent cooperatives” (Foodstuffs, 2015). Produce is distributed out of
Foodstuffs Fresh in South Auckland.
Discontent with supermarket produce supply chains is well documented. In 2014
Member of Parliament Shane Jones accused Progressive Enterprises of extorting
their grower suppliers (Foreman, 2014). Following investigations based on Mr Jones’
and approximately 90 other complaints, the Commerce Commission found no
evidence of intimidation (Bennett, 2014).
To deal with similar issues, the UK Government appointed Christine Tacon as the
first Groceries Code Adjudicator in 2013. She commented that "It's quite a big
responsibility, trying to represent the direct suppliers and making sure they've got fair
contracts with the retailers," (BBC News, 2013).
In a recent investigation, Chistine Tacon found extensive evidence the Tesco
supermarket chain had acted unreasonably when delaying payments to suppliers
(Simpson, 2016).
In Australia, Four Corners produced a documentary Slaving Away, revealing
widespread labour abuses in supermarket supply chains.
Four Corners has also found farmers and suppliers who play by the rules and
pay workers correctly are being dropped by the supermarkets, who are
instead awarding contracts and sourcing food from cheaper suppliers using
grossly exploited labour. (Meldrum-Hanna, Russell, & Christodoulo, 2015)
A pattern of behavior emerges from some publicly owned companies, privileging
profit over ethical concerns to generate sufficient dividends for shareholders.
Foodstuffs offer a different business model to some of the supermarket chains
mentioned above. According to its website:
Foodstuffs (NZ) Ltd acts as the Federation body for the two regional co-
operatives, which it is jointly owned by. Foodstuffs (NZ) Ltd is based in
Wellington, and owns the intellectual property in Foodstuffs brand names, but
does not trade in its own right and is not a holding company (Foodstuffs,
2015).

page 23
It services the New World, Pak’n’Save and Four Square franchised stores. The
franchise model enables local ownership providing the storeowner more freedom to
create more ethical value chains.
While supermarkets can use their market presence to bully growers, enlightened
independent store owners have the ability to make better choices.
Case study 2: New World Remuera
Owner Adrian Barkla prefers a diet of healthy, raw, fresh produce, so where better to
purchase it than his own supermarket? He states:
“I believe organically grown fresh fruit and vegetables eaten raw as much as
possible should be the mainstay of a healthy diet.
My vision is to offer top quality organic produce at the same or nearly the
same price as conventional produce. I am passionate about giving my
customers quality organic produce at a fair price. The more we support our
growers, the more they will be able to offer our customers competitive prices
and a wider range of fruit and vegies.
In this way I can support my excellent organic suppliers and keep making the
best, healthiest fresh produce available to my valued customers. (New World,
2013)”
Figure 5: New World Remuera
By 2015, Adrian had increased the proportion of organic produce in his store by up to
50%. Achieving this level has not been easy. He has made it happen by creating
direct relationships with organic growers. By cutting out the middlemen, he has been
able to deliver organic produce to customers at a similar price to conventional
produce, and pay fair prices to growers. Adrian says that it is about treating others as
you would want to be treated (Twose, 2015).

page 24
A consequence of his pursuit of organic produce is creating a market that gives
organic producers the confidence to scale up as a platform to venture into other
markets. As other supermarkets see customers bypassing them in the pursuit of
organic produce, they may also ramp up efforts to stock more organic produce.
Customers will support New World for stocking organic produce – but Adrian Barkla
also deserves support for being a catalyst for change.
Corporate distributors
Turners and Growers (T&G Global) is now 73% German owned (Companies Office,
2015). The company was started by Edward Turner, an Auckland green grocer and
tomato grower 1883. Over 100 years later, in 2004 the company was listed on the
New Zealand Stock Exchange, a step that would inevitably open the doors for
international shareholdings. The company is one of the largest orchardists in New
Zealand, with extensive holdings in apples, citrus and kiwifruit (T&G Global, 2015).
Bidvest is a South African company that established a foothold in New Zealand with
the purchase of Crean Foodservice in 2000. In Whangarei their acquisition pathway
included Table Talk Ltd (2003), Mana Wholesale Produce (2008) and Harvest
Wholesale (2012) (Bidvest, n.d.).
Gleanings from interviewees
Five distributors were interviewed. They presented a diverse range of business
models and operated on margins from minimal to 40%. With a very small sample
size, and the diversity of business models analysis of the data is of limited value.
However some insights have emerged.
1. Diverse business models
The five interviewees represented two co-ops, two fruit and vegetable
retailer/wholesalers and a distributor. These had diverse business models based on
distribution. Two either grew their own produce or accessed it directly from growers
while the three others sourced the majority, or all of their produce from a large
distributor.
Three of the five interviewees have initiated new business models for produce
distribution in Northland. Two are featured below in brief case studies.

page 25
2. Links with local growers
Generally, these local distributors like the idea of working with local growers, but
there are some barriers. They require reliable and regular quantities supplies. One
distributor has approached local growers but was unable to secure adequate
supplies. A low margin aggregation system could enable smaller growers to supply
quantities required by distributors.
“We would love to work with local producers but would need consistent
supply and they would all need to be co-ordinated so there could be a single
pick up / drop off point.”
Case study 3: Northland Natural Foods Co-operative (NNFC)
Sean and Rowan Stanley established an online co-operative in 2014. The website
and shopping cart facilitate a close link between the grower and customer. Growers
(and farmers) are able to list produce at a price they specify. The co-op takes 10%.
As the NNFC is still in its development stage and the business model is designed to
optimise returns for growers, it may take some time, at current growth rates to be
viable. It is currently fuelled by the energy of its founders.
Figure 6: Screenshot of the NNFC website
A strength of this model is the ability of a grower to sell small crops, thus enabling
them to establish a foot hold in the market and to scale up. The 10% co-op margin
applies to growers regardless of their size.
The NNFC is leveraging Internet tools to reshape the food system.

page 26
Case study 4: Fresh Food Collective
Also established in 2014, Laura Cate’s Fresh Food Collective has grown dramatically
with over 1200 members. The $10 or $20 boxes provide great value .
Figure 7: Screenshot from the Fresh Food Collective
Laura established the collective when her family’s discretionary income reduced
when she stopping working after having a baby. She empathised with low-income
families who find fruit and vegetables expensive through other outlets. She aims to:
“Improve the diet of Northlanders through making healthy food available to all
irrespective of income”.
In addition to making fresh fruit and vegetables more accessible for clients the
collective has created partnerships with Manaia Health and Oranga Kai where food
identification, storage and preparation is taught in some locations where there is a
predominance of mainly processed and takeaway foods consumed. Most produce is
accessed from a large distributor.
At the time of writing Laura is about to divest The Fresh Food Collective. Her
intention to get more fruit and vegetables into lower income families was frustrated,
even when she established nearby outlets. Reinforcing the need for education about
basic food identification and preparation is a major outcome of her initiative and
hopefully this will continue in the partnerships she has created. Laura has handed
her initiative over to others and will remain involved as a consultant.

page 27
Case Study 5: Local Distributor Penguin
The history of locally owned and operated Penguin Wholesalers (Whangarei) Ltd,
mostly known as Penguin, spans 40 years since Patsy and Dave Walters bought
their first refrigerated truck, delivering mainly ice and frozen goods. Although the
truck motor blew up the following week the business is still going strong and the next
generation of this family business is now working alongside 40 other employees,
some who have been loyal members of the team for more than a decade.
The Walters have seen many changes in the food production industry during their
tenure and have entered into several partnerships and collaborations with local firms
both to extend their business interests and assist others. One of these resulted in the
extension of the business from operating solely from their Port Road premises,
mainly servicing those in the hospitality industry, to operating Penguin Direct on
Porowini Ave, making their bulk products available to the general public at wholesale
prices.
The Walters say it is a changing landscape in the distributor environment with at
least three Auckland companies now coming to Northland, as well as multinational
corporation Bidvest, who have bought out a few local businesses, some of whom
Penguin had worked alongside for many years. They are open about the struggles in
competing in the current market, especially against a large multinational company
page 28
with far greater resources than them; “if we hadn’t been so established, we probably
would have shut our doors by now”. They believe they are keeping their competitors
honest and that prices would almost certainly increase if there were no competition.
They credit their longevity in the business to tenacity and their loyal customer base,
built up over many years. “We try and give back to the community, support local
business and provide employment for Northland people. We support people that
have supported us and believe in money staying in the region.”
Recently they donated bamboo plates and cutlery to the Whangarei Growers Market
food demonstrations with little fanfare, a fact only discovered through our research
with local growers.
Penguin’s competitive advantage is based on local ownership and knowledge,
providing local employment and giving back to the community, operating a large fleet
of vehicles, and their membership of Foodfirst (New Zealand’s largest foodservice
network) provides additional benefits to customers, while also dealing with real
people who understand their business needs, (Penguin, n.d.)

page 29
Part four: Outlets Outlets in Northland range from large supermarkets to small retail outlets,
cooperatives and markets. Food is also produced in a range of venues including
restaurants, cafes, hotels, schools, workplaces and hospitals.
Far North Whangarei Kaipara
Food retailing
99 102 30
Supermarkets and grocery stores
54 51 21
Specialised food retailing
45 54 18
Meat, fish and poultry retailing
12 9 6
Fruit and vegetable retailing
6 6
Cafes, restaurants, takeaways
165 189 51
Pubs, taverns and bars
27 18 6
Clubs (hospitality)
6 9 6
Table 11: Food related outlets in Northland by district (Statistics New Zealand, 2014)
Cafes, restaurants, takeaways, kitchens and caterers
Locally owned and operated cafes, restaurants and takeaways are typically
small businesses operating across the region. Statistics New Zealand record 405 in
2014 in Northland employing 2300 people.
The Yellow Pages list 21 caterers in the Northland region.
Commercial kitchens include large kitchens such as the Whangarei Hospital
kitchen and hotel kitchens – those servicing clients rather than casual customers.
Food retailers
Supermarkets have become dominant players in produce retailing. Green grocers
are not as prominent as they were before the proliferation of supermarkets. Two are
listed in the Yellow Pages, but there are more.
Gleanings from buyer interviewees
Of the thirteen buyers interviewed, eleven were either cafes or restaurants and two
were health facilities.

page 30
Sources of produce
In aggregate, the buyers accessed produce from wholesale distributors, the
Whangarei Growers Market, supermarkets and green grocers and other minor
sources. The graph below reveals that the majority of produce was accessed from
wholesale distributors.
Figure 8: Aggregated sources of produce for buyer interviewees
These figures cannot be generalised across the whole population of cafes,
restaurants and health facilities in Northland, but we are confident that they are
indicative.
The wholesale distributors selling the greatest proportion of the 75% were corporate
distributors. The small percentage sold directly from growers appears to result from
entrepreneurial growers developing strong relationships with their customers.
The “other” sources included a buyer that grew some of their own produce and
another buyer that sourced produce from a petrol station.
Popular purchases
When interviewees were asked to list their top five produce purchases, most were
vegetables, with salad greens, potatoes, kumara, carrots and tomatoes the most
popular.
direct from growers, 3%
growers markets, 15%
other, 1%
supermarkets and green
grocers, 6%
wholesale distributors, 75%

page 31
salad greens 12 mushrooms 2
potatoes 7 apples 1
kumara 6 baby cress 1
carrots 5 beans 1
tomatoes 5 coriander 1
onions 3 courgettes 1
bananas 2 fruits 1
brocolli 2 micro greens 1
cabbage 2 parsley 1
capsicums 2 pumpkin 1
cauliflower 2 seasonal greens 1
cucumbers 2 silverbeet 1
Table 12: Top produce requirements reported by interviewees (numbers indicate the interviewees nominating each produce line.
Most of these can be produced in Northland. We are not currently growing bananas
or mushrooms in sufficient quantities to meet regional demand.
The value proposition
Our interviews asked questions to elicit a generalised value proposition desired by
interviewees.
In its simplest terms, a value proposition is a positioning statement that
explains what benefit you provide for who and how you do it uniquely
well. It describes your target buyer, the problem you solve, and why you’re
distinctly better than the alternatives. (Skok, 2013)
Interviewee responses can be grouped into three main value categories, produce
quality, price and service quality.
Produce quality
All thirteen interviewees cited quality as important indicating it is the dominant value.
Produce quality encompasses the attributes of freshness (9 responses), organic or
spray free (3 responses) consistency (2 responses) and local (2 responses). Other
quality attributes were appeal and taste.
Price
Of the three value categories, price followed produce quality. Some commented that
price was important, but quality was more important.
When asked of the discount received from their suppliers in relation to typical
supermarket prices three of the thirteen interviewees did not have sufficient
information to respond. Of the other ten, six reported that discounts were zero,

page 32
minimal or up to 10%. A seventh reported that prices could be 30% dearer than
supermarket sources. This purchaser did take time to shop around and appeared to
have a sound knowledge of prices. Of the remaining three, one purchased from an
organic supplier from Auckland and found that produce significantly cheaper than
organic produce at supermarkets. A buyer purchasing the majority of his produce
from the Whangarei Growers Market, found the produce there to be always cheaper.
One buyer stated that her suppliers were competitive.
We conclude that many cafes and restaurants are buying produce at prices not too
dissimilar from supermarket prices.
Service quality
Three interviewees nominated aspects of service quality as important, including
factors of hassle free, replacements for defective produce and prompt service. Two
interviewees specified delivery as an important value. In a related question, eleven of
the thirteen interviewees required delivery for all or most of their produce. Delivery
appears to be a default value for interviewees. Their requirements ranged from once
weekly to at least daily delivery, 7 days a week.
Restaurants and cafes are busy. Typically the owner or manager is closely involved
in operations and has little time to pursue diverse sources of produce. One café
owner related how she had attempted to purchase produce herself from the markets
before work, but had to abandon the effort as she was too busy.
Any supplier who can perform satisfactorily or better in two of these three value
categories, will probably retain customers. As examples of this, one interviewee
referred to a grower who delivered produce at a good price, in great quality and
presented it in ordered stages of maturity to ensure the produce was in optimal
condition.
One of the corporate distributors has also earned customer loyalty by producing
good quality produce delivered with excellent customer service. They also delivered
dry goods. This level of service addresses a key logistical problem for food service
operators and enables them to focus on their core business.
Food with a story – organic, spray free and local
A case study that follows in part five briefly tells the story of Judy Wicks’ White Dog
Café in Philadelphia. Her business was one of the first to develop local supply and
related attributes as a key platform of her value proposition for customers. Three
interviewees valued organic or spray free produce and two valued local supply.
page 33
We are not aware of a Northland café or restaurant leveraging their interest in
organics or local supply by clearly communicating this to customers. Nectar Café on
Bank Street is impressive as it sources supplies from an organic distributor in
Auckland, sells Fair Trade coffee, mostly organic beverages, and uses organic milk
but this is only likely to be noticed by those interested. One of the owners has started
producing food for the café in his permaculture garden. This is a story waiting to be
told.
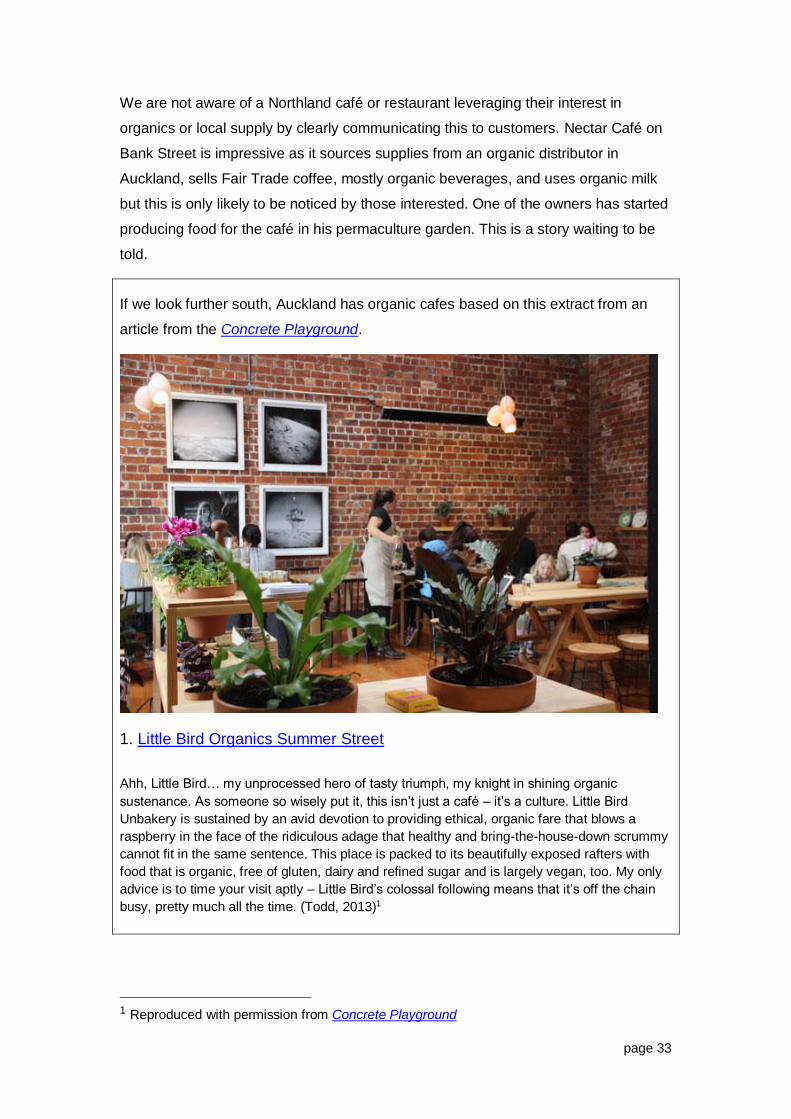
If we look further south, Auckland has organic cafes based on this extract from an
article from the Concrete Playground.
1. Little Bird Organics Summer Street
Ahh, Little Bird… my unprocessed hero of tasty triumph, my knight in shining organic
sustenance. As someone so wisely put it, this isn’t just a café – it’s a culture. Little Bird
Unbakery is sustained by an avid devotion to providing ethical, organic fare that blows a
raspberry in the face of the ridiculous adage that healthy and bring-the-house-down scrummy
cannot fit in the same sentence. This place is packed to its beautifully exposed rafters with
food that is organic, free of gluten, dairy and refined sugar and is largely vegan, too. My only
advice is to time your visit aptly – Little Bird’s colossal following means that it’s off the chain
busy, pretty much all the time. (Todd, 2013)1
1 Reproduced with permission from Concrete Playground

page 34
Figure 9: Conscious Consumers badges
In Wellington (another metropolitan centre) Conscious Consumer has established an
accreditation system recognising steps cafes and restaurants take to become more
sustainable. The badge system enables cafes to develop their sustainability story
over time as badges are accumulated. An app is available to enable potential
customers to find an eatery that suits their needs.
In Blue Ocean Strategy, Kim and Mauborgne (Kim & Mauborgne, 2005) identified
blue oceans as market spaces that open up new dimensions of the value proposition
and reduce costs by de-emphasising dimensions no longer so relevant. This
contrasts with the red ocean where everybody is competing.
Using their blue ocean strategy canvas we can identify how a blue ocean might be
developed by ramping up the local food story thus creating community endorsement
and greater brand loyalty. The values expressed are approximate. For example,
some existing distributors (the “business as usual” model) deliver great customer
service.

page 35
Figure 10: A strategy canvas revealing the "blue ocean" advantages of a social enterprise model2
A local certification?
Interviewees were asked – “would you be interested in a Northland Fresh/Supporting
Local Growers Certification?” Seven out of thirteen responded positively with two
others giving a qualified positive response.
It appears that there is enthusiasm for supporting locally grown produce.
2 Diagram developed with the Blue Ocean Strategy Canvas App. For more explanation of the strategy canvas see: https://www.youtube.com/watch?v=Kuq02Cy8RkE

page 36
Part five: Reshaping Food Systems Northland’s food system over time has become shaped by the profit motive. It
appears that over time survival imperatives and diminishing grower returns have
contributed to this. If we apply Sherer’s value network concept to food system
design, where the interests of a diverse range of stakeholders are considered, price
becomes one of the drivers but not the dominant one (2005).
According to Godfray et al, it appears that in general farm gate prices may not reflect
the true cost of production, when other external factors are included in the
calculations (2010). The British Ecological Society suggested in 2011 that the true
value of resources we get from nature, “ecosystem services” is $125 trillion per year
but that figure diminishes to $75.2 trillion of the common output measure of Gross
Domestic Product GDP, (2014).
Otto Sharmer’s framework may provide a guide to an evolutionary process where
stakeholders’ awareness expands and they become an integral part of the food
system in Northland.
Figure 11: The evolution of society and economy (Massachusetts Institute of Technology, 2015)
This framework traces the dominant design elements of economy and society. In
“Society 1.0” the state is the dominant actor. With the emergence of “Society 2.0” the

page 37
free market and the dynamics of competition dominate. To counter the more extreme
impacts of free market “Society 3.0”, the social market develops with non-
governmental organisations (NGOs) introducing stakeholder awareness as an
element of design.
Over time these developments help to generate value, but sooner or later come up
against the limits of their usefulness. Today’s social and economic landscape is
shaped by the interaction, often conflictual, of these three forces. Advocates for each
of these “societies” believe a return to their dominant values will solve the problems
they perceive. Otto Scharmer identifies the co-creative society, “Society 4.0” as the
next stage of our collective development. It is characterised by an awareness of the
broader needs of the society and economy and seeks to find synergies. In “Society
3.0”, the larger corporations strive to dominate the economic ecosystem, while in
“Society 4.0”, the dominant drive is ecosystem stewardship (Scharmer & Kaufer,
2013).
Primary societal challenge
Response: Coordination mechanism
Primary sector / players
Primary source of power
Dominant ideology
Primary state of consciousness
Society 1.0
State-driven mercantilism, socialism
stability commanding hierarchy
state/ government
coercive (sticks)
Mercantilism: socialism (state centric) thought
Traditional awareness
Society 2.0
Free market-driven laissez- faire
growth competing markets
capital/business: state/ government
remunerative (carrots)
Neoliberal and neoclassic (market-centric) thought
ego-system awareness
Society 3.0
Stakeholder-driven social-market economy
negative domestic externalities
negotiating: stakeholder dialogue
civil society/ NGOs, capital/business, state /government
normative (values)
social democratic or progressive thought
stakeholder awareness
Society 4.0
Eco-system driven, co-creative economy
global disruptive externalities, resilience
presencing: awareness-based collective action (ABC)
cross-sector co-creation, civil society/NGOs, capital/ business, state/ government
awareness: actions that emerge from seeing the emerging whole
eco-system- centric thought
eco-system awareness
Table 13: Characteristics of the four societies (Scharmer & Kaufer, 2013)
Based on this understanding of social and economic drivers, food system design will
be based on awareness of externalities, will strive for resilience, aspire to collective
action be driven by wider societal needs rather than narrow economic drivers and
value and expand the assets of the commons.

page 38
Food systems in society 4.0
An unavoidable conclusion is that damage is done to local economies by large
corporations. Public corporations can be owned by shareholders from anywhere on
the globe. Shareholders invest primarily to realise a dividend from investments
creating short term, dividend-production drivers. Why should we expect that a
corporation based in, say London, would have any interest in the Northland’s
economy, communities or ecosystems? The profit motive is typically privileged over
these interests.
There are an encouraging number of exceptions becoming apparent as the
awareness of the sustainability imperative grows, but these are still very much in the
minority.
This image identifies a continuum of the
drivers that motivate business. Those
operating from self-interest are driven
primarily by the profit motive. They may
make some concessions to wider societal
and environmental concerns, but often this
is driven by responses to regulation or
reputation damage.
Figure 12: Business motivators
Those operating from enlightened self-interest are aware that the company’s
interests and those of the wider community can align.
A small, but growing number of businesses appear to be altruistic. They are still
profit-driven, as profit strengthens financial sustainability, but the profit and purpose
motives are in greater harmony. Examples globally are the late Ray Anderson’s
Interface, Judy Wicks’ White Dog Cafe and Elon Musk’s Tesla. Examples in New
Zealand are Ray Avery’s Medicine Mondiale and Malcolm Rand’s Ecostore. Locally,
the two case studies featured above, the NNFC and the Fresh Food Collective are
examples.
Food systems are an ideal place to start regenerating local economies. Contributing
factors are the advantage of proximity when dealing with perishable produce, the
potential ubiquity of producers, and the fact that access to food is an essential and

page 39
universal need. For Northland, another driver is our benign climate. The advantages
of eating locally grown produce provide another collaborator in those genuinely
motivated to improve health outcomes for Northlanders.
Case study 6: the White Dog Café
Judy Wicks founded the White Dog Café in Philadelphia in 1983. From very humble
beginnings, it has grown to become a central component of a food ecosystem.
Driven by her discomfort with the way animals may be treated in factory farming,
Judy took initially pork off the menu until free-farmed pork was available. She moved
on to replace all factory farmed meat and dairy with ethically farmed product. Judy
states “When living creatures are treated like machines, the industrial system has
reached a pinnacle of perversion”(Wicks, 2013). Both meat and produce suppliers
are identified as White Dog suppliers, often with Judy Wicks assisting their
development.
She combined social activism with her business interests. For example she
developed a business alliance to support indigenous Mexicans, under threat by para-
military forces, by helping them to export coffee. Her food comes with a story that
engages a loyal customer base.
Judy was a pioneer in social initiatives, such as paying the living wage.
Rather than keep these initiatives
to herself as a brand advantage,
Judy then went on to help other
restaurants to strengthen the local
food movement. She argues “After
all, there is no such thing as one
sustainable business, no matter
how great our practices are; we
can only be a part of a sustainable
system” (Wicks, 2013).
Figure 13: The White Dog Cafe mission

page 40
The food system and regional development
Driving her decision-making in the development of the White Dog Café was Judy’s
awareness of the impact of corporations on local communities.
Human-scale businesses foster close and meaningful relationships, but when companies grow too big to be purchased by a new owner within the community—employees, a family member, or a local entrepreneur—they are most likely bought up by a distant corporation. Then profits are drained from the community; local procurement of supplies and services typically decreases, as do contributions to local charities; and if the company is moved out of town, jobs and local tax payments are lost—ultimately decreasing community wealth and weakening the local economy (Wicks, 2013).
Research reveals a correlation between the development of small businesses and
job growth (Long, 2015, Glaeser & Kerr, 2010).
Figure 14: More small firms means more jobs (Glaeser & Kerr, 2010)
Glaeser and Kerr’s research revealed a jobs dividend from the growth of the
numbers of small business. We believe the local food approach mastered by Judy
Wicks could be adapted and applied in Northland to grow small businesses and
increase well-being here.
Economic impacts
Based on data from NZ Stats, table nine on page 15 calculates the annual total fruit
and vegetable spend in 2013 at $69.3 million for northland (calculated on the number
of Northland households by average national spend on fruit and vegetables.
According to Michael Shuman (2015):
More than two dozen studies over the past decade have compared the
economic impacts of locally owned businesses with their nonlocal
equivalents, and they consistently show that local businesses generate two to
four times the multiplier benefits.

page 41
The multipliers calculated for the Whangarei Growers Market was almost exactly in
the middle of this range at 2.99 (see table 14 below).
Based on this data, if 20% of produce consumed in the region can be moved from
external sources to local food sold through local food distributors and outlets, this
would equate to $13.86 million. Applying multipliers within Schumans’ (2015)
parameters would see additional economic benefits of between $27.7 to $55.4 million
annually for Northland.
The food chain dynamics are complex. These figures can only be approximate. Note
that they do not include the value of produce purchased by organisations (cafes,
restaurants, hospitals, etc), neither do they include enhanced exports nor meat, fish
and dairy.
Social enterprise as a transitional tool
We have many corporations and SME’s operating in Northland, and many
Government agencies and NGOs. It is difficult to identify any social enterprises in
operation. They occupy a space between profit driven business and taxpayer funded
organisations and charities. Although it is a limited liability company, the Whangarei
Growers Market is an example of what a successful social enterprise might look like.
Professor Muhammad Yunus, Nobel Prize winner and the developer of micro-credit
developed the social business concept. He claims that social businesses, businesses
that run alongside commercial enterprises, can solve many social problems (Yunus,
2010). The concept is being adapted to a New Zealand context. A report by Mary Jo
Kaplan of Brown University outlines social entrepreneurship in New Zealand and
anticipates its development.
Boundaries between public, private and non-profit sectors are blurring in the quest for better, faster, cheaper solutions. Government has a critical stake in new business models that provide public benefits. Not-for-profit organisations are becoming more market-oriented while businesses are working harder to benefit communities as well as stockholders. Scholars and practitioners are observing the convergence of market and mission throughout the world and are trying to find a common language to describe this burgeoning area of activity so it can be better understood and harnessed.
Bill Gates, founder of Microsoft, called this shift, ‘creative capitalism.’ He stated, “We can make market forces work better for the poor if we develop a more creative capitalism – if we can stretch the reach of market forces so that more people can make a profit, or at least a living, serving people who are suffering from the worst inequities.” Harvard Business School professor Michael Porter advocates that capitalism has betrayed its promise by focusing on a narrow equation of value with short-term economic returns.

page 42
Businesses should pursue “shared value,” generating both economic value and creating a value for society by addressing its challenges (Kaplan, 2013).
Figure 15: The continuum from not-for-profit to business enterprise models (Kaplan, 2013, pg 6)
This diagram from Mary Jo Kaplan’s report identifies a range of enterprise models.
Social enterprises aspire to generate wealth, but the pursuit of profit is balanced by
strong purpose(Akina, 2015). Pursuit of the profit motive tends to distort the purpose
motive. Social enterprise may provide a vehicle to redesign the food system with
governance and policy protections to optimise value creation for producers and
consumers.
Food systems and health
Our food and health systems will both benefit from tighter integration and co design.
Health is enhanced by increased consumption of vegetables and fruit. Long Food
Chains (LFCs) are complicit with the increase in food-related health issues with their
preference for highly processed foods over fresh food.
Many factors combine dynamically to create the growing global health crisis that
sees nearly 870 million people suffering from chronic undernourishment (Food and
Agriculture Organisation, 2012) and 1.9 billion people overweight (World Health
Organisation, 2015a). In New Zealand rates of overweight and obese people are
growing.
At the other end of the spectrum, but sharing a common condition of poor nutrition,
are those who have insufficient food. According to the Child Poverty Monitor in 2014,
24% or 260,000 New Zealand children suffered from income poverty, with 17%, or
180,000 going without the things they need.
According to the Northland District Health Board (2012, page 8)
Northlanders have higher rates of health risk factors including:
− Tobacco use – 26% of Northland adults smoke compared with 19% for New
Zealand. The smoking rate is extremely high for Māori (55%).

page 43
− Nutrition and physical activity – 30% of Northland adults are obese compared
with 19% for NZ. The rate is higher for Māori (47%).
− Alcohol use – 23% of Northland adults report hazardous alcohol consumption
patterns compared with 20% nationally.
Figure 16: Proportion of population, 15 years and over, who are obese (Statistics New Zealand, 2015c).
These factors support the prevalence of cardiovascular disease, diabetes and
cancer. The prevalence of Type 2 diabetes mellitus is increasing. According to the
New Zealand Medical Journal “ (Derraik, de Bock, Ruffell, Ahlsson, & Cutfield, 2011)
“while 20 years ago T2DM was rare among adults in the second and third decades of
life, young adults now constitute a significant proportion (up to 30%) of newly
presenting diabetics.” Globally, health authorities speak of a diabetes “tsunami”.
While poverty limits access to food, those with more resources can also suffer health
impacts through time scarcity - the sense that there is insufficient time for food
preparation. This leads to the consumption of convenience and ready-prepared food,
choices associated with cardiovascular disease, diabetes and cancer (Jabs &
Devine, 2006).
Poor diet is widely correlated with negative health impacts. The World Health
Organisation (World Health Organisation, 2015b) attributes approximately 1.7 million
deaths annually to low fruit and vegetable consumption. Closer to home, Clair Mills,
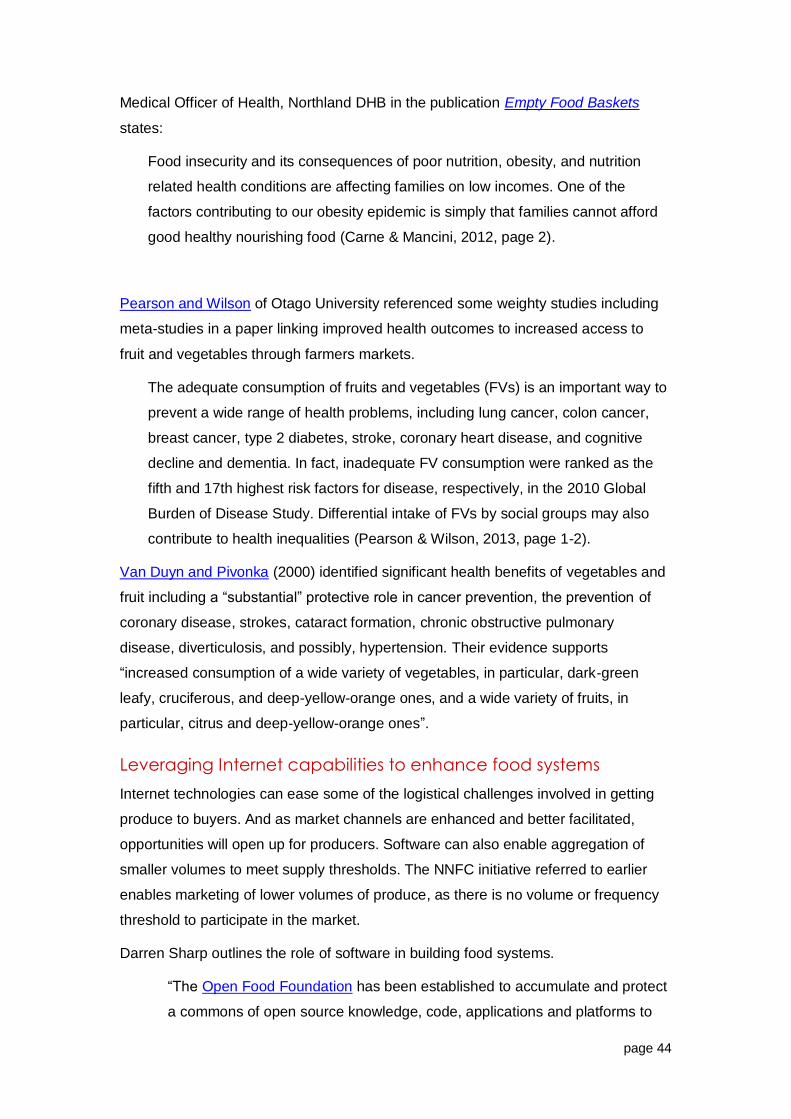
page 44
Medical Officer of Health, Northland DHB in the publication Empty Food Baskets
states:
Food insecurity and its consequences of poor nutrition, obesity, and nutrition
related health conditions are affecting families on low incomes. One of the
factors contributing to our obesity epidemic is simply that families cannot afford
good healthy nourishing food (Carne & Mancini, 2012, page 2).
Pearson and Wilson of Otago University referenced some weighty studies including
meta-studies in a paper linking improved health outcomes to increased access to
fruit and vegetables through farmers markets.
The adequate consumption of fruits and vegetables (FVs) is an important way to
prevent a wide range of health problems, including lung cancer, colon cancer,
breast cancer, type 2 diabetes, stroke, coronary heart disease, and cognitive
decline and dementia. In fact, inadequate FV consumption were ranked as the
fifth and 17th highest risk factors for disease, respectively, in the 2010 Global
Burden of Disease Study. Differential intake of FVs by social groups may also
contribute to health inequalities (Pearson & Wilson, 2013, page 1-2).
Van Duyn and Pivonka (2000) identified significant health benefits of vegetables and
fruit including a “substantial” protective role in cancer prevention, the prevention of
coronary disease, strokes, cataract formation, chronic obstructive pulmonary
disease, diverticulosis, and possibly, hypertension. Their evidence supports
“increased consumption of a wide variety of vegetables, in particular, dark-green
leafy, cruciferous, and deep-yellow-orange ones, and a wide variety of fruits, in
particular, citrus and deep-yellow-orange ones”.
Leveraging Internet capabilities to enhance food systems
Internet technologies can ease some of the logistical challenges involved in getting
produce to buyers. And as market channels are enhanced and better facilitated,
opportunities will open up for producers. Software can also enable aggregation of
smaller volumes to meet supply thresholds. The NNFC initiative referred to earlier
enables marketing of lower volumes of produce, as there is no volume or frequency
threshold to participate in the market.
Darren Sharp outlines the role of software in building food systems.
“The Open Food Foundation has been established to accumulate and protect
a commons of open source knowledge, code, applications and platforms to

page 45
support the proliferation of fair and sustainable food systems in Australia and
beyond” (Sharp, 2014).
The founders Kirsten Larsen and Serenity Hill are applying the principles of open
access and peer-to-peer networks to create resilient food systems of the future.
The three components here align with those explored in this report. It reinforces the
potential diversity of the food system.
Figure 17: This screenshot outlines the three components of the food system (Sharp, 2014)
The first of the three segments of the system (farmers/growers) are established and
have potential to scale up based on proven production systems. The buyer segments
are also well established. The distributor segment has gaps. The co-ops featured
earlier are recent additions, but this research has revealed potential to enhance
market channels.
The Open Food Foundation has developed open source software to facilitate food
systems, including transaction capabilities.

page 46
Figure 18: A screenshot of the Open Food Network website
Food hubs
Our research revealed how closer connections between producers and buyers may
be of mutual benefit. From a design perspective, the distribution system is not the
conduit it could be. Almost a decade ago Welsh research identified the distribution
system as the “missing middle”.
More specifically, it asks whether there is a ‘missing middle’ in the local food
infrastructure in Wales, a mechanism by which small producers can
collectively access a middleman facility that enables them to trade with large
customers – be they supermarkets, food service vendors or public
procurement consortia – that none of them would be able to trade with by
acting alone. (Morley, Morgan, & Morgan, 2008, pg 2)
Australian advocates for food hubs claim that food hubs represent
A conscious effort to build on the many thriving and highly popular examples
of emerging local food economies, such as farmers’ markets and community-
supported agriculture enterprises, by identifying and meeting key gaps in
local circuits of food production, distribution and consumption. (Eaterprises,
2011)
Aggregation is a core function of food hubs.

page 47
Recent research from the United States evaluates “alternative food networks” such
as food hubs in Vermont (LeBlanc, Conner, McRae, & Darby, 2014). While the
researchers cautioned that their findings may not be generalisable in other states or
countries, and that further research is required, they anticipate the hubs investigated
will
Aid in creating resilient nonprofit food hubs that are able to maintain
relevance through deep connections and credibility with diverse community
producers and consumers, and that can engage these community groups as
part of their core civic agriculture mission. (LeBlanc et al., 2014, page 14)
Jeff Griggs of Local Food Northland and Sean Stanley of the NNFC visited Vermont
in 2014 and 2015 respectively. They were both impressed by the diversity and
vibrancy of the food system in a state that has harsh winters and a five month
growing season.
Food solutions, New England report over the last five years reports the addition of
8,8843 new direct, indirect and induced jobs. The multiplier effect produces an
additional 1.28 jobs for every new job in the food system. In the same time period,
625 new farms and food-related businesses were created (Food Solutions New
England, n.d.). On a per capita basis, this is equivalent to 2388 new jobs in
Northland over a five year period, or 477 jobs annually.
A similar study of Detroit found that shifting 20% of spending on food to local food
would create 4,719 jobs and $US 483,125,887 increased economic output (Shuman,
2010). Again, on a per capita basis this would equate to 1,167 jobs for Northland.
Northland research
Northland data exists on the economic multipliers generated by the Whangarei
Growers Market.
Turnover at the WGM for the 2013 year was $3.66 million. An 88-sector model of the
Northland economy has been used to estimate the broader impacts of this economic
activity. When the multiplier effects are added, the total value of the markets to the
region is estimated as $8.77 million as outlined below.
3 Vermont’s population (2015 estimate) is 626,042 (Wikipedia)

page 48
Revenue ($ millions)
Net Household
(Income $m)
Employment (jobs)
Value Added
($ millions)
Direct production activity from Table 1
2.93 0.55 19 1.12
Flow-ons to Backward Linked Sectors
3.27 0.42 11 1.13
Total Direct & Backward Linked Impacts
6.20 0.97 30 2.25
Flow-ons to Forward Linked Sectors
2.57 0.54 11 0.76
Value of Total Impacts due to WGM
8.77 1.51 41 3.01
Backward Linked Multiplier (e.g. 6.20/2.93)
2.12 1.76 1.58 2.01
Total Multiplier (e.g. 8.77/2.93) 2.99 2.75 2.16 2.69
Table 14: Total economic impacts for the Northland economy emanating from sales at the WGM
The multipliers in Table 14 conveniently summarise the economic impacts of the
WGM. For Revenue, $1 of produce sold at the WGM induces another $1.12 of sales
revenue for supplying business units in the Northland region (multiplier 2.12).
Another 87c of services is required to deliver this produce to final consumers (1 +
1.12 + 0.87 = 2.99 the multiplier including the forward linkages). Note that a fraction
of this 87c could represent a contribution to the wages of casual staff in Northland
restaurants for example. The Employment multipliers in Table 14 cannot be similarly
interpreted because the WGM technology for growers and sellers is not the same as
the production technology intrinsic to the economic model as outlined above (Bruce
et al., 2014).
Food Hubs are well established in the United States. Ecotrust started FoodHub in the
Western U.S. in 2009 as an "incubator and capital vehicle for moving innovative
social enterprises forward”.
The authors of Rebuilding the Foodshed describe the span between farm and fork as
where a "frenzy of innovation is occurring." They call it "The New Middle" (a solution
to "the missing middle" referred to earlier) which describes the changing dynamic in
aggregation, processing and distribution. There are a variety of possible forms and
combinations ranging from largely non-profit initiatives to "savvy entrepreneurial
initiatives" (Ackerman-Leist, 2013) . The innovative co-operatives recently
established in Northland would appear to fit nicely.

page 49
The New Middle appears to be blue ocean (Kim & Mauborgne, 2005) based in that it
is a move away from centralised distribution centres with reliance on fossil fuels and
refrigerated vehicles travelling long distances and develops a new "old" system of
local aggregation, processing and distribution but with the advantages of technology.
This provides much more certainty around food security and caters for small as well
as large-scale growers.
This infographic from the USDA highlights some of the strengths of food hubs.
Figure 19: Food Hub infographic part one (USDA, 2013)
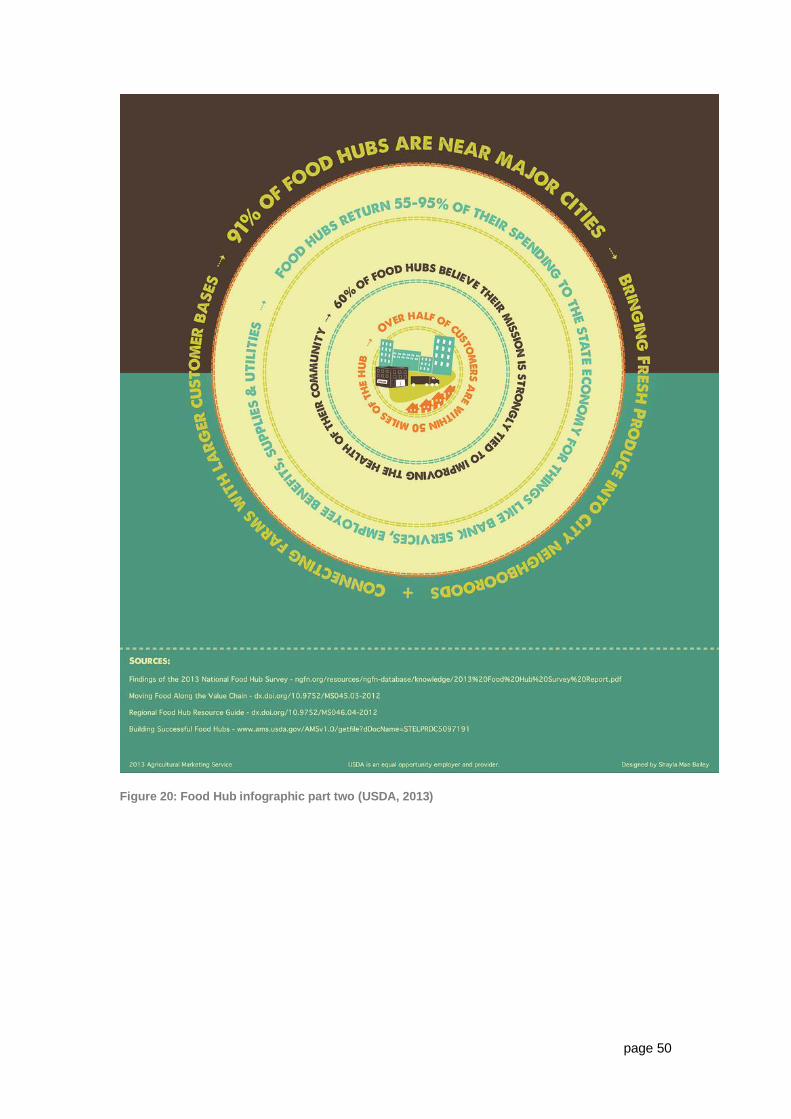
page 50
Figure 20: Food Hub infographic part two (USDA, 2013)

page 51
Conclusions and recommendations
Perspectives on Northland’s food systems
The intention of this report was to gain a better understanding of the Northland food
system. We conclude that there are aspects of the system that are unsustainable
and require our collective attention, from the production side through to health
impacts on consumers. Our potential for financial and social sustainability of the
system is however eroding. Our growers are aging without clear succession
pathways and the current distribution models disadvantage small growers and forces
them to assume distribution functions. In addition grower feedback and our own
desktop enquiry suggests entry costs for new growers can be prohibitive. The food
produced sold through the wider system appears, on balance, nutritionally deficient
with consequent social and economic health impacts implying a further imperative for
change.
Current business practice assumes the continuation of anything but light restraint of
free market forces as anti-growth. Ironically the resultant economic landscapes in our
regions are increasingly dominated by corporates slowly but surely engulfing smaller
operators with an attendant inhibition of local enterprise and edging towards a future
of monopoly and almost certainly increased costs through less competition in the
marketplace.
Growers
Growing fruit and vegetables are very complex operations. Successful growers have
to master crop culture, harvesting and post-harvesting and marketing embedded in
the generic business requirements of planning, managing human resources,
regulatory requirements and finances.
Rather than leave our growers exposed to the full impact of a hostile business
environment, the most immediate actions can be improving returns from their often
inequitable levels. For example, if the 30 to 50% returns (of nominal supermarket
retail price) from distributors could be raised by 10%, growing would be more
lucrative. This in turn will help attract others into the field.
Growers will also benefit from more dependable payment systems, perhaps enabled
by the Internet.

page 52
The “middle”
The “missing middle” – the distribution system – is dominated by corporate
distributors and supermarket supply chains. Any reshaping of distribution systems
need be mindful of the concepts of the short food chain and Sherer’s (2005) value
networks. In the short term, the profit motive has to be moderated or, in places,
displaced with social enterprise models that prioritise grower returns while delivering
a strong value proposition to customers.
The “missing middle” extracts a disproportionate value of produce. If we take a
nominal $2 head of broccoli, the grower can get as little as 50 to 60 cents, while a
typical café owner is paying $1.80 to $2.00. This leaves the distributor making up to
$1.50. This is not always be the case, but it represents a distortion that does not
reflect the inputs required to produce and distribute produce.
The development of farmers or growers markets, innovative co-operatives and
initiatives such as that of Remuera New World, are encouraging and exemplify
shortened food chains. In Northland we think food hubs may have the potential to
create new distribution channels and related services to benefit growers.
Outlets
The value proposition emerges as an important concept underlying good service to
outlets. Produce quality was nominated as important by all outlets, followed by price
and service quality. Busy chefs and kitchen managers want to focus on the core
business of cooking, rather than logistical concerns.
New business models
Orchardists use shelter belts to protect plants from wind damage. There is an
analogy here with business practices. If we continue to leave smaller growers
exposed to the full force of competition, we will continue to see a depleting of
production capability in Northland. With insights we can glean from thinkers such as
Otto Scharmer (2013), we can begin to reconceptualise enterprise models that are
more community led, focusing on building local capability and resilience, rebuilding
levels of trust, diversifying the economic base, creating both jobs and fostering
entrepreneurship.
The levels of cohesion implied here are currently characterised by a few growers
who are engaged with their customers, and food outlets, such as Jas Singh’s Shiraz
who are fostering the value of those relationships. Others, at least aspire to better
support local growers without having clear pathways to do so.

page 53
The role of community
The recommendations that follow will be of interest to a number of organisations, but
they are also relevant to the wider community.
By developing more awareness of the impact of the dollars that each of us spend, we
can effectively “vote” for the economic activity we want to foster. This research has
surfaced great stories of growers, distributors and food outlets that remain largely
untold. We believe customers who want to support good local food stories also have
a role in spreading them.
Recommendations
1. Investigate the feasibility of food hubs in Whangarei and other Northland Centres.
The primary purposes of food hubs are to improve returns to growers and to
make healthy food more readily available to consumers. These benefits are
essential to our social, economic and environmental sustainability and are
deserving of utilising public resources accumulated over the decades for our
future wellbeing and prosperity. A first step is to build a wide coalition of
institutions, groups and individuals committed to their establishment.
2. Convene a regional discussion on the local food economy.
International studies cited earlier reveal significant job and enterprise
generating potential from an enhanced local food economy. Local
government, development agencies, the Intersectional Forum, food
producers, food outlets, Iwi, health agencies and educational institutions are
all stakeholders. Further study to quantify actual and projected gains will be
useful, but need not preclude advancing the conversation.
3. Promote local food.
Recall figure one. In 2013, New Zealanders spent $22.60 weekly on fruit and
vegetables, $32.30 on “ready to eat” foods and $21.40 on alcoholic
beverages. Promoting local food has potential to shift these numbers.
Strategies are a local certification programme and developing community
awareness.

page 54
Further research
Here are questions that have emerged for this research.
Building capacity – Are Northland growers keen to explore new opportunities,
perhaps upscale production and where are the gaps? How soon could this happen?
How to encourage new growers and possible crop diversification into the
marketplace?
The grower - wholesale customer connection – What benefits will flow from
creating a social field where growers and wholesale customers can interact and
explore mutual interest?
Payment mechanisms – Cash flow management problems for growers are a
disincentive to sell directly to wholesale customers. What mechanisms can be
developed to improve payment protocols?
Grower support – What mechanisms currently exist for grower support? How
effective are they? What enhancements are required for effective support?
Hub facilities – What facilities are appropriate for Northland Hubs? What kitchen
facilities are required to support value-add for local produce?
Impact on existing distribution channels – Will diversifying market channels have
a negative impact on farmers / growers markets and co-ops?

page 55
References
Ackerman-Leist, P. (2013). Rebuilding the foodshed: how to create local, sustainable, and secure food systems. Santa Rosa, Calif.; White River Junction, Vt.: Post Carbon Institute ; Chelsea Green Pub.
Akina. (2015). What is social enterprise? Retrieved 4 December 2015, from http://akina.org.nz/about/our-story/what-is-social-enterprise/
BBC News. (2013, January 21). Christine Tacon named as supermarket ombudsman. Retrieved 26 January 2016, from http://www.bbc.com/news/business-21117701
Bennett, A. (2014, November 20). No evidence of intimidating suppliers - Countdown off the hook. New Zealand Herald. Retrieved from http://www.nzherald.co.nz/business/news/article.cfm?c_id=3&objectid=11361686
Bidvest. (n.d.). Bidvest - Logistics & processing divisions in Auckland & Christchurch. Retrieved 21 December 2015, from http://www.bidvest.co.nz/about-us/history/
Bruce, P., Patrick, A., & Romer, S. (2014). The Social and Economic Impact of the Whangarei Growers Market. Whangarei: NorthTec. Retrieved from https://peterbruceresearch.files.wordpress.com/2014/04/wgm-report-final.pdf
Carne, S., & Mancini, A. (2012). Empty food baskets: Food poverty in Whangarei. Retrieved 1 December 2015, from http://www.cpag.org.nz/assets/Publications/Empty%20Food%20baskets%20final%2029.3.12.pdf
Companies Office. (2015). T&G Global Limited. Retrieved 21 December 2015, from https://www.business.govt.nz/companies/app/ui/pages/companies/41406/shareholdings
Corder, R. (1989). Turners & Walder Ltd Whangarei : 1939-1989. The author.
Currie, J. (1986). Grassland farming in Northland. New Zealand Grasslands Association. Retrieved from http://www.grassland.org.nz/publications/nzgrassland_publication_1120.pdf
Davis, C. (2013). From Passive Overeating to ‘Food Addiction’: A Spectrum of Compulsion and Severity. International Scholarly Research Notices, 2013(435027). http://doi.org/10.1155/2013/435027
Derraik, J., de Bock, M., Ruffell, C., Ahlsson, F., & Cutfield, W. (2011). The obesity pandemic, the diabetes ‘tsunami’, and the lack of adequate sports grounds for children in Auckland, New Zealand - New Zealand Medical Journal, 124(1338). Retrieved from http://www.nzma.org.nz/journal/read-the-journal/all-issues/2010-2019/2011/vol-124-no-1339/letter-derraik
Eaterprises. (2011, September). Imagining a Casey Food Hub. Retrieved from http://www.eaterprises.com.au/wp-content/uploads/2011/12/110923-Casey-Food-Hub-Concepts.pdf
Ernst, M. (2013). Community Supported Agriculture. University of Kentucky.
Feagan, R. (2007). The place of food: mapping out the ‘local’ in local food systems. Progress in Human Geography, 31(1), 23–42. http://doi.org/10.1177/0309132507073527
Food and Agriculture Organisation. (2012). Undernourishment around the world in 2012. Retrieved from http://www.fao.org/docrep/016/i3027e/i3027e02.pdf
Food Solutions New England. (n.d.). New job numbers, economic growth, and food justice conversations are focus at Vermont’s Farm to Plate Annual Gathering. Retrieved 12 February 2016, from http://www.foodsolutionsne.org/vermont/new-job-numbers-economic-growth-and-food-justice-conversations-are-focus-vermont%E2%80%99s-farm

page 56
Foodstuffs. (2015). Company Information. Retrieved 21 December 2015, from http://www.foodstuffs.co.nz/about-foodstuffs/company-information/
Foreman, H. R. and M. (2014, February 12). MP accuses Countdown of extortion. Stuff.co.nz. New Zealand. Retrieved from http://www.stuff.co.nz/business/industries/9713606/MP-accuses-Countdown-of-extortion
Forward Marketing. (2012). Coca-Cola Content 2020 Initiative Strategy Video - Parts I & II. Retrieved 4 December 2015, from https://www.youtube.com/watch?v=G1P3r2EsAos
Glaeser, E., & Kerr, W. (2010, August). The Secret to Job Growth: Think Small. Harvard Business Review. Retrieved from https://hbr.org/2010/07/the-secret-to-job-growth-think-small
Harmsworth, G. (1996). Land use capability classification of the Northland region. Canterbury, Manaaki Whenua Press. Retrieved from http://www.mwpress.co.nz/__data/assets/pdf_file/0007/70495/LRSS_9_LUC_Northland_Region.pdf
Hinrichs, C. C. (2000). Embeddedness and local food systems: notes on two types of direct agricultural market. Journal of Rural Studies, 16(3), 295–303. http://doi.org/10.1016/S0743-0167(99)00063-7
Horticulture New Zealand. (2013). Fresh Facts. Retrieved 3 December 2015, from http://www.freshfacts.co.nz/file/fresh-facts-2013.pdf
Information, N. C. for B., Pike, U. S. N. L. of M. 8600 R., MD, B., & Usa, 20894. (2000). Overview of the health benefits of fruit and vegetable consumption for the dietetics professional: selected literature. - PubMed - NCBI. Retrieved 4 December 2015, from http://www.ncbi.nlm.nih.gov/pubmed/11138444
Jabs, J., & Devine, C. M. (2006). Time scarcity and food choices: An overview. Appetite, 47(2), 196–204. http://doi.org/10.1016/j.appet.2006.02.014
Jenkin, G., Wilson, N., & Hermanson, N. (2009). Identifying ‘unhealthy’ food advertising on television: a case study applying the UK Nutrient Profile model. Public Health Nutrition, 12(5), 614–623. http://doi.org/10.1017/S1368980008003029
Kaplan, M. J. (2013). Growing the Next Generation of Social Entrepreneurs and Start-ups in New Zealand. Fulbright New Zealand. Retrieved from http://29v0ktgonwh1jjpi9ekij08qz.wpengine.netdna-cdn.com/wp-content/uploads/2014/03/axford2013_kaplan.pdf
Kim, W. C., & Mauborgne, R. (2005). Blue ocean strategy: how to create uncontested market space and make the competition irrelevant. Boston, Mass.: Harvard Business School Press.
LeBlanc, J., Conner, D., McRae, G., & Darby, H. (2014). Building Resilience in Nonprofit Food Hubs. Journal of Agriculture, Food Systems, and Community Development, 4(5), 121–135. http://doi.org/10.5304/jafscd.2014.043.005
Long, M. (2015, November 19). Doing Better: The $80 Billion Shift We Need Now for Economic Democracy. Retrieved 16 January 2016, from http://www.huffingtonpost.com/michelle-long/doing-better-the-80-billi_b_8524432.html
Marsden, T., Banks, J., & Bristow, G. (2000). Food Supply Chain Approaches: Exploring their Role in Rural Development. Socilogia Ruralis, 40(4), 424–438.
Massachusetts Institute of Technology. (2015). Transforming Business, Society, and Self with U.Lab. Retrieved 4 December 2015, from https://www.edx.org/course/transforming-business-society-self-u-lab-mitx-15-671x
Maurer, H. (2013). Freshmax. Retrieved 21 December 2015, from http://www.fruittradecoach.com/freshmax.html
McAlister, A. R., & Cornwell, T. B. (2010). Children’s brand symbolism understanding: Links to theory of mind and executive functioning. Psychology and Marketing, 27(3), 203–228. http://doi.org/10.1002/mar.20328

page 57
McKegg, C. (2014). Northland Producers Markets Directory. Retrieved from http://www.localise.nz/re-localising-our-food/northland-producers-markets-directory/
Meldrum-Hanna, C., Russell, A., & Christodoulo, M. (2015, May 4). Slave-like conditions found on farms supplying big supermarkets [Text]. Retrieved 26 January 2016, from http://www.abc.net.au/news/2015-05-04/supermarkets-food-outlets-exploit-black-market-migrant-workers/6441496
Michail, N. (2015). Am I being manipulated? Inside multisensory eating experiences. Retrieved 4 December 2015, from http://www.foodnavigator.com/Market-Trends/Am-I-being-manipulated-Inside-multisensory-eating-experiences
Morgan, G., & Simmons, G. (2013). Appetite for Destruction. Public Interesting Publishing Limited. Retrieved from https://books.google.co.nz/books/about/Appetite_for_Destruction.html?id=IZULngEACAAJ
Morley, A., Morgan, S., & Morgan, K. (2008). Food Hubs: The ‘Missing Middle’ of the Local Food Infrastructure? Retrieved 12 February 2016, from http://community-wealth.org/content/food-hubs-missing-middle-local-food-infrastructure
New World. (2013, June 6). Remuera New World goes organic all over | Scoop News. Retrieved 16 February 2016, from http://www.scoop.co.nz/stories/BU1206/S00134/remuera-new-world-goes-organic-all-over.htm
Northland District Health Board. (2012). Northland Health Services Plan 2012-2017. Retrieved from http://www.northlanddhb.org.nz/Portals/0/NHSP_2012-2017_Full_Version.pdf
Northland Inc. (2005). Horticulture. Retrieved 3 December 2015, from http://www.northlandnz.com/business/sectors/horticulture
Oxford Martin Programme. (2005). What is the Food System? | Future of Food. Retrieved 1 December 2015, from http://www.futureoffood.ox.ac.uk/what-food-system
Pearson, A. L., & Wilson, N. (2013). Optimising locational access of deprived populations to farmers’ markets at a national scale: one route to improved fruit and vegetable consumption? PeerJ, 1, e94. http://doi.org/10.7717/peerj.94
Pearson, A. L., Winter, P., McBreen, B., Stewart, G., Roets, R., Nutsford, D., … Wilson, N. (2014). Obtaining Fruit and Vegetables for the Lowest Prices: Pricing Survey of Different Outlets and Geographical Analysis of Competition Effects. PLoS ONE, 9(3). http://doi.org/10.1371/journal.pone.0089775
Penguin. (n.d.). About Us | Penguin. Retrieved 21 March 2016, from http://www.penguinwholesalers.co.nz/pages/about-us.htmx
Puckey, A. (2011). Trading Cultures: A History of the Far North. Wellington: Huia. Retrieved from https://www.huia.co.nz/shop&item_id=2794
Scharmer, O., & Kaufer, K. (2013). Leading from the Emerging Future: From Ego-System to Eco-System Economies (1 edition). San Francisco: Berrett-Koehler Publishers.
Sharp, D. (2014, January 20). The Open Food Foundation: Free Software for Better Food Systems. Retrieved 10 February 2016, from http://www.shareable.net/blog/the-open-food-foundation-free-software-for-better-food-systems
Sherer, S. A. (2005). From supply-chain management to value network advocacy: implications for e-supply chains. Supply Chain Management, 10(2), 77–83.
Shuman, M. (2010, November 16). Economic Impact of Localizing Detroit’s Food System | Fair Food Network. Retrieved 22 February 2016, from http://www.fairfoodnetwork.org/resources/economic-impact-localizing-detroits-food-system
Shuman, M. (2015). The local economy solution: how innovative, self-financing ‘pollinator’ enterprises can grow jobs and prosperity. Vermont: Chelsea Green Publishing.
page 58
Simpson, E. (2016, January 26). Tesco knowingly delayed payments to suppliers. Retrieved 26 January 2016, from http://www.bbc.com/news/business-35408064
Skok, M. (2013, June 14). 4 Steps To Building A Compelling Value Proposition. Retrieved 15 February 2016, from http://www.forbes.com/sites/michaelskok/2013/06/14/4-steps-to-building-a-compelling-value-proposition/
Smith, T. G., & Tasnádi, A. (2014). The Economics of Information, Deep Capture, and the Obesity Debate. American Journal of Agricultural Economics, aat113. http://doi.org/10.1093/ajae/aat113
Statistics New Zealand. (2013a). 2012 Agricultural Census tables. Retrieved 3 December 2015, from http://www.stats.govt.nz/browse_for_stats/industry_sectors/agriculture-horticulture-forestry/2012-agricultural-census-tables/horticulture.aspx
Statistics New Zealand. (2013b). Household Economic Survey: Year ended June 2013. Retrieved 3 December 2015, from http://www.stats.govt.nz/browse_for_stats/people_and_communities/Households/HouseholdEconomicSurvey_HOTPYeJun13.aspx
Statistics New Zealand. (2015a). Data Hub Table Viewer. Retrieved 4 December 2015, from http://nzdotstat.stats.govt.nz/wbos/index.aspx
Statistics New Zealand. (2015b). Horticulture by Regional Council. Retrieved 4 December 2015, from http://nzdotstat.stats.govt.nz/wbos/Index.aspx?DataSetCode=TABLECODE7422
Statistics New Zealand. (2015c). Obesity. Retrieved 4 December 2015, from http://www.stats.govt.nz/browse_for_stats/snapshots-of-nz/nz-social-indicators/Home/Health/obesity.aspx
Tallontire, A., & Vorley, B. (2005). Achieving fairness in trading between supermarkets and their agrifood supply chains. London: UK food group. Retrieved from http://www.ukfg.org.uk/docs/UKFG_Briefing_Fairness_in_Trade_Sept_2005.pdf
T&G Global. (2015). T&G Global Limited / Timeline. Retrieved 21 December 2015, from http://www.turnersandgrowers.com/about-t-and-g/timeline/
Todd, D. (2013, November 14). The Ten Best Organic Cafes in Auckland. Retrieved from http://concreteplayground.com/auckland/arts-entertainment/culture/the-ten-best-organic-cafes-in-auckland/
Twose, H. (2015, September 1). Adrian Barkla: organic retailer. New Zealand Herald. Retrieved from http://www.nzherald.co.nz/element-magazine/news/article.cfm?c_id=1503340&objectid=11504831
USDA. (2013). Infographics & Data Visualizations | Agricultural Marketing Service. Retrieved 19 February 2016, from https://www.ams.usda.gov/resources/infographics-data-visualizations
Vegetables New Zealand. (2015). Facts - Most Popular Vegetables | vegetables.co.nz. Retrieved 3 December 2015, from http://www.vegetables.co.nz/facts/most_popular.asp
Wicks, J. (2013). Good morning, beautiful business: the unexpected journey of an activist entrepreneur and local economy pioneer. White River Junction, Vt.: Chelsea Green Publishing.
World Health Organisation. (2015a). Obesity and overweight. Retrieved 4 December 2015, from http://www.who.int/mediacentre/factsheets/fs311/en/
World Health Organisation. (2015b). Promoting fruit and vegetable consumption around the world. Retrieved 4 December 2015, from http://www.who.int/dietphysicalactivity/fruit/en/
Yunus, M. (2010). Building Social Business: The New Kind of Capitalism That Serves Humanity’s Most Pressing Needs. PublicAffairs.

page 59
Appendix 1: Research Methods
Secondary data
Desktop research of journals and industry sources, primarily through the Internet
provides context for the primary research. While much of this is accessed in the early
phases of research, surfacing data is an iterative process – the researchers follow up
themes that emerge during the research process.
Primary data
The food system is categorized here as producers, distributors and outlets. Owners
or managers of 15 production facilities, 5 distributors and 13 outlets are interviewed.
Selection processes were also iterative. An initial range of interviewees are selected
and as researchers followed leads, further interviewees are added. As the
researchers are based in the Whangarei District, most interviewees are based here,
but producers from the Kaipara and Far North Districts are represented.
Interviews are mostly face to face, but some are by telephone when face to face
interviews are not practicable. Interviews are designed to be brief, targeting
information to quantify margins and transactional parameters.
Confidentiality
Research forms are coded to ensure confidentiality. These forms are stored by one
of the research team with password protection, with contact details associated with
the codes stored by another researcher. Where individual interviewees are quoted in
the report, their permission is obtained. The Participant Information and Consent
form follows.
Validity
We aspire to a better shared understanding of the food system. This is enhanced by
returning interview notes to interviewees and distributing the draft report for
feedback.

Participant Information and Consent
Thank you for your interest in participating in this research project.
Understanding the market dynamics of fruit and vegetable production, distribution and produce outlets.
This project is supported by Local Food Northland and NorthTec.
Local Food Northland is a community led initiative aspiring to promote and establish community-led sustainable food systems for Northland.
The research addresses these questions:
1. Who are the main commercial producers in Northland and what is their knowledge and perceptions of market dynamics?
2. Who are the major distributors and what proportion of their produce is sourced from Northland?
3. What are examples of produce outlets in Northland, where do they access their produce and in what volumes and frequency?
4. What major crops are produced in sufficient volumes to satisfy local demand and what major crops have potential for increased local production?
5. What opportunities exist to develop levels of local production by meeting current production shortfalls, and increasing market demand for local produce?
As a stakeholder, we invite you to participate in this study as your responses will help the research team to develop a more detailed picture of our food system, and how food system dynamics might shift to greater financial, social and environmental sustainability for our local economy.
If your story is of particular value to illustrate themes in the report we will seek permission to quote you directly in the report. You will have a second opportunity to check your recorded quotation and, if desired, withdraw consent.
Thank You
I, ……………………………. of …………………………………………
agree to participate in this research. I understand that my contributions will be summarised and communicated back to me to enable me to verify them as an accurate summary of my responses.
Signature:
Date:

page 61
Appendix 2: Household expenditure
Expenditure group, subgroup, and class 2009/10 2012/13 Percentage change
Percentage of net 2013 expenditure
Food
Fruit and vegetables 20.30 22.60 11.4
Fruit 8.80 9.30 5.6 0.8%
Vegetables 11.50 13.30 15.8 1.2%
Meat, poultry, and fish 26.70 27.90 4.6
Meat and poultry 22.50 23.60 4.9 2.1%
Fish and other seafood 4.20 4.30 3.0 0.4%
Grocery food 77.30 81.30 5.2
Bread and cereals 19.10 19.30 1.2 1.7%
Milk, cheese, and eggs 13.90 15.20 8.9 1.4%
Oils and fats 3.00 2.90 -0.2 0.3%
Food additives and condiments 4.90 5.30 8.9 0.5%
Confectionery, nuts, and snacks 11.30 11.90 5.0 1.1%
Other grocery food 25.10 26.70 6.1 2.4%
Non-alcoholic beverages 10.20 11.50 12.6
Coffee, tea, and other hot drinks 3.00 3.40 12.3 0.3%
Soft drinks, waters, and juices 7.10 8.10 12.8 0.7%
Restaurant meals and ready-to-eat food 43.10 49.20 14.3
Restaurant meals 16.10 16.60 3.1 1.5%
Ready-to-eat food 26.50 32.30 21.8 2.9%
Other food services S S S
Total food 177.50 192.50 8.4 17.3%
Alcoholic beverages, tobacco, and illicit drugs (ATID)
Alcoholic beverages 21.30 21.40 0.3
Beer 7.10 8.20 15.5 0.7%
Wine 8.50 8.50 -0.9 0.8%
Spirits and liqueurs 2.50 2.00 -19.4 0.2%
Alcoholic beverages not elsewhere classified 3.10 2.70 -15.2 0.2%
Cigarettes and tobacco 7.90 8.20 3.5
Cigarettes and tobacco 7.90 8.20 3.5 0.7%
Illicit drugs S S S
Total ATID 29.30 29.50 0.9 2.7%
Clothing and footwear (total only) 30.30 31.60 4.5 2.8%
Household and housing utilities (total only) 251.60 272.90 8.5 24.6%
Household contents and services (total only) 45.10 48.80 8.2 4.4%
Health (total only) 24.20 27.10 12.1 2.4%
Transport (total only) 131.00 158.30 20.8 14.2%
Communication (total only) 35.60 35.80 0.4 3.2%
Recreation and culture (total only) 98.20 107.20 9.1 9.6%
Education (total only) 16.60 18.40 10.8 1.7%
Miscellaneous goods and service (total only) 92.10 101.70 10.5 9.2%
Other expenditure (total only) 107.90 116.30 7.8 10.5%
Total sales, trade-ins, and refunds -20.70 -28.80 38.9 -2.6%
Total net expenditure 1,018.70 1,111.40 9.1
Average weekly household expenditure for years ended 30 June 2010 and 2013 (Statistics New Zealand, 2013b)

page 62
Research team
Peter Bruce-Iri is a researcher and lecturer for the Business
Management degree and diploma programme at NorthTec. He
led the research team that produced Our Contribution and The
Social and Economic Impact of the Proposed CCR Project for
Refining NZ in 2008 and 2012 and The Social and Economic
Impacts of the Whangarei Growers Market in 2012. Peter is
the author of Better Business for a Better World, published in 2000. He was born in
Northland and has lived here most of his life. Peter’s first career was in horticulture.
He currently blogs for www.localfoodnorthland.org. To contact Peter email
Eloise Neeley is a recent NorthTec Applied
Management graduate and Massey University
Masters' student/researcher. In 2015 she completed
an individual research project, Is the Agriwomen's
Development Trust "Escalator" Programme helping
Agri-women to "step up" in governance and
leadership roles? She enjoys research that draws on
both her academic experiences and her 20+ year agri-sector careers in farming and
communication. Returning to Northland in 2013, Eloise has enjoyed reconnecting
with her roots, is passionate about the potential of the region and supporter of local
initiatives and business people.