Embed Size (px)
Citation preview
LNG Shipping
October 2006
Hauke L. Kite-Powell
Outline
• LNG shipping in context• shipping demand and supply
– trade projections– fleet development– implications for fleet utilization
• trends and risks– charter terms– short term (“spot”) trades– structural changes
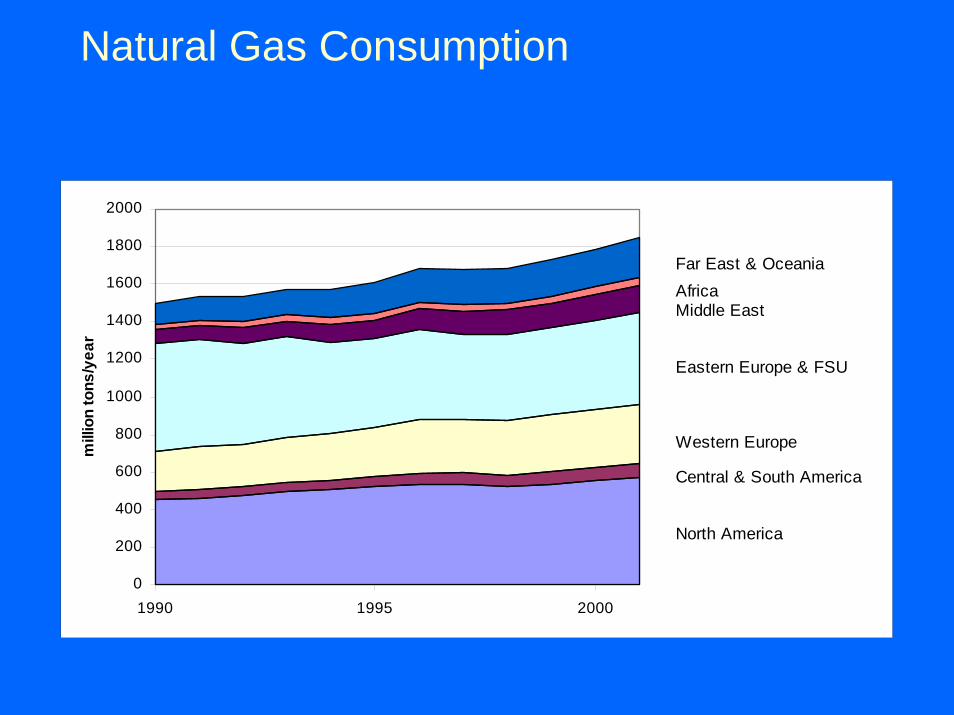
Natural Gas Consumption
0
200
400
600
800
1000
1200
1400
1600
1800
2000
1990 1995 2000
mill
ion
tons
/yea
r
Far East & OceaniaAfricaMiddle East
Eastern Europe & FSU
Western Europe
Central & South America
North America
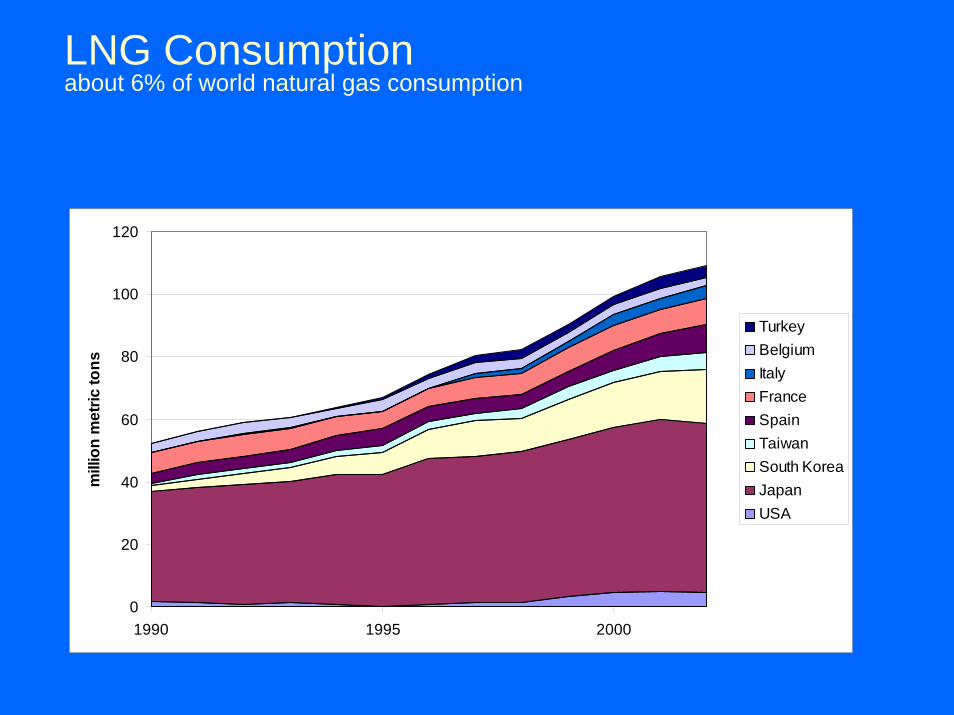
LNG Consumptionabout 6% of world natural gas consumption
0
20
40
60
80
100
120
1990 1995 2000
mill
ion
met
ric to
ns
TurkeyBelgiumItalyFranceSpainTaiwanSouth KoreaJapanUSA
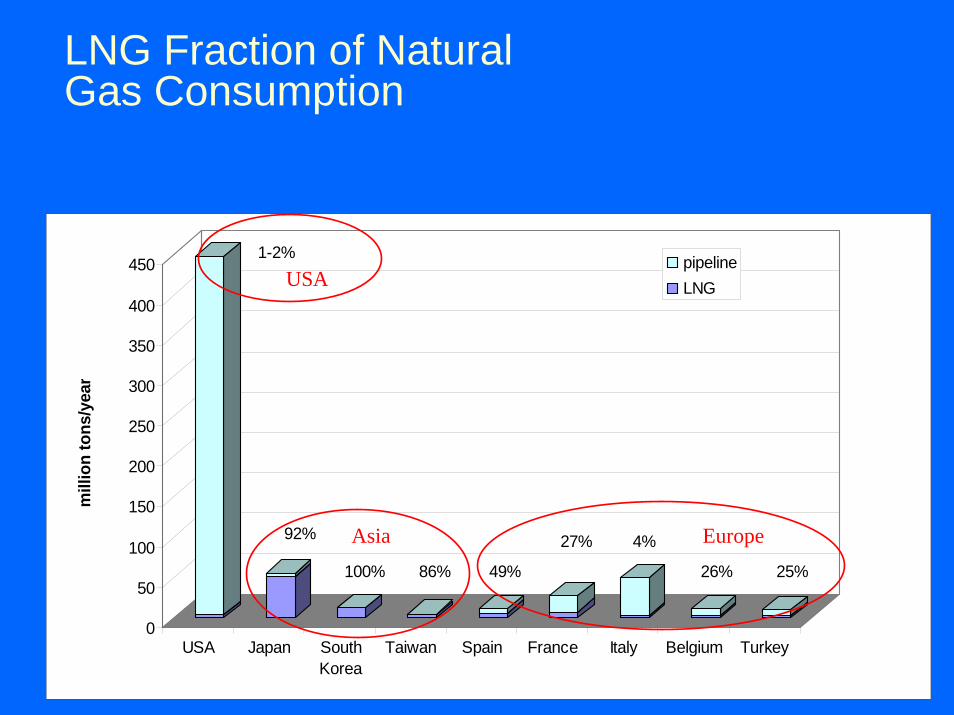
LNG Fraction of Natural Gas Consumption
0
50
100
150
200
250
300
350
400
450
USA Japan SouthKorea
Taiwan Spain France Italy Belgium Turkey
pipelineLNG
mill
ion
tons
/yea
r
1-2%
92%
100% 86% 49%
27% 4%
26% 25%
USA
Asia Europe
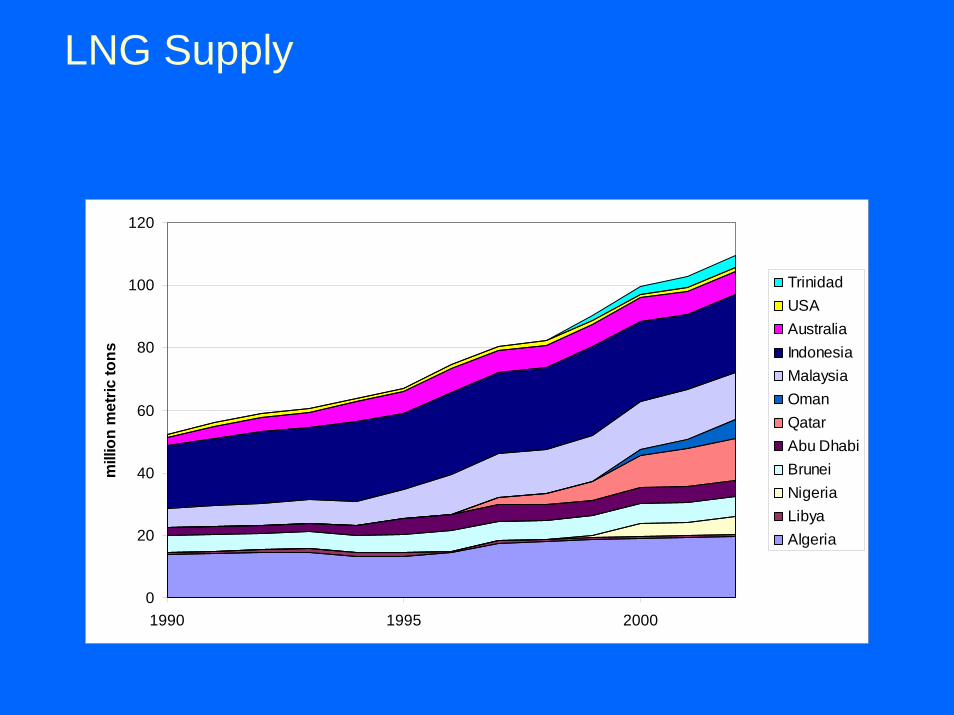
LNG Supply
0
20
40
60
80
100
120
1990 1995 2000
mill
ion
met
ric to
ns
TrinidadUSAAustraliaIndonesiaMalaysiaOmanQatarAbu DhabiBruneiNigeriaLibyaAlgeria
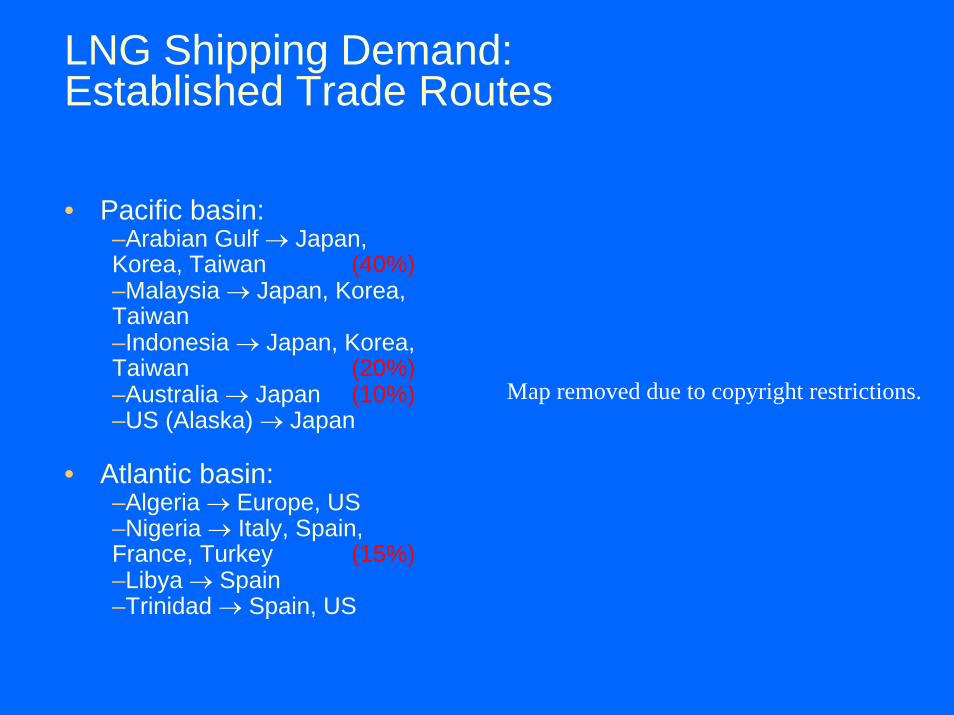
LNG Shipping Demand:Established Trade Routes
• Pacific basin:–Arabian Gulf → Japan, Korea, Taiwan (40%)–Malaysia → Japan, Korea, Taiwan–Indonesia → Japan, Korea, Taiwan (20%)–Australia → Japan (10%)–US (Alaska) → Japan
• Atlantic basin:–Algeria → Europe, US–Nigeria → Italy, Spain, France, Turkey (15%)–Libya → Spain–Trinidad → Spain, US
Map removed due to copyright restrictions.
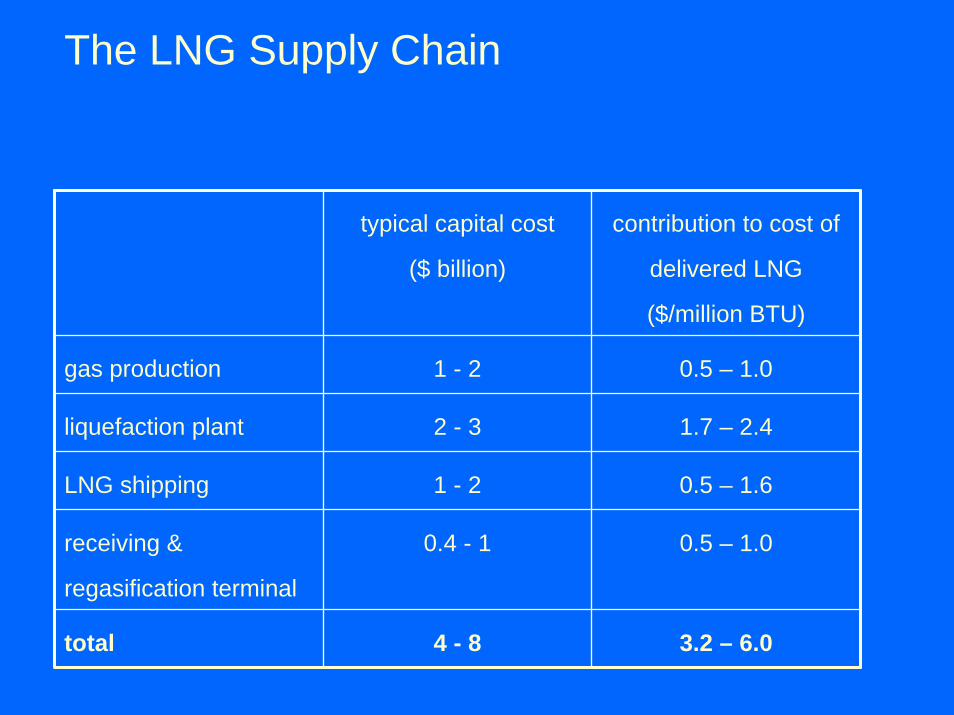
The LNG Supply Chain
typical capital cost
($ billion)
contribution to cost of
delivered LNG
($/million BTU)
gas production 1 - 2 0.5 – 1.0
liquefaction plant 2 - 3 1.7 – 2.4
LNG shipping 1 - 2 0.5 – 1.6
receiving &
regasification terminal
0.4 - 1 0.5 – 1.0
total 4 - 8 3.2 – 6.0
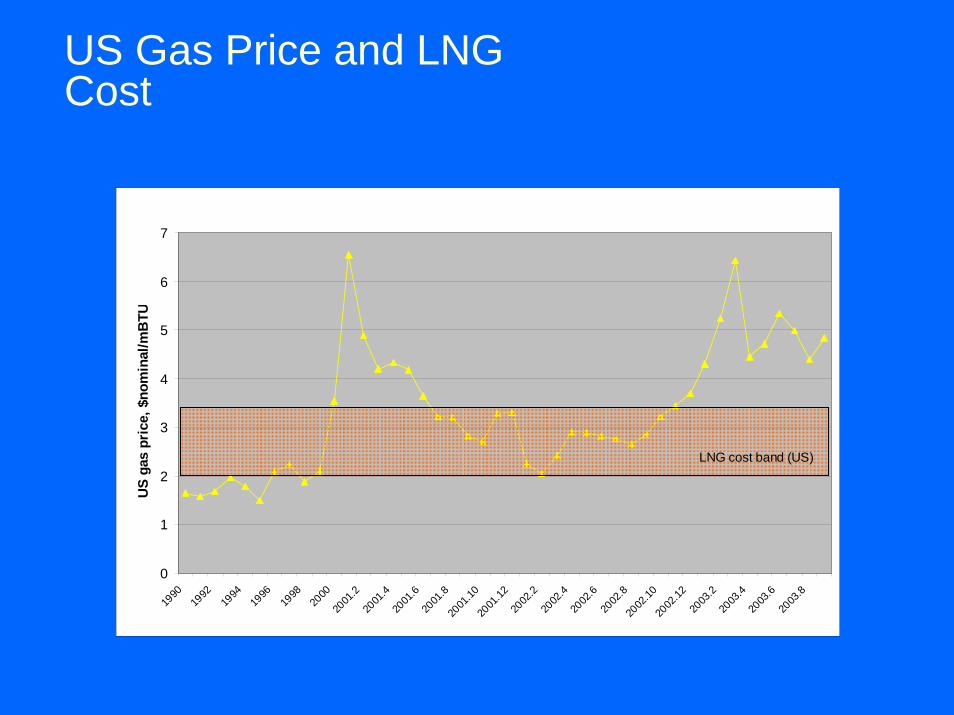
US Gas Price and LNG Cost
0
1
2
3
4
5
6
7
1990
1992
1994
1996
1998
2000
2001
.220
01.4
2001
.620
01.8
2001
.1020
01.12
2002
.220
02.4
2002
.620
02.8
2002
.1020
02.12
2003
.220
03.4
2003
.620
03.8
US
gas
pric
e, $
nom
inal
/mB
TU
LNG cost band (US)
Outline
• LNG shipping in context• shipping demand and supply
– trade projections• demand for LNG & import facilities• LNG supply (liquefaction trains)
– fleet development– implications for fleet utilization
• trends and risks– charter terms– short term (“spot”) trades– structural changes
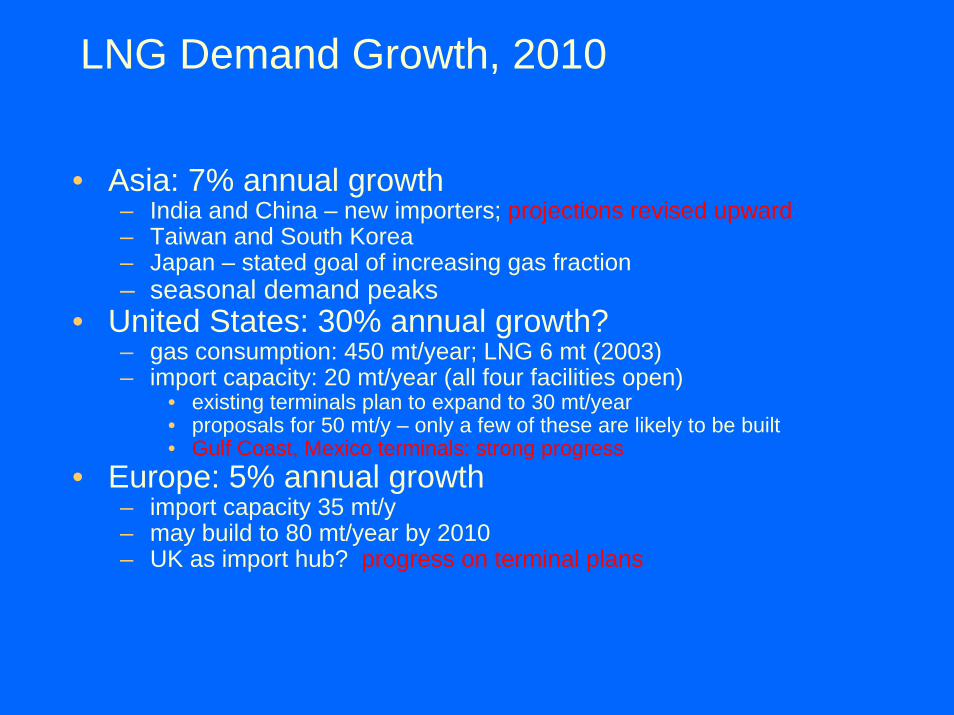
LNG Demand Growth, 2010
• Asia: 7% annual growth– India and China – new importers; projections revised upward– Taiwan and South Korea– Japan – stated goal of increasing gas fraction– seasonal demand peaks
• United States: 30% annual growth?– gas consumption: 450 mt/year; LNG 6 mt (2003)– import capacity: 20 mt/year (all four facilities open)
• existing terminals plan to expand to 30 mt/year• proposals for 50 mt/y – only a few of these are likely to be built• Gulf Coast, Mexico terminals: strong progress
• Europe: 5% annual growth– import capacity 35 mt/y– may build to 80 mt/year by 2010– UK as import hub? progress on terminal plans
12
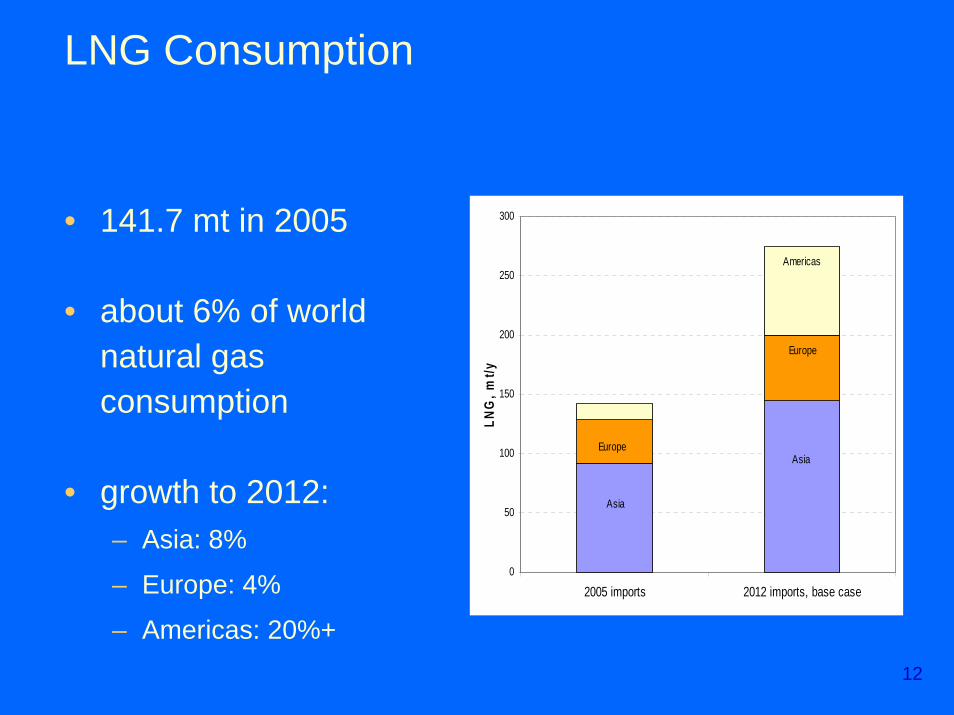
LNG Consumption
• 141.7 mt in 2005
• about 6% of world natural gas consumption
• growth to 2012:– Asia: 8%
– Europe: 4%
– Americas: 20%+
0
50
100
150
200
250
300
2005 imports 2012 imports, base case
LNG
, mt/y
Americas
Europe
Asia
Asia
Europe
13
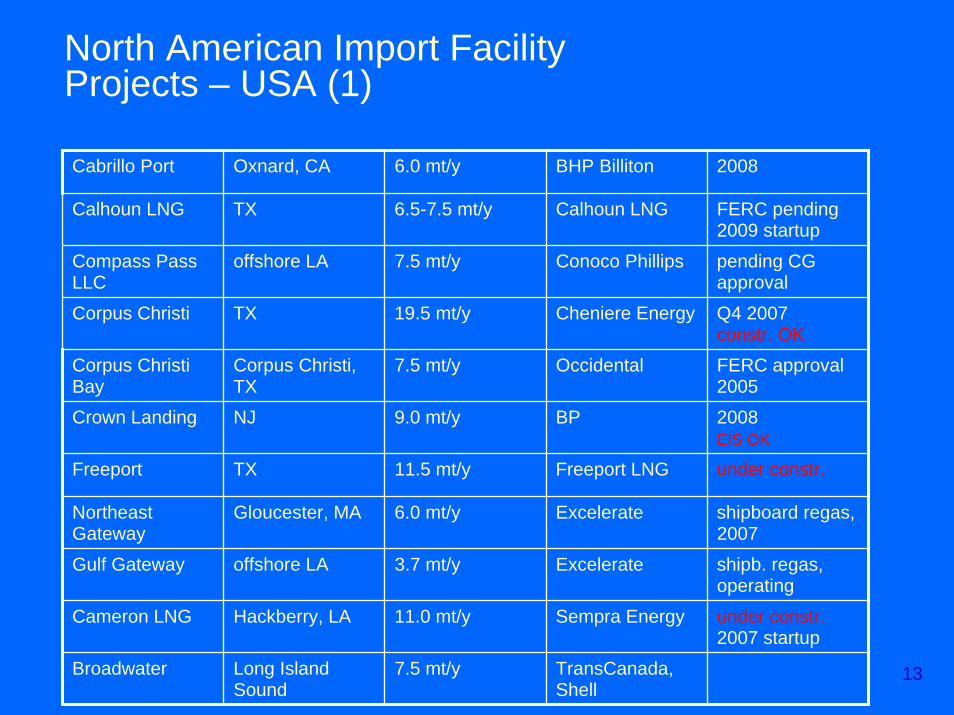
North American Import Facility Projects – USA (1)
Cabrillo Port Oxnard, CA 6.0 mt/y BHP Billiton 2008
Calhoun LNG TX 6.5-7.5 mt/y Calhoun LNG FERC pending2009 startup
Compass Pass LLC
offshore LA 7.5 mt/y Conoco Phillips pending CG approval
Corpus Christi TX 19.5 mt/y Cheniere Energy Q4 2007constr. OK
Corpus Christi Bay
Corpus Christi, TX
7.5 mt/y Occidental FERC approval 2005
Crown Landing NJ 9.0 mt/y BP 2008EIS OK
Freeport TX 11.5 mt/y Freeport LNG under constr.
Northeast Gateway
Gloucester, MA 6.0 mt/y Excelerate shipboard regas, 2007
Gulf Gateway offshore LA 3.7 mt/y Excelerate shipb. regas, operating
Cameron LNG Hackberry, LA 11.0 mt/y Sempra Energy under constr.2007 startup
Broadwater Long Island Sound
7.5 mt/y TransCanada, Shell
14
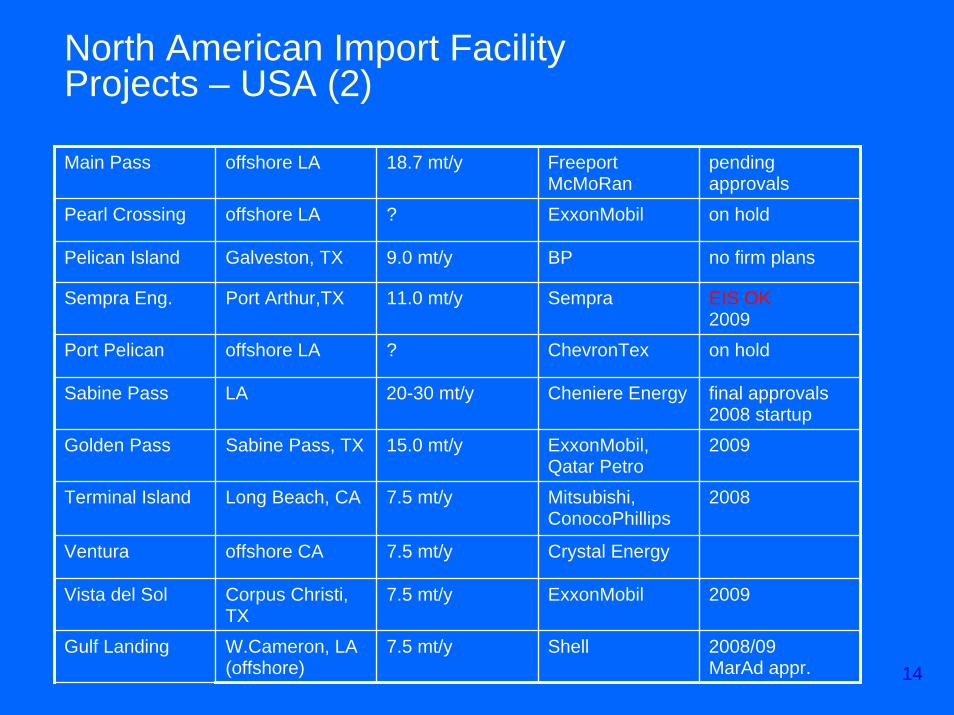
North American Import Facility Projects – USA (2)
Main Pass offshore LA 18.7 mt/y Freeport McMoRan
pending approvals
Pearl Crossing offshore LA ? ExxonMobil on hold
Pelican Island Galveston, TX 9.0 mt/y BP no firm plans
Sempra Eng. Port Arthur,TX 11.0 mt/y Sempra EIS OK2009
Port Pelican offshore LA ? ChevronTex on hold
Sabine Pass LA 20-30 mt/y Cheniere Energy final approvals2008 startup
Golden Pass Sabine Pass, TX 15.0 mt/y ExxonMobil, Qatar Petro
2009
Terminal Island Long Beach, CA 7.5 mt/y Mitsubishi, ConocoPhillips
2008
Ventura offshore CA 7.5 mt/y Crystal Energy
Vista del Sol Corpus Christi, TX
7.5 mt/y ExxonMobil 2009
Gulf Landing W.Cameron, LA (offshore)
7.5 mt/y Shell 2008/09MarAd appr.
15
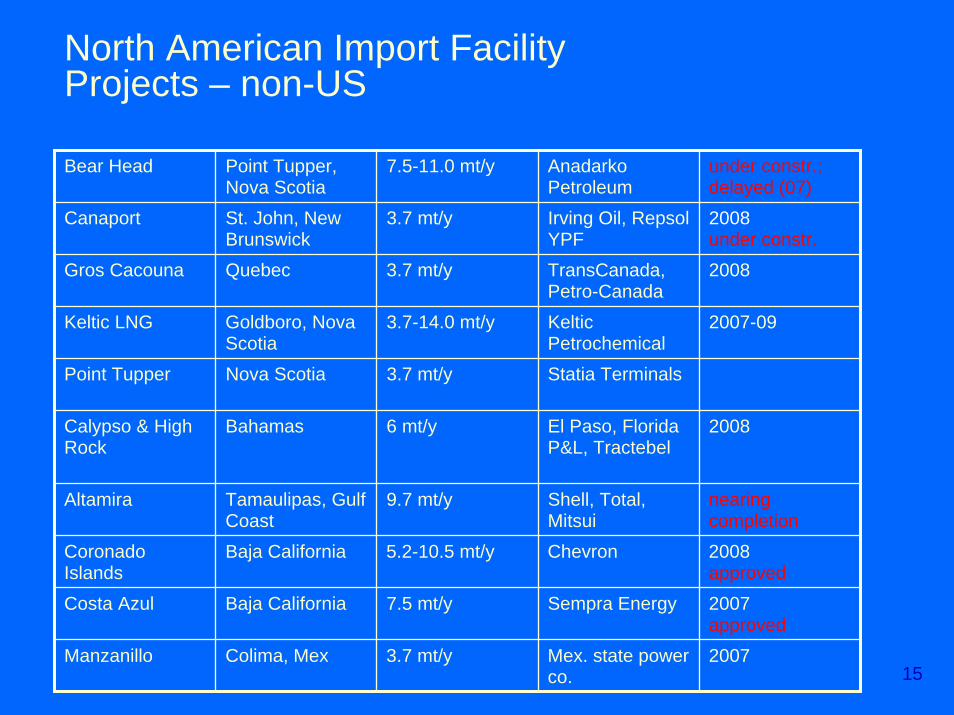
North American Import Facility Projects – non-US
Bear Head Point Tupper, Nova Scotia
7.5-11.0 mt/y Anadarko Petroleum
under constr.; delayed (07)
Canaport St. John, New Brunswick
3.7 mt/y Irving Oil, RepsolYPF
2008under constr.
Gros Cacouna Quebec 3.7 mt/y TransCanada, Petro-Canada
2008
Keltic LNG Goldboro, Nova Scotia
3.7-14.0 mt/y KelticPetrochemical
2007-09
Point Tupper Nova Scotia 3.7 mt/y Statia Terminals
Calypso & High Rock
Bahamas 6 mt/y El Paso, Florida P&L, Tractebel
2008
Altamira Tamaulipas, Gulf Coast
9.7 mt/y Shell, Total, Mitsui
nearing completion
Coronado Islands
Baja California 5.2-10.5 mt/y Chevron 2008approved
Costa Azul Baja California 7.5 mt/y Sempra Energy 2007approved
Manzanillo Colima, Mex 3.7 mt/y Mex. state power co.
2007
16
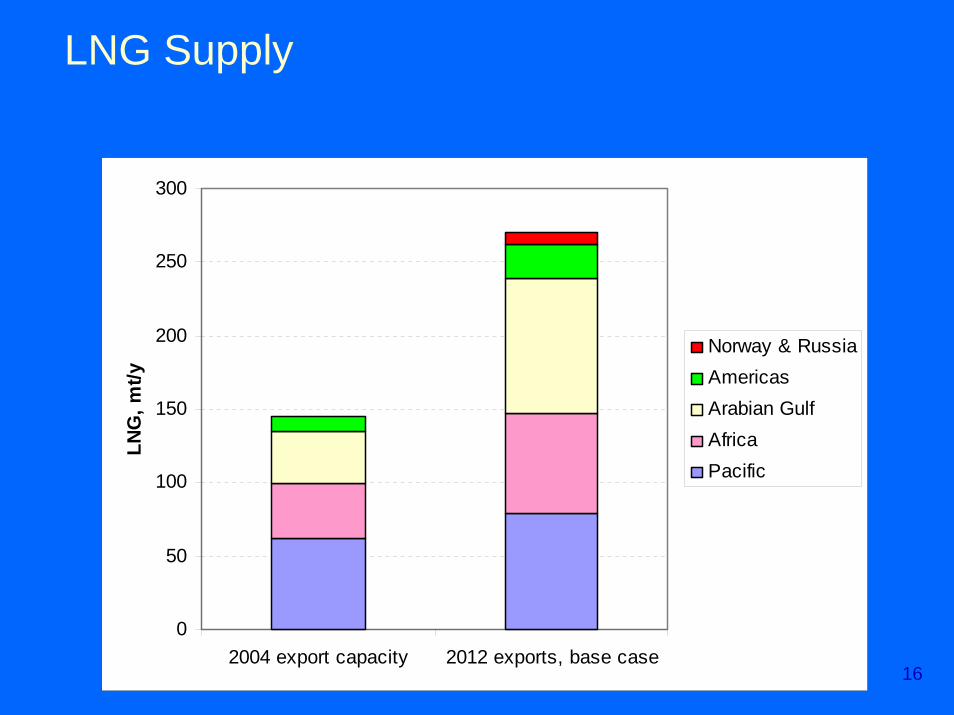
LNG Supply
0
50
100
150
200
250
300
2004 export capacity 2012 exports, base case
LNG
, mt/y
Norway & RussiaAmericasArabian GulfAfricaPacific
17
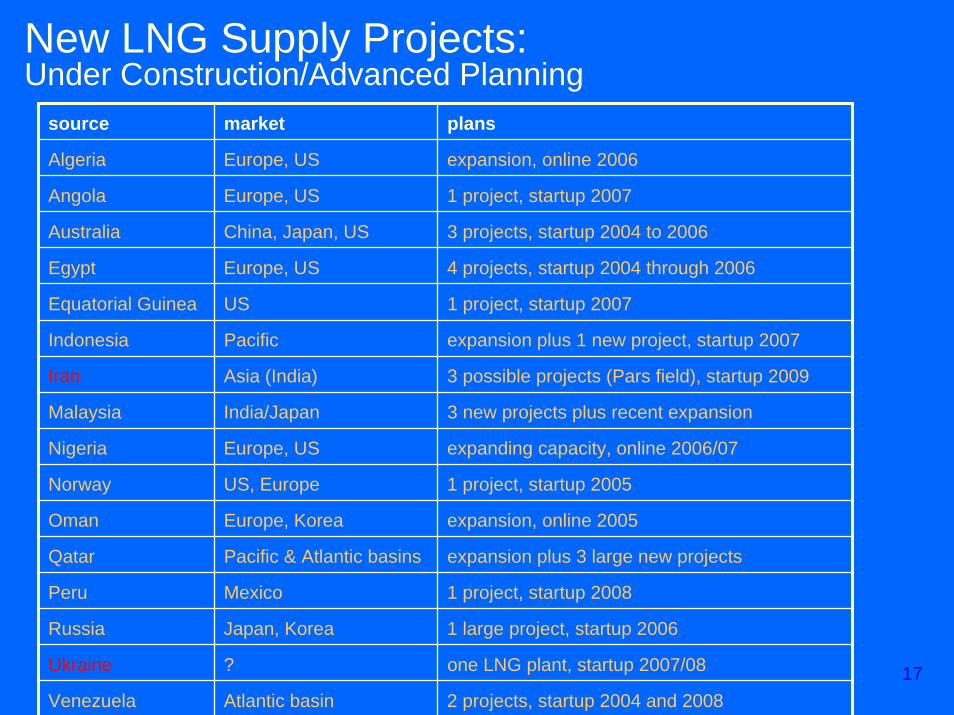
New LNG Supply Projects:Under Construction/Advanced Planning
source market plans
Algeria Europe, US expansion, online 2006
Iran Asia (India) 3 possible projects (Pars field), startup 2009
Angola Europe, US 1 project, startup 2007
Peru Mexico 1 project, startup 2008
Russia Japan, Korea 1 large project, startup 2006
Australia China, Japan, US 3 projects, startup 2004 to 2006
Egypt Europe, US 4 projects, startup 2004 through 2006
Equatorial Guinea US 1 project, startup 2007
Indonesia Pacific expansion plus 1 new project, startup 2007
Malaysia India/Japan 3 new projects plus recent expansion
Nigeria Europe, US expanding capacity, online 2006/07
Norway US, Europe 1 project, startup 2005
Oman Europe, Korea expansion, online 2005
Qatar Pacific & Atlantic basins expansion plus 3 large new projects
Ukraine ? one LNG plant, startup 2007/08
Venezuela Atlantic basin 2 projects, startup 2004 and 2008
18
Shipping Demand Projection
• trade route distance increasing– average 2,300 nm today
– Oman/Qatar to Europe: 4,000-6,000 nm
– Oman/Qatar to N. America: 8,000 nm
• base case growth to 2010: 19%/year– low case 11%
– high case 25%
– strongest growth 2007/08/09
Outline
• LNG shipping in context• shipping demand and supply
– trade projections– fleet development– implications for fleet utilization
• trends and risks– charter terms– short term (“spot”) trades– structural changes
LNG Tank Designs:Spherical Tank (Moss)
Photo removed due to copyright restrictions.
LNG Tank Designs:Prismatic Membrane Tank
Photo removed due to copyright restrictions.
22
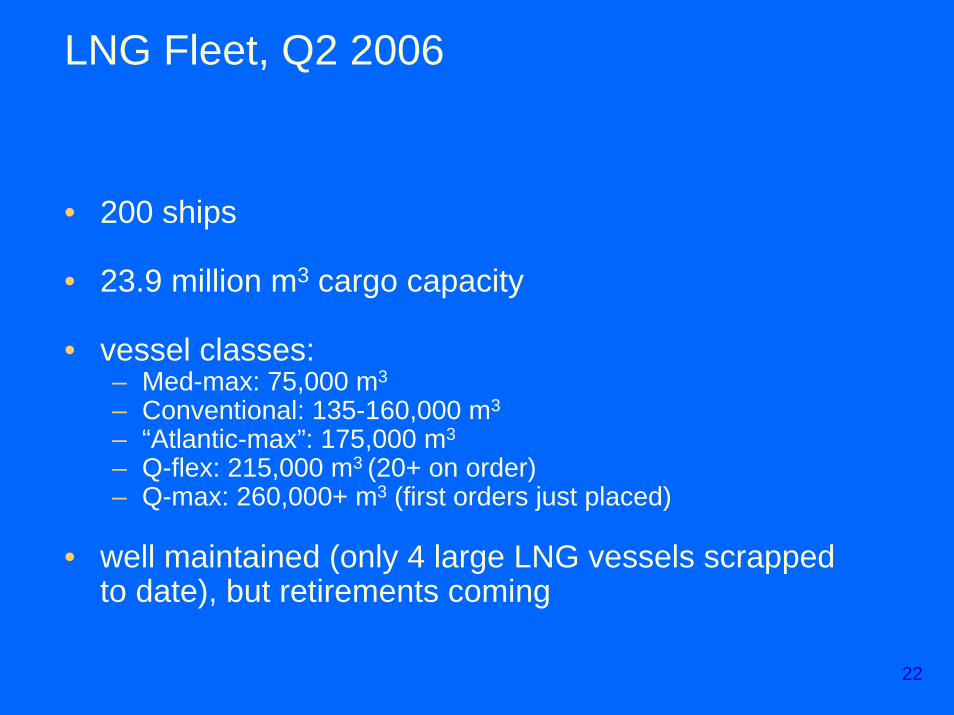
LNG Fleet, Q2 2006
• 200 ships
• 23.9 million m3 cargo capacity
• vessel classes: – Med-max: 75,000 m3
– Conventional: 135-160,000 m3
– “Atlantic-max”: 175,000 m3
– Q-flex: 215,000 m3 (20+ on order) – Q-max: 260,000+ m3 (first orders just placed)
• well maintained (only 4 large LNG vessels scrapped to date), but retirements coming
23
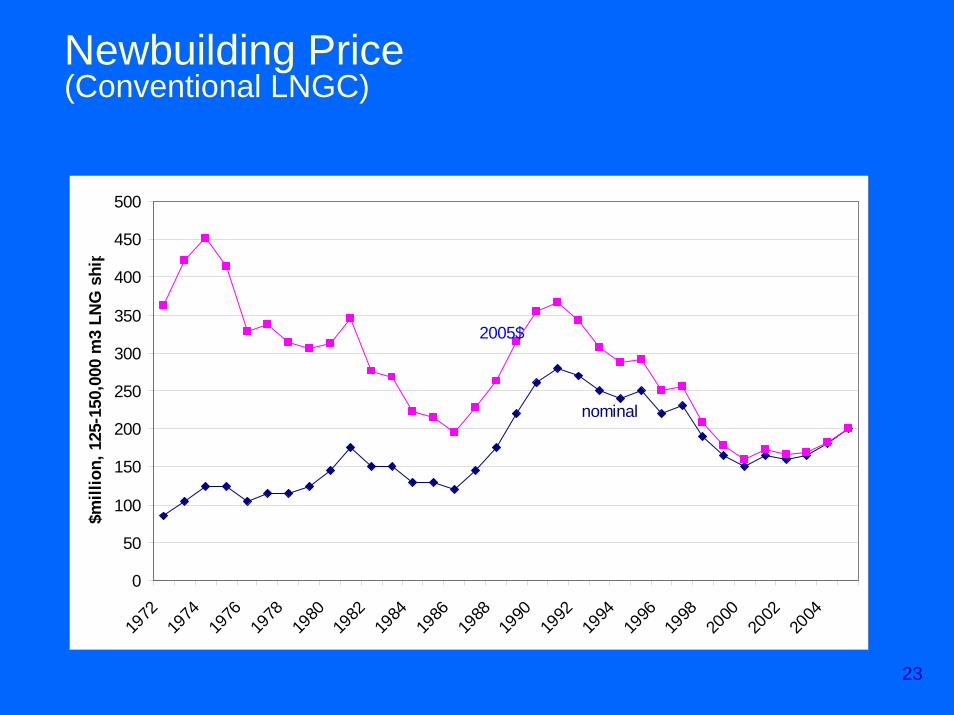
Newbuilding Price(Conventional LNGC)
0
50
100
150
200
250
300
350
400
450
500
1972
1974
1976
1978
1980
1982
1984
1986
1988
1990
1992
1994
1996
1998
2000
2002
2004
$mill
ion,
125
-150
,000
m3
LNG
shi
p
nominal
2005$
24
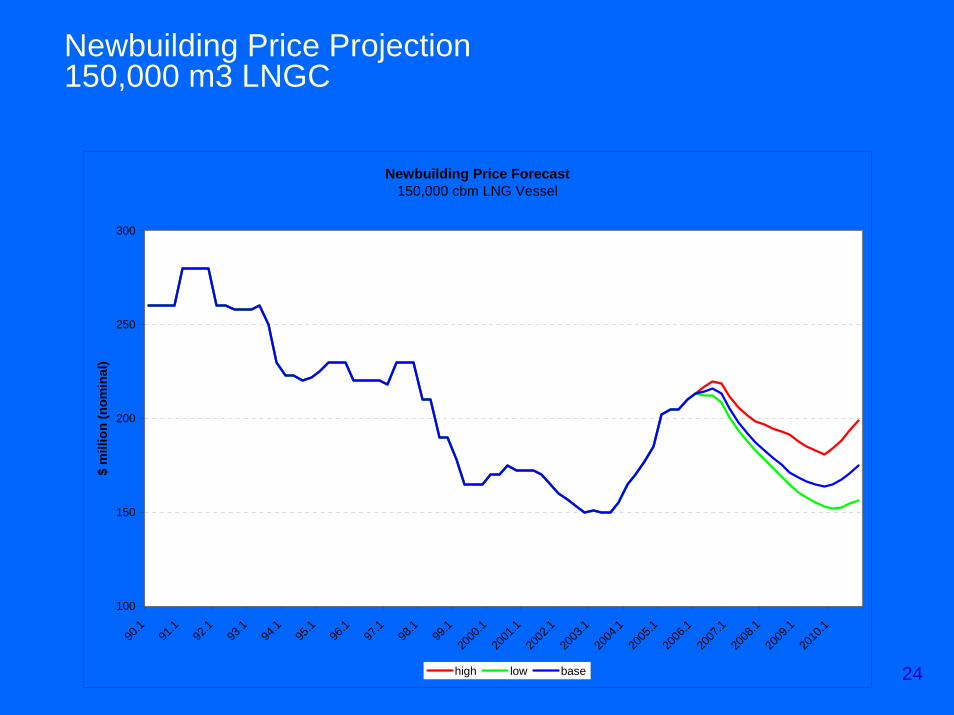
Newbuilding Price Projection150,000 m3 LNGC
Newbuilding Price Forecast 150,000 cbm LNG Vessel
100
150
200
250
300
90.1
91.1
92.1
93.1
94.1
95.1
96.1
97.1
98.1
99.1
2000
.120
01.1
2002
.120
03.1
2004
.120
05.1
2006
.120
07.1
2008
.120
09.1
2010
.1
$ m
illio
n (n
omin
al)
high low base
25
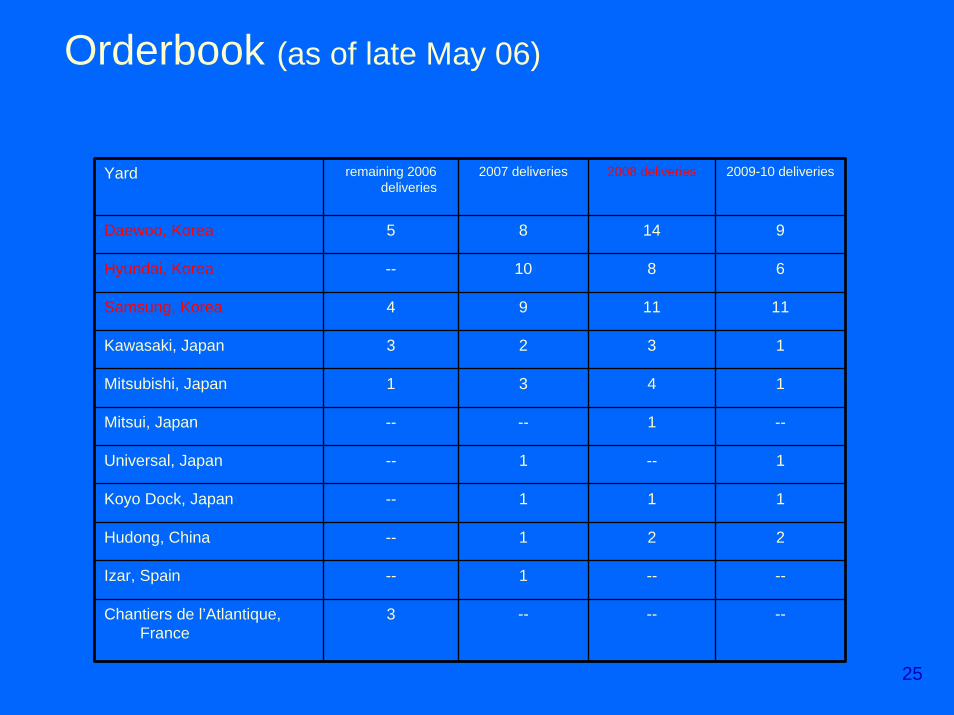
Orderbook (as of late May 06)
Yard remaining 2006 deliveries
2007 deliveries 2008 deliveries 2009-10 deliveries
Daewoo, Korea 5 8 14 9
Hyundai, Korea -- 10 8 6
Samsung, Korea 4 9 11 11
Kawasaki, Japan 3 2 3 1
Mitsubishi, Japan 1 3 4 1
Mitsui, Japan -- -- 1 --
Universal, Japan -- 1 -- 1
Koyo Dock, Japan -- 1 1 1
Hudong, China -- 1 2 2
Izar, Spain -- 1 -- --
Chantiers de l’Atlantique, France
3 -- -- --
26
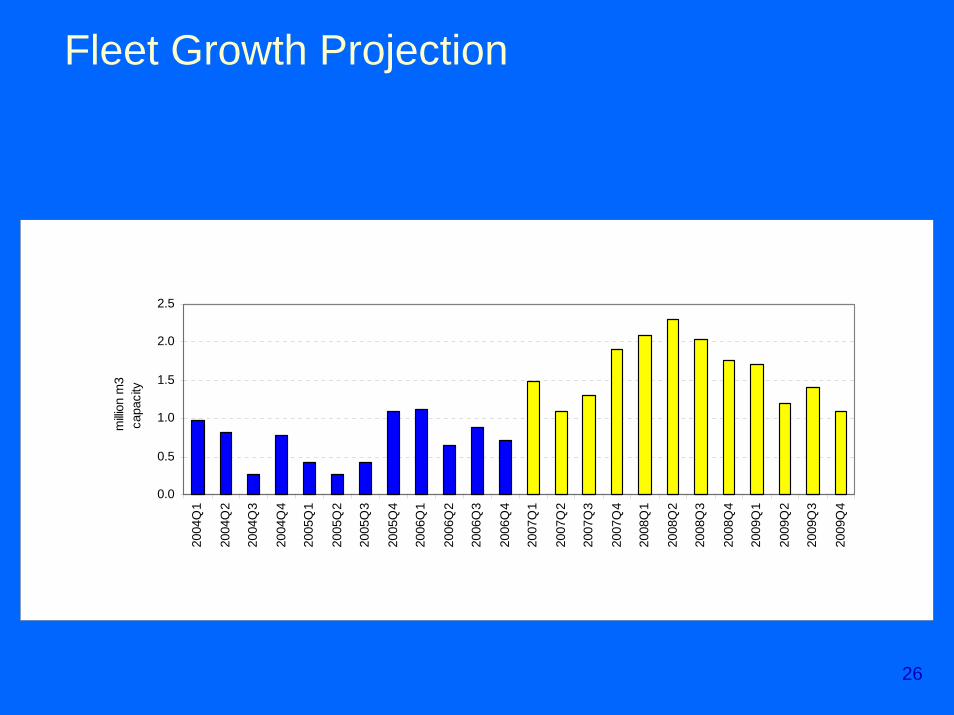
Fleet Growth Projection
0.0
0.5
1.0
1.5
2.0
2.5
2004
Q1
2004
Q2
2004
Q3
2004
Q4
2005
Q1
2005
Q2
2005
Q3
2005
Q4
2006
Q1
2006
Q2
2006
Q3
2006
Q4
2007
Q1
2007
Q2
2007
Q3
2007
Q4
2008
Q1
2008
Q2
2008
Q3
2008
Q4
2009
Q1
2009
Q2
2009
Q3
2009
Q4
milli
on m
3ca
paci
ty
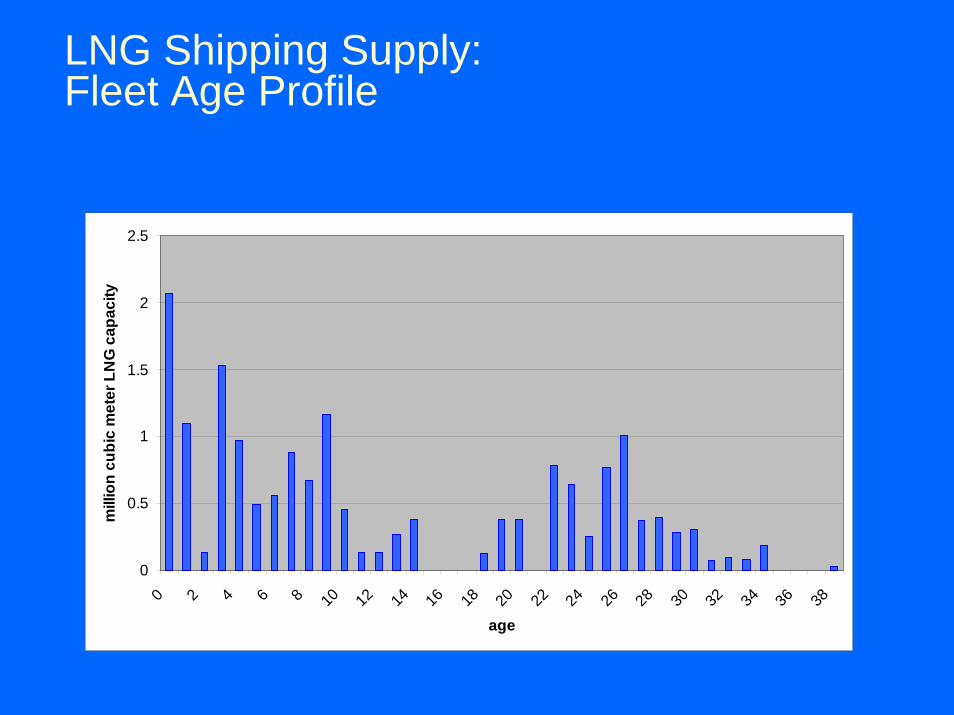
LNG Shipping Supply:Fleet Age Profile
0
0.5
1
1.5
2
2.5
0 2 4 6 8 10 12 14 16 18 20 22 24 26 28 30 32 34 36 38
age
mill
ion
cubi
c m
eter
LN
G c
apac
ity
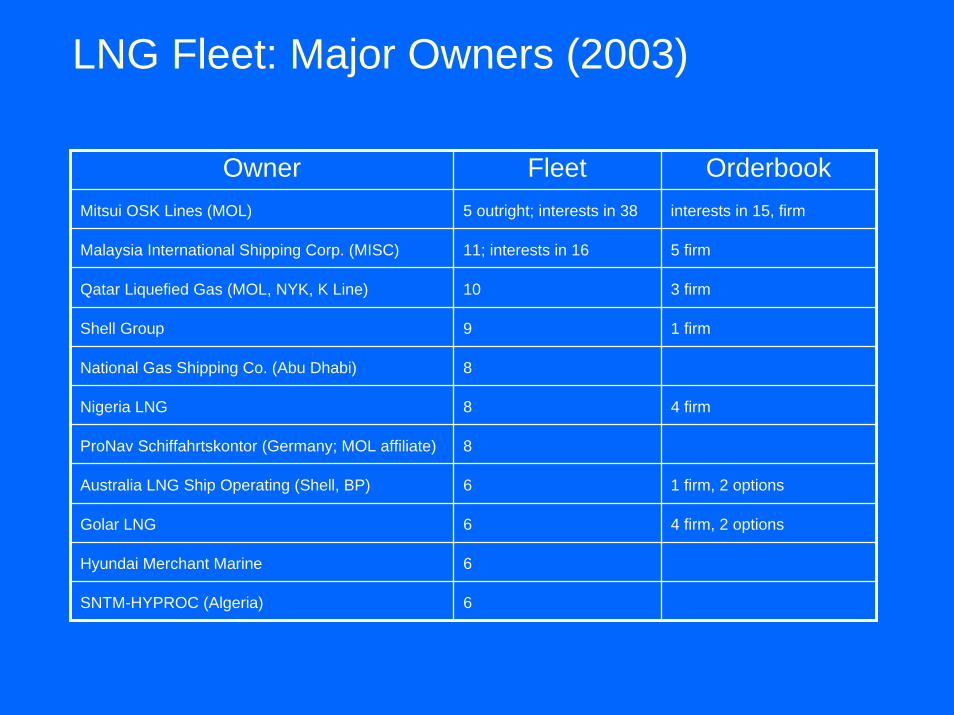
LNG Fleet: Major Owners (2003)
Owner Fleet OrderbookMitsui OSK Lines (MOL) 5 outright; interests in 38
11; interests in 16
10
9
8
8
8
6
6
6
SNTM-HYPROC (Algeria) 6
Malaysia International Shipping Corp. (MISC) 5 firm
interests in 15, firm
Qatar Liquefied Gas (MOL, NYK, K Line) 3 firm
Shell Group 1 firm
National Gas Shipping Co. (Abu Dhabi)
Nigeria LNG 4 firm
ProNav Schiffahrtskontor (Germany; MOL affiliate)
Australia LNG Ship Operating (Shell, BP) 1 firm, 2 options
Golar LNG 4 firm, 2 options
Hyundai Merchant Marine
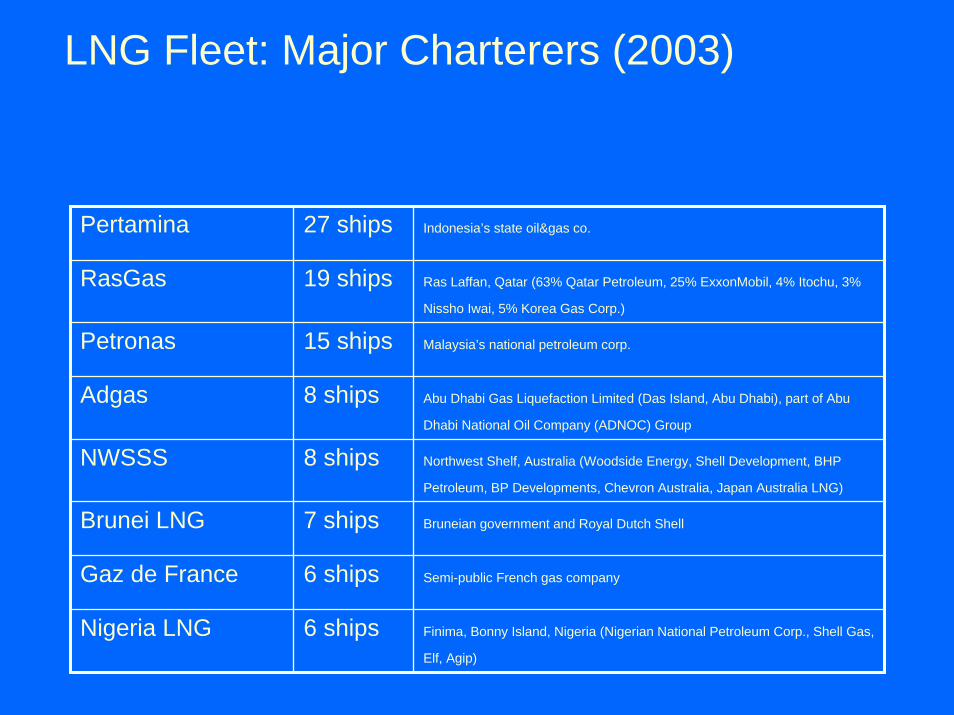
LNG Fleet: Major Charterers (2003)
Pertamina 27 ships Indonesia’s state oil&gas co.
RasGas 19 ships Ras Laffan, Qatar (63% Qatar Petroleum, 25% ExxonMobil, 4% Itochu, 3%
Nissho Iwai, 5% Korea Gas Corp.)
Petronas 15 ships Malaysia’s national petroleum corp.
Adgas 8 ships Abu Dhabi Gas Liquefaction Limited (Das Island, Abu Dhabi), part of Abu
Dhabi National Oil Company (ADNOC) Group
NWSSS 8 ships Northwest Shelf, Australia (Woodside Energy, Shell Development, BHP
Petroleum, BP Developments, Chevron Australia, Japan Australia LNG)
Brunei LNG 7 ships Bruneian government and Royal Dutch Shell
Gaz de France 6 ships Semi-public French gas company
Nigeria LNG 6 ships Finima, Bonny Island, Nigeria (Nigerian National Petroleum Corp., Shell Gas,
Elf, Agip)
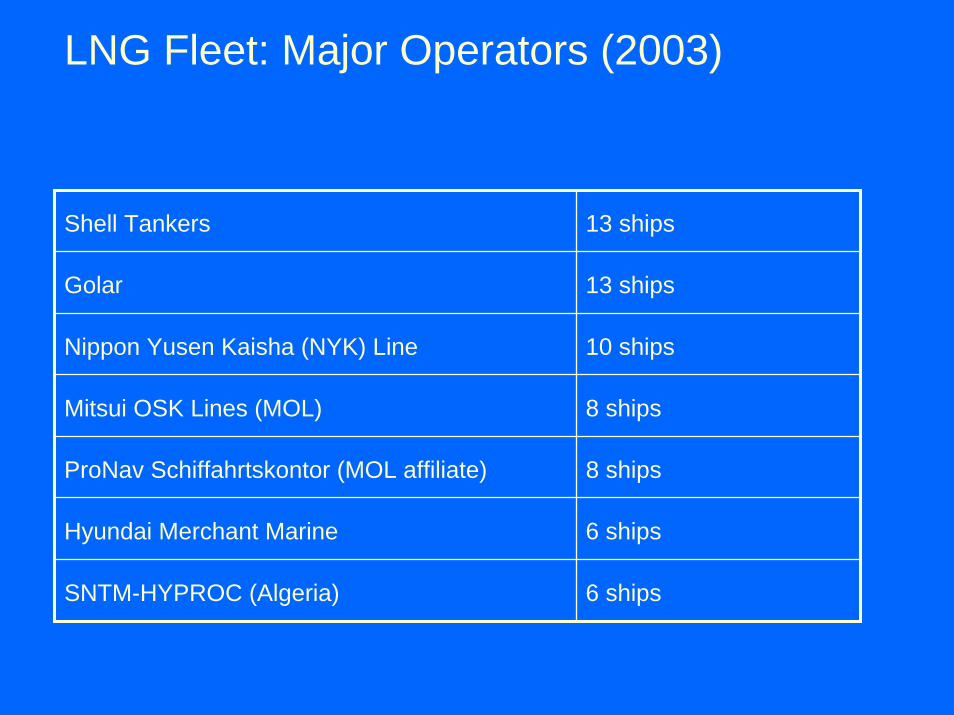
LNG Fleet: Major Operators (2003)
Shell Tankers 13 ships
Golar 13 ships
Nippon Yusen Kaisha (NYK) Line 10 ships
Mitsui OSK Lines (MOL) 8 ships
ProNav Schiffahrtskontor (MOL affiliate) 8 ships
Hyundai Merchant Marine 6 ships
SNTM-HYPROC (Algeria) 6 ships
Outline
• LNG shipping in context• shipping demand and supply
– trade projections– fleet development– implications for fleet utilization
• trends and risks– charter terms– short term (“spot”) trades– structural changes
32
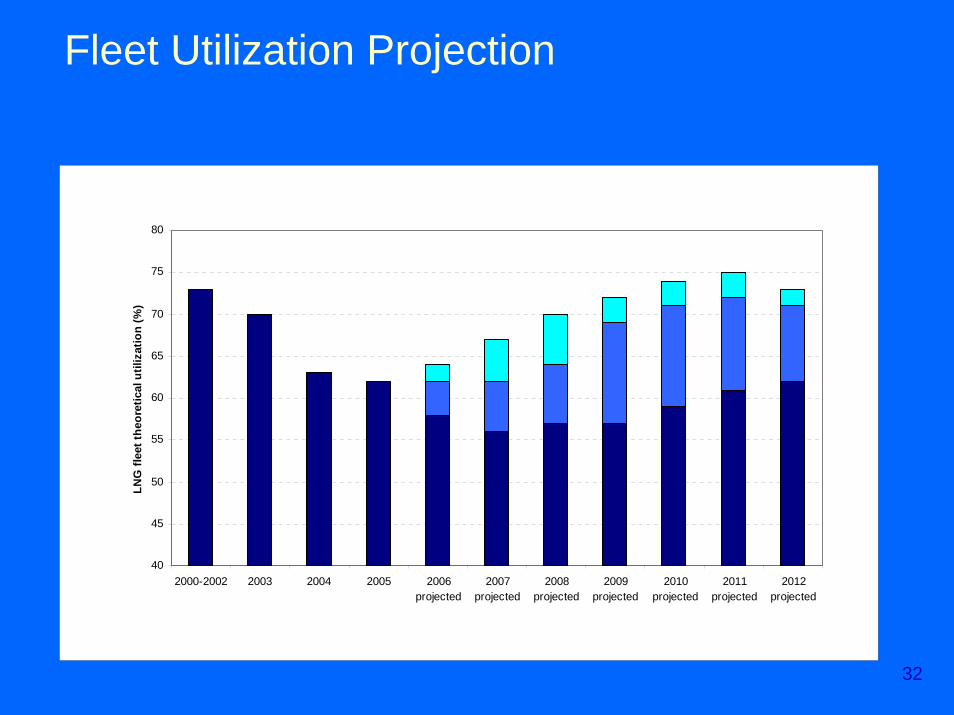
Fleet Utilization Projection
40
45
50
55
60
65
70
75
80
2000-2002 2003 2004 2005 2006projected
2007projected
2008projected
2009projected
2010projected
2011projected
2012projected
LNG
flee
t the
oret
ical
util
izat
ion
(%)
33
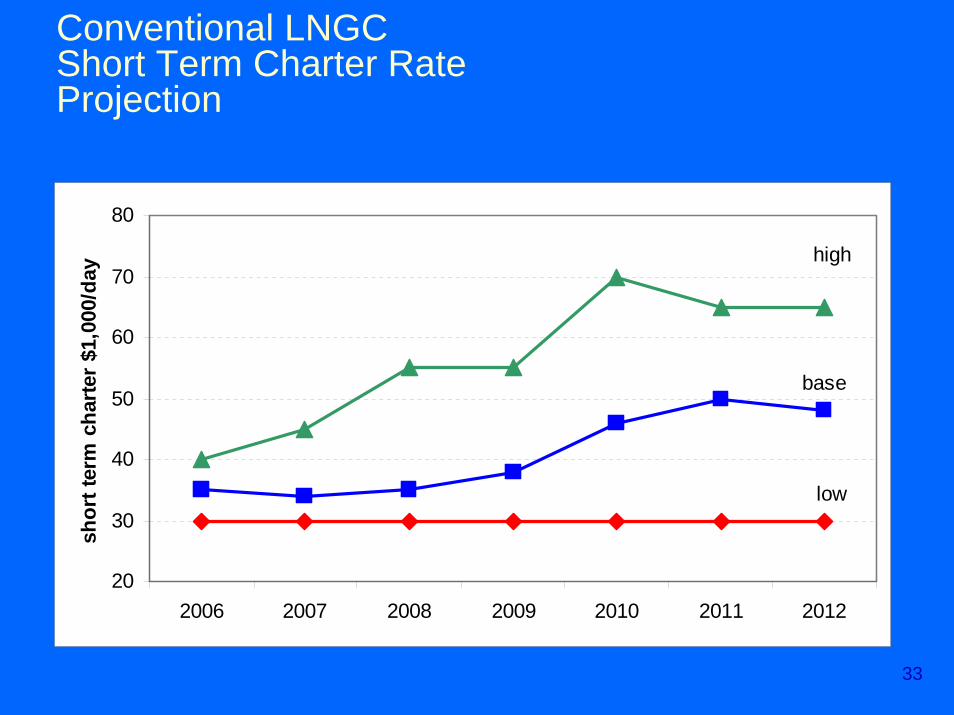
Conventional LNGC Short Term Charter Rate Projection
20
30
40
50
60
70
80
2006 2007 2008 2009 2010 2011 2012
shor
t ter
m c
harte
r $1
,000
/day
low
high
base
Outline
• LNG shipping in context• shipping demand and supply
– trade projections– fleet development– implications for fleet utilization
• trends and risks– charter terms– short term (“spot”) trades– structural changes
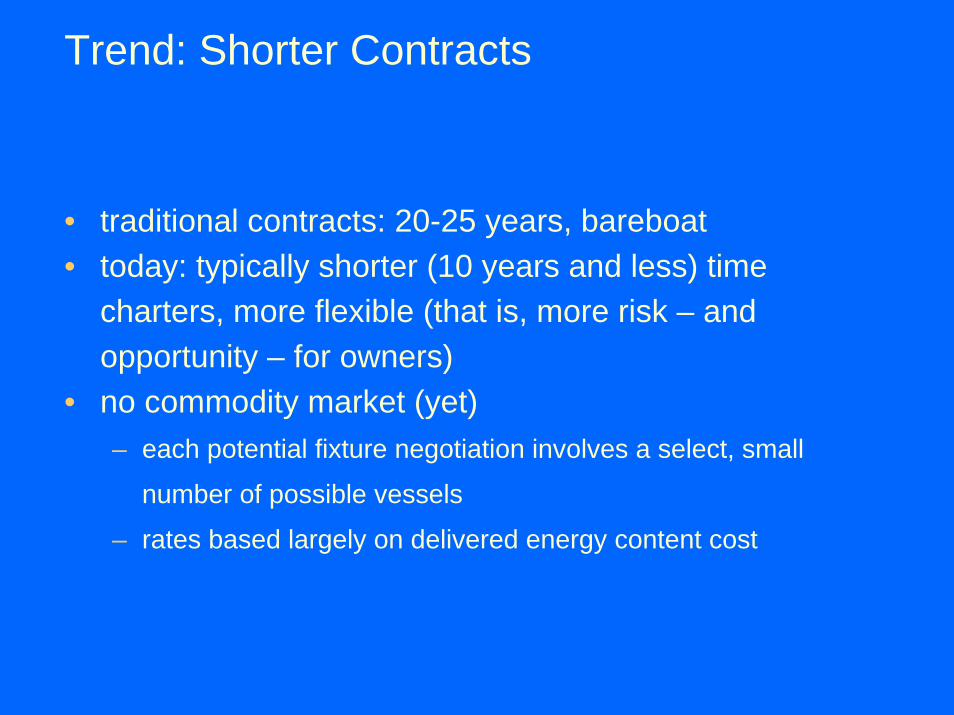
Trend: Shorter Contracts
• traditional contracts: 20-25 years, bareboat• today: typically shorter (10 years and less) time
charters, more flexible (that is, more risk – and opportunity – for owners)
• no commodity market (yet)– each potential fixture negotiation involves a select, small
number of possible vessels
– rates based largely on delivered energy content cost
Outline
• LNG shipping in context• shipping demand and supply
– trade projections– fleet development– implications for fleet utilization
• trends and risks– charter terms– short term (“spot”) trades– structural changes
“Spot” Market Growing
• excess supply capacity • underutilized fleet• demand fluctuations and import terminal
capacity– Atlantic market (US)– Pacific market (Korea, Japan, India)
• “compartmentalized”
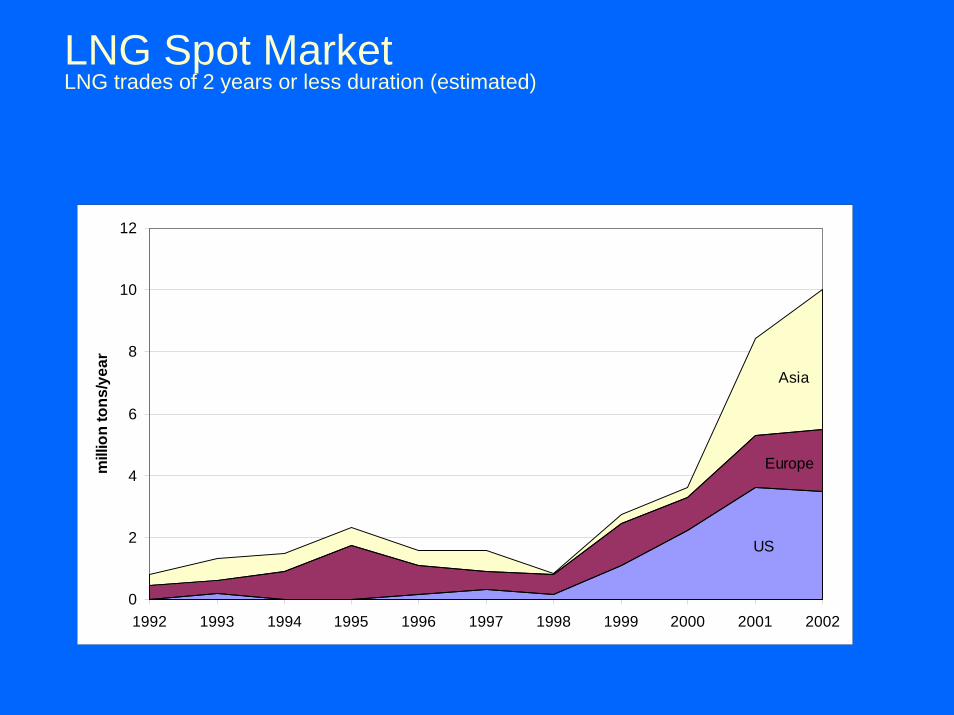
LNG Spot MarketLNG trades of 2 years or less duration (estimated)
0
2
4
6
8
10
12
1992 1993 1994 1995 1996 1997 1998 1999 2000 2001 2002
mill
ion
tons
/yea
r
Asia
Europe
US
“Spot” Trade Participation
• 75% of short term fixtures have been vessels within their own contract trades (particularly on Pacific routes)
• most “spot” voyages to date on Atlantic routes, “Atlantic” owners– Africa, Arabia to Europe, US– Trinidad to US, Europe
• Asian routes & vessels becoming more engaged (MISC)
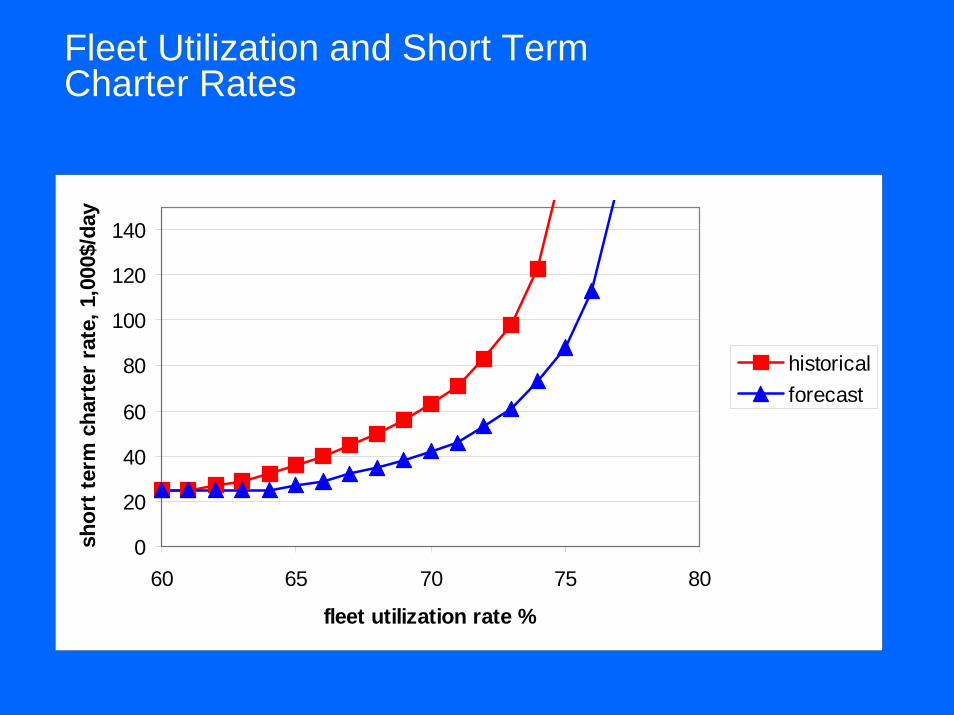
Fleet Utilization and Short Term Charter Rates
0
20
40
60
80
100
120
140
60 65 70 75 80
fleet utilization rate %
shor
t ter
m c
hart
er r
ate,
1,0
00$/
day
historicalforecast
Outline
• LNG shipping in context• shipping demand and supply
– trade projections– fleet development– implications for fleet utilization
• trends and risks– charter terms– short term (“spot”) trades– structural changes
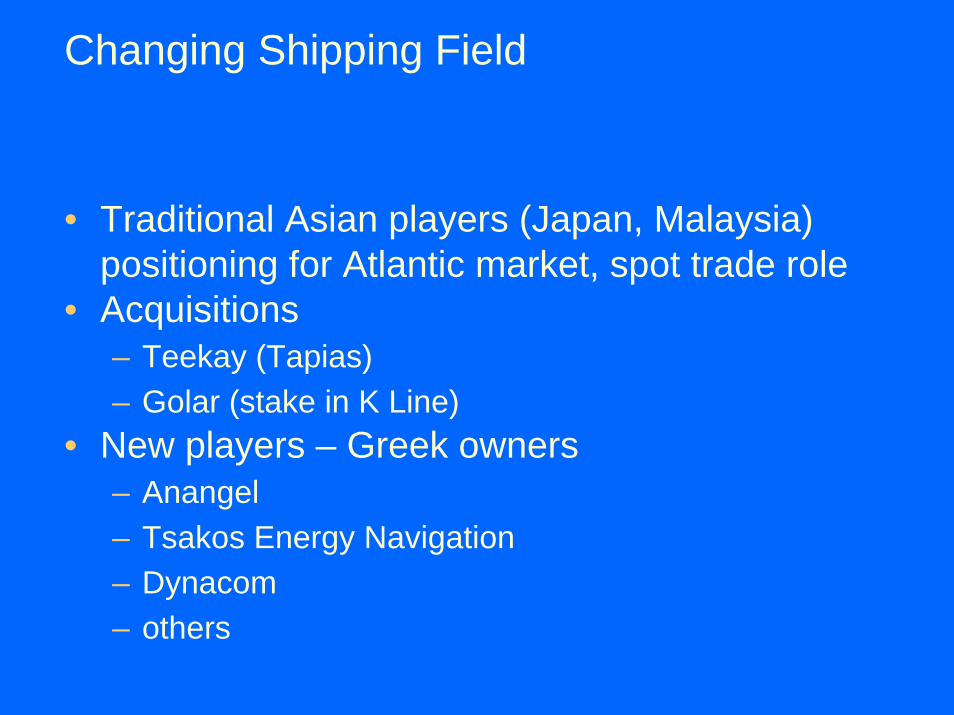
Changing Shipping Field
• Traditional Asian players (Japan, Malaysia) positioning for Atlantic market, spot trade role
• Acquisitions– Teekay (Tapias)– Golar (stake in K Line)
• New players – Greek owners– Anangel– Tsakos Energy Navigation– Dynacom– others
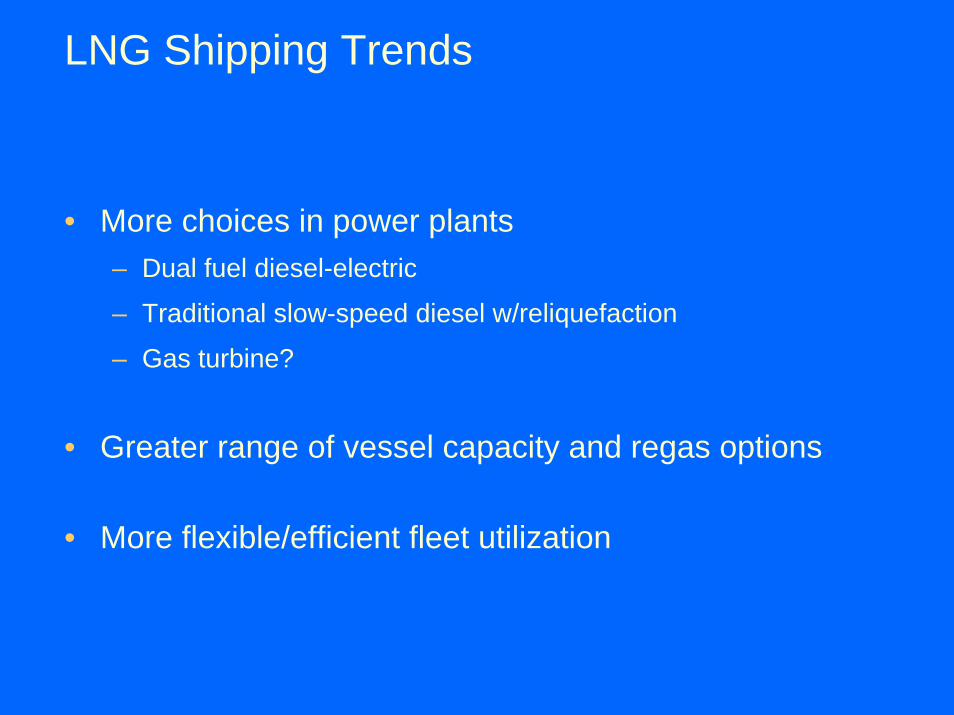
LNG Shipping Trends
• More choices in power plants– Dual fuel diesel-electric
– Traditional slow-speed diesel w/reliquefaction
– Gas turbine?
• Greater range of vessel capacity and regas options
• More flexible/efficient fleet utilization
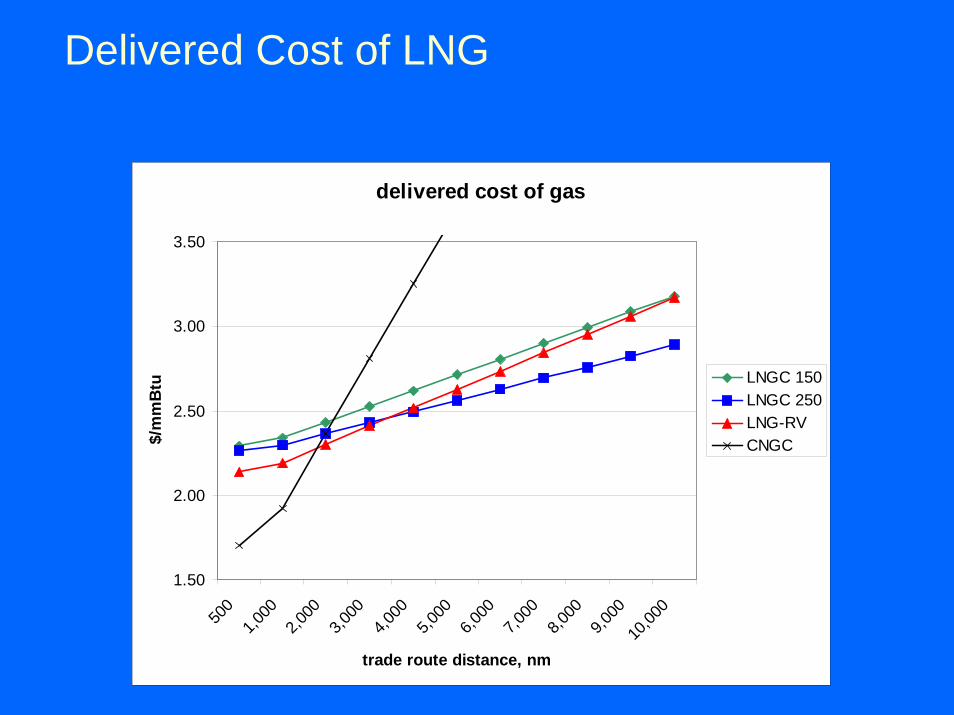
Delivered Cost of LNG
delivered cost of gas
1.50
2.00
2.50
3.00
3.50
500
1,000
2,000
3,000
4,000
5,000
6,000
7,000
8,000
9,000
10,00
0
trade route distance, nm
$/m
mB
tu LNGC 150LNGC 250LNG-RVCNGC
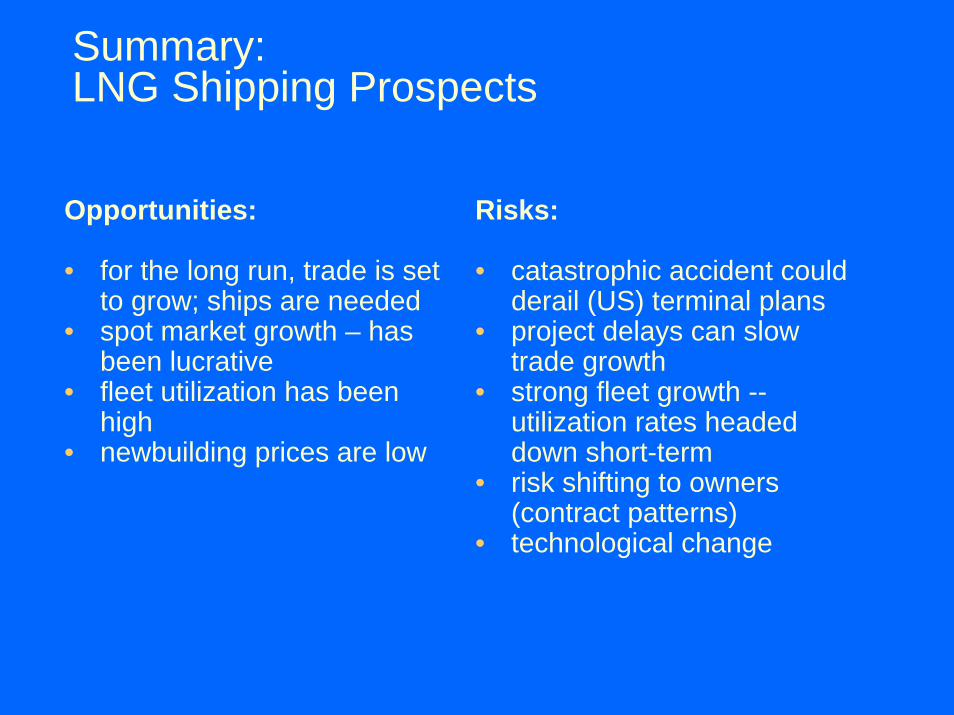
Summary:LNG Shipping Prospects
Opportunities:
• for the long run, trade is set to grow; ships are needed
• spot market growth – has been lucrative
• fleet utilization has been high
• newbuilding prices are low
Risks:
• catastrophic accident could derail (US) terminal plans
• project delays can slow trade growth
• strong fleet growth --utilization rates headed down short-term
• risk shifting to owners (contract patterns)
• technological change
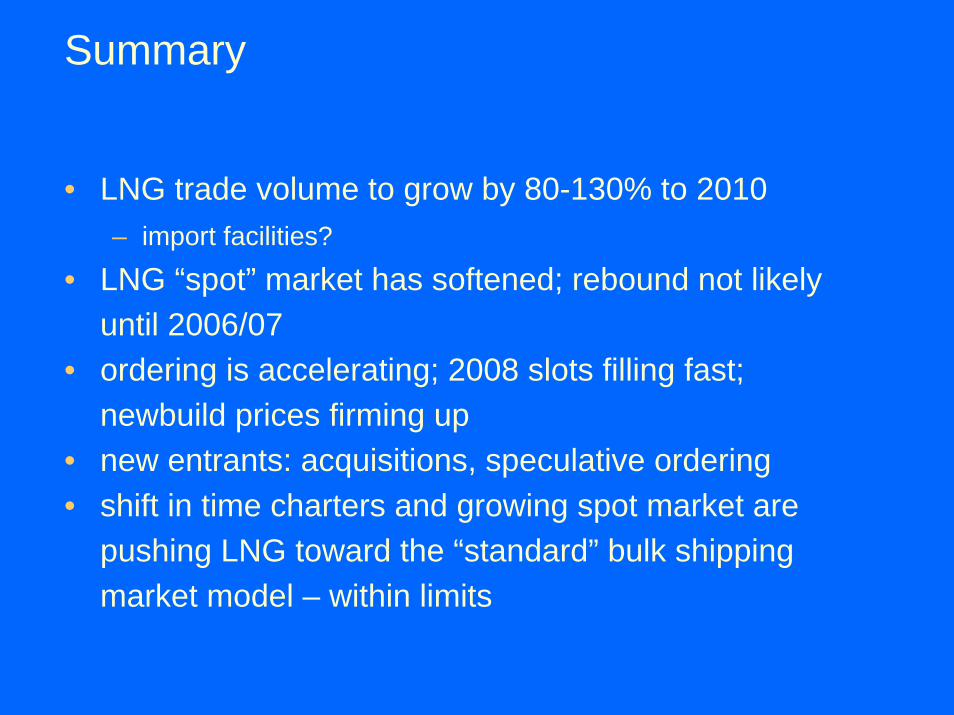
Summary
• LNG trade volume to grow by 80-130% to 2010– import facilities?
• LNG “spot” market has softened; rebound not likely until 2006/07
• ordering is accelerating; 2008 slots filling fast; newbuild prices firming up
• new entrants: acquisitions, speculative ordering• shift in time charters and growing spot market are
pushing LNG toward the “standard” bulk shipping market model – within limits