Embed Size (px)
Citation preview

Statistical Shape Modeling Using MDLIncorporating Shape, Appearance, and Expert
Knowledge
Aaron D. Ward and Ghassan Hamarneh
Medical Image Analysis Lab,School of Computing Science, Simon Fraser University, Canada
{award,hamarneh}@cs.sfu.cahttp://mial.cs.sfu.ca/
Abstract. We propose a highly automated approach to the point cor-respondence problem for anatomical shapes in medical images. Manuallandmarking is performed on a small subset of the shapes in the study,and a machine learning approach is used to elucidate the characteris-tic shape and appearance features at each landmark. A classifier trainedusing these features defines a cost function that drives key landmarksto anatomically meaningful locations after MDL-based correspondenceestablishment. Results are shown for artificial examples as well as realdata.
1 Introduction
In the study of the relationship between anatomical shapes and pathologicalconditions, it is useful to explore and quantify anatomical shape variability. Tothis end, the point correspondence problem must be solved: a mapping mustbe established between points that represents an anatomically meaningful cor-respondence, to ensure meaningful shape statistics. The Minimum DescriptionLength (MDL) approach to this problem has received considerable attentionin the research community [1]. Briefly, this approach is a means of evaluatinga chosen point correspondence by measuring the information theoretic cost oftransmitting the shape model resulting from the correspondence. A previousstudy revealed that the MDL approach exceeds other current approaches in itsagreement with landmarks placed by a human expert [2]. However, for corre-spondences established between human brain ventricles, this study found thatthe mean disagreement between landmarks placed by MDL and expert land-marks was ≈ 4 mm; a significant error. Row 1 of figure 2 illustrates this prob-lem; although the established correspondence appears good according to thecoloured visualization, highlighting specific point correspondences reveals errorsat the peak apexes, particularly at the small peak. Since this peak representslittle information content, MDL’s cost function tends to de-emphasize it.
The fundamental issue here is that saliency is not necessarily encoded by aninformation theoretic compactness measure. There exists research into integrat-ing geometry into the MDL process [3,4]. The idea behind these approaches is to
N. Ayache, S. Ourselin, A. Maeder (Eds.): MICCAI 2007, Part I, LNCS 4791, pp. 278–285, 2007.c© Springer-Verlag Berlin Heidelberg 2007
Statistical Shape Modeling Using MDL 279
represent the shapes in terms of some geometric measurement such as curvature,and run MDL on this representation. These approaches are steps in the rightdirection and speak to the need for the integration of geometric information withMDL. However, they suffer the shortcomings of the arbitrary choice of geometricfeatures and their uniform use throughout the object surface, failing to considerthat different surface points may be characterized by different features.
We propose the use of expert knowledge, in the form of a small set of land-marked training examples, to guide the selection of shape and appearance fea-tures. These features are used in guiding MDL-based point correspondence tosolutions that correspond with human intuitions of point saliency. Since we ex-pect that human anatomists establish meaningful point correspondence basedboth on local shape and appearance information (from the underlying medicalimages), we acquire shape and appearance information about the points chosenby the user during the training phase. We automatically learn, for each landmark,the specific shape and appearance features that best distinguish the landmark.We then use the learned features to guide the process of correspondence estab-lishment toward a solution that agrees with human intuition. There exists anabundance of expert knowledge about anatomically meaningful landmarks, andour philosophy is that this information should not be ignored in a landmarkingapproach.
2 Methods
2.1 Method Overview
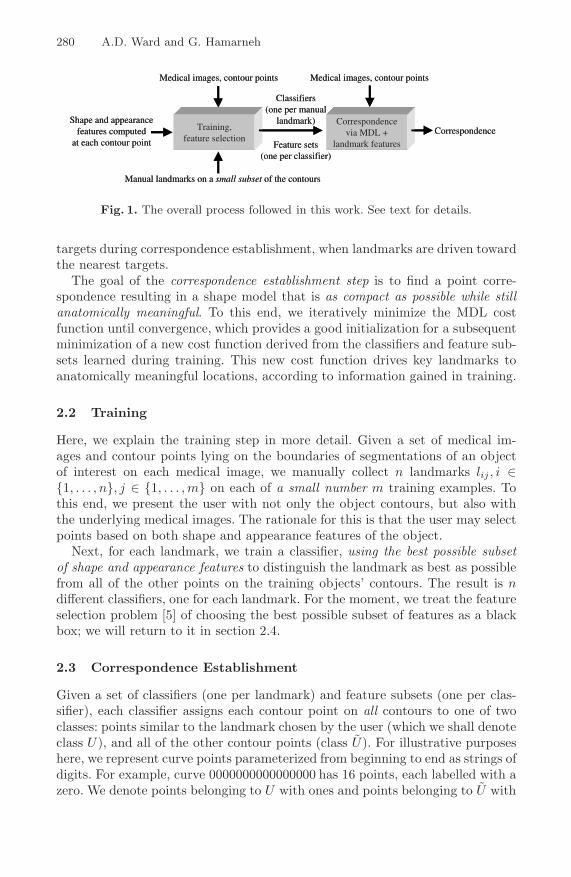
At a high level, the overall process used in this work consists of two steps, givenby the boxes in figure 1: (1) acquiring knowledge about distinguishing shapeand appearance features for each expert-chosen landmark (“Training”), and (2)applying that knowledge to drive the point correspondence process toward abetter solution (“Correspondence via MDL + landmark features”).
The goal of the training step is to find, for each landmark chosen by theuser, a set of shape and appearance features that, when utilized in the pointcorrespondence process, (1) drives landmarks toward anatomically meaningfultargets as indicated by the user, and (2) reduces as much as possible the chancesof a landmark being driven toward a wrong target having similar shape andappearance features to those indicated by the user. The high-level process usedin training is to select a subset of shape and appearance features (in a subset,some features are used and some not) that best satisfies the above criteria. Tothis end, we have designed a cost function that evaluates each subset. The costfunction is a combination of two types of errors: a target error εt and a basin widtherror εb. εt, for a given subset of features, is inversely related to the accuracy withwhich a classifier selects target contour points in the training set as belonging tothe class of expert-labelled landmarks. Ideally, the classifier would select only theexpert-selected points as targets, yielding εt = 0. εb measures, for a given subsetof features, the spacing between detected targets along the contour. Ideally, thisspacing should be as large as possible in order to eliminate confusion between
280 A.D. Ward and G. Hamarneh
Training,feature selection
Medical images, contour points
Shape and appearancefeatures computed
at each contour point
Manual landmarks on a small subset of the contours
Classifiers(one per manual
landmark) Correspondencevia MDL +
landmark features
Correspondence
Feature sets(one per classifier)
Medical images, contour points
Fig. 1. The overall process followed in this work. See text for details.
targets during correspondence establishment, when landmarks are driven towardthe nearest targets.
The goal of the correspondence establishment step is to find a point corre-spondence resulting in a shape model that is as compact as possible while stillanatomically meaningful. To this end, we iteratively minimize the MDL costfunction until convergence, which provides a good initialization for a subsequentminimization of a new cost function derived from the classifiers and feature sub-sets learned during training. This new cost function drives key landmarks toanatomically meaningful locations, according to information gained in training.
2.2 Training
Here, we explain the training step in more detail. Given a set of medical im-ages and contour points lying on the boundaries of segmentations of an objectof interest on each medical image, we manually collect n landmarks lij , i ∈{1, . . . , n}, j ∈ {1, . . . , m} on each of a small number m training examples. Tothis end, we present the user with not only the object contours, but also withthe underlying medical images. The rationale for this is that the user may selectpoints based on both shape and appearance features of the object.
Next, for each landmark, we train a classifier, using the best possible subsetof shape and appearance features to distinguish the landmark as best as possiblefrom all of the other points on the training objects’ contours. The result is ndifferent classifiers, one for each landmark. For the moment, we treat the featureselection problem [5] of choosing the best possible subset of features as a blackbox; we will return to it in section 2.4.
2.3 Correspondence Establishment
Given a set of classifiers (one per landmark) and feature subsets (one per clas-sifier), each classifier assigns each contour point on all contours to one of twoclasses: points similar to the landmark chosen by the user (which we shall denoteclass U), and all of the other contour points (class U). For illustrative purposeshere, we represent curve points parameterized from beginning to end as strings ofdigits. For example, curve 0000000000000000 has 16 points, each labelled with azero. We denote points belonging to U with ones and points belonging to U with
Statistical Shape Modeling Using MDL 281
zeros. Consider, for illustrative purposes, a case where a classifier, for one land-mark, given a curve and feature subset outputs 0000001110000000 (indicatingthat three points on the curve are similar to the user’s chosen landmark). We needa function such that, given a position x on the curve, the cost function returns thedistance to the point best matching the features of the user’s chosen landmark.To do this, we first thin the cluster of ones, yielding 0000000100000000. We thentake the distance transform of the result, yielding 7654321012345678. We denotethe result of this distance transform, for landmark i on curve j as cij(x). Thuscij(x) is a function for landmark i on a shape j that drives landmarks to pointssimilar to user landmarks. Consider a case where MDL deposits a landmark ata location x0, 3 positions away from the correct target on the curve; cij(x0) = 3.An energy minimization procedure using a cost function based on cij(x) willthus drive points to the bottoms of the basins given by the cost functions cij(x).More specifically, once MDL converges, we locate, on the first contour, the pointsmi1 corresponding to li1, ∀i = 1 . . . n, as well as their corresponding points mij
in all of the other contours. We then continue energy minimization using thefollowing cost function based on cij(x): εe =
∑ni=1
∑mj=1 cij(mij). Using the de-
scription length as the cost function in an energy minimization scheme intendedto establish point correspondence results in a remarkably good, but imperfect,point correspondence. This good point correspondence serves as an excellentinitialization for a gradient descent optimization of εe.
2.4 Feature Selection
Here, we explain our approach to feature selection during the training step. Weuse a cost function to evaluate each subset, and choose the subset with thelowest cost. The cost function is a combination of a target error εt(p, i) and abasin width error εb(p, i), for a subset p and a given landmark i.
The classifier is trained using all of the user’s selected points in class U , andall other points in class U . For example, consider 5 training shapes, each with100 contour points. Consider a feature subset involving curvature and its firstderivative. We thus have 500 points in 2D feature space, 5 of which (chosenby the user) are in U , the remainder in U . A classifier is trained on this data,attempting to find a decision boundary that best separates the two classes. Allpoints are then reclassified into classes U and U according to this classifier (inthe ideal case, the point classifications do not change, but this is unlikely withreal data).
The subset is then assessed according to the output of the classifier. The tar-get error is defined as εt(p, i) =
∑mj=1 d(lij , uij), where d(p, q) is the geodesic
distance along the object contour between points p and q, and uij is the geodesi-cally nearest point in class U on the contour to lij . For example, if the user’sselected landmark i (indicated with a 1) is 0000000100000000 and a classifiertrained using subset p yields a classification of 0000000000100000 on shape j(the 1 is 3 positions away from the user’s landmark), then d(lij , uij) = 3. Ifthe classification were identical to the user’s selection, 0000000100000000, thend(lij , uij) = 0. This measure indicates how far the classifier, given a shape

282 A.D. Ward and G. Hamarneh
subset, will move a landmark off target. The basin width error is defined asεb(p, i) =
∑mj=1
(Np
2 − d(uij , uij)), where Np is the number of points on the
longest contour in the training set (and thus the maximum basin width error isNp
2 ) and uij is the geodesically nearest point in class U on the contour to uij .For example, if the user’s selected landmark i is 0000000100000000 and a clas-sifier trained using subset p yields a classification of 010000010000100 on shapej, d(uij , uij) = 5. A classification of 0001000101000000 yields d(uij , uij) = 2.Clearly the former is to be preferred over the latter; the latter results in a pos-sibly confusing minimum value of εe during correspondence establishment. Foreach subset p for a landmark i, we compute an overall error measure ε(p, i),which combines εb(p, i) and εt(p, i):
argminp
ε(p, i) =
⎧⎨
⎩
εt(p, i) + εb(p,i)Np2 +1
if ∃εt(p, i) < t ∧ ∃εb(p, i) <Np
2 − t
εt(p,i)α(εt(p,i)−t)+1 + εb(p, i) otherwise
(1)In equation 1, t is a threshold specifying desired quantities for εt(p, i) and
εb(p, i). The basic idea is that if εt(p, i) and εb(p, i) are sufficiently small, it isdesirable for εt(p, i) to dominate the cost function; it is a hard constraint that wechoose the subset with the smallest value of εt(p, i) in this case. If this conditionis not met, then the cost function becomes a nonlinear combination of εt(p, i)and εb(p, i) such that the dominance of εt(p, i) diminishes as εt(p, i) grows. Thisavoids the choice of subsets with relatively large εt(p, i) and small εb(p, i) incases where the smallest possible εt(p, i) ≥ t. The rate at which the dominanceof εt(p, i) diminishes is directly proportional to α, which was set to 10−2 for allexperiments in this paper. The threshold t can be set automatically by iteratingMDL until convergence and then computing the maximum geodesic distancebetween any landmark and its correct position given by the training data.
Shape features used in our experiments include curvature, the absolute valueof the first derivative of curvature, and the local area integral invariant [6].Appearance features include the average image intensity in a circular regioncentered at each contour point, the average intensity along a segment extendingnormal to the contour into the object, and the average intensity along a segmentextending normal to the contour out of the object. Each feature was computedat a variety of scales, and equation 1 was minimized by brute force. Note thatour method does not dictate the specific choices of these features; the featuresused in this paper are chosen to exemplify the effectiveness of the method.
3 Results
Figure 2 qualitatively compares our method to the performance of standardMDL on rectangles (bottoms cut off for space considerations) with two protrud-ing peaks, one small and one large. Row 1 of figure 2 shows MDL’s performance,and row 2 shows the performance of our algorithm trained using a single ex-ample with two training points, indicated by the gray diamonds. For the small

Statistical Shape Modeling Using MDL 283
Fig. 2. Comparison of correspondences established by MDL (rows 1 and 3) with thoseestablished by our method (rows 2 and 4) on artificial examples. Corresponding pointshave the same colour (see electronic version). The points of interest are indicated bydiamonds in different shades of gray, with numbers indicating correspondence.
peak, minimization of equation 1 resulted in the selection of curvature and theabsolute value of its derivative as features, as expected. Interestingly, for thelarge peak, curvature features were not selected; the local area integral invariantwas chosen instead, because this feature differentiates the large peak from thesmall peak, thus yielding a lower εb(p, i) error. Figure 2 also shows the perfor-mance of MDL versus our method for establishing correspondence on a rectangle(bottoms cut off for space considerations), with a point of interest defined bytexture. Not surprisingly, standard MDL fails to do this (row 3) since it does notuse appearance information (mean correspondence error 4). Our method (row4) established perfect correspondence using the average local intensity value.
Figure 3 qualitatively compares standard MDL to our method on the corpuscallosum (CC; a brain structure), as segmented from MR images. Row 1 showsthe result from standard MDL, with diamonds indicating corresponding pointsof interest. These points should lie on the tip of the rostrum (the apex of the“hook” of the CC on the anterior side; see dark gray diamond in row 2, column1), and at the interface between the CC and the fornix, which emanates belowthe CC in the middle of its body (see light gray diamond in row 2, column 1). Intraining, the system chose curvature and the absolute value of its derivative asfeatures characterizing the rostrum, and the average intensities along segmentsnormal to the contour emanating into and out of the object to characterize thefornix. Training was performed on 5 examples, with testing on 15 (4 examplesshown due to space constraints). Figure 3 also compares standard MDL to ourmethod for a point of interest on the right brain ventricle as segmented fromMR images. The third row shows standard MDL, and the fourth row shows ourmethod. Training was performed on 5 examples, with testing on 14 (4 examplesshown). Features selected for this point were curvature and its derivative, andthe local area integral invariant.

284 A.D. Ward and G. Hamarneh
Fig. 3. Comparison of correspondences established by MDL (rows 1 and 3) with thoseestablished by our method (rows 2 and 4) on anatomically meaningful points on thecorpus callosum and ventricles. Corresponding points have the same colour (see elec-tronic version). The points of interest are indicated by diamonds in different shades ofgray, with numbers indicating correspondence.
Table 1 shows training times, correspondence times, and mean geodesic land-mark errors (defined as the mean of the geodesic distances between landmarksand their correct, manually-landmarked locations). Note that the correspon-dence times shown for our method include the time required to perform theMDL-based optimization. Our method shows a decrease in landmarking error,and training and correspondence execute reasonably quickly (on a 2.4Ghz AMDOpteron CPU). Note that for the ventricles, the mean error for our method isskewed by outliers; the median error for standard MDL is 6.0 pixels, comparedto a median error of 1.5 pixels for our method.
Table 1. Training and correspondence times, and errors, shown as (standard MDL,our method). LP = large peak, SP = small peak, R = rostrum, F = fornix.
Training (mm:ss) Correspondence (mm:ss) Error (pixels)Two peaks (NA, 01:12) (00:27, 01:17) (3.40, 0.00), LP
(10.0, 0.00), SPTexture (NA, 00:48) (00:27, 00:57) (4.00, 0.00)CC (NA, 03:42) (02:07, 11:30) (1.20, 0.65), R
(4.50, 1.90), FVentricle (NA, 01:20) (00:55, 02:10) (5.30, 3.20)
4 Conclusions
We have demonstrated the efficacy of a hybrid system for point correspon-dence establishment, using cost functions measuring model compactness (MDL)and deviation from anatomically meaningful landmarks indicated by the user.

Statistical Shape Modeling Using MDL 285
Although there exist previous approaches incorporating machine learning [7],to the best of our knowledge, ours is the first incorporation of machine learn-ing to elicit local, characteristic features of anatomically meaningful points, andto make use of those features in a MDL-based approach to the correspondenceproblem. We demonstrate our approach on artificial and real data, showing thatit runs reasonably quickly, and automatically reports the features that best char-acterize each chosen point. A general conclusion that can be drawn from thiswork is that description length alone is an insufficient criterion for establishinganatomically meaningful correspondences between shapes. It is evident from ourresults that a correspondence resulting from a shape model with larger thanminimum description length yields a more meaningful correspondence. We hy-pothesize that the explanation for this observation is that the MDL criterionfails to capture all types of features which are salient to humans. Features whichare insignificant in terms of their effect on the cost of transmitting the shapemodel are more likely to be ignored by a purely MDL-based shape correspon-dence method. Future work involves augmenting this system with more features,testing different types of classifiers, and using a more intelligent approach tominimize equation 1 to handle a larger number of features, including saliencyfeatures [8], for example. This approach also requires validation on large datasets with ground truth expert correspondences. We are also exploring the exten-sion of this work to 3D, which involves 2D definitions of the geodesic distancesused to compute εt and εb, and trivial 2D definitions of the thinning and distancetransform operations (on surfaces) used to define εe. Also, the integration of theoptimization of the MDL cost function and εe is being explored with the aimof producing a fully hybrid approach. It is also of interest to explore the utilityof this approach in elucidating parts of the decision process used by expertsto locate landmarks on medical images, by discerning characterizing shape andappearance features not obvious to the layperson or medical trainee.
References
1. Davies, R., et al.: A minimum description length approach to statistical shape mod-eling. IEEE TMI 21(5), 525–537 (2002)
2. Styner, M., et al.: Evaluation of 3D correspondence methods for model building. In:Taylor, C.J., Noble, J.A. (eds.) IPMI 2003. LNCS, vol. 2732, pp. 63–75. Springer,Heidelberg (2003)
3. Thodberg, H., et al.: Adding curvature to minimum description length shape models.BMVC 2, 251–260 (2003)
4. Heimann, T., et al.: Implementing the automatic generation of 3D statistical shapemodels with ITK. In: Open Science Workshop at MICCAI, Copenhagen (2006)
5. Guyon, et al.: An introduction to variable and feature selection. Journal of MachineLearning Research 3, 1157–1182 (2003)
6. Manay, S., et al.: Integral invariants for shape matching. IEEE PAMI 28(10), 1602–1618 (2006)
7. Pitiot, A., et al.: Learning shape correspondence for n-D curves. IJCV 71(1), 71–88(2007)
8. Kadir, T., et al.: Scale, saliency and image description. IJCV 45(2), 83–105 (2001)


![arXiv:1601.05593v1 [cs.CV] 21 Jan 2016 · Keywords: 3D shape modelling, Symmetry plane extraction, Automatic landmarking, 3D feature matching 1. Introduction Modern techniques in](https://img.pdfslide.us/doc/110x75/602ca2eecad012384d4d9e48/arxiv160105593v1-cscv-21-jan-2016-keywords-3d-shape-modelling-symmetry-plane.jpg)