Embed Size (px)
Citation preview

LMD/IPSL 1 Ahmedabad Megha-Tropique Meeting 17-20 October 2005
Combination of MSG and TRMM for precipitation estimation over Africa (AMMA
project experience)
Franck Chopin & Jean Claude Bergès

LMD/IPSL 2 Ahmedabad Megha-Tropique Meeting 17-20 October 2005
Data and Experimentation area
Input dataset:
Full flow of MSG/HRI (from 6.2 to 13.4) TRMM/PR from 3G68Land GPCP 1 degree daily rainfall
Validation dataset :
Dense raingauges network (IRD & AGRHYMET supplied)
Experimentation Area :
A window on West-Africa from May to October 2004 (25W to 25E and 5S to 20N) This is the AMMA West Africa Region

LMD/IPSL 3 Ahmedabad Megha-Tropique Meeting 17-20 October 2005
Research Products
• Rainfall Probability images
• Potential Intensity images
• Rainfall Estimations images

LMD/IPSL 4 Ahmedabad Megha-Tropique Meeting 17-20 October 2005
Figure 1 : Feed Forward network Representation
Neural Network Design and Rainfall Probability

LMD/IPSL 5 Ahmedabad Megha-Tropique Meeting 17-20 October 2005
The 15 MSG neural networks inputs
• Temperature indicator:• IR_10.8• IR multichannel indicators:• IR_10.8 - WV_06.2• IR_10.8 - WV_07.3• IR_10.8 - IR_8.7• IR_10.8 - IR_9.7• IR_10.8 - IR_12.0• IR_10.8 - IR_13.4• Temporal difference
indicator:• IR_10.8 - IR_10.8-prev.
• Local variance indicators: • Var. 5x5 WV_06.2• Max. 5x5 WV_06.2• Var. 5x5 IR_10.8• Max. 5x5 IR_10.8• Geographic indicators:• Solar zenithal angle• Solar azimuthal angle• Altitude derived from SRTM
data

LMD/IPSL 6 Ahmedabad Megha-Tropique Meeting 17-20 October 2005
Validation of the Rainfall Probability Results
Different methods have been considered :
Infrared Temperature Threshold : The proportion of rainy cases according to TRMM 2A25 product has been estimated. To minimize the bias, the threshold value used has been selected in order to contain the same proportion of rainy cases.Probability Matching : This method estimates the rainfall probability for each infrared temperature threshold. Feed Forward Neural Network : This is the proposed method with two different iteration number (10 and 1000) during the learning step.
The mean of absolute value biases on different partition classes during the 2000 rainy season from June to September has been evaluated for the Meteosat-7 algorithm version.
Four partitions are considered : day, half an hour (slot), 1 degree longitude and 1 degree latitude.

LMD/IPSL 7 Ahmedabad Megha-Tropique Meeting 17-20 October 2005
Validation of the Rainfall Probability Results
Mean of absolute value biases on four partition classes for four procedures
0
0,005
0,01
0,015
0,02
0,025
0,03
Day Slot 1° Longitude 1° Latitude
partition classes
mea
n o
f ab
solu
te v
alu
e b
iase
s
Infrared Threshold
Probability Matching
Neural Network (10)
Neural Network (1000)
Figure 2 : Mean of absolute value biases on four partition classes for four procedures

LMD/IPSL 8 Ahmedabad Megha-Tropique Meeting 17-20 October 2005
Collocation between Pr image and 2A25 TRMM data

LMD/IPSL 9 Ahmedabad Megha-Tropique Meeting 17-20 October 2005
Rainfall Probability Product description
• Space Resolution : 3km
• Time Resolution : 15 minutes
• Methodological error during the learning phase : 17%
• Will be soon validated against surface products at different space and time scales

LMD/IPSL 10 Ahmedabad Megha-Tropique Meeting 17-20 October 2005
From Rainfall Probability to Estimated Rainfall Intensity
To produce estimated rainfall intensities, a probability matching formula (1) is here applied. The estimated rainfall intensity Ie is the product between the corresponding rainfall probability image Pr , assessed by the feed forward neural network described above, and a potential rainfall intensity Ip.
(1)rpe PII
We still have to compute the potential rainfall intensity images

LMD/IPSL 11 Ahmedabad Megha-Tropique Meeting 17-20 October 2005
• Rainfall Probability images
• Potential Intensity images
• Rainfall Estimations images
Research products

LMD/IPSL 12 Ahmedabad Megha-Tropique Meeting 17-20 October 2005
Reference Dataset and Downscaling Formula :
To compute a potential rainfall intensity Ip image, a reference rainfall intensity Ir dataset is necessary.
It has to be quoted that this estimator is more directly related to rainfall but does not allow a follow up of phenomena as fine as geostationary satellite images.
It has been decided to use the 1°x 1° grid synthesis daily GPCP data.

LMD/IPSL 13 Ahmedabad Megha-Tropique Meeting 17-20 October 2005
Downscaling Formula :
AT
rp
AT
r dadttaPTAIdadttaI ,,, (2)
This step allows to evaluate the potential rainfall intensity in a cell grid area A for a given period T.
From the relation (1), we define a downscaling step in time and space equation (2).
(1)rpr PII

LMD/IPSL 14 Ahmedabad Megha-Tropique Meeting 17-20 October 2005
Examples of Potential Intensity Image
Potential rainfall intensity 16th May 2004 mm/h

LMD/IPSL 15 Ahmedabad Megha-Tropique Meeting 17-20 October 2005
Examples of Potential Intensity Image
Potential rainfall intensity 15th June 2004 mm/h

LMD/IPSL 16 Ahmedabad Megha-Tropique Meeting 17-20 October 2005
Examples of Potential Intensity Image
Potential rainfall intensity 15th July 2004 mm/h

LMD/IPSL 17 Ahmedabad Megha-Tropique Meeting 17-20 October 2005
Examples of Potential Intensity Image
Potential rainfall intensity 15th August 2004 mm/h
LMD/IPSL 18 Ahmedabad Megha-Tropique Meeting 17-20 October 2005
Examples of Potential Intensity Image
Potential rainfall intensity 15th September 2004 mm/h

LMD/IPSL 19 Ahmedabad Megha-Tropique Meeting 17-20 October 2005
Examples of Potential Intensity Image
Potential Rainfall Intensity 15th October 2004 mm/h

LMD/IPSL 20 Ahmedabad Megha-Tropique Meeting 17-20 October 2005
Link Between Elevation and Potential Intensity (1)

LMD/IPSL 21 Ahmedabad Megha-Tropique Meeting 17-20 October 2005
Link Between Relief and Potential Intensity (2)
mm/hCo-localisation between elevation and Potential Rainfall Intensity image
15th of August 2004

LMD/IPSL 22 Ahmedabad Megha-Tropique Meeting 17-20 October 2005
Potential Intensity Product Description
• Space Resolution : 3km
• Time Resolution : 1 Day
• Remark : The short time high rainfalls can’t be retrieved thanks to this product.

LMD/IPSL 23 Ahmedabad Megha-Tropique Meeting 17-20 October 2005
• Rainfall Probability images
• Potential Intensity images
• Rainfall Estimations images
Research products

LMD/IPSL 24 Ahmedabad Megha-Tropique Meeting 17-20 October 2005
Estimated Rainfall Intensity
Once the potential rainfall intensity Ip images are computed, the estimated rainfall intensity at time t during day d and position a can be calculated with the formula (3) :
taPdaItaI rpe ,,, (3)
Let Pr(a,d) be the cumulative rainfall probability during day d and position a. The estimated rainfall accumulation during a period T can be easily computed with the equation (4) :
Td
rpe daPdaITaI ,,, (4)
LMD/IPSL 25 Ahmedabad Megha-Tropique Meeting 17-20 October 2005
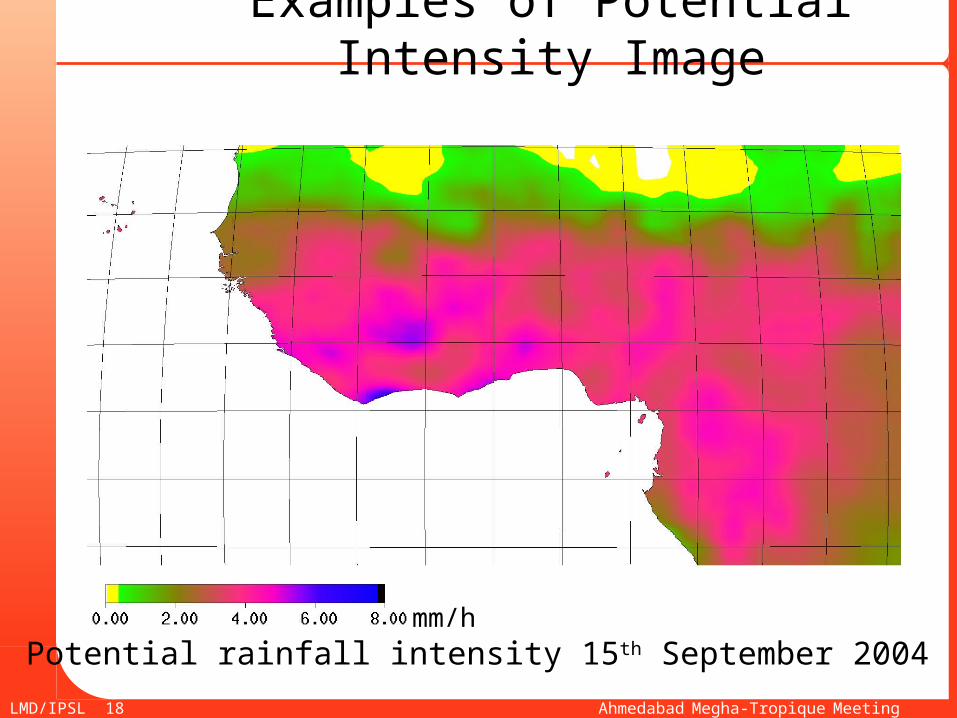
Example of Rainfall Estimation Image (1)
mm
Rainfall Accumulation during the month of July 2004

LMD/IPSL 26 Ahmedabad Megha-Tropique Meeting 17-20 October 2005
Example of Rainfall Estimation Image (2)
mm
Rainfall Accumulation from 1st to 10th of July 2004And co-localisation with West African Elevation

LMD/IPSL 27 Ahmedabad Megha-Tropique Meeting 17-20 October 2005
Rainfall Estimation Product Description
• Space Resolution : 3km• Time Resolution : 15 minutes• Remarks :
– This product has to be integrated in time and space in order to reduce the bias of the estimations.
– The time and space resolutions provided allows to integrate this product very easily
(in a watershed or from 6am to 6am the day after for example)
All this processing chain has been called Sliding Rescaling Algorithm (SRA)

LMD/IPSL 28 Ahmedabad Megha-Tropique Meeting 17-20 October 2005
Validation (1)
Validation krigged data :
• Provided by IRD and AGRHYMET
• Space resolutions : 0.5, 1 and 2.5 degrees
• Time resolution : ten days periods
The validation datasets have been provided with an estimate of its uncertainty ε for each grid cell

LMD/IPSL 29 Ahmedabad Megha-Tropique Meeting 17-20 October 2005
Validation (2)
1° x 1° grid rainfall accumulation during the third decade of August
2004 from the IRD raingauge dataset
Estimated rainfall accumulation during the third decade of August
2004

LMD/IPSL 30 Ahmedabad Megha-Tropique Meeting 17-20 October 2005
Validation (2)
1° x 1° grid rainfall accumulation during the third decade of August
2004 from the IRD raingauge dataset
1° x 1° Grid estimated rainfall accumulation during the third
decade of August 2004

LMD/IPSL 31 Ahmedabad Megha-Tropique Meeting 17-20 October 2005
1x1 BIAS RMSD WRMSD NRMSD R² SKILL
GPCP 1dd 100% (280) 7,74 24,32 1,93 1,77 0,59 0,12
SRA 2-0 100% (280) 3,23 19,02 1,36 1,34 0,64 0,51
GPCP 1dd 50% (140) 6,85 19,18 2,14 2,08 0,62 0,08
SRA 2-0 50% (140) 3,09 13,25 1,40 1,32 0,70 0,60
Ground Data MIN RAIN 2,26 MAX RAIN 145,72 MEAN RAIN 39,19
Comparison between GPCP 1dd and SRA
Two studies have been done :

LMD/IPSL 32 Ahmedabad Megha-Tropique Meeting 17-20 October 2005
1x1 BIAS RMSD WRMSD NRMSD R² SKILL
GPCP 1dd 100% (280) 7,74 24,32 1,93 1,77 0,59 0,12
SRA 2-0 100% (280) 3,23 19,02 1,36 1,34 0,64 0,51
GPCP 1dd 50% (140) 6,85 19,18 2,14 2,08 0,62 0,08
SRA 2-0 50% (140) 3,09 13,25 1,40 1,32 0,70 0,60
Ground Data MIN RAIN 2,26 MAX RAIN 145,72 MEAN RAIN 39,19
Comparison between GPCP 1dd and SRA
Two studies have been done :• First one considers all the grid validation cells

LMD/IPSL 33 Ahmedabad Megha-Tropique Meeting 17-20 October 2005
1x1 BIAS RMSD WRMSD NRMSD R² SKILL
GPCP 1dd 100% (280) 7,74 24,32 1,93 1,77 0,59 0,12
SRA 2-0 100% (280) 3,23 19,02 1,36 1,34 0,64 0,51
GPCP 1dd 50% (140) 6,85 19,18 2,14 2,08 0,62 0,08
SRA 2-0 50% (140) 3,09 13,25 1,40 1,32 0,70 0,60
Ground Data MIN RAIN 2,26 MAX RAIN 145,72 MEAN RAIN 39,19
Comparison between GPCP 1dd and SRA
Two studies have been done :• First one considers all the grid validation cells• Second one takes into account the 50% grid validation cells with the lowest validation uncertainty

LMD/IPSL 34 Ahmedabad Megha-Tropique Meeting 17-20 October 2005
Full decades validation with the 0.5 space resolution
0,5x0,5 BIAS RMSD WRMSD NRMSD R² SKILL
SRA 2-0 100% (14400) 0,54 20,49 1,17 1,20 0,67 0,66SRA 2-0 50% (7200) 0,30 12,47 1,20 1,23 0,70 0,67SRA 2-0 10% (1440) 0,31 5,51 1,05 1,12 0,74 0,70
Here, all the ten days periods of the 2004 rainy season are considered as one unique dataset. This represents a grid of 14400 cells.The SRA underestimates the most important rainfall accumulations
We can notice a good symmetry in term of bias on this dataset

LMD/IPSL 35 Ahmedabad Megha-Tropique Meeting 17-20 October 2005
Class Validation
TOTAL 44,20 26,76 24,23 3,54 1,27 100,00150 + 0,00 0,00 0,01 0,00 0,11 0,12
100-150 0,00 0,11 2,85 0,90 0,67 4,5350-100 0,87 7,16 16,77 2,47 0,48 27,7525-50 5,86 14,53 4,17 0,17 0,01 24,740-25 37,47 4,96 0,43 0,00 0,00 42,86
SRA/SOL(mm) 0-25 25-50 50-100 100-150 150 + TOTAL
Contingency table of the 14400 0.5 degree grid cells (%)

LMD/IPSL 36 Ahmedabad Megha-Tropique Meeting 17-20 October 2005
Class Validation
TOTAL 44,20 26,76 24,23 3,54 1,27 100,00150 + 0,00 0,00 0,01 0,00 0,11 0,12
100-150 0,00 0,11 2,85 0,90 0,67 4,5350-100 0,87 7,16 16,77 2,47 0,48 27,7525-50 5,86 14,53 4,17 0,17 0,01 24,740-25 37,47 4,96 0,43 0,00 0,00 42,86
SRA/SOL(mm) 0-25 25-50 50-100 100-150 150 + TOTAL
• The intra-classes proportion are quite similar between reference dataset and SRA estimates
Contingency table of the 14400 0.5 degree grid cells (%)

LMD/IPSL 37 Ahmedabad Megha-Tropique Meeting 17-20 October 2005
Class Validation
TOTAL 44,20 26,76 24,23 3,54 1,27 100,00150 + 0,00 0,00 0,01 0,00 0,11 0,12
100-150 0,00 0,11 2,85 0,90 0,67 4,5350-100 0,87 7,16 16,77 2,47 0,48 27,7525-50 5,86 14,53 4,17 0,17 0,01 24,740-25 37,47 4,96 0,43 0,00 0,00 42,86
SRA/SOL(mm) 0-25 25-50 50-100 100-150 150 + TOTAL
• The intra-classes proportion are quite similar between reference dataset and SRA estimates
• Around 70% of data are on the diagonal.
Contingency table of the 14400 0.5 degree grid cells (%)

LMD/IPSL 38 Ahmedabad Megha-Tropique Meeting 17-20 October 2005
Class Validation
TOTAL 44,20 26,76 24,23 3,54 1,27 100,00150 + 0,00 0,00 0,01 0,00 0,11 0,12
100-150 0,00 0,11 2,85 0,90 0,67 4,5350-100 0,87 7,16 16,77 2,47 0,48 27,7525-50 5,86 14,53 4,17 0,17 0,01 24,740-25 37,47 4,96 0,43 0,00 0,00 42,86
SRA/SOL(mm) 0-25 25-50 50-100 100-150 150 + TOTAL
• The intra-classes proportion are quite similar between reference dataset and SRA estimates
• Around 70% of data are on the diagonal.
• Around 98% of data are on the three-diagonal.
Contingency table of the 14400 0.5 degree grid cells (%)

LMD/IPSL 39 Ahmedabad Megha-Tropique Meeting 17-20 October 2005
Class Validation
• The intra-classes proportion are quite similar between reference dataset and SRA estimates
• Around 70% of data are on the diagonal.
• Around 98% of data are on the three-diagonal.
• That is another demonstration of the good coherence between validation and estimated data.
Contingency table of the 14400 0.5 degree grid cells (%)
TOTAL 44,20 26,76 24,23 3,54 1,27 100,00150 + 0,00 0,00 0,01 0,00 0,11 0,12
100-150 0,00 0,11 2,85 0,90 0,67 4,5350-100 0,87 7,16 16,77 2,47 0,48 27,7525-50 5,86 14,53 4,17 0,17 0,01 24,740-25 37,47 4,96 0,43 0,00 0,00 42,86
SRA/SOL(mm) 0-25 25-50 50-100 100-150 150 + TOTAL
LMD/IPSL 40 Ahmedabad Megha-Tropique Meeting 17-20 October 2005
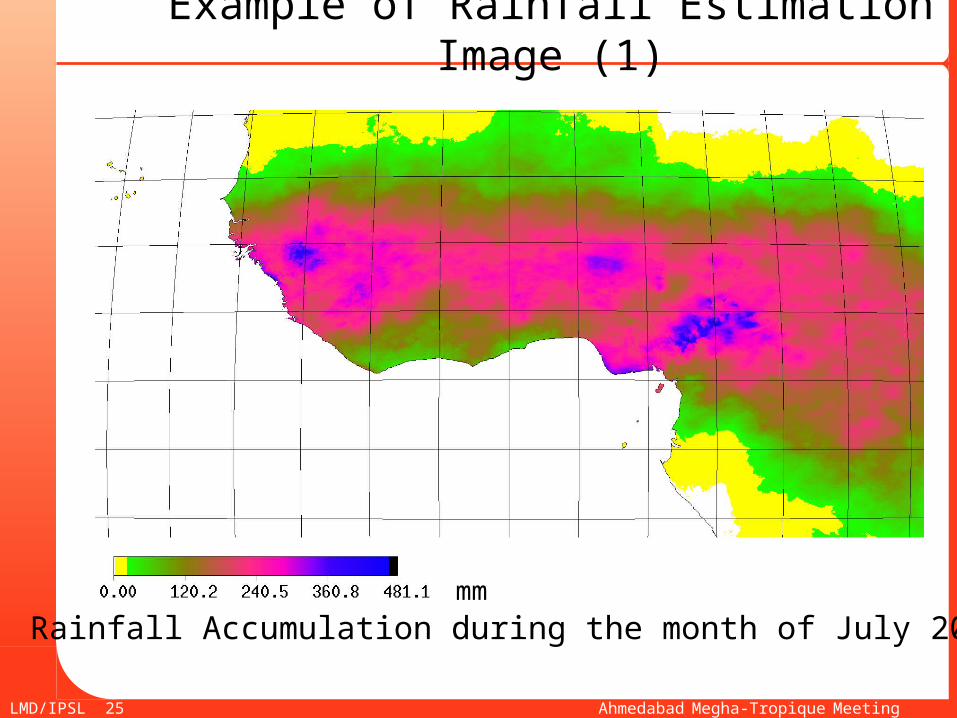
Conclusion
• Splitting estimation algorithm in two steps avoids introduction of local correction parameters to match with high rainfall intensity patterns.
• Downscaling rainfall on geostationary resolution allows to match with any final product grid size or any watershed for hydrological models.
• This method has been validated for the decades rainfall accumulation during the 2004 rainy season and seems to be better than GPCP on our dataset in particular in term of bias.
• This algorithm has to be considered as a way to improve the reference dataset (here GPCP) tacking into account the rainfall probability for each pixel and for every slot of the studied period.

LMD/IPSL 41 Ahmedabad Megha-Tropique Meeting 17-20 October 2005
THANK YOU


![TRMM Key TRMM Facts - NASA · 244 [ Missions: TRMM ] Earth Science Reference Handbook TRMM Science Goals • Obtain and study multiyear science data sets of tropical and subtropical](https://img.pdfslide.us/doc/110x75/5edb4b20ad6a402d66657010/trmm-key-trmm-facts-nasa-244-missions-trmm-earth-science-reference-handbook.jpg)