Embed Size (px)
Citation preview
2013/10/29
1
1
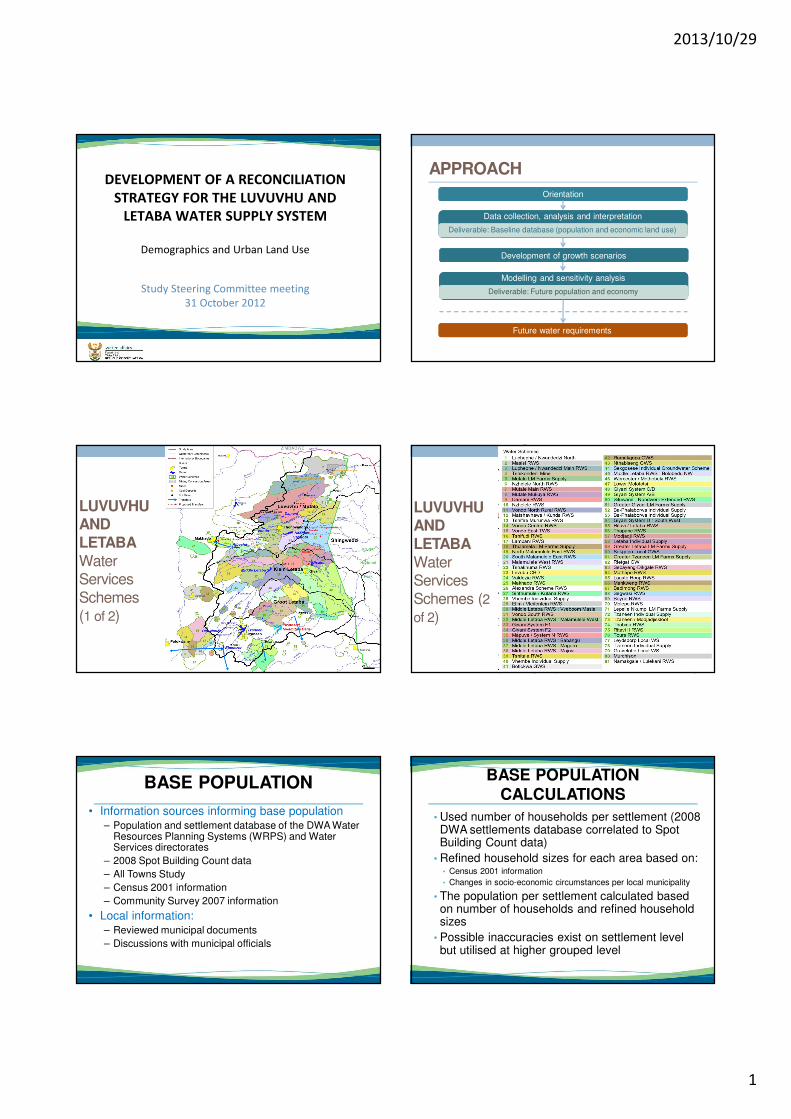
DEVELOPMENT OF A RECONCILIATION
STRATEGY FOR THE LUVUVHU AND
LETABA WATER SUPPLY SYSTEM
Demographics and Urban Land Use
Study Steering Committee meeting
31 October 2012
APPROACH
Orientation
Data collection, analysis and interpretation
Deliverable: Baseline database (population and economic land use)
Future water requirements
Development of growth scenarios
Modelling and sensitivity analysis
Deliverable: Future population and economy
LUVUVHU
AND
LETABA
Water
Services
Schemes
(1 of 2)
LUVUVHU
AND
LETABA
Water
Services
Schemes (2
of 2)
BASE POPULATION
• Information sources informing base population– Population and settlement database of the DWA Water
Resources Planning Systems (WRPS) and Water Services directorates
– 2008 Spot Building Count data
– All Towns Study
– Census 2001 information
– Community Survey 2007 information
• Local information:– Reviewed municipal documents
– Discussions with municipal officials
• Used number of households per settlement (2008 DWA settlements database correlated to Spot Building Count data)
• Refined household sizes for each area based on: • Census 2001 information
• Changes in socio-economic circumstances per local municipality
• The population per settlement calculated based on number of households and refined household sizes
• Possible inaccuracies exist on settlement level but utilised at higher grouped level
BASE POPULATION CALCULATIONS
2013/10/29
2
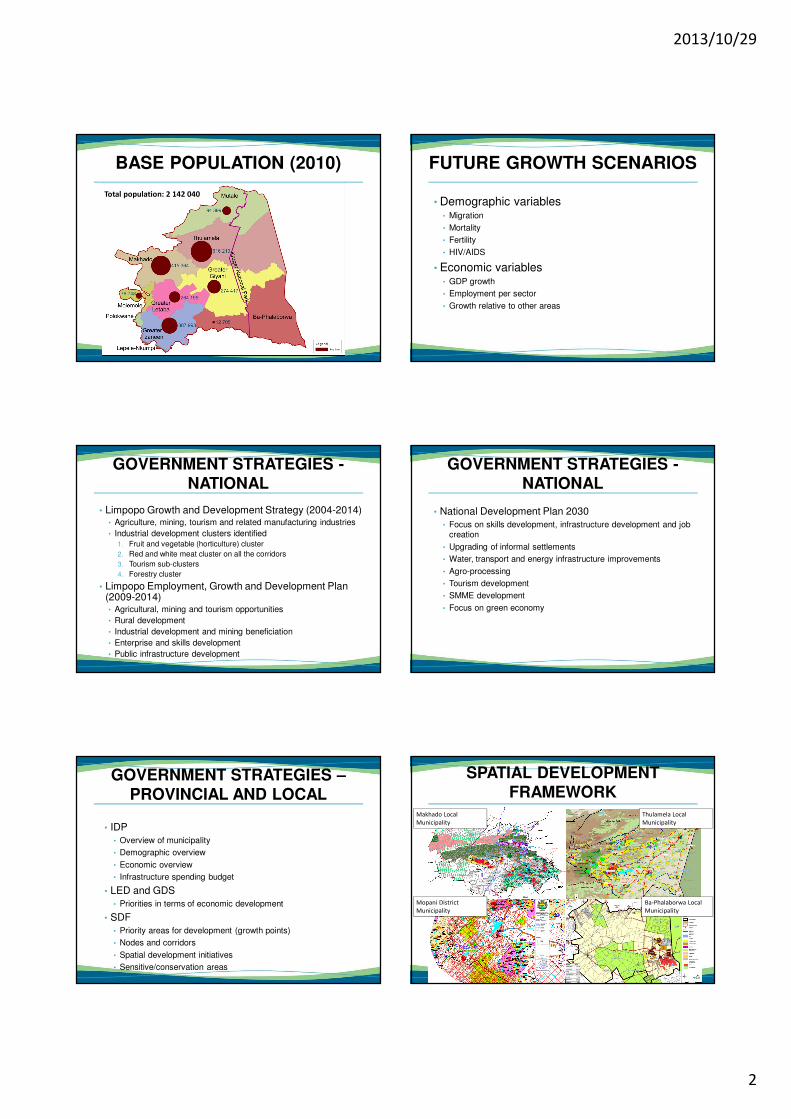
BASE POPULATION (2010)
Total population: 2 142 040
FUTURE GROWTH SCENARIOS
• Demographic variables• Migration
• Mortality
• Fertility
• HIV/AIDS
• Economic variables• GDP growth
• Employment per sector
• Growth relative to other areas
GOVERNMENT STRATEGIES -NATIONAL
• Limpopo Growth and Development Strategy (2004-2014)• Agriculture, mining, tourism and related manufacturing industries
• Industrial development clusters identified
1. Fruit and vegetable (horticulture) cluster
2. Red and white meat cluster on all the corridors
3. Tourism sub-clusters
4. Forestry cluster
• Limpopo Employment, Growth and Development Plan (2009-2014)• Agricultural, mining and tourism opportunities
• Rural development
• Industrial development and mining beneficiation
• Enterprise and skills development
• Public infrastructure development
GOVERNMENT STRATEGIES -NATIONAL
• National Development Plan 2030
• Focus on skills development, infrastructure development and job creation
• Upgrading of informal settlements
• Water, transport and energy infrastructure improvements
• Agro-processing
• Tourism development
• SMME development
• Focus on green economy
GOVERNMENT STRATEGIES –PROVINCIAL AND LOCAL
• IDP
• Overview of municipality
• Demographic overview
• Economic overview
• Infrastructure spending budget
• LED and GDS
• Priorities in terms of economic development
• SDF
• Priority areas for development (growth points)
• Nodes and corridors
• Spatial development initiatives
• Sensitive/conservation areas
SPATIAL DEVELOPMENT FRAMEWORK
Thulamela Local
Municipality
Ba-Phalaborwa Local
Municipality
Makhado Local
Municipality
Mopani District
Municipality
2013/10/29
3
GROWTH SCENARIOS
• Moderate growth scenario• Historic growth rates
• Decrease in overall population growth rate
• Reduced fertility, mortality remains relatively high
• Continuing out-migration to large economic hubs (Gauteng)
• Internal migration from rural areas to urban nodes
• Relatively low economic growth
• High growth scenario• Initial low economic growth peaking in 20 years, flattening out
• Focus on rural development• Installation of infrastructure and services
• Agriculture, mining, tourism and rural beneficiation
• Improved health services
• Reduction of mortality
• Decreased out-migration
• Lower urbanisation within study area
HISTORICAL POPULATION
GROWTH
Calculation based on StatsSA mid-year population estimates and provincial distributions
1.00%
1.05%
1.10%
1.15%
1.20%
1.25%
1.30%
1.35%
2002 2003 2004 2005 2006 2007 2008 2009 2010 2011
POPULATION GROWTH RATES
0.7%
0.8%
0.9%
1.0%
1.1%
1.2%
1.3%
1.4%
2000 2005 2010 2015 2020 2025 2030 2035 2040
Gro
wth
ra
te
South Africa Limpopo Moderate High
ESTIMATED POPULATION
GROWTH
2010 2015 2020 2025 2030 2035 2040
Moderate growth 2 142 040 2 250 963 2 358 584 2 464 609 2 568 777 2 671 994 2 774 064
High growth 2 142 040 2 268 383 2 389 947 2 510 364 2 629 256 2 746 347 2 868 804
2 100 000
2 200 000
2 300 000
2 400 000
2 500 000
2 600 000
2 700 000
2 800 000
2 900 000
Po
pu
lati
on
SPATIAL DEVELOPMENT
• Concentration and integration of development
– Main economic nodes and growth points
• Giyani, Tzaneen, Thohoyandou and Makhado
– Along major transport corridors
– Major rural settlements
• Commercial development in main nodes and rural growth
nodes
• Industrial development in Makhado and Tzaneen
• Development hampered by:
– Topography
– Tribal land ownership
– Land claims
SPATIAL DEVELOPMENT

2013/10/29
4
ESTIMATED POPULATION
GROWTH
2010 2015 2020 2025 2030 2035 2040
Greater Giyani 275 809 292 029 307 633 323 087 338 349 353 387 369 111
Greater Letaba 268 398 283 526 298 055 312 415 326 572 340 484 355 010
Greater Tzaneen 392 426 415 729 438 172 460 423 482 413 504 088 526 784
Makhado 416 054 440 421 463 855 487 045 509 927 532 444 555 973
Thulamela 616 711 653 860 689 668 725 204 760 322 794 955 831 229
250 000
350 000
450 000
550 000
650 000
750 000
850 000
High growth per local municipality
ESTIMATED POPULATION PER WS– HIGH SCENARIO (EXTRACT)
Water Schemes (58)Population (‘000)
2010 2015 2020 2025 2030 2035 2040
Giyani System C/D WS 84 89 95 100 106 111 117
Giyani System D : South West
WS27 28 29 31 32 33 35
Giyani System A/B WS 52 55 58 60 63 66 69
Giyani System F1 WS 24 25 26 27 29 30 31
Giyani System F2 WS 12 13 13 14 15 15 16
Tzaneen / Modjadjiskloof WS 13 14 14 15 16 17 17
Modjadji RWS 81 86 90 94 99 103 108
Sekgosese Individual
Groundwater Scheme21 22 23 24 25 26 28
Middle Letaba RWS :
Bolobedu NW40 43 45 47 50 52 54
Middle Letaba RWS : Magoro 72 76 80 84 88 92 96
Thabina RWS 57 61 65 68 71 75 78
ECONOMIC STATUS QUO
0
2000
4000
6000
8000
10000
12000
14000
16000
Greater Giyani Greater Letaba Greater Tzaneen Mutale Thulamela Makhado
R M
illi
on
GGP per sector (2010)
Manufacturing Trade Business Social Government Other
EXISTING ECONOMIC LAND
(EXAMPLE)
TAKE-UP OF COMMERCIAL
LAND
2010-2015 2016-2020 2021-2025 2026-2030 2031-2035 2036-2040
Giyani 0.0 6.8 7.9 7.7 7.7 7.6
Haenertsburg 0.0 0.0 0.0 0.0 0.0 0.0
Makhado 0.0 8.1 9.4 9.3 9.2 9.1
Modjadjiskloof 0.0 0.0 0.0 0.0 0.0 0.0
Thohoyandou 0.0 10.4 12.1 11.9 11.8 11.7
Tzaneen 0.0 19.0 22.1 21.7 21.4 21.2
0.0
5.0
10.0
15.0
20.0
25.0
Lan
d (
ha
)
TAKE-UP OF INDUSTRIAL LAND
2010-2015 2016-2020 2021-2025 2026-2030 2031-2035 2036-2040
Giyani 0.0 0.9 1.4 1.6 1.4 1.4
Haenertsburg 0.0 0.0 0.0 0.0 0.0 0.0
Makhado 0.0 8.0 11.5 12.3 10.2 10.1
Modjadjiskloof 0.0 0.0 0.0 1.3 0.6 0.4
Thohoyandou 0.0 2.5 3.6 3.9 3.9 3.8
Tzaneen 0.0 28.6 37.5 36.8 33.4 30.1
0.0
5.0
10.0
15.0
20.0
25.0
30.0
35.0
40.0
Lan
d (
ha
)
2013/10/29
5
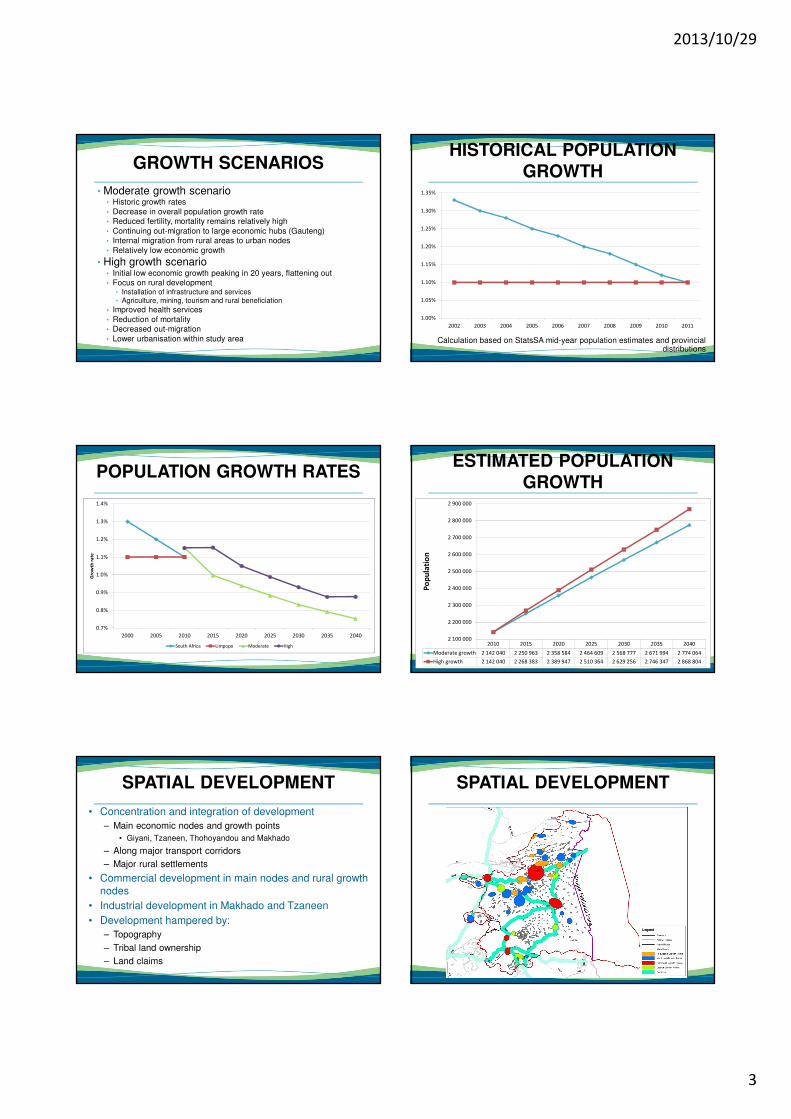
FUTURE LAND REQUIREMENTS
THANK YOU