Embed Size (px)
Citation preview
Lloyd Zinyemba
China-Africa Economic Cooperation: Development Assistance and Economic
Interests
August 2012
Supervisor: Fredrik Sjöholm
Course: NEKN03
1
Abstract
There has been an increasing engagement between China and Africa in recent years as reflected
by the level of aid, trade and investment flows. Building on the data available on China’s
development assistance flows into Africa together with China’s FDI stocks as a ‘strategic interest
variable’ gives an insight into the considerations given to the allocation of development
financing. The findings based on project financing across a sample of twenty countries used as a
proxy of China’s bilateral engagement turnover indicate a significant relationship with FDI.
Keywords: Development Assistance, Concessional Loans, China, Africa, FDI, China Eximbank,
OECD-DAC
2
Table of Contents
1. Introduction…………………………………………………….....4
2. Background………………………………………………………..5
2.1. Literature Review on China-Africa Economic Engagement …5
2.2. Theoretical Analysis…………………………………………. 7
2.3. Historical Perspective: Sino-Africa Economic Cooperation ….8
2.4. China –Africa Trade Recent Trend………………………… …9
2.5. China Investments in Africa…………………………………..10
3. China’s Development Finance…………………………………...12
3.1. The Nature of China’s Development Assistance ……………. 12
3.2. Organisation Structure of China’s Development Finance….. 13
3.3. China’s Donor Interests ………………………………………14
4. Data Analysis and Methodology ………………………………...18
4.1. Empirical Test ………………………………………………..18
4.2. Descriptive Empirical Findings: ………………………………22
5. Economic Development Implications for Africa ………………..25
6. Conclusions ………………………………………………………..27
References …………………………………………………………….28
Appendix …………………………………………………………….32
3
1. Introduction
Development assistance from China to Africa is nothing new, but the nature, volume and the
architecture of it are observed to have changed over time. The new Chinese model of
development aid is unique in that it is palpably woven into its strategic economic interests in
Africa in what Davies et al (2008) call a ‘coalition of engagements’; aid is seen to be one aspect
of the state’s collaborative business approach in the region. There have been some studies in
recent years that seem to consider China’s development assistance as an economic diplomacy
tool used to advance its commercial interest in securing resources and investments needs. Studies
such as that of (Nour, 2010, Lengauer, 2011) cite the approach by China of underpinning its
assistance to resources in deals such as oil-backed concessional loans in Sudan and Angola as
being opportunistic at most. This view is echoed by of Brautigam (2008), Robertson and Corkin
(2011) who notes that China’s large infrastructure loans are normally extended to countries rich
in resources especially oil and also used as a gateway for its investments in recipient countries.
However, in all these studies such views are largely based on informed opinions instead of hard
empirical findings. The aim of this paper is to weigh in on this debate by systematically testing
the allocation of Chinese loans in the region using FDI as a ‘strategic interest’ variable and find
out if its assistance is donor interest driven. This research may be of great importance in
providing an insight into the nature, distribution of Chinese loans and implications this has or will
possibly have on Africa’s economic development as regard infrastructure development and debt
sustainability.
China’s development assistance in this paper is defined by the turn over of its bilateral loans (i.e.
project financing). Aid from China to Africa is mostly given through projects not as budgetary
support (Brautigam, 2008).Traditionally Chinese aid is extended to African countries it has
diplomatic links with. China enjoys diplomatic ties with many of Africa’s forty eighty countries
with the exception of Burkina Faso, The Gambia, Swaziland and Sao Tome and Principe which
recognise Taiwan, (Lengauer,2011)
The rest of the paper is structured as follows. The next section will provide a background on
China’s economic engagement in Africa. Third section looks at China’s development assistance.
4
The fourth will be an empirical analysis. Lastly the fifth section will look at economic
implications for development in Africa.
2. Background
2.1 Literature Review on China –Africa Economic Engagement
There is an enormous body of literature on China’s economic engagement with Africa based on
aid, FDI and trade as well as on aid motivations
Studies by (Lengauer 2011, Hubbard 2007, Brautigam 2008, Wang and Bio-Tchane, 2008) have
made attempts at following aid flows to Africa by gathering information based on press releases
and the recent less detailed white paper published by The State Council on aid in 2011 since there
is no time series data provided by the Chinese authorities. Wang and Bio-Tchane (2008)
estimated that the annual Overseas Development Assistance (ODA) flows to Africa increased
from $310m in the period of 1989-1992 to $1.5 billion in 2004-2005.Brautigam (2008),estimates
specifically looking at concessional loans commitments identified flows of around $10 billion by
2009 from 1995 when China started giving out such loans. Based on the white paper on aid
released in 2011, concessional loans are mainly directed to economic infrastructure development
(61%), industry (16.1%), and energy and resources development (8.9%) with agriculture getting
4%.Out of all concessional loans given by China, Africa was the destination of 45% of that
amount in 2009, (Lengauer, 2011). The calculation and tracking of aid flows is complicated by
the lack of time series data and the combining of aid together with commercial loans: so precise
figures are never easy to get.
Due to the opaqueness of Chinese development assistance flows there is an increasing body of
researchers who are critical of China’s aid to Africa who see the lack of detail as an attempt by
the Chinese authorities to mask their motives. For instance Nour (2010) and Lengauer (2011) see
China’s aid as largely driven by economic considerations to secure resources as well as open up
new markets for its investments and goods. Nour (2010) cites the tying of Chinese aid to
Sudanese oil exports and investments as a clear indication of aid creating a channel for the
5
pursuit of commercial interest. Although he acknowledges the importance of aid on infrastructure
development he sees it as a long term threat as regard debt sustainability in countries like Sudan
that were (are) not beneficiaries of debt relief programme and have no access to other alternative
sources of finance. Others like Davies (2010) see the giving of aid by China as an attempt to
water down its ‘brazen corporatist approach’ in its engagement with Africa. The thinking is
premised on the concessional financing model used to finance infrastructure projects in recipient
countries which ties aid to other requirements seen as beneficial to Chinese exports and firms.
The concessional loans terms and conditions on procurement and use of Chinese contractors are
both export promoting and as well as capital funding tool for China’s firms. The model provides
Chinese state owned firms (SOE’s) with easy capital to enter African markets as the front movers
giving them an option to latter establish themselves once they finish their projects in host
countries. It has been observed in the infield research studies done in Ghana for example that a
good number of SOE’s entered into the market through the implementation of China Eximbank
led concessional loans projects and later on went to bid on local projects or establish consortiums
to venture into other business interests available locally, (Davies et al, 2008).There are those who
perceive China’s disregard for institutional quality in giving its aid as an affront to the efforts of
traditional donors who are focused on aid that enhances institutional capacity. This is the
perception shared by Weston et al (2011) who feel that China’s commercial interest override
other considerations in its aid allocation.
There is however, recognition of the role on infrastructure development that Chinese aid is
playing in the region as it fills a saving-investment gap. Africa, especially Sub-Saharan Africa
suffers from infrastructure deficit and lags behind other developing countries affecting regional
trade and economic growth, (Foster et al, 2009). Poor infrastructure is a major constraining
factor on trade, Africa’s share of 3% of the total world trade arises from high transport costs
which make it twice as expensive as OECD countries to transport goods across borders, (Davies
(2010). Addressing the short fall will have wide implications on economic development.
By and large, Alesina and Dollar (2005) in their study of aid allocation in general found out that
aid flows are usually dictated by donor country strategic needs as well as the recipient country’s
economic needs and policy performance. Aid motivations can in a nutshell be framed within the
6
context of donor interests and recipient needs guided by Jolly and Gadbois (1989) four aid
mandates:
• Humanitarian needs
• Economic and Development Growth
• Promotion of trade and commercial interests
• Protection of geopolitical and foreign policy interests
2.2 Theoretical Analysis
Donor Interest Model: (McKinlay and Little, 1977, 1978, 1979; Maizels and Nissanke 1984)
The donor interest model inbuilt assumption is that bilateral aid is used to advance donor interests
as postulated first by McKinlay and Little. Based on their reasoning the amount of aid given to a
developing country is in proportion to the level of donor interest in that particular country. These
interests span from economic, security, political, promotion of democracy, development and
stability. Maizels and Nissanke (1984) find this model to be relevant in the context of bilateral
aid. Under this model donor country is seen to have a number of reasons to advance
development assistance. Maizels and Nissanke (1984) building on the work of McKinlay and
Little categorize these into three main categorize:
• Political and security interests
• The investment interest- a donor country will be interested in ensuring economic
development, by addressing the constraining factors as such for the purpose of
securing own investments and strategic goals in a recipient country. Such aid is
perceived to be a subsidy of its investments in the host country. The main purpose
is to secure continual profitability of own firms in the country and minimise
operational risks.
• Trading interest – a donor country will be willing to finance and promote
economic development in those countries that it has trading interest with to secure
resources.
They contend that even if aid is donor oriented it may still result in positive economic
development through incidental effect in the receiving country.
7
Strategic interests of a donor country in a recipient country can be captured by the actual amount
given to each country or as percentage share of total aid given to a group of countries based on
the McKinlay and Little absolute commitment concept. Alternatively as argued by Maizels and
Nissanke (1984) it is better to measure strategic interests using relative aid commitments to
recipients as opposed to absolute commitments which do not take into recognition the influence
of country’s size in terms of population has on aid allocation decisions which can lead to
difficulties in the interpretation of regression results. Population on the recipient side can be an
indicator of need, since countries with large populations can be said to be in need of more
assistance than less populous countries at the same level of development. Additionally,
population size is perceived to be a sound donor strategic variable since it denotes economic
potential, political and military strength hence regional influence.
2.3 Historical Perspective: Sino-Africa Economic Cooperation
Egypt became the first African country to establish formal diplomatic ties with China after its
own independence in 1956. As more and more African countries became independent, by 1978
China had diplomatic connections with almost forty countries, (FOCAC, 2010). China’s
engagement in Africa during the colonial era was much ideologically centred focusing mainly on
assisting most African nationalists materially and training to fight against colonialism and
capitalism. After most African countries became independent, trade and economic relations with
China started to deepen. Trade was growing and Chinese contractors were taking on engineering
projects on the continent, (FOCAC, 2010).Chinese engagement with Africa pre 2000 was more
on a bilateral basis. In 2000, The Forum on China-Africa Cooperation (FOCAC) was created in
Beijing, with the main objective of building a strategic partnership based on equality, trust,
economic cooperation and to exchange ideas. FOCAC is a triennial forum, starting with 2000.
Under this multilateral framework the China’s government has introduced a host of measures to
engage and facilitate economic cooperation with African countries. Some of the measures that
have been initiated and implemented revolve around the issues of debt relief, zero tariffs for the
least developed countries (LDC’s) in the region, development assistance, concessional loans,
science and technology training and public and medical health, (FOCAC,2010).
8
2.4 China-Africa Trade Recent Trend
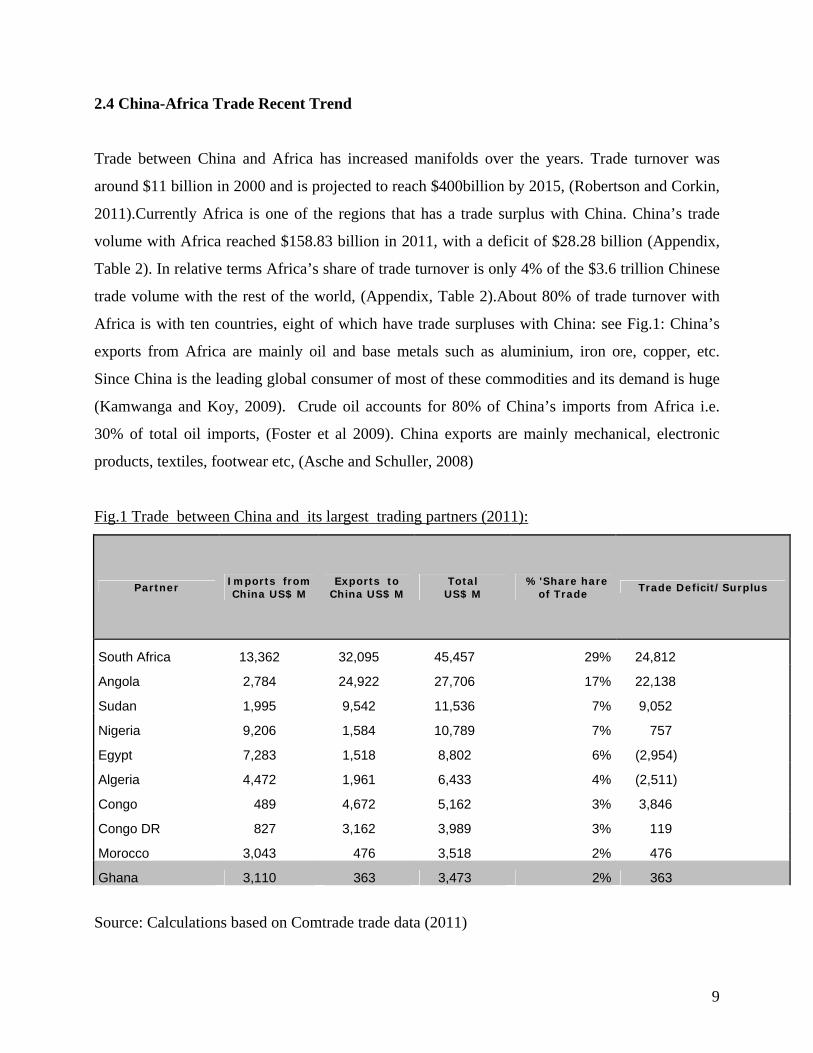
Trade between China and Africa has increased manifolds over the years. Trade turnover was
around $11 billion in 2000 and is projected to reach $400billion by 2015, (Robertson and Corkin,
2011).Currently Africa is one of the regions that has a trade surplus with China. China’s trade
volume with Africa reached $158.83 billion in 2011, with a deficit of $28.28 billion (Appendix,
Table 2). In relative terms Africa’s share of trade turnover is only 4% of the $3.6 trillion Chinese
trade volume with the rest of the world, (Appendix, Table 2).About 80% of trade turnover with
Africa is with ten countries, eight of which have trade surpluses with China: see Fig.1: China’s
exports from Africa are mainly oil and base metals such as aluminium, iron ore, copper, etc.
Since China is the leading global consumer of most of these commodities and its demand is huge
(Kamwanga and Koy, 2009). Crude oil accounts for 80% of China’s imports from Africa i.e.
30% of total oil imports, (Foster et al 2009). China exports are mainly mechanical, electronic
products, textiles, footwear etc, (Asche and Schuller, 2008)
Fig.1 Trade between China and its largest trading partners (2011):
Partner Imports from China US$ M
Exports to China US$ M
Total US$ M
%'Share hare of Trade
Trade Deficit/Surplus
South Africa 13,362 32,095 45,457 29% 24,812
Angola 2,784 24,922 27,706 17% 22,138
Sudan 1,995 9,542 11,536 7% 9,052
Nigeria 9,206 1,584 10,789 7% 757
Egypt 7,283 1,518 8,802 6% (2,954)
Algeria 4,472 1,961 6,433 4% (2,511)
Congo 489 4,672 5,162 3% 3,846
Congo DR 827 3,162 3,989 3% 119
Morocco 3,043 476 3,518 2% 476
Ghana 3,110 363 3,473 2% 363
Source: Calculations based on Comtrade trade data (2011)
9
South Africa is China’s largest trading partner by far in Africa with a share of 29% of the total
trade turnover in the region and trade surplus of $18 billion. Much of South Africa’s exports
consist of a variety of minerals ores such as coal, chrome ores, gold, iron, platinum, cars etc,
(Burke et al 2008) South Africa’s share of global production is significant for many minerals
(Appendix, Table 4). South Africa happens to be also the largest market for Chinese exports.
Trade with Nigeria, Angola, Algeria, Egypt, Sudan and Congo is mainly in crude oil. These
countries are the biggest oil producers in Africa and account for 12% of global production as of
2010, (Appendix, Table 4). Angola was the second largest exporter of oil to China after Saudi
Arabia’s exports worth $39.5 billion in 2011 (based on Comtrade calculations). Angola now
accounts for 18% of China’s total oil imports since 2006, (Executive Research Associates, 2009).
Oil exports from Angola and Sudan were secured at the back of oil for infrastructure long term
loans; where concessional, non concessional loans or a combination of both are given out with
guaranteed oil exports being used as collateral by the host governments. Now a common practice
with other resources as well (Davies et al, 2008).
2.5 China Investments in Africa
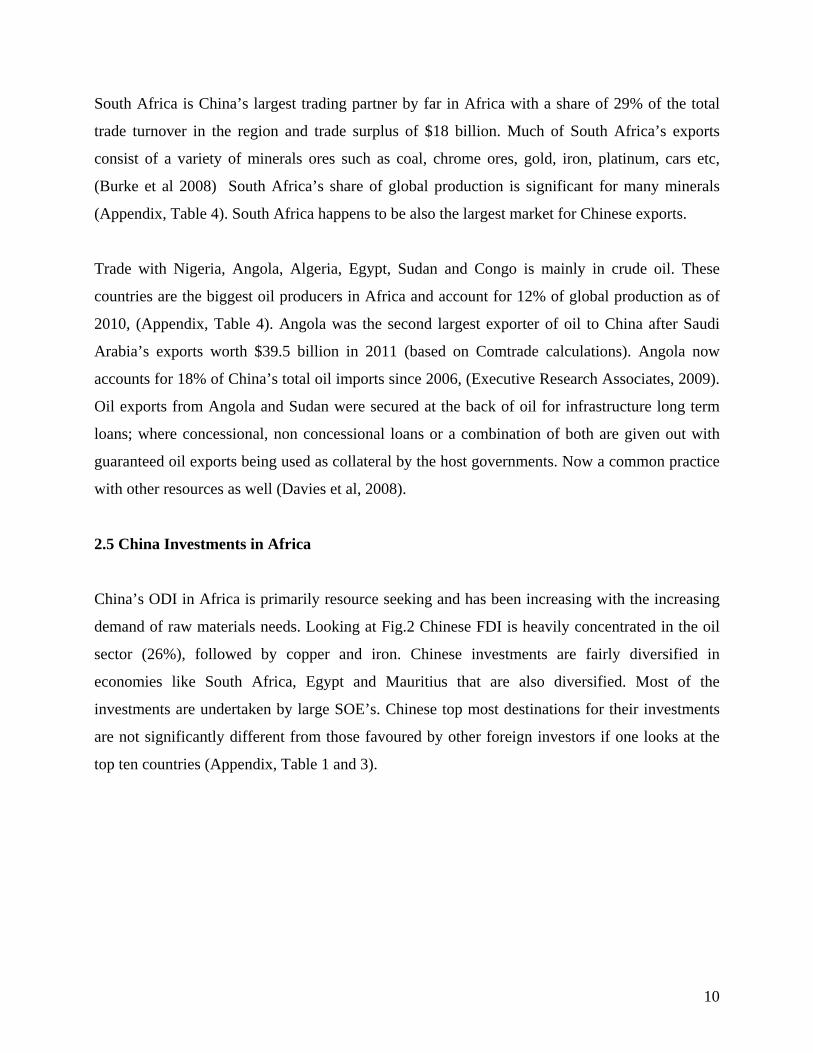
China’s ODI in Africa is primarily resource seeking and has been increasing with the increasing
demand of raw materials needs. Looking at Fig.2 Chinese FDI is heavily concentrated in the oil
sector (26%), followed by copper and iron. Chinese investments are fairly diversified in
economies like South Africa, Egypt and Mauritius that are also diversified. Most of the
investments are undertaken by large SOE’s. Chinese top most destinations for their investments
are not significantly different from those favoured by other foreign investors if one looks at the
top ten countries (Appendix, Table 1 and 3).
10
Fig.2 China Outward Investments Deals of $100m or more compiled by The Heritage Foundation
2006-11
Investor
Value ($US millions) Subsector Country
Sinopec 730.00 Oil Angola Sinomach 500.00 Autos Cameroon Sinopec 540.00 Oil Cameroon CNPC 200.00 Oil Chad China Railway Engineering 1,190.00 Copper DRC MCC and Sinohydro 1,700.00 Copper DRC Minmetals 1,280.00 Copper DRC Export-Import Bank 3,000.00 Metals DRC CITIC and Chinalco 940.00 Aluminum Egypt Tianjin Development 200.00 Property Egypt Jushi Group 230.00 Other Egypt Bosai Minerals 1,200.00 Aluminum Ghana Sinopec 850.00 Gas Ghana Chinalco 1,350.00 Iron Guinea Wuhan Iron and Steel and China Development Bank 110.00 Iron Liberia CNPC 150.00 Oil Madagascar Taiyuan Iron consortium 750.00 Property Mauritius CNPC 4,990.00 Oil Niger China National Nuclear 190.00 Metals Niger China Railway Construction and China-Africa Development Fund 2,970.00 Construction Nigeria CNOOC 2,270.00 Energy Nigeria China Railway Materials 260.00 Iron Sierra LeoneShandong Iron 1,490.00 Iron Sierra LeoneFirst Auto Works and CADF 100.00 Autos South Africa ICBC 5,600.00 Banking South Africa Jinchuan 1,360.00 Copper South Africa CIC 250.00 Investment South Africa SinoSteel 230.00 Steel South Africa Jinchuan Group and China Development Bank 230.00 Metals South Africa CITIC, China Development Bank, Long March Capital 470.00 Metals South Africa Sinochem 500.00 Agriculture Sudan CNOOC 1,450.00 Oil Uganda China Nonferrous 310.00 Copper Zambia China Nonferrous 300.00 Copper Zambia SinoSteel 100.00 Steel Zimbabwe Sinosteel 300.00 Metals Zimbabwe
38,290.00
*Heritage Chinese Investment Tracker only records $100m+ deals
Source: The Heritage Foundation
11
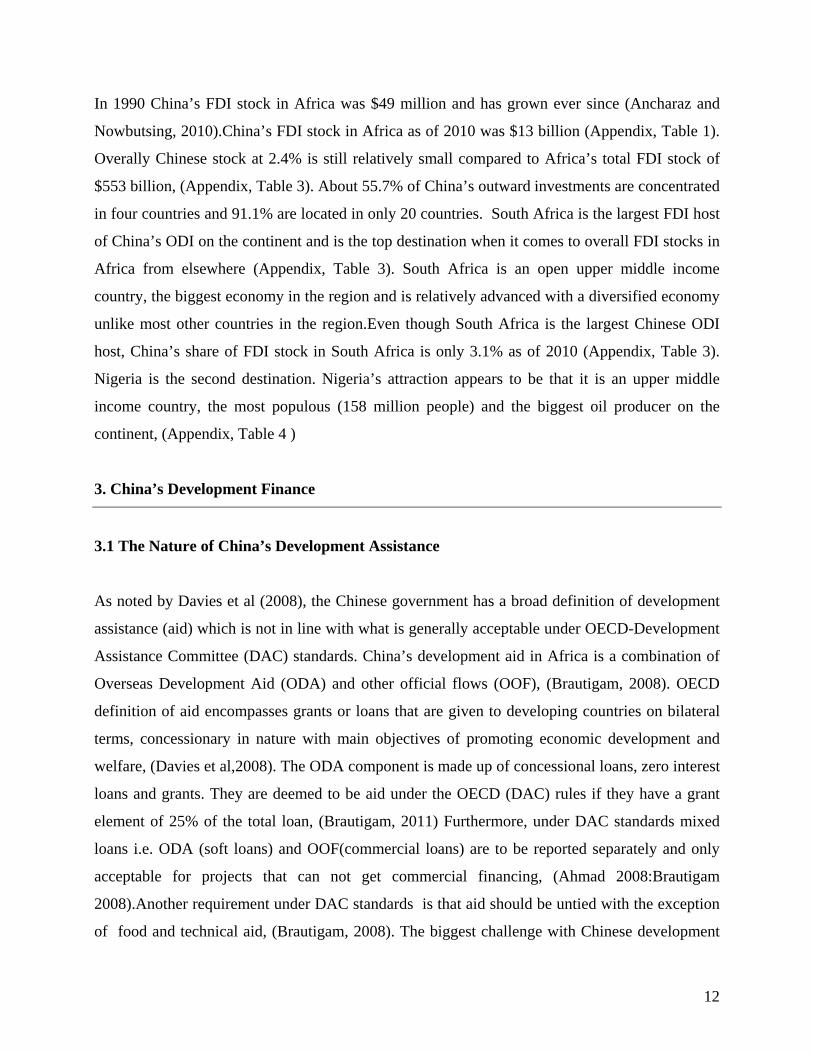
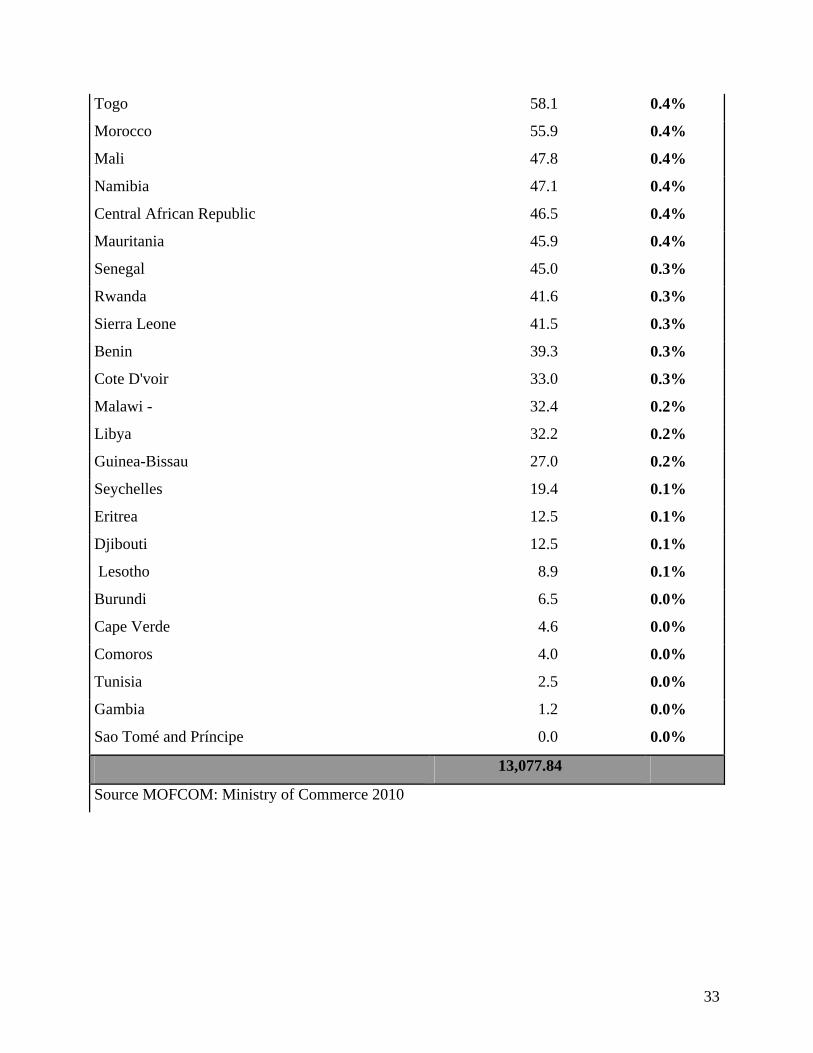
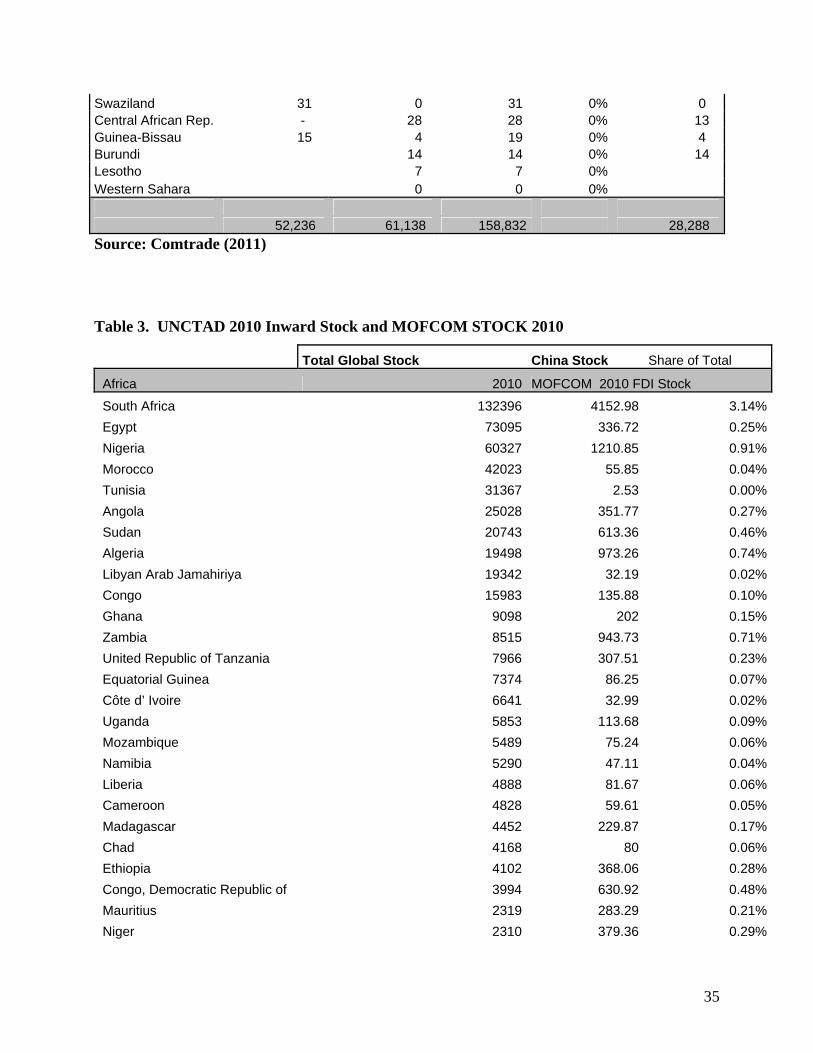
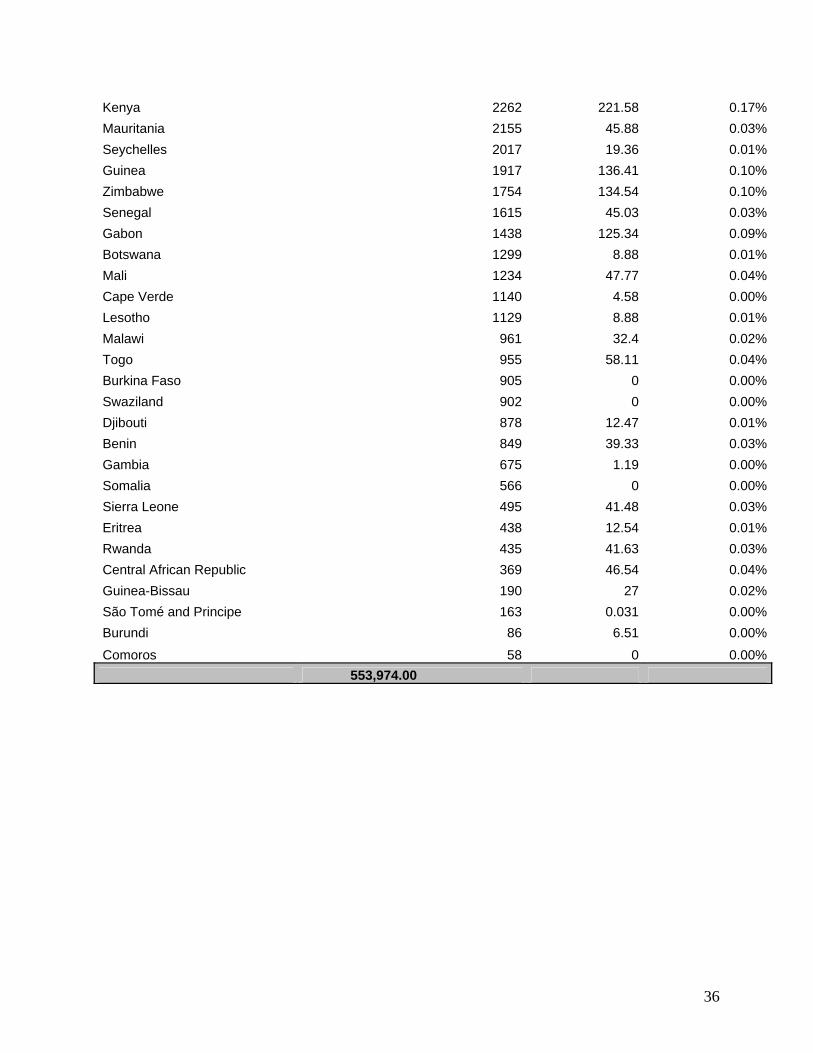
In 1990 China’s FDI stock in Africa was $49 million and has grown ever since (Ancharaz and
Nowbutsing, 2010).China’s FDI stock in Africa as of 2010 was $13 billion (Appendix, Table 1).
Overally Chinese stock at 2.4% is still relatively small compared to Africa’s total FDI stock of
$553 billion, (Appendix, Table 3). About 55.7% of China’s outward investments are concentrated
in four countries and 91.1% are located in only 20 countries. South Africa is the largest FDI host
of China’s ODI on the continent and is the top destination when it comes to overall FDI stocks in
Africa from elsewhere (Appendix, Table 3). South Africa is an open upper middle income
country, the biggest economy in the region and is relatively advanced with a diversified economy
unlike most other countries in the region.Even though South Africa is the largest Chinese ODI
host, China’s share of FDI stock in South Africa is only 3.1% as of 2010 (Appendix, Table 3).
Nigeria is the second destination. Nigeria’s attraction appears to be that it is an upper middle
income country, the most populous (158 million people) and the biggest oil producer on the
continent, (Appendix, Table 4 )
3. China’s Development Finance
3.1 The Nature of China’s Development Assistance
As noted by Davies et al (2008), the Chinese government has a broad definition of development
assistance (aid) which is not in line with what is generally acceptable under OECD-Development
Assistance Committee (DAC) standards. China’s development aid in Africa is a combination of
Overseas Development Aid (ODA) and other official flows (OOF), (Brautigam, 2008). OECD
definition of aid encompasses grants or loans that are given to developing countries on bilateral
terms, concessionary in nature with main objectives of promoting economic development and
welfare, (Davies et al,2008). The ODA component is made up of concessional loans, zero interest
loans and grants. They are deemed to be aid under the OECD (DAC) rules if they have a grant
element of 25% of the total loan, (Brautigam, 2011) Furthermore, under DAC standards mixed
loans i.e. ODA (soft loans) and OOF(commercial loans) are to be reported separately and only
acceptable for projects that can not get commercial financing, (Ahmad 2008:Brautigam
2008).Another requirement under DAC standards is that aid should be untied with the exception
of food and technical aid, (Brautigam, 2008). The biggest challenge with Chinese development
12
assistance is that it is a conflation of both concessional and non-concessional financing. The large
loans are more often than not a package of ODA and other official flows (OOF). For example the
financing of Bui Dam hydro electric project in Ghana was made up of $292m in commercial
export credits at a commercial interest rate and $270m as a concessional loan, (Brautigam, 2008).
This is often thought to be the norm in financing such big projects .Although it is very difficult
to isolate what is concessional or not which can make a difference under OECD –DAC rules as to
the true meaning of developmental assistance. Since such terms are not made public at best the
loans given out regardless of the mix they are official flows given to another government,
therefore they in essence capture China’s strategic interest. In one way it could be argued that
they make their interests apparent by combining long-term commercial loans with aid as way of
ensuring continual engagement and leverage their soft power with host nations over a long time.
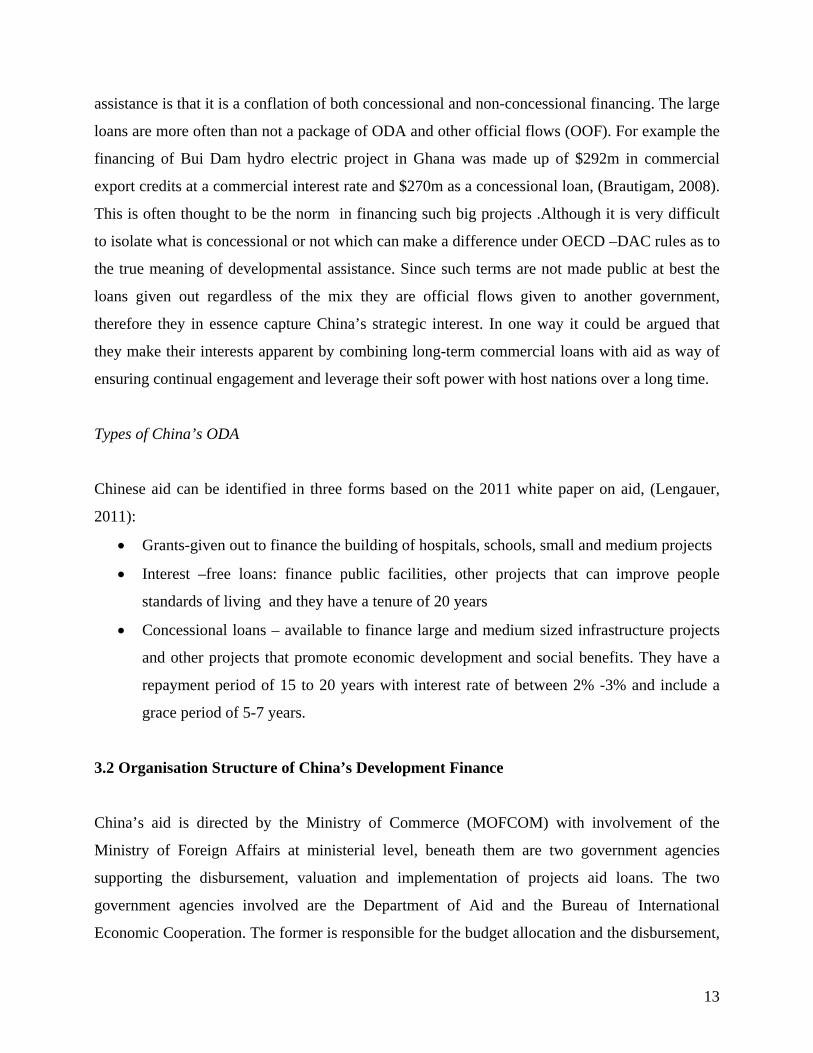
Types of China’s ODA
Chinese aid can be identified in three forms based on the 2011 white paper on aid, (Lengauer,
2011):
• Grants-given out to finance the building of hospitals, schools, small and medium projects
• Interest –free loans: finance public facilities, other projects that can improve people
standards of living and they have a tenure of 20 years
• Concessional loans – available to finance large and medium sized infrastructure projects
and other projects that promote economic development and social benefits. They have a
repayment period of 15 to 20 years with interest rate of between 2% -3% and include a
grace period of 5-7 years.
3.2 Organisation Structure of China’s Development Finance
China’s aid is directed by the Ministry of Commerce (MOFCOM) with involvement of the
Ministry of Foreign Affairs at ministerial level, beneath them are two government agencies
supporting the disbursement, valuation and implementation of projects aid loans. The two
government agencies involved are the Department of Aid and the Bureau of International
Economic Cooperation. The former is responsible for the budget allocation and the disbursement,
13
while the latter is involved with the implementation and monitoring of project. A large chunk of
China’s aid is given out through projects not as balance of payment, (Brautigam.2008).
MOFCOM role in development finance architecture is to give grants and zero interest loans and
works in coordination with China Eximbank on concessional loans, (Brautigam.2008).
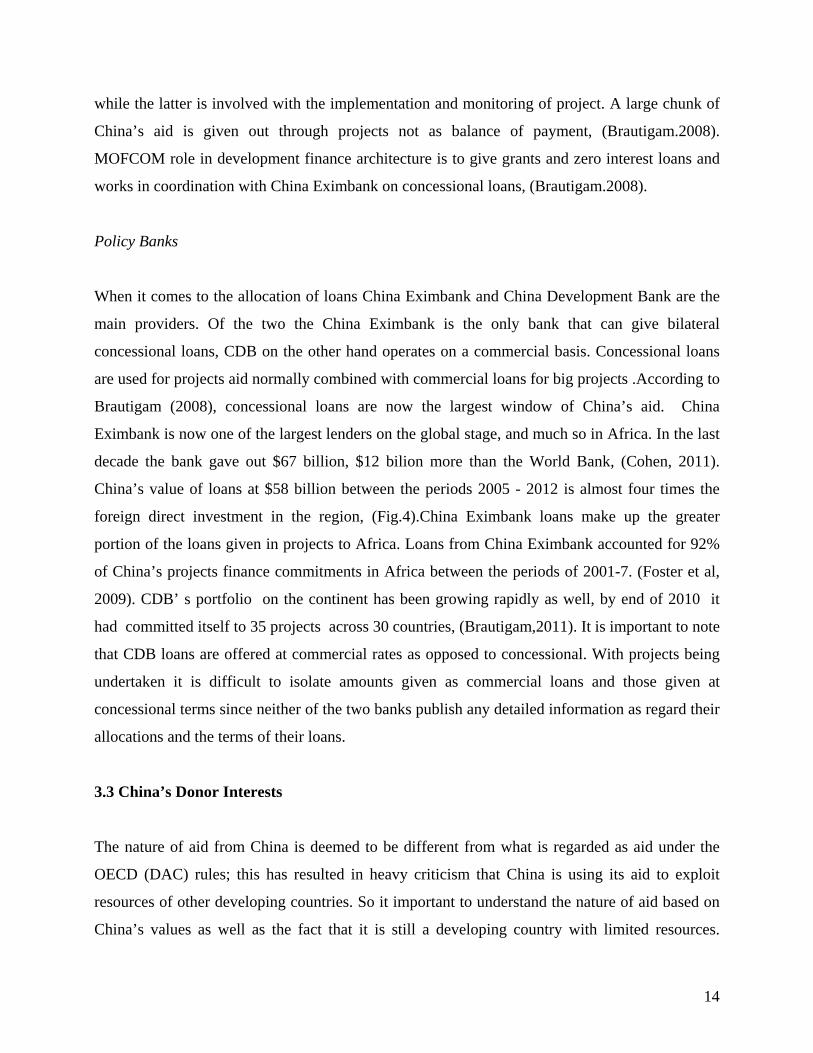
Policy Banks
When it comes to the allocation of loans China Eximbank and China Development Bank are the
main providers. Of the two the China Eximbank is the only bank that can give bilateral
concessional loans, CDB on the other hand operates on a commercial basis. Concessional loans
are used for projects aid normally combined with commercial loans for big projects .According to
Brautigam (2008), concessional loans are now the largest window of China’s aid. China
Eximbank is now one of the largest lenders on the global stage, and much so in Africa. In the last
decade the bank gave out $67 billion, $12 bilion more than the World Bank, (Cohen, 2011).
China’s value of loans at $58 billion between the periods 2005 - 2012 is almost four times the
foreign direct investment in the region, (Fig.4).China Eximbank loans make up the greater
portion of the loans given in projects to Africa. Loans from China Eximbank accounted for 92%
of China’s projects finance commitments in Africa between the periods of 2001-7. (Foster et al,
2009). CDB’ s portfolio on the continent has been growing rapidly as well, by end of 2010 it
had committed itself to 35 projects across 30 countries, (Brautigam,2011). It is important to note
that CDB loans are offered at commercial rates as opposed to concessional. With projects being
undertaken it is difficult to isolate amounts given as commercial loans and those given at
concessional terms since neither of the two banks publish any detailed information as regard their
allocations and the terms of their loans.
3.3 China’s Donor Interests
The nature of aid from China is deemed to be different from what is regarded as aid under the
OECD (DAC) rules; this has resulted in heavy criticism that China is using its aid to exploit
resources of other developing countries. So it important to understand the nature of aid based on
China’s values as well as the fact that it is still a developing country with limited resources.
14
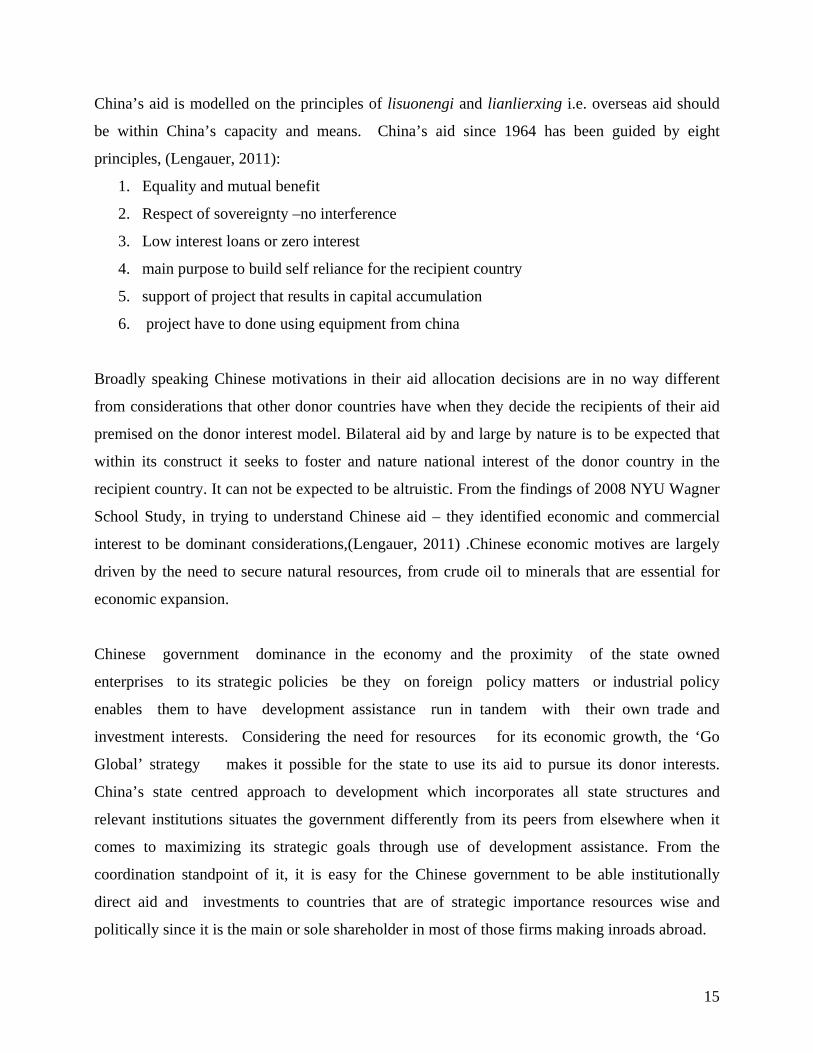
China’s aid is modelled on the principles of lisuonengi and lianlierxing i.e. overseas aid should
be within China’s capacity and means. China’s aid since 1964 has been guided by eight
principles, (Lengauer, 2011):
1. Equality and mutual benefit
2. Respect of sovereignty –no interference
3. Low interest loans or zero interest
4. main purpose to build self reliance for the recipient country
5. support of project that results in capital accumulation
6. project have to done using equipment from china
Broadly speaking Chinese motivations in their aid allocation decisions are in no way different
from considerations that other donor countries have when they decide the recipients of their aid
premised on the donor interest model. Bilateral aid by and large by nature is to be expected that
within its construct it seeks to foster and nature national interest of the donor country in the
recipient country. It can not be expected to be altruistic. From the findings of 2008 NYU Wagner
School Study, in trying to understand Chinese aid – they identified economic and commercial
interest to be dominant considerations,(Lengauer, 2011) .Chinese economic motives are largely
driven by the need to secure natural resources, from crude oil to minerals that are essential for
economic expansion.
Chinese government dominance in the economy and the proximity of the state owned
enterprises to its strategic policies be they on foreign policy matters or industrial policy
enables them to have development assistance run in tandem with their own trade and
investment interests. Considering the need for resources for its economic growth, the ‘Go
Global’ strategy makes it possible for the state to use its aid to pursue its donor interests.
China’s state centred approach to development which incorporates all state structures and
relevant institutions situates the government differently from its peers from elsewhere when it
comes to maximizing its strategic goals through use of development assistance. From the
coordination standpoint of it, it is easy for the Chinese government to be able institutionally
direct aid and investments to countries that are of strategic importance resources wise and
politically since it is the main or sole shareholder in most of those firms making inroads abroad.
15
Chinese outward direct investments are born out of a government’s foreign investment strategy
‘Going Global’ unveiled in the Five Year Plan (2001-2005) that encourages domestic firms to
investment abroad. Part of the strategy is to engage in economic cooperation with regional blocks
and FOCAC is one such forum, (Brautigam, 2008). The political embeddings in the structures of
SOE’s has a bearing in the direction of their investments and access to finance. This makes it
easier for the state to align its investments with national strategic considerations abroad. SOE’s
overseas drive has greatly been based on the government’s economic cooperation with other
countries, this is especially so in Africa where Chinese development assistance seems to open
ways for its firms to enter markets initially as contractors bearing no financial risk at all. Chinese
ODI is characteristically different from other countries as it is largely driven by state owned
enterprise (SOE’s). Almost 84% FDI stocks and flows are state owned, (Hurst, 2011).In the in-
market research conducted in Ethiopia, Ghana and Zambia by Davies et al, (2008) it was found
out that Chinese MNC’s tends to use aid as a lever to gain investment opportunities and markets.
Leveraging Aid: The intersection between development assistance and investments interests
China unlike OECD countries still use tied aid; all China Eximbank project loans require that
50% of procurement are from China, the project has to be done by a Chinese contractor(s) with
Chinese labour, Brautigam (2008). This to a great extent gives Chinese contractors a cautious
entry point into a foreign market shielded from credit and operation risk since China Eximbank
will be the one paying and in turn get its money from the host country. It has been observed that a
number of SOE’s penetrate markets as has been the case in Ghana via China Eximbank
concessional loans projects, (Davies et al 2008).
Angola Model
China widely uses its aid in the form of grants, loans alongside its commercial investments to
gain access to resources and build political relationships, (Davies et al, 2008). China Eximbank is
now increasingly using the resource for infrastructure deals known as the ‘Angola Model’ where
16
repayment of concessional loans or packaged loans (i.e. concessional and commercial) for
infrastructure development are repaid using natural resources (e.g. oil), (Foster et al, 2009).
Angola is often cited as one great example of how interlinked Chinese commercial and political
interests are. China Eximbank loans gave Chinese oil giant Sinopec access to Angola’s oil
through the oil for infrastructure loan deal. (Executive Research Associates,2009).Deals
structured in this manner achieve three things; (1) political connections, (2) secure essential
resources and (3) entry of their on MNC’s since most countries that accept such deals lack the
capital to exploit their own resources. Such deals are increasingly becoming the norm for Chinese
investments in Africa according to (Kaplisky and Morris, 2008: Ancharaz and Nowbutsing,
2010).
China’s aid to Sudan as well as that of Angola is seen to be motivated by political and economic
considerations. The aid for infrastructure development is combined with commercial loans whose
interest is tied to petroleum exports guarantee from Sudan conditioned upon Chinese companies
doing the work with their own equipment using Chinese labour, Nour (2010).
Resource-backed deals have become common place used mainly to secure essential resources not
just oil in exchange for concessional loans (EU, 2011):e.g.
• Guinea bauxite for the construction of a dam
• Zimbabwe chromium for construction of thermal power
• Gabon Iron
• Ghana cocoa for the construction of hydro electric power
• Congo (DRC) copper mining concessions for $6 billion infrastructure development
• Nigeria oil –preferential access
Their preference of such deals can be said to be driven by two reasons. One to ensure guaranteed
supplies of essential raw materials, secondly it could seen as credit risk management plan on the
part of the Chinese.
17
4. Data Analysis and Methodology
4.1 Empirical Test
As highlighted earlier in the paper the intention is to find out if development assistance is used as
a tool to advance China’s strategic interests in this instance FDI using data from The Heritage
Foundation China-Global –Investment –Tracker 2012 on contracts loans (of $100m or more)
made up of 20 Africa countries in the period between 2005-2012 and Economic Freedom Index,
for institutional quality together with China’s Ministry of Commerce (MOFCOM),2010
Statistical Bulletin of China’s Outward FDI (Appendix, Table1 ) as well as World Bank
Development Indicators for 2011
As regard the loans given out, there were 20 countries that had received contract loans from
China by end of 2012 (Fig 4) and 12 that had received loans by 2010 which is a very small
sample that would have resulted in a loss of important observations and considering that projects
loans are not annual flows the aggregation of them are considered not to be materially significant.
The Heritage Foundations only keeps track of loans that are $100m or more, so it does not
necessarily mean the countries listed are the only ones receiving development assistance.
According to Brautigam (2011) aid from China is widely distributed to all countries in the region
with diplomatic ties with Beijing, not included are countries that recognise Taiwan as a state.
However, the size of the loans can be an indication of the depth and commitment of economic
cooperation with recipient countries saving as a barometer to measure donor strategic interest. It
is also important to note that not all loans are necessarily concessional as some are given at
commercial rates, but since China Eximbank uses ‘package financing’ where they mix
concessional with commercial loans it is difficult to isolate ODA from market loans because the
terms of the loans are not made public, (Brautigam 2008, Hubbard 2007). What is known
however, is that China made concessional loans commitment at FOCAC summit in 2006 of
$2billion combined with $3billion of preferential export credits and at the 2009 summit they
pledged $10billion in concessional/preferential credits to be committed over the course of three
years by 2012, (Brautigam, 2011). Based on the formulation of concessional loans, it can be
assumed that China has given away $15billion of aid between 2006-2012 which is less the
18
amount of loans calculated for the period 2005-2012 which is $58 billion, (Fig. 4) indicating that
a greater component is made up of either commercial or zero interest loans. It is always
challenging for researchers to get data on aid flows since Chinese government does not report its
aid commitments, many researchers have to rely on estimates through reports made in the media,
(Brautigam, 2011)
The model used here is an OLS; the intention is to find out if there is a relationship in the
direction of economic cooperation (development assistance), outward FDI and oil producing
countries. If there exists a correlation between the loans, FDI and big oil producers, tentatively it
will be seen to be an indication of development finance being used as a strategic tool to build up
soft power to enable investments as well as to ensure resource access.
Hypothesis to be tested:
Hypothesis 1: China’s FDI stock will be high in countries that receive large loans:
εβββββββ ++++++++= LogIFLogPRLogFCLogPOPLogGDPLogFDIoLogPCLoans
Hypothesis 2: China’s loans and FDI tend flow more to oil producing countries:
εβββββββ +++++++++= DummyLogIFLogPRLogFCLogPOPLogGDPLogFDIoLogPCLoans
19
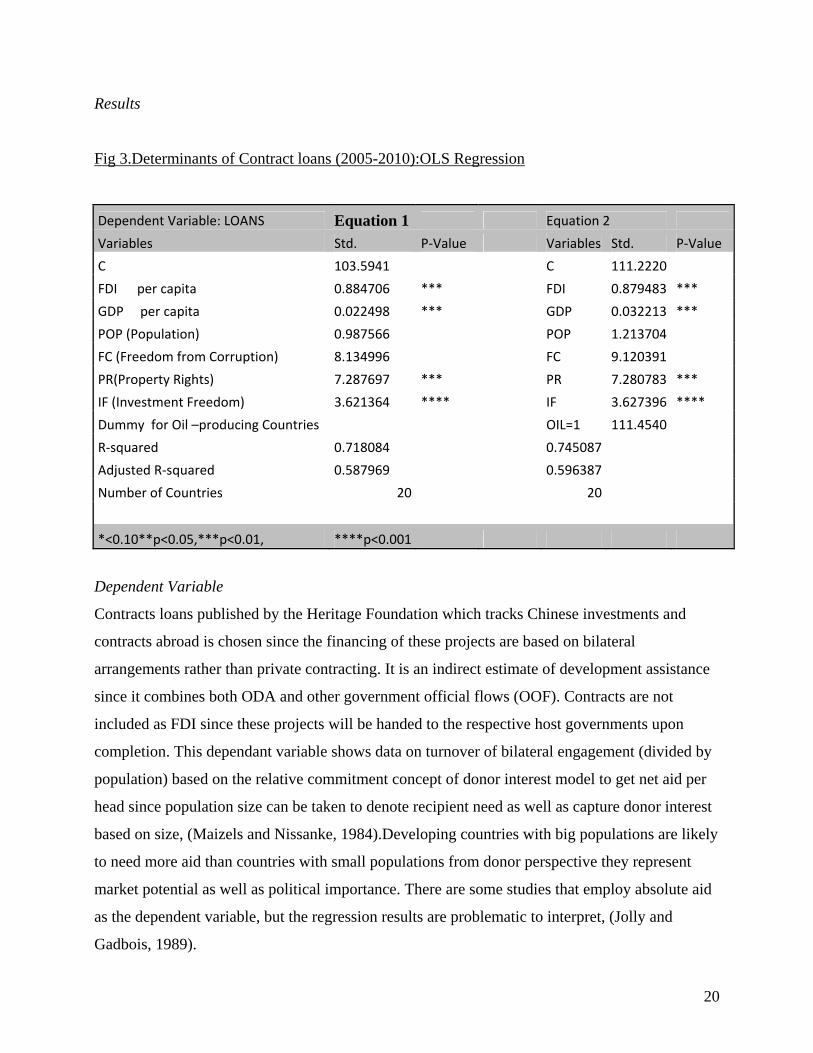
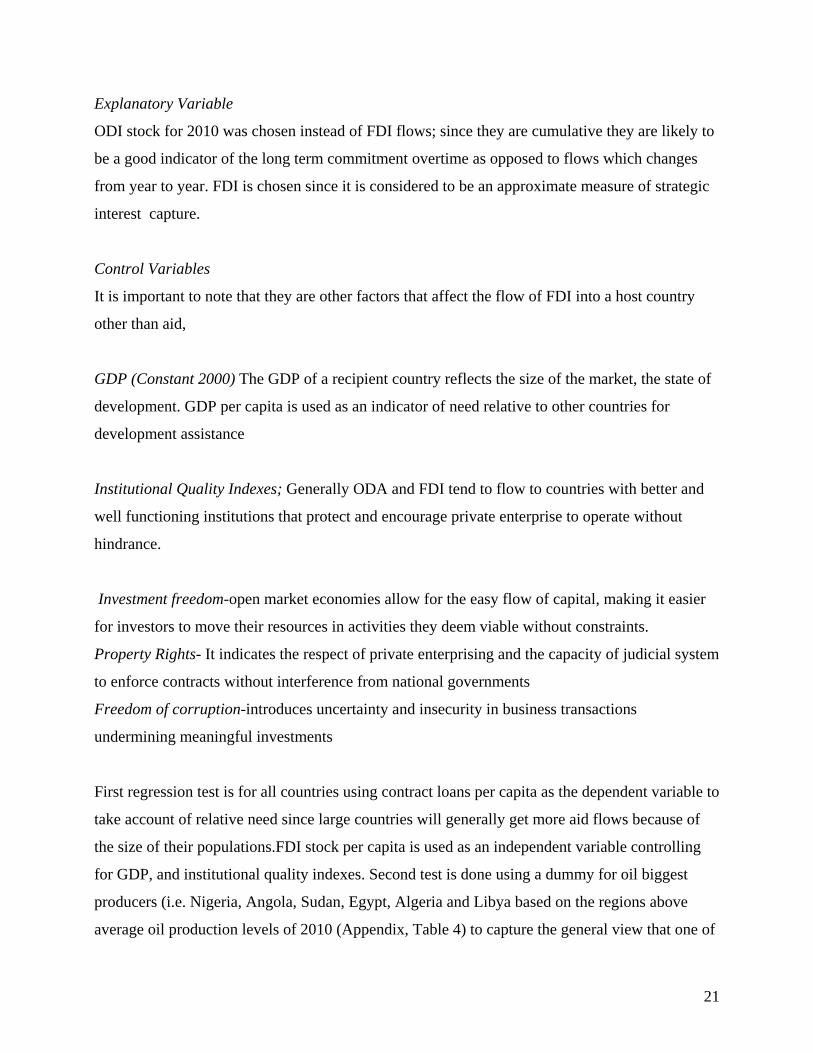
Results
Fig 3.Determinants of Contract loans (2005-2010):OLS Regression
Dependent Variable: LOANS Equation 1 Equation 2
Variables Std. P‐Value Variables Std. P‐Value
C 103.5941 C 111.2220
FDI per capita 0.884706 *** FDI 0.879483 ***
GDP per capita 0.022498 *** GDP 0.032213 ***
POP (Population) 0.987566 POP 1.213704
FC (Freedom from Corruption) 8.134996 FC 9.120391
PR(Property Rights) 7.287697 *** PR 7.280783 ***
IF (Investment Freedom) 3.621364 **** IF 3.627396 ****
Dummy for Oil –producing Countries OIL=1 111.4540
R‐squared 0.718084 0.745087
Adjusted R‐squared 0.587969 0.596387
Number of Countries 20 20
*<0.10**p<0.05,***p<0.01, ****p<0.001
Dependent Variable
Contracts loans published by the Heritage Foundation which tracks Chinese investments and
contracts abroad is chosen since the financing of these projects are based on bilateral
arrangements rather than private contracting. It is an indirect estimate of development assistance
since it combines both ODA and other government official flows (OOF). Contracts are not
included as FDI since these projects will be handed to the respective host governments upon
completion. This dependant variable shows data on turnover of bilateral engagement (divided by
population) based on the relative commitment concept of donor interest model to get net aid per
head since population size can be taken to denote recipient need as well as capture donor interest
based on size, (Maizels and Nissanke, 1984).Developing countries with big populations are likely
to need more aid than countries with small populations from donor perspective they represent
market potential as well as political importance. There are some studies that employ absolute aid
as the dependent variable, but the regression results are problematic to interpret, (Jolly and
Gadbois, 1989).
20
Explanatory Variable
ODI stock for 2010 was chosen instead of FDI flows; since they are cumulative they are likely to
be a good indicator of the long term commitment overtime as opposed to flows which changes
from year to year. FDI is chosen since it is considered to be an approximate measure of strategic
interest capture.
Control Variables
It is important to note that they are other factors that affect the flow of FDI into a host country
other than aid,
GDP (Constant 2000) The GDP of a recipient country reflects the size of the market, the state of
development. GDP per capita is used as an indicator of need relative to other countries for
development assistance
Institutional Quality Indexes; Generally ODA and FDI tend to flow to countries with better and
well functioning institutions that protect and encourage private enterprise to operate without
hindrance.
Investment freedom-open market economies allow for the easy flow of capital, making it easier
for investors to move their resources in activities they deem viable without constraints.
Property Rights- It indicates the respect of private enterprising and the capacity of judicial system
to enforce contracts without interference from national governments
Freedom of corruption-introduces uncertainty and insecurity in business transactions
undermining meaningful investments
First regression test is for all countries using contract loans per capita as the dependent variable to
take account of relative need since large countries will generally get more aid flows because of
the size of their populations.FDI stock per capita is used as an independent variable controlling
for GDP, and institutional quality indexes. Second test is done using a dummy for oil biggest
producers (i.e. Nigeria, Angola, Sudan, Egypt, Algeria and Libya based on the regions above
average oil production levels of 2010 (Appendix, Table 4) to capture the general view that one of
21
China’s strategic interest is to secure oil supplies and also because oil constitute 80% of Africa’ s
total exports to China, (Foster et al 2009).
Results Discussion
The regressions give some insight into the determinants of China’s development financing. The
GDP per capita, FDI, property rights and investment freedom are significantly related to project
loans. FDI stock per capita is significantly related to bilateral loans, a sign that Chinese lending is
closely related to FDI in part perhaps due to tied aid. The dummy for oil producing countries is
not significantly related to loans allocation, an indication that loans are not concentrated only to
oil producing countries as is widely perceived. The significance of GDP could be that China
gives large loans to those countries that are perceived to have the capacity to repay with high per
capita incomes. As a requirement for concessional loans lending by China Eximbank, the
recipient country which is the guarantor of the loan must have good credit and capacity to make
repayments, (Hubbard, 2007).The results are in line with observations made by some researchers
such as Brautigam (2008) that large concessional loans are advanced to countries that have
relatively high GDP per capita and have rich deposits of natural resources that can be used as
collateral for such loans. According to Brautigam (2011), grants and zero interest loans are given
fairly to a number of countries whereas concessional loans are given based on the country’s
ability to repay either because it’s a middle income economy or the project being financed will
generate income. Chinese lending is statistically significantly related to investment freedom and
property rights. One of the condition for concessional lending is that the recipient country must
have political stability and relatively favourable economic conditions for economic growth,
(Hubbard, 2007).
4.2 Descriptive Empirical Findings:
The distribution of loans in based on Chinese financed contracts being under taken or completed
in Africa between the periods of 2005 -2012.
22
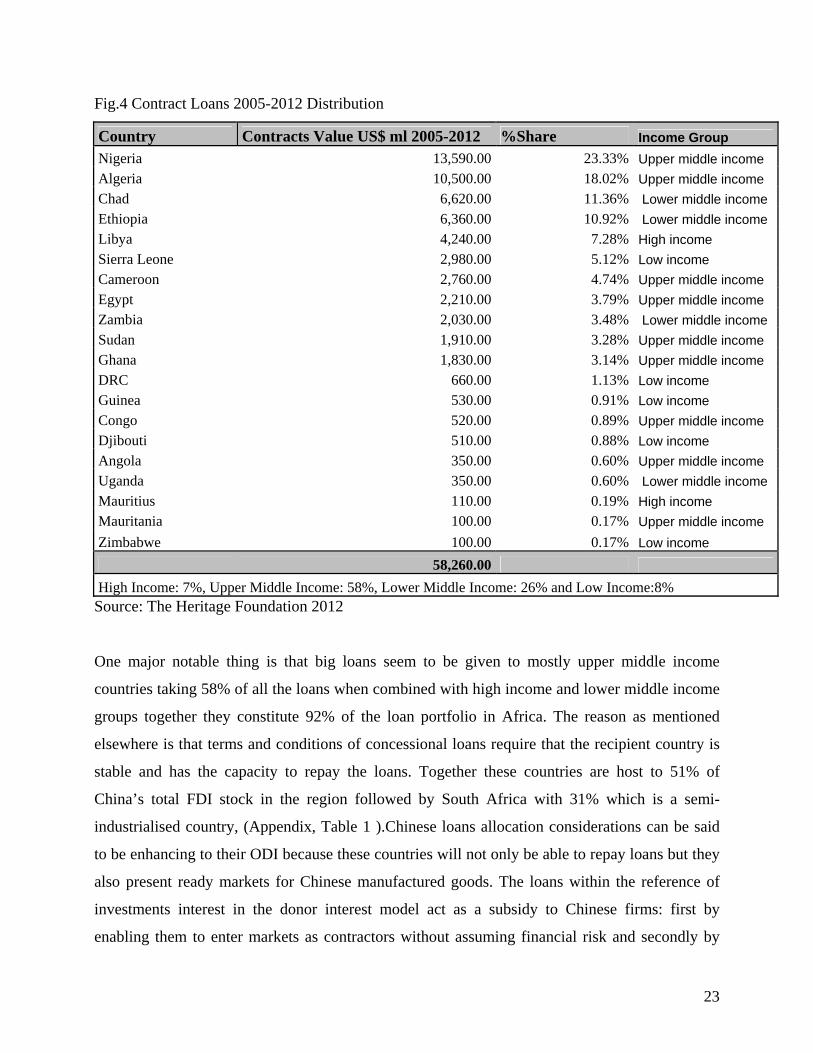
Fig.4 Contract Loans 2005-2012 Distribution
Country Contracts Value US$ ml 2005-2012 %Share Income Group Nigeria 13,590.00 23.33% Upper middle income Algeria 10,500.00 18.02% Upper middle income Chad 6,620.00 11.36% Lower middle income Ethiopia 6,360.00 10.92% Lower middle income Libya 4,240.00 7.28% High income Sierra Leone 2,980.00 5.12% Low income Cameroon 2,760.00 4.74% Upper middle income Egypt 2,210.00 3.79% Upper middle income Zambia 2,030.00 3.48% Lower middle income Sudan 1,910.00 3.28% Upper middle income Ghana 1,830.00 3.14% Upper middle income DRC 660.00 1.13% Low income Guinea 530.00 0.91% Low income Congo 520.00 0.89% Upper middle income Djibouti 510.00 0.88% Low income Angola 350.00 0.60% Upper middle income Uganda 350.00 0.60% Lower middle income Mauritius 110.00 0.19% High income Mauritania 100.00 0.17% Upper middle income Zimbabwe 100.00 0.17% Low income
58,260.00
High Income: 7%, Upper Middle Income: 58%, Lower Middle Income: 26% and Low Income:8% Source: The Heritage Foundation 2012
One major notable thing is that big loans seem to be given to mostly upper middle income
countries taking 58% of all the loans when combined with high income and lower middle income
groups together they constitute 92% of the loan portfolio in Africa. The reason as mentioned
elsewhere is that terms and conditions of concessional loans require that the recipient country is
stable and has the capacity to repay the loans. Together these countries are host to 51% of
China’s total FDI stock in the region followed by South Africa with 31% which is a semi-
industrialised country, (Appendix, Table 1 ).Chinese loans allocation considerations can be said
to be enhancing to their ODI because these countries will not only be able to repay loans but they
also present ready markets for Chinese manufactured goods. The loans within the reference of
investments interest in the donor interest model act as a subsidy to Chinese firms: first by
enabling them to enter markets as contractors without assuming financial risk and secondly by
23
addressing the major operational constrain which is infrastructure. The railroads, roads and hydro
electric power stations are not only beneficial to the host countries, they will also make it easier
for Chinese firms to power their plants and transport the resources they need from the continent
as well as export their goods in. Chinese loans into Africa for the period under review are almost
four times as much as FDI flows. An indication perhaps of China’s effort to consolidate its
economic diplomacy ahead of its investments.
Nigeria can be seen as important strategically in the eyes of China because of the size of its
potential domestic market of 158 m people, its huge oil reserves, and its strategic location in the
Gulf of Guinea region. From a donor interest perspective Nigeria is important both economically
and politically. It is the largest oil producer in Africa controlling about 24% and 3% global
annual production as of 2010 respectively (Appendix, Table 4)
Algeria has enjoyed good diplomatic relations with China since 1958, much favoured for being a
co-sponsor of the motion in United Nations in 1970s that restored China legitimate seat.It has
been rewarded with big contracts in recent years, with CITI Group and China Railway
Construction Corp being awarded the largest Chinese contract on the continent so far of $6.25
billion, (Ying and Xin, 2008). Additionally it is the third biggest oil producer on the continent.
Ethiopia importance is more largely as a potential market because the size of its population of
around 81m as well is the de facto status of Addis Ababa as the capital city of Africa because of
the African Union Headquarters. The country has no notable resources.
Chad perhaps offers a unique case that demonstrates Chinese market entry strategy; loans first,
investments latter. Before 2006 there were no diplomatic ties between Chad and China because of
the latter’s allegiance to Taiwan. Since Chad switched to China, it has been receiving enormous
amount of loans because of its oil, it is currently an insignificant ODI destination (Appendix,
Table 1). Chinese companies have managed to secure some oil exploration and drilling rights,
(Foster et al, 2009).
24
5. Economic Development Implications for Africa
The amount of loans being pumped into Africa from China can be a double edged sword if they
continue to be lack of transparency as regard the composition. Availability of the loans fills a
financing gap between savings and capital spending in Africa, (Nour, 2010). On the other hand
because China’s development assistance is packaged together with commercial interest loans the
cost of most of the loans is unknown to many stakeholders creating a very difficult situation in
the monitoring of debt levels and can possibly undermine the efforts by other lenders on debt
relief. There is a general worry by other stakeholders that the loans could lead to unsustainable
debt levels and dependence, leaving some countries locked indebt for a long time to come
especially those countries that have not been beneficiaries of debt relief program and can not
borrow from other international lenders like Angola, Sudan and Zimbabwe, (Foster et al, 2009)
There is no questionable doubt that infrastructure financing is going a long way in addressing
infrastructure deficit on the continent
Implication on Economic Development
The loans have a greater appeal to most African countries because of few conditions that are
attached to them as is the case generally with the multilateral lenders. The loans are generally
given to finance projects that are chosen by the host government and approved by China
Eximbank. Exim loans have the appeal of ownership allowing the host government to direct the
loans to areas they feel need to be addressed as opposed to the lender coming up with their own
projects as is the case with World Bank funding and IMF. African governments are given ‘policy
space’ to leverage and direct loans to projects that matters to their constituencies (Oya,2008),
The focus by Chinese lenders on infrastructure development is considered a noble one by a
number of stakeholders . Africa suffers from perennial infrastructure deficit hampering
development on regional trade, as well as foreign investment. The infrastructure development
targets hydro electric power, railroads. According to Foster et al (2009), by end of 2007 China
had committed to provide $3b towards the construction of 10 major hydro projects which will
increase the generating capacity by 30%. The impact in this area will be huge in the future
enabling trade and more foreign investments.
25
Threats to future African Development
There is challenge that is posed by the loans and another one by Chinese investments. The mixing
of loans and lack of detailed terms, especially as regard resource-backed ones creates a degree of
opacity that makes it difficult to know exactly what the benefits are. Resource for infrastructure
loans such the one that was negotiated by the government of Ghana where the loan for Bui dam
hydro electric project is backed by 20 years supply of cocoa (Robertson and Corkin, 2011) are
complex to evaluate in the long run creating a potential hazard for some countries which may end
up being locked in bad deals as it eliminates market options. The level of debt that some
countries are incurring in light of the fact that some government regimes negotiating these loans
can not be hold accountable by their constituencies there is a concern that some countries will
end up wallowing in a sea of debt once their resources wane out. The findings by EU (2011),
notes that some countries that benefited from debt relief have already contracted debt in excess of
those values e.g. Guinea, and some more debt, Nigeria and Mauritania for instance, the debts are
built at the back of loans coming from China.
China’s cheap manufactured imports are crowding out local competing manufacturers driving
them out of business in most African countries as they are destroying local industries. This more
true with the textile industry. The large number of Chinese workers who are contracted to
projects as resulted in the increase in small scale Chinese traders selling cheap goods competing
with African informal traders, (Brautigam, 2011). In many African countries this is a big
challenge since the majority of the people are informal traders whose livelihoods solely depends
on selling wares
26
6 Conclusions
This paper considered the aspects of donor interests in the calculation of China’s development
assistance allocations. Due to the limitation of data available, an attempt was made to try and
analyse Chinese aid using an indirect method of contract loans which can be said to be partially
reflective of China’s aid allocation considerations. It is difficult to isolate the loans because they
are often offered in the form of a packaged finance with no terms being made public; so the level
of non concessional and concessional terms are not clearly know. China has been noted to have
a broad interpretation of aid than is the case under OECD-(DAC) rules making difficult to draw
credible comparisons with OECD countries.
The findings show that China’s financing tend to be directed to those countries that are in the
middle income to high income bracket that have the capacity to repay loans and are also
generally resource rich. Out of the sample only Ethiopia, Djibouti and Mauritius can be
considered non resource rich countries.
In a nutshell there appears to be a significant intersection between development assistance and
investments an indication of the donor leveraging its resources to advance its on interest which
have an incidental effect of meeting the recipients’ needs. It is perhaps worth evaluating China’s
development finance in the context of South-South cooperation where another developing
country is trying to assist other developing countries with its limited resources. Guided by its
eight principles on aid; the first principle seeks equality and mutual benefit. So China’s
Development can be seen by some to be of mutual benefit.
27
References
Alesina A. and Dollar D. (2005) ‘Who gives Foreign Aid to Whom and Why?
Ancharaz D. V. Nowbutsing M. B. (2010) ‘Impact of China-Africa Investment Relations: An in
depth case study of Mauritius’
Asche H. and Schuller M. (2008), ‘China’s Engagement in Africa –Opportunities and Risks for
Development’
Brautigam D. (2008) ‘China’s African Aid: Transatlantic Challenges’
Brautigam D. (2011) ‘Chinese development finance in Africa’ December 25,
http://www.eastasiaforum.org/2011/12/25/chinese-development-aidin-africa/
Brautigam D. (2011) ‘Aid with Chinese Characteristics: Chinese Foreign Aid and Development
Finance Meet The OECD-DAC Aid Regime’
British Geological Survey (2012) ‘World Mineral Production:2006-2010’-
http://www.bgs.ac.uk/home.html
Burke C. Naidu S. and Nepgen A. (2008),’Scoping Study on China’s Relations
with South Africa’
Cohen, M. (2011) ‘China’s EXIM Lend More To Sub-Sahara Africa Than World Bank’
http://www.bloomberg.com/news/2011-12-28/china-exim-loans-to-sub-sahara-africa-exceed-
world-bank-funds-fitch-says.html
Comtrade (2011), http://comtrade.un.org/
28
Davies M. (2010) ‘How China is influencing Africa’s Development’, Background Paper for the
Perspectives on Global Development Shifting Wealth’
Davies M. Edinger H. Tay N. Naidu S. (2008), ‘How China Delivers Development Assitance to
Africa’
Executive Research Associates, (2009) ‘China inAfrica: A Strategic Overview’
EU (2011), ‘Export Finance Activities By The Chinese Government’, Briefing Paper,
Directorate-General For External Policies of the Union
FOCAC (2010), http://www.focac.org
Foster V. Butterfield W. Chen C. and Pushak N. (2009) ‘Building Bridges
China’s Growing Role as Infrastructure Financier for Sub-Saharan Africa: Trends and Policy
Options No.5’
The Heritage Foundation (2012) ‘China-Global-Investment-Tracker-2012’,
http://www.heritage.org/research/reports/2012/01/china-global-investment-tracker-
2012?query=china+global+investment+tracker:+2012
The Heritage Foundation (2012), Economic Freedom Index-
http://www.heritage.org/index/ranking
Hubbard P. (2007), ‘Aiding Transparency: What We Can Learn About China
Exim Bank’s Concessional Loans,’ Working Paper Number 126, September, Centre for Global
Development
Hurst L. (2011) ‘Comparative Analysis of the Determinants of China’s State-owned Outward
Direct Investment in OECD and Non-OECD Countries’, China and World Economy Vol.19,
No.4, 2011
29
Jolly M C. and Gadbois M A. (1989), ‘Foreign Aid as Promotional Strategy’
Kamwanga J. and Koyi G. (2009), ‘Impact of China-Africa Investment Relations: The Case of
Zambia’, November
Lengauer S. (2011), ‘China’s Foreign Aid Policy: Motive and Method’, Bulletin of the Centre for
East-West Cultural & Economic Studies, Vol. 9, Issue 2, September- December 2011, pp.35-81.
Maizels A. and Nissanke K.M (1984) ‘Motivations for Aid to Developing Countries’, World
Development, Vol. 12, No. 9, pp. 819-900,
Ministry of Finance (2010) ‘2010 Statistical Bulletin of China’s Outward Foreign Direct
Investment’-http://hzs.mofcom.gov.cn/accessory/201109/1316069658609.pdf
Nour S. (2010), ‘The Impact of China-Africa Aid Relations: The Case of Sudan’, African
Economic Research Consortium, Number 9 , November , http://www.aercafrica.org
Oya C. (2008) ‘Greater Africa-China Economic Cooperation: Will This Widen ‘Policy Space’?,
Development Viewpoint, No.4, June
Robertson C. and Corkin L. (2011), ‘China in Africa’: Equity Research, Renaissance Capital
Wang Y .J and Bio-Tchane A. (2008) ‘Africa’s Burgeoning Ties Maximizing the benefits of
China’s increasing economic engagement with Africa’, Finance & Development March
Weston J. Campbell C. and Kolesk K. (2011) ‘China’s Foreign Assistance in Review:
Implication for the United States’
World Bank (2010), World Bank Development Indicators- http://data.worldbank.org/indicator
30

Ying T. and Xin W. (2008) ‘Algeria, China strengthen strategic partnership’-
http://www.chinadaily.com.cn/cndy/2008-12/19/content_7320543.htm
31
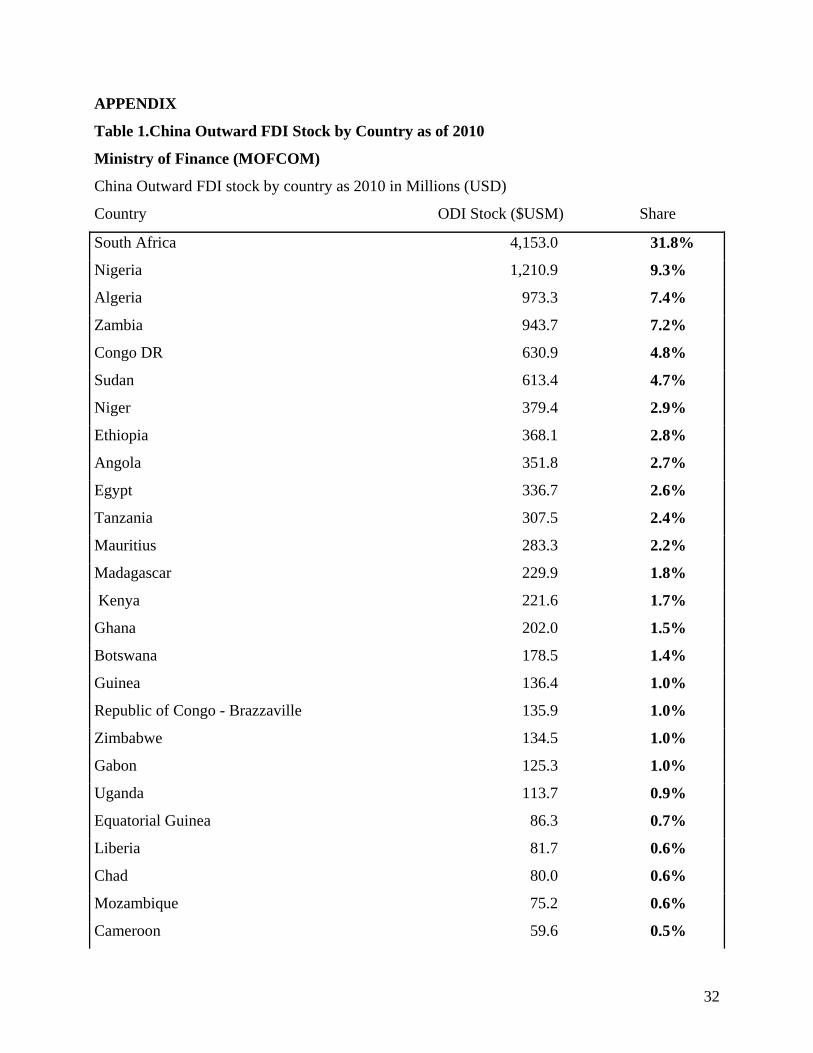
APPENDIX
Table 1.China Outward FDI Stock by Country as of 2010
Ministry of Finance (MOFCOM)
China Outward FDI stock by country as 2010 in Millions (USD)
Country ODI Stock ($USM) Share
South Africa 4,153.0 31.8%
Nigeria 1,210.9 9.3%
Algeria 973.3 7.4%
Zambia 943.7 7.2%
Congo DR 630.9 4.8%
Sudan 613.4 4.7%
Niger 379.4 2.9%
Ethiopia 368.1 2.8%
Angola 351.8 2.7%
Egypt 336.7 2.6%
Tanzania 307.5 2.4%
Mauritius 283.3 2.2%
Madagascar 229.9 1.8%
Kenya 221.6 1.7%
Ghana 202.0 1.5%
Botswana 178.5 1.4%
Guinea 136.4 1.0%
Republic of Congo - Brazzaville 135.9 1.0%
Zimbabwe 134.5 1.0%
Gabon 125.3 1.0%
Uganda 113.7 0.9%
Equatorial Guinea 86.3 0.7%
Liberia 81.7 0.6%
Chad 80.0 0.6%
Mozambique 75.2 0.6%
Cameroon 59.6 0.5%
32
Togo 58.1 0.4%
Morocco 55.9 0.4%
Mali 47.8 0.4%
Namibia 47.1 0.4%
Central African Republic 46.5 0.4%
Mauritania 45.9 0.4%
Senegal 45.0 0.3%
Rwanda 41.6 0.3%
Sierra Leone 41.5 0.3%
Benin 39.3 0.3%
Cote D'voir 33.0 0.3%
Malawi - 32.4 0.2%
Libya 32.2 0.2%
Guinea-Bissau 27.0 0.2%
Seychelles 19.4 0.1%
Eritrea 12.5 0.1%
Djibouti 12.5 0.1%
Lesotho 8.9 0.1%
Burundi 6.5 0.0%
Cape Verde 4.6 0.0%
Comoros 4.0 0.0%
Tunisia 2.5 0.0%
Gambia 1.2 0.0%
Sao Tomé and Príncipe 0.0 0.0%
13,077.84
Source MOFCOM: Ministry of Commerce 2010
33
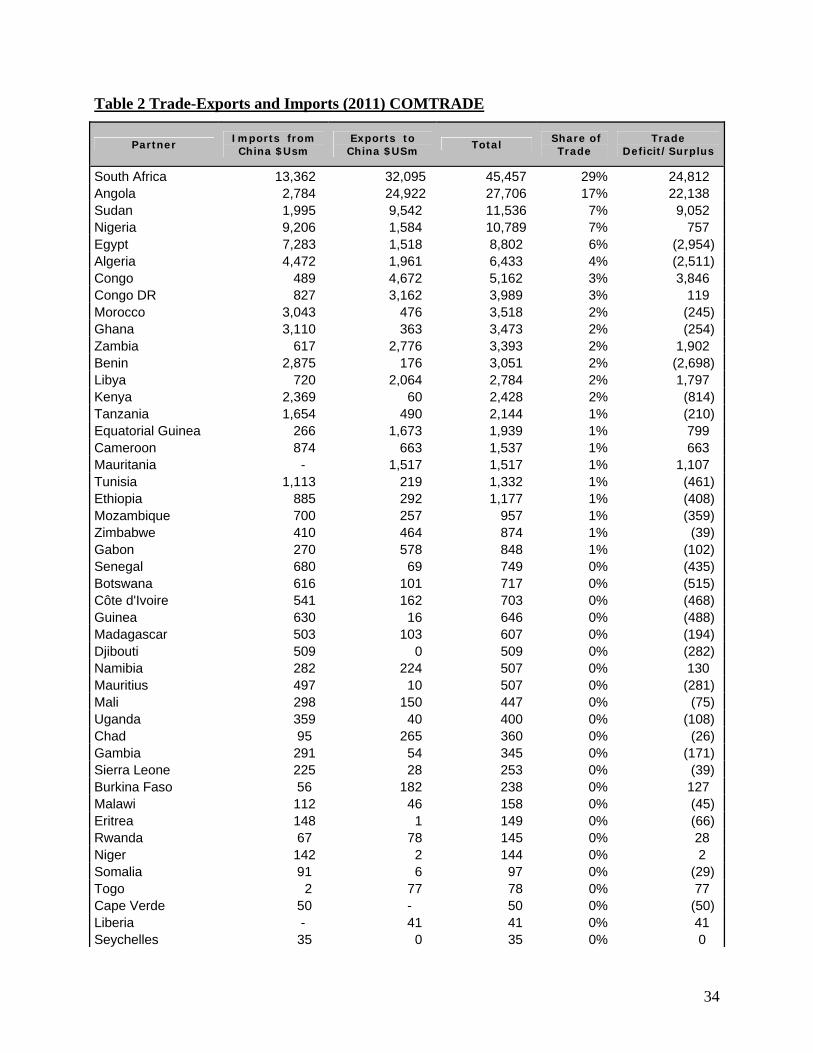
Table 2 Trade-Exports and Imports (2011) COMTRADE
Partner Imports from China $Usm
Exports to China $USm
Total Share of
Trade Trade
Deficit/Surplus
South Africa 13,362 32,095 45,457 29% 24,812 Angola 2,784 24,922 27,706 17% 22,138 Sudan 1,995 9,542 11,536 7% 9,052 Nigeria 9,206 1,584 10,789 7% 757 Egypt 7,283 1,518 8,802 6% (2,954) Algeria 4,472 1,961 6,433 4% (2,511) Congo 489 4,672 5,162 3% 3,846 Congo DR 827 3,162 3,989 3% 119 Morocco 3,043 476 3,518 2% (245) Ghana 3,110 363 3,473 2% (254) Zambia 617 2,776 3,393 2% 1,902 Benin 2,875 176 3,051 2% (2,698) Libya 720 2,064 2,784 2% 1,797 Kenya 2,369 60 2,428 2% (814) Tanzania 1,654 490 2,144 1% (210) Equatorial Guinea 266 1,673 1,939 1% 799 Cameroon 874 663 1,537 1% 663 Mauritania - 1,517 1,517 1% 1,107 Tunisia 1,113 219 1,332 1% (461) Ethiopia 885 292 1,177 1% (408) Mozambique 700 257 957 1% (359) Zimbabwe 410 464 874 1% (39) Gabon 270 578 848 1% (102) Senegal 680 69 749 0% (435) Botswana 616 101 717 0% (515) Côte d'Ivoire 541 162 703 0% (468) Guinea 630 16 646 0% (488) Madagascar 503 103 607 0% (194) Djibouti 509 0 509 0% (282) Namibia 282 224 507 0% 130 Mauritius 497 10 507 0% (281) Mali 298 150 447 0% (75) Uganda 359 40 400 0% (108) Chad 95 265 360 0% (26) Gambia 291 54 345 0% (171) Sierra Leone 225 28 253 0% (39) Burkina Faso 56 182 238 0% 127 Malawi 112 46 158 0% (45) Eritrea 148 1 149 0% (66) Rwanda 67 78 145 0% 28 Niger 142 2 144 0% 2 Somalia 91 6 97 0% (29) Togo 2 77 78 0% 77 Cape Verde 50 - 50 0% (50) Liberia - 41 41 0% 41 Seychelles 35 0 35 0% 0
34
Swaziland 31 0 31 0% 0 Central African Rep. - 28 28 0% 13 Guinea-Bissau 15 4 19 0% 4 Burundi 14 14 0% 14 Lesotho 7 7 0% Western Sahara 0 0 0% 52,236 61,138 158,832 28,288 Source: Comtrade (2011)
Table 3. UNCTAD 2010 Inward Stock and MOFCOM STOCK 2010
Total Global Stock China Stock Share of Total
Africa 2010 MOFCOM 2010 FDI Stock
South Africa 132396 4152.98 3.14% Egypt 73095 336.72 0.25% Nigeria 60327 1210.85 0.91% Morocco 42023 55.85 0.04% Tunisia 31367 2.53 0.00% Angola 25028 351.77 0.27% Sudan 20743 613.36 0.46% Algeria 19498 973.26 0.74% Libyan Arab Jamahiriya 19342 32.19 0.02% Congo 15983 135.88 0.10% Ghana 9098 202 0.15% Zambia 8515 943.73 0.71% United Republic of Tanzania 7966 307.51 0.23% Equatorial Guinea 7374 86.25 0.07% Côte d’ Ivoire 6641 32.99 0.02% Uganda 5853 113.68 0.09% Mozambique 5489 75.24 0.06% Namibia 5290 47.11 0.04% Liberia 4888 81.67 0.06% Cameroon 4828 59.61 0.05% Madagascar 4452 229.87 0.17% Chad 4168 80 0.06% Ethiopia 4102 368.06 0.28% Congo, Democratic Republic of 3994 630.92 0.48% Mauritius 2319 283.29 0.21% Niger 2310 379.36 0.29%
35
Kenya 2262 221.58 0.17% Mauritania 2155 45.88 0.03% Seychelles 2017 19.36 0.01% Guinea 1917 136.41 0.10% Zimbabwe 1754 134.54 0.10% Senegal 1615 45.03 0.03% Gabon 1438 125.34 0.09% Botswana 1299 8.88 0.01% Mali 1234 47.77 0.04% Cape Verde 1140 4.58 0.00% Lesotho 1129 8.88 0.01% Malawi 961 32.4 0.02% Togo 955 58.11 0.04% Burkina Faso 905 0 0.00% Swaziland 902 0 0.00% Djibouti 878 12.47 0.01% Benin 849 39.33 0.03% Gambia 675 1.19 0.00% Somalia 566 0 0.00% Sierra Leone 495 41.48 0.03% Eritrea 438 12.54 0.01% Rwanda 435 41.63 0.03% Central African Republic 369 46.54 0.04% Guinea-Bissau 190 27 0.02% São Tomé and Principe 163 0.031 0.00% Burundi 86 6.51 0.00%
Comoros 58 0 0.00% 553,974.00
36
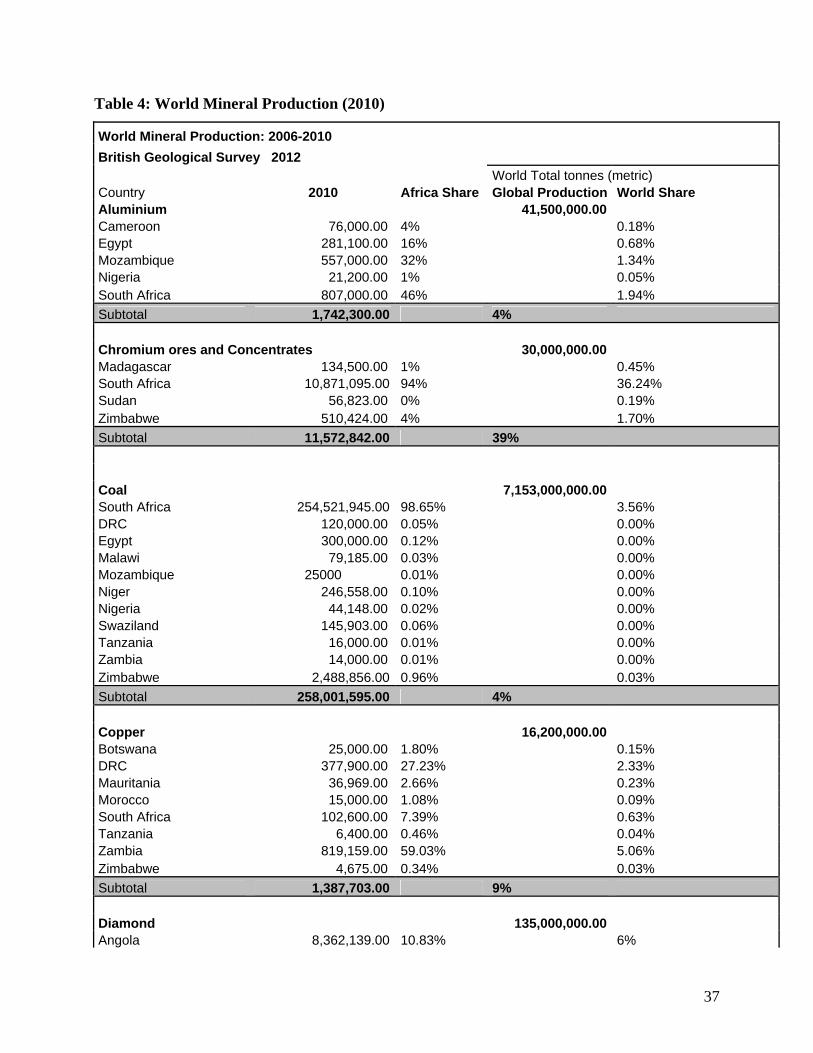
Table 4: World Mineral Production (2010)
World Mineral Production: 2006-2010 British Geological Survey 2012 World Total tonnes (metric) Country 2010 Africa Share Global Production World Share Aluminium 41,500,000.00 Cameroon 76,000.00 4% 0.18% Egypt 281,100.00 16% 0.68% Mozambique 557,000.00 32% 1.34% Nigeria 21,200.00 1% 0.05% South Africa 807,000.00 46% 1.94% Subtotal 1,742,300.00 4% Chromium ores and Concentrates 30,000,000.00 Madagascar 134,500.00 1% 0.45% South Africa 10,871,095.00 94% 36.24% Sudan 56,823.00 0% 0.19% Zimbabwe 510,424.00 4% 1.70% Subtotal 11,572,842.00 39% Coal 7,153,000,000.00 South Africa 254,521,945.00 98.65% 3.56% DRC 120,000.00 0.05% 0.00% Egypt 300,000.00 0.12% 0.00% Malawi 79,185.00 0.03% 0.00% Mozambique 25000 0.01% 0.00% Niger 246,558.00 0.10% 0.00% Nigeria 44,148.00 0.02% 0.00% Swaziland 145,903.00 0.06% 0.00% Tanzania 16,000.00 0.01% 0.00% Zambia 14,000.00 0.01% 0.00% Zimbabwe 2,488,856.00 0.96% 0.03% Subtotal 258,001,595.00 4% Copper 16,200,000.00 Botswana 25,000.00 1.80% 0.15% DRC 377,900.00 27.23% 2.33% Mauritania 36,969.00 2.66% 0.23% Morocco 15,000.00 1.08% 0.09% South Africa 102,600.00 7.39% 0.63% Tanzania 6,400.00 0.46% 0.04% Zambia 819,159.00 59.03% 5.06% Zimbabwe 4,675.00 0.34% 0.03% Subtotal 1,387,703.00 9% Diamond 135,000,000.00 Angola 8,362,139.00 10.83% 6%
37
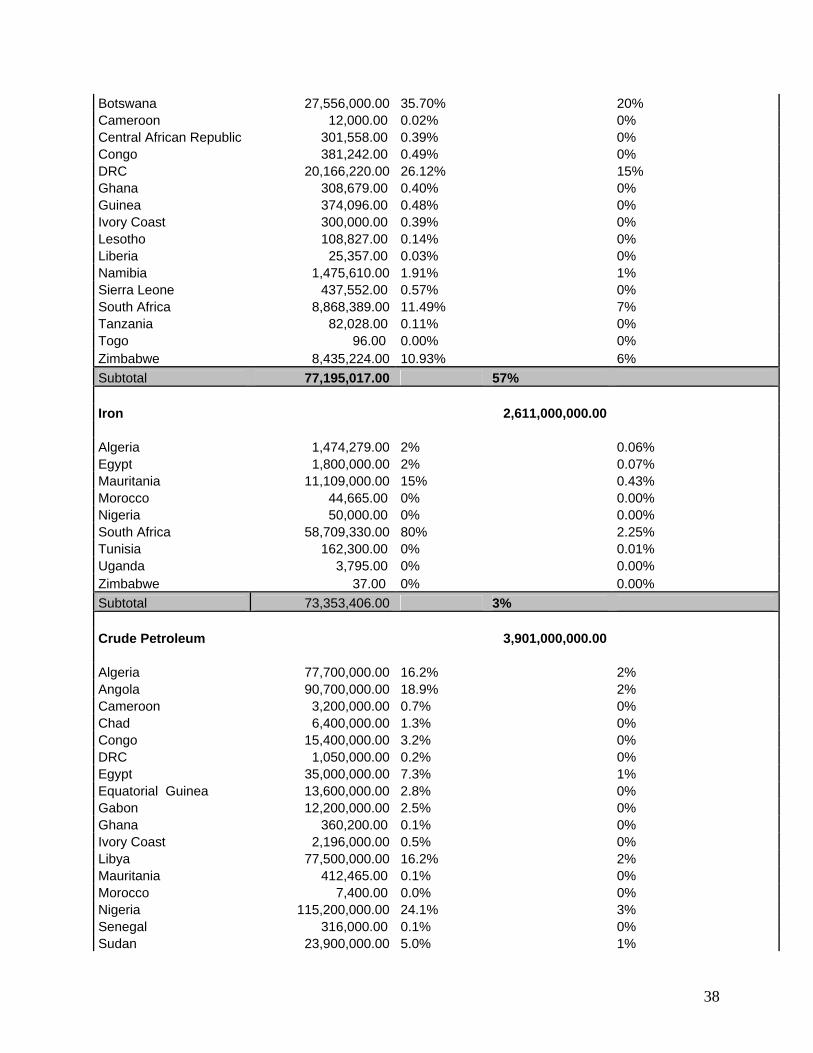
Botswana 27,556,000.00 35.70% 20% Cameroon 12,000.00 0.02% 0% Central African Republic 301,558.00 0.39% 0% Congo 381,242.00 0.49% 0% DRC 20,166,220.00 26.12% 15% Ghana 308,679.00 0.40% 0% Guinea 374,096.00 0.48% 0% Ivory Coast 300,000.00 0.39% 0% Lesotho 108,827.00 0.14% 0% Liberia 25,357.00 0.03% 0% Namibia 1,475,610.00 1.91% 1% Sierra Leone 437,552.00 0.57% 0% South Africa 8,868,389.00 11.49% 7% Tanzania 82,028.00 0.11% 0% Togo 96.00 0.00% 0% Zimbabwe 8,435,224.00 10.93% 6% Subtotal 77,195,017.00 57% Iron 2,611,000,000.00 Algeria 1,474,279.00 2% 0.06% Egypt 1,800,000.00 2% 0.07% Mauritania 11,109,000.00 15% 0.43% Morocco 44,665.00 0% 0.00% Nigeria 50,000.00 0% 0.00% South Africa 58,709,330.00 80% 2.25% Tunisia 162,300.00 0% 0.01% Uganda 3,795.00 0% 0.00% Zimbabwe 37.00 0% 0.00% Subtotal 73,353,406.00 3% Crude Petroleum 3,901,000,000.00 Algeria 77,700,000.00 16.2% 2% Angola 90,700,000.00 18.9% 2% Cameroon 3,200,000.00 0.7% 0% Chad 6,400,000.00 1.3% 0% Congo 15,400,000.00 3.2% 0% DRC 1,050,000.00 0.2% 0% Egypt 35,000,000.00 7.3% 1% Equatorial Guinea 13,600,000.00 2.8% 0% Gabon 12,200,000.00 2.5% 0% Ghana 360,200.00 0.1% 0% Ivory Coast 2,196,000.00 0.5% 0% Libya 77,500,000.00 16.2% 2% Mauritania 412,465.00 0.1% 0% Morocco 7,400.00 0.0% 0% Nigeria 115,200,000.00 24.1% 3% Senegal 316,000.00 0.1% 0% Sudan 23,900,000.00 5.0% 1%
38
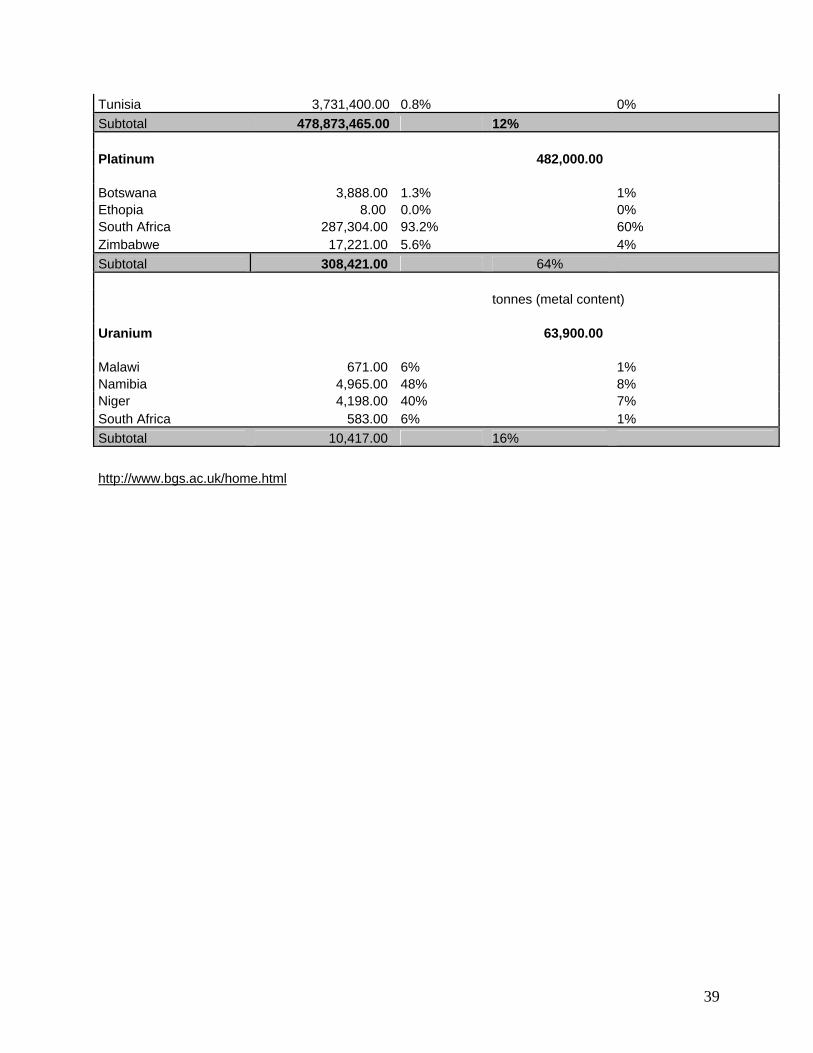
Tunisia 3,731,400.00 0.8% 0% Subtotal 478,873,465.00 12% Platinum 482,000.00 Botswana 3,888.00 1.3% 1% Ethopia 8.00 0.0% 0% South Africa 287,304.00 93.2% 60% Zimbabwe 17,221.00 5.6% 4% Subtotal 308,421.00 64% tonnes (metal content) Uranium 63,900.00 Malawi 671.00 6% 1% Namibia 4,965.00 48% 8% Niger 4,198.00 40% 7% South Africa 583.00 6% 1% Subtotal 10,417.00 16% http://www.bgs.ac.uk/home.html
39