Embed Size (px)
Citation preview

Lloyd Electric & Engineering LimitedInvestor Presentation

Safe Harbour
This presentation has been prepared by Lloyd Electric & Engineering Ltd (the “Company”) and is being furnished to you, the recipient, solely for your information and may
not be reproduced, delivered or transmitted (in whole or in part), directly or indirectly, by any means to any person in any manner. No independent verification has been
made of any information provided in thee document.
Certain statements in this presentation may not be based on historical financial information or facts and are or may be “ forward‐looking statements”. These statements
are based on current expectations and assumptions and are based on currently available information Actual result are subjected to a number of risk andare based on current expectations and assumptions and are based on currently available information. Actual result are subjected to a number of risk and
uncertainties, which could cause the company’s actual performance to differ materially from those anticipated, including future changes or developments in the
company’s business, its competitive environment and political , economic, legal and social conditions. Any reference to past performance should not be taken as an
indication of future performance , Due to the risk, Uncertainties and assumptions inherent in forward‐looking statements, prospective investors in the company’s
securities should not place undue reliance on these forward‐looking statements. The information contained in this presentation is only current as of its date. the
Company may alter, modify or otherwise change in any manner the content of this presentation, and the Company does not intend or assume any obligation to update
any of these statements.
This presentation is for general information purpose only, without regard to any specific objective, financial situations or informal needs of ay particular person. This
presentation does not constitute an offer or invitation to purchase or subscribe for any securities of the company by any person in any jurisdiction, No part of thisp p y p y y y p y j , p
presentation should form the basis of or be relied upon in connection with any investment decision or any contract or commitment to purchase or subscribe for any
securities.
By attending this presentation, you acknowledge that you will be solely responsible for your own assessment of the market and the market position of the Company and
h ill d l i d b l l ibl f f i i f i l f f f h b i f h Cthat you will conduct your own analysis and be solely responsible for forming your own view of potential future performance of the business of the Company.
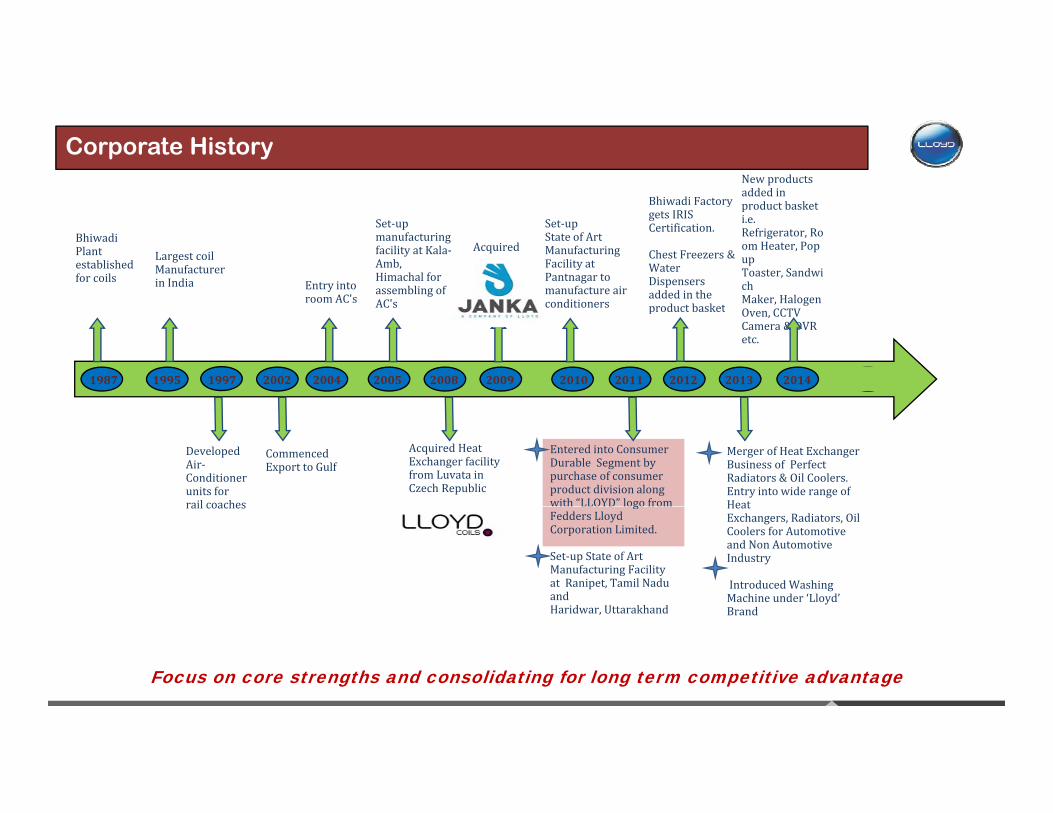
Bhiwadi Factory
New products added in product basket
Corporate History
Bhiwadi Plant established for coils
Largest coilManufacturerin India Entry into
room AC's
Set‐up manufacturing facility at Kala‐Amb,Himachal for assembling of AC's
Acquired
Set‐upState of ArtManufacturingFacility at Pantnagar to manufacture air conditioners
ygets IRIS Certification.
Chest Freezers & Water Dispensers added in the product basket
product basket i.e. Refrigerator, Room Heater, Pop up Toaster, Sandwich Maker, Halogen AC s conditioners product basket Oven, CCTV Camera & DVR etc.
1987 1995 1997 2002 2004 2005 2008 2009 2010 2011 2012 2013 2014
DevelopedAir‐Conditionerunits for rail coaches
Commenced Export to Gulf
Acquired HeatExchanger facility from Luvata in Czech Republic
Entered into Consumer Durable Segment by purchase of consumer product division along with “LLOYD” logo from
Merger of Heat Exchanger Business of Perfect Radiators & Oil Coolers. Entry into wide range of Heatrail coaches g
Fedders Lloyd Corporation Limited.
Set‐up State of Art Manufacturing Facility at Ranipet, Tamil Nadu and H id Utt kh d
Heat Exchangers, Radiators, Oil Coolers for Automotive and Non Automotive Industry
Introduced Washing Machine under ‘Lloyd’
Haridwar, Uttarakhand Brand
Focus on core strengths and consolidating for long term competitive advantage

Sh h ldi P tt M h 2015Sh h ldi P tt M h 2015 E it Sh (N f h )E it Sh (N f h )
Capital Market Information
Shareholding Pattern as on March 2015Shareholding Pattern as on March 2015 Equity Shares (No. of shares)Equity Shares (No. of shares)
Equity Shares O/s 3,53,20,260
Free Float (50.02%) 1,76,81,322
FII / Mutual Funds 8.47% Free Float (50.02%) 1,76,81,322
Market Capitalization as on 7th April’15 INR 850 crores
Body Corporates
9.65%
Dividend Track Record ‐ Consistent Pay‐out
Key Institutional InvestorsKey Institutional Investors
Retail & Orange Mauritius Investment Limited
for last 5 years
Promoters 49.98%
Others, 31.90%
E M Surgent Fund
Emergency India Focus Fund
India Insight Value Fund
Deutsche Trustee Service A/c. Mid Cap Fund/ p
India Opportunity Growth Fund
Bajaj Allianz life Insurance Co.
Orange Mauritius Investment is the single largest public shareholder of the Company holding 6.51% as on March’15

B2B SEGMENT
Overview
India’s largest manufacturer of Heat Exchanger / Evaporator Coils and air‐conditioners serving the entire spectrum of HVAC and Refrigeration Industry
Contract Manufacturing of Air Conditioners as OEM & ODM for Prestigious Indian & Foreign BrandsContract Manufacturing of Air‐Conditioners as OEM & ODM for Prestigious Indian & Foreign Brands
Supplier of Customized packaged AC solutions to Indian Railways including Metro Rail
First Indian Company to be awarded IRIS (International Railway Industry Standard) Certification Eligible forFirst Indian Company to be awarded IRIS (International Railway Industry Standard) Certification. Eligible for Global Bidding in Railway/ Metro Business in HVAC & R Industry. Bagged Order from Bombardier
Provides end‐to‐end solution in HVAC&R industry‐ complete integration in the HVAC&R industry, rightfrom manufacturing the physical components, air‐conditioners to selling to OEM’s and to the endfrom manufacturing the physical components, air conditioners to selling to OEM s and to the endcustomers, so an end‐to‐end solution in the HVAC&R industry
Segment wise share of Revenue
55%45% B2B
B2C

B2C SEGMENT
LEEL Ventured into Consumer Durable Segment in 2011, by acquiring distribution network and Lloyd Logo from Associate Company, Fedders Lloyd Corporation Ltd
I iti ll i t d d i diti d Ll d B d d d ll i d th d t tf liInitially introduced room air‐conditioners under Lloyd Brand and gradually increased the product portfolio by adding products like LED TV’s, Washing Machines, Refrigerators, Chest Freezers and other small appliances
Pan India Presence Strong Dealer Network of 7000+ Strong Dealer Network of 7000+ 30 Sales Branches 307 authorized service centers and 81 Company owned service centers
Awarded as an Indian Power Brand, Power Brand, Asia’s most promising brand and also an Admired Brand

K P d t B2B S tK P d t B2B S t K M k t B2B S tK M k t B2B S t
Product Profile
Air Conditioners (Window, split, Roof Mounted)
Key Products- B2B SegmentKey Products- B2B Segment Key Markets- B2B SegmentKey Markets- B2B Segment
OEM’s, Railways, Metro Rail
Heat Exchanger Air Conditioning, Industrial, Auto, refrigeration, Data Centreg g, , , g ,
Key Products- B2C Segment Retail Customer-B2C Segment

Financial Highlights Product-wise & Segment wise- Standalone Basis
Sales for Nine Months ended Dec’14 EBITDA for Nine months ended Dec’14 segment‐wise
Railways2% OEM &
Railways22%
Heat Exchangers & Components
33%0%
Retail AC27%
Heat Exchangers & Components
32%
Consumer
LED16%
OEM‐AC19%
Durable45%
WM & Others4%

Fully Integrated across HVAC value Chain•Presence across value chain(from coils to brand ) –better control on cost , low volatility of•Presence across value chain(from coils to brand ) –better control on cost , low volatility of
Key Competitive Advantage
Presence across value chain(from coils to brand ) better control on cost , low volatility of margins.•Hedge against cost/demand volatility in individual value chain elements
Presence across value chain(from coils to brand ) better control on cost , low volatility of margins.•Hedge against cost/demand volatility in individual value chain elements
•Over fifty years of experience in HVAC BusinessAdh hi h d d f li f ll d b l b l l d l i•Over fifty years of experience in HVAC BusinessAdh hi h d d f li f ll d b l b l l d l i•Adherence to highest standards of quality followed by global players due to log term contracting relationships.•Technologically at par with the best in the business.
•Adherence to highest standards of quality followed by global players due to log term contracting relationships.•Technologically at par with the best in the business.
• Kala‐Amb and Pantnagar Plants enjoy tax holidays upto FY 2020• Kala‐Amb and Pantnagar Plants enjoy tax holidays upto FY 2020
•Pioneer in PFC coils in India – high efficiency , low weight and low cost•Pioneer in PFC coils in India – high efficiency , low weight and low cost•Capability to develop Heat exchanging applications for nuclear power plants with acquisition of Janka Engineering•Capability to develop Heat exchanging applications for nuclear power plants with acquisition of Janka Engineering
•Qualified categories first supplier of Indian railway – 80% of the tenders awarded to category first players.•Qualified categories first supplier of Indian railway – 80% of the tenders awarded to category first players.•IRIS qualified – will be able to bid for railway and metro projects internationally , first HVAC players in India with IRIS.•Strong consumer brand build by effective marketing campaign and history of selling consumer products
•IRIS qualified – will be able to bid for railway and metro projects internationally , first HVAC players in India with IRIS.•Strong consumer brand build by effective marketing campaign and history of selling consumer products

Global Presence with State of Art Manufacturing facility with cutting edge technology
P d ti it
0.60 Million
Production capacity Product‐wise (no. in units)
Air-Conditioners
SIX DOMESTIC FACILITIES Heat Exchangers/ Evaporator Coils
1.5 Million
0.20 MillionRailways Locomotive
Bhiwadi Unit, Rajastha
nTauru, Haryana
Pantnagar, Uttarakhand
Kala-ambUnit, Himachal
Pradesh
Ranipet, Tamil Nadu
Haridwar, Uttarakhand
Two Overseas Manufacturing Facilities(Owned by 100% subsidiaries)
Area: 54000 m2
Prague, Czech Republic
Area: 54000 m

International Presence- Janka Engineering s.r.o.Fully Integrated across HVAC value Chain
B d d C P d t Coils & Heat Exchangers
Consumed in AC manufacturing
Branded as Lloyd products
Coils & Heat Exchangers AC Manufacturing Branded Consumer Product Sales & Marketing
Sale Sale Sale
Air‐conditioning &
refrigeration product
manufacturers
Other
OEMsRetail consumers
Better control on cost Reduced volatility in margins Hedge against demand volatility

International Presence- Lloyd Coils Europe s.r.o.
Acquired from Luvata Group in May 2008, 100% subsidiary
European Manufacturer of high quality Coils serving HVAC & R industry
M f i l l d i P C h R bli
Customers and Product Portfolio
Manufacturing plant located in Prague, Czech Republic
Market Coverage across entire European Region
‐ Key markets – France, Germany, Spain, Slovakia, UK, Russia & CIS
Technology transfer to Indian operations to cater to international
clients
Key Financials
37.00 34.1
EBIDTA RevenueEuro in Million
CORPORATE HISTORY 3.36 3.91
2013 2014

International Presence- Janka Engineering s.r.o.
Acquired from Lennox, USA in 2009, 100% subsidiary of LEEL
More than 100 years old Market leading manufacturers and supplier of
comfort, industrial ventilation , air‐conditioning and cooling system Key Financials Manufacturing plant located in Prague, Czech Republic
Key Highlights:
• Supplier of cooling units to Nuclear power plants in slovakia
• Developed HVAC units for Skoda transportation for Czech Republic
1012
EBIDTA Sales Euro in Million
Operating Segments
Developed HVAC units for Skoda transportation for Czech Republic
• Tram Air‐conditioning for Prague
‐1.03
0.37
2013 2014
LLOYD COILS EUROPE S.R.O.Operating Segments

Consumer Durable Industry Scenario
2020 (estimated)
One of the fastest growing electronics market in the world
2012
(estimated)
By 2020, the electronics market in India is expected to increase to USD 400 billion*
Electronics Demand (USD billion)*billion
By 2025, India will be the 5th largest consumer durables market in the world (currently 12th)*
20148
2,019 (estimated)
16
*Source: “Consumer Durables Market in India” by IBEF, March 2014; **Source: Display Search, 2014
Display Panels (unit sales in millions)**

Lloyd’s share of Air-conditioners has doubled over last 5 years
Parts 0%
Revenue FY 10Heat
Exchanger & Components
17%
Other Consumer Products
4%
Revenue FY 14
Heat Exchangers & sheet Metal47%
Parts thereof22%
0% 17%LED's14%
Room/
Rail & Room AC's
Rail AC's31%
(OEM & Brand)65%
Rising focus on end products by leveraging product capabilities
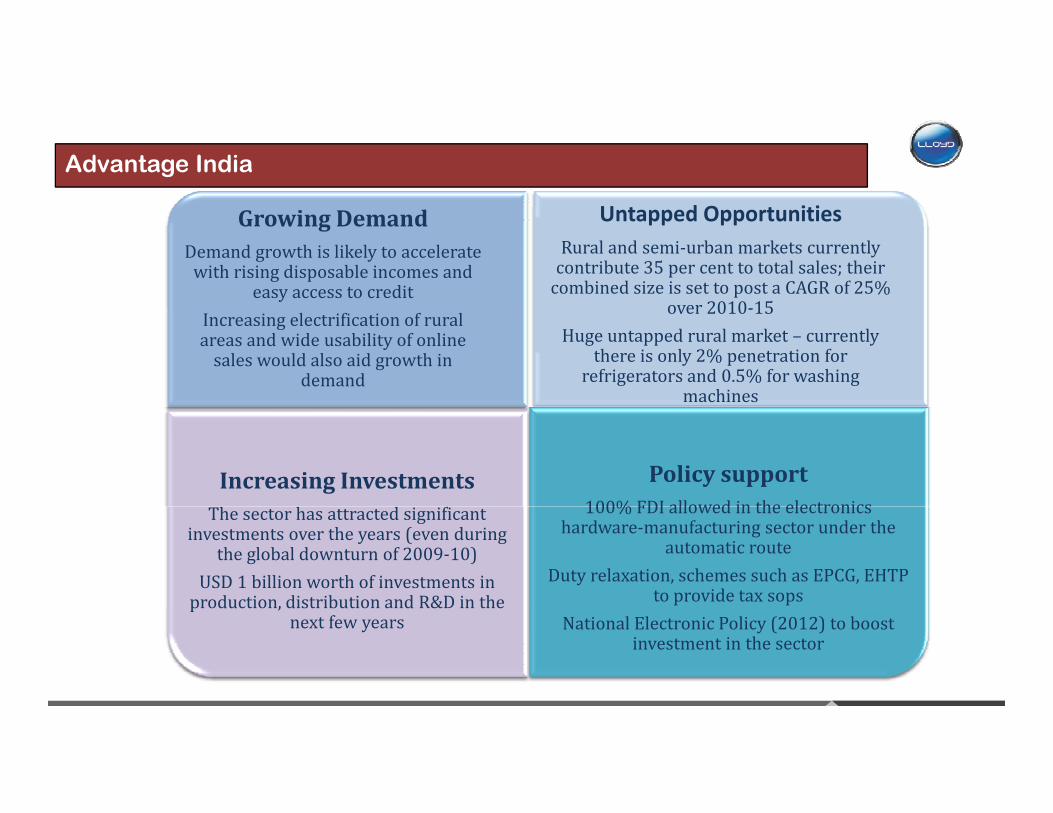
U t d O t iti
Advantage India
Growing DemandDemand growth is likely to accelerate with rising disposable incomes and
easy access to credit
Untapped OpportunitiesRural and semi‐urban markets currently contribute 35 per cent to total sales; their combined size is set to post a CAGR of 25%
over 2010 15Increasing electrification of rural areas and wide usability of online sales would also aid growth in
demand
over 2010‐15Huge untapped rural market – currently
there is only 2% penetration for refrigerators and 0.5% for washing
machines
Increasing Investments Policy support100% FDI allowed in the electronicsThe sector has attracted significant
investments over the years (even during the global downturn of 2009‐10)
USD 1 billion worth of investments in production, distribution and R&D in the
100% FDI allowed in the electronics hardware‐manufacturing sector under the
automatic routeDuty relaxation, schemes such as EPCG, EHTP
to provide tax sopsproduction, distribution and R&D in the next few years National Electronic Policy (2012) to boost
investment in the sector

SWOT Analysis
Strength Weakness Opportunities ThreatsStrength
Brand is getting more visible amongst its
WeaknessNo aspiration or
likability for the Brand. Still driven by Push
Opportunities
Penetration level of consumer durables is still low in India & the
Threats
Sudden drop in pricing strategy of leading
b d ld d thg
audience & is now well established( specially in
AC category)
yFactors
Infrastructure for manufacturing unit is still not adequate for
growth in market will be very large
considering our country’s demographic
The entry cost for new
brands could erode the consumer base
Large Chinese Co.s
Robust Dealer Network Pan India
Service Infrastructure in all parts of India
still not adequate for the volume growth
Many mediums like Online/Outdoor are yet
t b l it d
brands is very high. So competition from newer entrants is
limited in coming years & also proves to be a
time consuming
with deep pockets & manufacturing bases could also shift market share to theses Co.s , who are at present having insignificant all parts of India
ensuring KKGto be exploited time consuming
processg g
market share
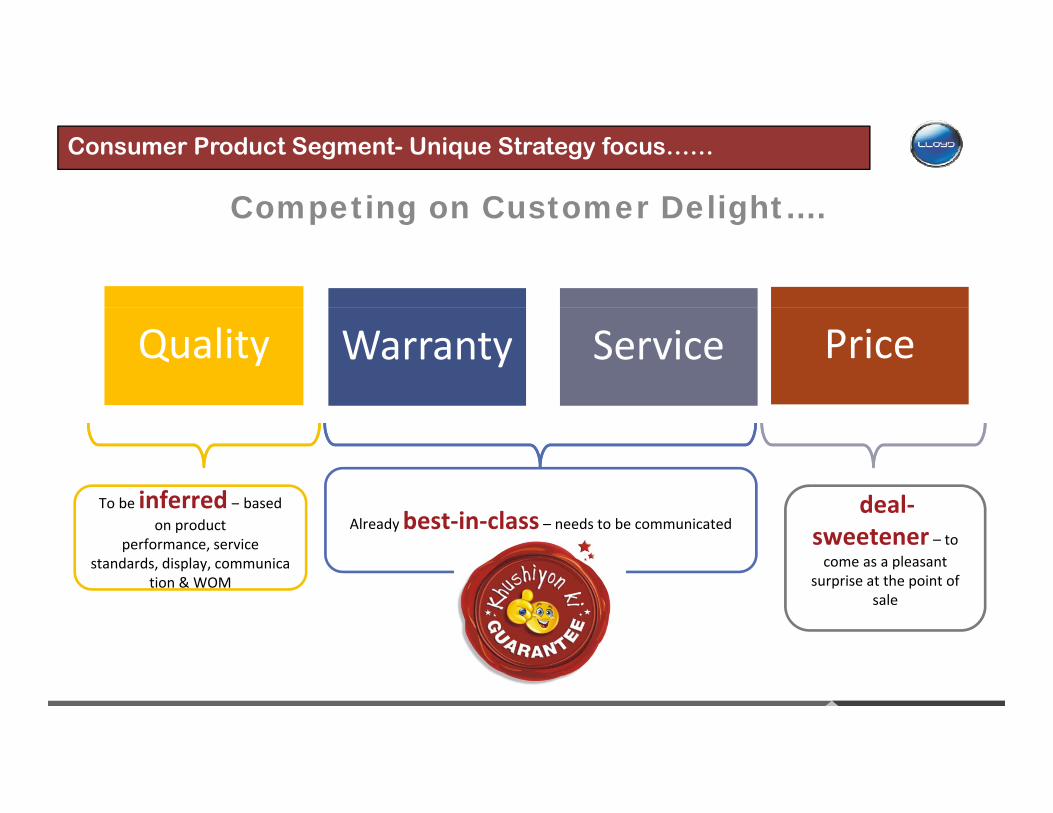
Consumer Product Segment- Unique Strategy focus……
Competing on Customer DelightCompeting on Customer Delight….
Quality Warranty Service Price
To be inferred – based deal‐To be inferred based on product
performance, service standards, display, communica
tion & WOM
Already best‐in‐class – needs to be communicateddeal‐
sweetener – to come as a pleasant
surprise at the point of sale

Our Future Growth Strategy…..
Rank (as per CD + FMCG consumption)
City
1 Mumbai
2 Delhi / NCR
LLOYD’s Strategy is to gain market share in the top 10 cities where consumers are more brand conscious
2 Delhi / NCR
3 Kolkata
4 Chennai
5 Bangalore
• The top 13 metropolitansaccount for about 75% of the sales by
6 Hyderabad
7 Ahmedabad
8 Pune
value
• That is almost half of the entire consumer durables market in India
9 Surat
10 Coimbatore
11 Nagpur
12 Vadodara
• And if we take only LEDs & ACs, this share
will rise to more than 65% 12 Vadodara
13 Ludhiana
Source: Hansa Infosource, June 2013

Our Targeted Approach…..
High Value CustomersHelp elevate brand stature while enhancing profitabilityp g p y
Top – end products across categories
20

Online Selling Strategy….
Online Marketplaces
Developing our own platformwww mylloyd comMarketplaces www.mylloyd.com
Increase profit margin
Reduce dependency on dealers &
other channels
Direct interface with the customer
An interactive website with
a store

Last Four Years Performance Indicator
1400
1600
Standalone Highlights Consolidated Highlights
1800
2000
800
1000
1200
1400
in crores
1000
1200
1400
1600
in crores
0
200
400
600
Amt.
200
400
600
800
Amt.
FY 11 FY 12 FY 13 FY 14
Revenue 782.27 902.07 1169.38 1439.68EBITDA 82.27 93.47 145.89 177.57
0
FY 11 FY 12 FY 13 FY 14
Revenue 1014.87 1196.12 1474.30 1775.97EBITDA 93.45 104.81 155.87 214.30
0
Note: EBITDA includes Other Operating Income

Quarter-wise Revenue Break-up
1200
1400
Standalone Revenue
16001800
Consolidated Revenue
600
800
1000
t. in crores
8001000120014001600
. in crores
0
200
400Amt
0200400600Am
t.
Q1 Q2 Q3 Total
FY 14 374.23 229.91 324.85 928.99FY 15 533.57 304.41 378.67 1216.6
Q1 Q2 Q3 Total
FY 14 448.45 343.07 432.25 1223.77FY 15 639.68 411.39 473.8 1524.87

Key Financials - Standalone
INR i
Particulars (Rs. In crores) Dec’14 2014 2013 2012Total Revenue (Standalone) 1219.15 1452 1175 1050
INR in crores
Total Revenue (Consolidated) 1524.87 1825 1479 1351EBIDTA 126.47 189.58 145.88 106.72EBIDTA (%) 10.37% 13.08% 12.41% 10.06%Interest 67.79 84 02 50 75 32 484.02 50.75 32.4Depreciation 18.77 23.79 22.26 21.29Profit Before Tax 39.91 81.77 72.87 53.02Profit Before Tax (%) 3.27% 5.63% 6.20% 5.86%Profit After Tax 31.59 76.09 56.15 39.33Profit After Tax (%) 2.59% 5.24% 4.78% 4.35%EPS (Standalone) 8.94 21.54 15.89 11.13PAT (Consolidated) 40.57 89 12 52 80 35 12( ) 89.12 52.80 35.12EPS (Consolidated) 11.49 25.23 14.94 9.94

Working Capital
Segment‐wise Revenue Break‐up
18%32%
Consumer Durable OEM & Railways Heat Exchangers & Components
44% 47%
38%21%
44% 47%
FY 14 FY 15 (Nine months Dec'14)

Borrowings- Standalone
Rs. In crores FY 12 FY 13 FY 14 Sep’14
Working Capital Loans 252.97 336.37 456.97 493.23
Term Loans 101.24 94.67 124.63 108.55
Installments Due within One Year 17.76 42.33 36.89 35
T l B i 371 97 473 37 618 49 636 78Total Borrowings 371.97 473.37 618.49 636.78

THANK YOU