Embed Size (px)
Citation preview

AD-A161 853 PERSONALITY TYPE ANALYSIS OF AIR FORCE INSTITUTE OF 1/2TECHNOLOGY SCHOOL OF (U) AIR FORCE INST OF TECH
U RIGHT-PATTERSON AFB OH SCHOOL OF SYST , R A CARTERU ASSIFTED SEP 85 AFIT/GLM/LSM/85S-tt F/G 5/10 NL
EIIEEIIEEEIIEEIIIIIEEEEEEIIEllEEllEEEEEEllEEEEEEEEEEEEEEEEIEEEIIIEEEIIE*lmlullllllluw
.L3.
1111 I c ~ I L22
j!Q,Au
-U 111112.0
MICROCOPY RESOLUTION TEST CHART4 NATIONAL BUREAU OF STANDARDS 163-A
.1
-1
i*
I
- . . .6 *
. . . . . . . . . . .
6'. i* * . . . . . .~
Lfl0
I
PERSONALITY TYPE ANALYSIS OF AIR FORCEINSTITUTE OF TECHNOLOGY SCHOOL OF SYSTEMS
AND LOGISTICS GRADUATE DEGREE 85S CLASSUSING MYERS-BRIGGS TYPE INDICATOR
THESIS
Richard A. CarterCaptain, USAF
AFIT/GU./LSM/85S-1 1
1 j~7AhMETADTIC
--- ON~ STTE LECTEkpproved EmVu~
;i;:Disbu~munuitedNOV12 '19%,
Lii DEPARTMENT OF THE AIR FORCEB -
AIR UNIVERSITY
AIR FORCE INSTITUTE OF TECHNOLOGY
W right- Patterson Air Force Base, Ohio
85 11 12 07

AFIT/GU4/LSM/85 $-/f
PERSONALITY TYPE ANALYSIS OF AIR FORCEINSTITUTE OF TECHNOLOGY SCHOOL OF SYSTEMS
AND LOGISTICS GRADUATE DEGREE 85S CLASSUSING MYERS-BRIGGS TYPE INDICATOR
THESIS
Richard A. CarterCaptain, USAF
1 DTICNOV 1f2 p85.
Approved for public release; distribution unlimited

The contents of the document are technically accurate, andno sensitive items, detrimental ideas, or deleteriousinformation are contained therein. Furthermore, the viewsexpressed in the document are those of the author(s) and donot necessarily reflect the views of the School of Systemsand Logistics, the Air University, the United States AirForce, or the Department of Defense.
iDs
33%' i"--A dI v' ) ,. 0 .

AFIT/GLM/LSM/85S-11
PERSONALITY TYPE ANALYSIS OF AIR FORCE INSTITUTE OF TECHNOLOGY
SCHOOL OF SYSTEMS AND LOGISTICS GRADUATE DEGREE 85S CLASS
USING MYERS-BRIGGS TYPE INDICATOR
- THESIS
Presented to the Faculty of the School of Systems and Logistics
of the Air Force Institute of Technology
Air University
In Partial Fulfillment of the
Requirements for the Degree of
Master of Science in Logistics Management
Richard A. Carter, B.S.
Captain, USAF
September 1985
Approved for public release; distribution unlimited
-S . . -- % . - . . . - . . . . . . ,. - - . .. . . . . . , • . . . - .. . , . . .. '. .. . . - .,

Acknowledgments
17 1 wish to thank my advisor, Mr. Dennis E. Campbell for
his encouragement, support and expertise. His knowledge of
MBTI types and research methodology contributed greatly to
this research effort. But more importantly he gave me the
idea and direction to begin.
I would like to acknowledge my loving wife, Linda. Not
only did she provide moral support and understanding, her
efforts as proofreader and typist turned a manuscript into a
finished, complete thesis.
Finally I would like to thank my son, Michael, for his
patience and understanding while his parents labored on this
project. Now that it is done, his time has come.

Table of Contents
Page
Acknowledgements ........ *............................ ii
List of Tables ..... 0. . .. *...... 0..... . .. .......... v
Abstract .............................................. vi
I. Introduction .... ....... ...... * . ................ . 1
Problem Statement ..................*..*....... 5General Background ... .. ....... .... ........... . 6Research Objectives and Hypotheses ............ 8Limitations and Assumptions ................... 10
II. Literature Review .......................... ....0 . 12
Myers-Briggs Type Indicator ................... 12Reliability .......................*......... 15Validity ....... o.*.**............*....... .. 17Applications of the MBTI ...................... 20Summary ........... .................... 28
III. Methodology .... ................................. 30
Population .... ............ .................. 30Data Collection ............................... 31Analysis Techniques ........................... 34
First Research Objective ................... 34Second Research Objective .................. 37Third Research Objective ................... 38
Summary ........... 6.... ...............0........ 40
IV. Results and Analysis ....... .... .......... ... 41
MBTI Type Distribution Results ............... 41Mean GPA Comparison Results ................... 56Preferred Academic EnvironmentQuestionnaire Results ......................... 61
Statements Concerning Test Taking andStudy Habits -- Statements 1 through 10 ........ 63
Statement 1 .............. *...............* 65Statement 4 .*.... ... .............. ..... 66Statement 5 ........ 6................. 67Statement 8 ....... ..................... 67Section One Summary .................... 68
iii
• . ° - .°,.. . . . . ..-. . . . ...-. . ..,. . ...- ° ".• • • •
"-•
••
• j -•
- •. -" " . ' "

-S. Page
Statements Concerning Better AcademicPerformance -- Statements 11 through 25 .... 72
Statement 15 ........ . . . . . ... 74
Statement 16 ............. ............... 74Statement 19 .. . . . . . . . . . . . . . 75
Statement 21 ............................ 76Statement 22 .. . . . . . . . . . . . . . 77
Section Two Summary ..................... 77Statements Concerning Important Differencesin Learning Styles and InstructionalTechniques -- Statements 26 through 35 ..... 84
Statement 34 ................... .... 86Statement 35 ........... 87Section Three Summary 87
Overall Analysis ............ 91Summary .. ......... . ................... 94
V. Conclusions and Recommendations .................. 95
First Research Objective Conclusions .......... 95* Second Research Objective Conclusions ......... 97
Third Research Objective Conclusions .......... 99Overall Conclusions ........................... 101Recommendations .............................. 102
Appendix A: Preferred Academic EnvironmentQuestionnaire .o .... . .................... 105
Appendix B: CAPT MBTI Type Distributions .............. ...... 109
Appendix C: Preferred Academic EnvironmentQuestionnaire Statements withNo Significant Differences ................ 115
Bibliography ......... .................. ... o ... ..o.... 123
?"VITA .. . . . . . . . . . . . . . . . . . . ~ o . o. . 126
iv
es.

List of Tables
Table Page
I. Male AFIT/LS 85S Graduate Students MBTIType Distribution .......... ... .. ................ 42
II. Female AFIT/LS 85S Graduate Students MBTI' Type Distribution ............ ............ 43
- ~ III. Male AFIT/LS 85S Graduate Students MBTIType Distribution by Type Groupings ............. 45
IV. Female AFIT/LS 85S Graduate Students MBTIType Distribution by Type Groupings ............. 46
V. Combined Type Distribution of AFIT/LS 85SGraduate Students by Type Groupings ............. 47
VI. Combined Type Distribution of AFIT/LS85S Graduate Students ........................... 48
VII. Selection Ratio Comparison of AFIT/LS85S Graduate Students ........................... 50
"' VIII. Selection Ratio Comparison of AFIT/LS 85SGraduate Students by Type Groupings ............. 52
IX. Group Mean GPA Comparison -- One MBTIIndex Only ....................................... 57
X. Group Mean GPA Comparison -- Two MBTI Indices ... 60
XI. Preferred Academic Environment QuestionnaireSection One Statements with SignificantDifferences .................... * ................ 64
* XII. Preferred Academic Environment Questionnaire. "-. Section Two Statements with Significant
Differences ............................. ........ 72
XIII. Preferred Academic Environment QuestionnaireSection Three Statements with SignificantDifferences ..................................... 85
XIV. Preferred Academic Environment QuestionnaireResults ......................................... 92
iii*.

AFIT/GLM/LSM/85S-11.
Abstract
The objective of this research was to identify signif-
icant learning differences in the AFIT School of Systems and
Logistics (AFIT/LS) using the personality type theory devel-
oped by psychologist Jung and identified by the Myers-Briggs
Type Indicator (MBTI).
The data were collected from graduate students of
AFIT/LS through the MBTI and a Preferred Academic Environment
Questionnaire. Results of the MBTI categorized each of the
subjects into personality types. The Preferred Academic
Environment Questionnaire determined student study habits and
test taking preferences; AFIT situations which the student
felt improved academic performance; and AFIT learning
situations which were important to the student. The data
were analyzed according to the distribution of MBTI type, the
effect of MBTI type upon grade point average, and student
preference for instructional technique and learning styles as
they related to MBTI type.
The results of the study showed that the majority of
students in the 85S class were of a MBTI type which had
identifiable characteristics relating to their preferred
methods of perceiving and making judgments. The research
results also indicated that MBTI type had no significant
effect upon grade point average. Finally, the results of
the study showed that MBTI type does relate to learning
styles and instructional technique preferences.
vi
~ A 7
PERSONALITY TYPE ANALYSIS OF AIR FORCE INSTITUTE OF
TECHNOLOGY SCHOOL OF SYSTEMS AND LOGISTICS GRADUATE DEGREE
85S CLASS USING MYERS-BRIGGS TYPE INDICATOR
I. Introduction
By selecting individuals to attend the Air Force
Institute of Technology (AFIT) graduate program, the Air
Force invests considerable time, resources, and money to
provide "carefully selected Air Force officers and civilians
the broad educational background" that will provide them with
the "ability to analyze and solve complex technical and
managerial problems faced by the Air Force and the Department
of Defense" (1:2).
The Air Force sees the need to provide an opportunity
for educational enrichment, while expecting the success of
students given that opportunity, as a means to meet the
future needs of the Air Force. As former Commandant of AFIT,
Major General Stuart E. Sherman, while addressing the issue
of the need for AFIT to rededicate itself to the "mission of
providing quality education programs for the Air Force and
1 the Department of Defense", stated:
A fundamental ingredient to the success ofmost endeavors is educated leadership. Because theAir Force is in the forefront of the use of scienceand high technology to fulfill its part of thenational security mission, we continue to have a
°,1

demand for well educated -- both professionally and
academically -- people.
He went on to add ...
The remainder of this century will be even moredemanding of the Air Force to produce leaders whoseexperience and educational background are attune tosolving the problems encountered in a fast movingaerospace environment. To maintain our narrowingedge in technological superiority requires thecontinuing pursuit of knowledge; to increase it,requires even more efficient pursuit. Our commit-ment to the advancement of technology must be acommitment to education, as the fundamental meansof furthering and applying knowledge (l:vi).
Sherman's statement underscores the importance to both
the Air Force and to the students enrolled in the AFIT
resident graduate programs that every effort be made to
increase their opportunity for success.
An extensive effort goes into the planning, developing
and conducting of the graduate degree program to assure the
success of its students in satisfying the educational
objectives of the program and the Air Force. One of the
methods used to assure the success of AFIT students is the
-selective admissions policy used. Only those officers who
have demonstrated the academic ability and whose performance
records have indicated a high probability for success are
admitted to advanced degree programs. To be academically
* eligible for the programs offered, perspective students must
fulfill the following academic requirements:
1. Posses at least a 2.5 undergraduate cumulative grade
point average on a 4.0 scale for a master's degree program.
2.................... .
* - - - r - - -' *i l - i - - - -i ' r r 'r r r. r"- -
2. Achieve an acceptable score on the Graduate Record
Examination Aptitude Test or the Graduate Management Aptitude
Test.
3. Additional requirements are also specified in Air
Force Manual 50-5 to assure students have the required
academic background for specific programs. A typical
requirement concerns demonstration of past ability to handle
a level of mathematics, such as college algebra (1:10).
After academic evaluation and the candidate is
determined academically qualified, a second selection process
is initiated by Air Force Military Personnel Center (AFMPC).
In a highly competitive process AFMPC career management teams
make initial nominations of students, who are then processed
through another review and final approval selection process.
The purpose of this process is to "select only those
promotable officers best qualified to serve in positions
requiring the education offered by AFIT" (1:14). A recent
evaluation of the AFIT selection process based on percentage
rates of successful completion of degree requirements
indicated, while there were improvements that could be made,
the AFIT selection process resulted in higher graduation
rates than "normally found in a private university" (20:57).
AFIT resident students are required to maintain high
scholastic standards. To be awarded a master degree each
student must attain a cumulative grade point average of at
least 3.0 (on a 4.0 scale) and attain a grade of at least C-
3

or S on all required courses. Grades of less than C- or S
are considered academic deficiencies and must be remedied
before graduation from the program. The burden to achieve
these standards is eased for resident students assigned full-
time. They have "Ino major duties beyond applying themselves
diligently to their studies" (1:15).
The current AFIT School of Systems and Logistics
(AFIT/LS) graduate programs are highly structured; students
in degree programs and majors follow a sequence of
preselected courses with a maximum of nine hours of electives
permitted. With the exception of approved deviations from
the program for students with unique needs, most students
follow an almost identical sequence of courses. Even the
limited number of electives must be selected from a
restricted group of approved electives.
It is logical to assume that differences in academic
performance of students in the resident graduate programs can
be accounted for by inherit differences between the students.
The difficult question is what are the significant differ-
ences that effect their performance? Intellectual ability is
not the only determinant of academic success. It is not an
unusual occurance in an educational environment for an
3 intellectually superior student to not perform to the
- .* expected level of success that their intellectual ability
would indicate possible.
Ivor K. Davies, in his textbook on instructional
4

techniques, offered the following observation on individual
differences:
People are different; that is their strength.There are similarities between people, and thereare important differences. Were it not for thesimilarities, all instruction would have to begiven on an individual basis. Some, of course, isindividualized and tailor made to meet individualneeds, but not very much.
Individual differences, however, must berecognized. It is foolish to ignore them. Sim-ilarily, it is foolish to overemphasize theirimportance. Some differences are notable, othersare not. In the same way, some similarities aresignificant, others are of little concern (7:286).
Problem Statement
Since the Air Force makes a considerable time and
monetary investment in the students attending AFIT and is
concerned with the satisfying the demand for well educated
people to meet the present and future needs of the Air Force
(1:vi), it can be argued that an improvement in the quality
and quanity of knowledge and skills recieved would increase
the ability of graduates to meet those needs. To enhance the
accomplishment of this goal, a better understanding of the
significant learning differences of the students involved
would be beneficial.
If a reliable, valid and practical method exists to
identify significant differences that affect a students
academic performance, a better understanding of those
differences could be used to improve the instructional-
learning process. In more closely matching instruction to
°" 5 I

the learning needs of the students, enhanced instructional
*methods could be encouraged to more successfully meet the
needs of the students, the program objectives, and the Air
Force. It is even possible AFIT's graduation rate could be
improved if the learning needs of the students are more
successfully met.
Psychological personality theory offers the potential of
being a possible tool to improve students opportunity for
academic success if it identifies significant individual
differences that relate to the instructional-learning
process. A problem results due to the proliferation of
definitions of personality, theories on personality, and
personality measuring instruments. There is also a lack of
agreement on the adequacy of the definitions and theories to
explain the complexities of the human personality. This
research study therefore addresses the following specific
question: Is it possible to identify significant learning
differences in the AFIT School of Systems and Logistics using
the theory of personality type developed by Swiss psychol-
ogist Jung and identified by the Myers-Briggs Type Indicator?
General Background
An initial review of the literature resulted in the
selection of the definition of personality a-cording to the
dimensions of personality discussed in the psychological type
theory of Swiss psychologist C. G. Jung and measured by the
iI6

Myers-Briggs Type Indicator (MBTI). The Jungian theory,
operationalized by the MBTI, was chosen for this research
study due to the work done relating it directly to the
instructional-learning process. The theory also stresses the
positive strengths of each type, being non-judgmental on the
superiority of any one type -- only indicating that a
preference of one type may be more appropriate in a given
situation.
According to Jung's theory of psychological types,
differences in personality can be explained and individuals
categorized by their innate preference to methods of per-
ception and judgement. The two possible perception processes
are sensing and intuition. Sensing refers to the preferences
of taking in information by way of the physical senses.
Intuition refers to the preference of looking past the facts
offered by the senses to the meaning, possibilites, and
relationships of the situation. The two possible judgement
processes are thinking and feeling. Thinking refers to the
preference for "logical decision making process aimed at
impersonal findings" (8:8). The feeling process is more
concerned with the "process of appreciation, making
judgements in terms of a system of subjective, personal
values" (8:8).
According to Jung's theory, the two methods of
perception and two methods of judgment are dichotomous
processes. While individuals apply all four mental process
7

in different situations and at different times, they use the
different process with different levels of success. Pre-
ferred processes become more developed and are identified as
the dominant process (14:12).
Jung's theory also identified an additional dimension of
personality -- extroversion and introversion. These two
terms, which were conceived by Jung from their latin
derivations, refer to an individuals orientation (outward or
inward) toward his environment. Individuals who rely on
their dominant process to relate to their environment are
defined as extroverted. An individual who reserves his
dominant process for his "inner world" of concepts and ideas
is said to be introverted (13:57).
Research Objectives and Hypotheses
The following were the objectives of this research
study:
1. To determine if the distribution of type for the AFIT
School of Systems and Logistics class of September 1985 (85S)
provides indications of a unique distribution of MBTI type.
2. To determine if a difference in MBTI personality type
has an affect on academic success as measured by grade point
average.
3. To determine if preferences for instructional
techniques and learning styles, according to students'
perception of effectiveness and importance, can be related to

MBTI personality type.
Research objectives were evaluated with the following
hypotheses. The null (Ho) and alternative (Ha) hypotheses
for the first research objective were:
Ho: Each observed specific type frequency distribution
of the AFIT/LS 85S class was the same as the expected
frequency distribution based on the CAPT data base.
Ha: Each observed frequency distribution and expected
frequency distribution were not equal.
Evaluation of the second research objective required two
sets of hypotheses. The first set was for comparison with
only two type groups:
Ho: The mean GPA of one type group was equal to the
mean GPA of the corresponding type group.
Ha: The GPA means of the two type groups were not
equal.
The second set of hypotheses was for comparison between
more than two type groups.
Ho: The GPA means for all type groupings were equal.
Ha: The GPA means for at least two of the type
groupings were not equal.
For the third research objective the null (Ho) and
alternative (Ha) hypotheses were:
Ho: The rating means of the two MBTI type groups for a
specific Preferred Academic Environment Questionnaire
statement were equal.
9

Ha: The mean rating of the one MBTI type group was
greater (or less) than the mean rating of the corresponding
MBTI type group for a specific Preferred Academic Environment
Questionnaire statement.
Due to the computer coding of the MBTI groups, the
alternative hypotheses switched back and forth from greater
than to less than depending on whether the type group that
was expected to have a stronger agreement was coded as group
one or group two.
Limitations and Assumptions
In attempting to evaluate the difficulties in using a
psychological testing instrument, several limitations need to
be understood. As previously mentioned, there is a lack of
agreement on the adequacy of psychological instruments in
expldining all the complexities of personality. It must be
understood that the MBTI does not explain many factors that
are important for the complete understanding of personality
and academic performance. The value of the MBTI results from
its identification of an individuals preferences for
fundamental mental processes such as perception and judgment.
But it must be understood that there is variability within
each type. Individuals of a type are alike in their
preferences, but it can not be expected that they always
react true-to-type. Differences within the same type also
result due to differences in how an individuals preferred
10
"." , ' " ". . " '-"' '-"," " ' . .",". . -' "-"-'"" . "',-" '.,''- '.", , ,' I,-e vr, e""-,,'.

mental processess are exercised and how willing and/or
capable an individual is in using a non-preferred mental
p process (11:18).
It also must be understood that psychological
personality testing is not an "exact science". No
personality testing instrument is infalliable, and problems
with measurement error and lack of precision cannot be
avoided. Another source of potential error is the
* respondent. Problems in understanding questions or a lack of
* * self-understanding can effect the ability of the MBTI to
identify the respondents type (11:17-18).
The assumption was therefore made that the respondents
answered all questions honestly and accurately. Furthermore,
the researcher assumes the statistical results reported are
correct in that the data entered into the SPSS programs was
* done accurately. It was also assumed the type distribution
data base used for comparison to the sample was unbiased
toward specific areas of academic study.
The assumption was also made that the large number of
statistical calculations made did not increase the
possibility of generating chance significance to the point
the results were questionable.
The assumption was also made that the inability to
perform analyses with the discrimination of the full 16 type
classification did not adversely affect the ability of this
study to achieve the stated research objectives.
'z~t11

II. Literature Review
This chapter presents a discussion of the Myers-Briggs
Type Indicator and a review of the literature on the
reliability, validity, and applications of the Myers-Briggs
Type Indicator in academic environments.
Myers-Briggs Type Indicator
The Myers-Briggs Type Indicator (MBTI) is a self-
administered, self-reporting, forced-choice inventory that
measures the four dichotomous preferences of an individual
based on the theory of Jung. As previously discussed, Jung's
theory of types explains personality based on an individuals
preference for dichotomous mental perception and judgement
processes in respect to the inward or outward orientation of
an individuals dominant mental process. The implication of
these personality differences can be used to explain
predictable consequences of different instructional learning
situations. Myers made the observation that "type makes a
natural and predictable difference in learning styles and in
student response to teaching methods (14:147). The four
indices measured by the MBTI are:
E1 Extraversion or Introversion
SN Sensing or Intuition
TF Thinking or Feeling
JP Judgement or Perception
12

The first three indices relate directly to preferences for
extaversion or introversion, preferred perception and
judgment process as discussed in Jung's theory of type. The
fourth index (JP, Judgement or Perception), while not
directly related to one of Jung's personality character-
istics, was developed by Myers and Briggs based on inferences
made in Jung's works. According to the MBTI manual it is
"designed to reflect whether a person relies primarily upon a
judging process (Thinking or Feeling) or upon a perceptive
process (Sensing or Intuition) in his dealings with the outer
world, that is in the extroverted part of his life" (15:2).
Since the indices are designed to measure dichotomous
preferences, an individual whose scores indicate a stronger
reporting of a preference are classified according to the
stronger indicator. For example, if an individual's score
shows a stronger reporting of a preference for Extroversion
(E) verses Introversion (I), then the individual will be
classified as an E (or Extrovert). It therefore must be
understood that the letter combinations identifying the four
indices, such as El, mean E or I; not a relationship of E to
I (15:2).
The letters indicating preferences identified by the
four indices are then combined to identify an individuals
unique type. The typical table presentation of the resulting
sixteen types is:
13
A
ISTJ ISFJ INFJ INTJ
ISTP ISFP INFP INTP
ESTP ESFP ENFP ENTP
ESTJ ESFJ ENFJ ENTJ
In-depth descriptions of the characteristics of each
type can be found in the work of Isabel Briggs Myers.
The research work of Mary H. McCaulley offers two other
techniques of grouping types. By using only the SN (Sensing
or Intuition) and the TF (Thinking or Feeling) indicies of
the MBTI, four types result. The four types, which correspond
to the four columns of the 16 type matrix, differentiate
groups according to their preference to perception and
judgment. The resulting four types are:
ST SF NF NT
McCaulley's second method of grouping types corresponds
to the four quadrants of the 16 type matrix table, using the
E1 (Extroversion or Introversion) and the SN (Sensing or
Intuition) scores of the MBTI. The resulting four types are:
IS IN
ES EN
This method of type identification is reported to be related
to an individual's motivation for learning. According to
McCaulley's work, the following relationship exists:
IS - Knowledge is important to establish truth.
IN - Knowledge is important for its own sake.
ES - Knowledge is important for practical use.
14

EN - Knowledge is important for innovation (12:734).
Reliability
To be valid, a personality assesment instrument must be
reliable. Both test-retest and split-half reliability
studies have been performed on the MBTI to confirm its
relibility. A review of several studies follow.
A study by Carskadon on the test-retest reliability of
the MBTI indices was performed on 64 male and 70 female
psychology students at Mississippi State University using a
seven week interval. Test-retest correlation coefficients,
significant to the .001 level, were calculated for males and
females seperately. The resulting correlation coefficients
* were:
Male Female
E1 .79 .83
SN .79 .82
TF .56 .73
JP .76 .87
The difference between reliability of sex grouped subjects
for the TF index was determined to be marginally significant
at the .10 level (5:1012).
In a later study by Carskadon on sex differences in
test-retest reliabilites of continuous scores of the MBTI
*(Form G) performed at Mississippi State University, five week
test-retest reliability coefficients were calculated for 24
15".°..
. . . . . . . . . . . 5, , **,

male and 36 female students. Except for the female student
TF (Thinking or Feeling) group correlation (.56), all
correlation coefficients ranged from .77 to .93. In
comparing test-retest correlations between sex differientated
groups, the only statistically significant difference was in
- the TF scale. The correlation coefficient for the male
students on the TF was .91 while the correlation coefficient
for the same scale for the female subjects was .56 ;
completely opposite in direction of the earlier study (4:78).
Using a logical split-half procedure, two seperate
halves of each of the four MBTI indices were developed for
the purpose of determining split-half reliability. As part
of Myers' original research, statistical correlations were
determined between the two halves for several groups.
* Seperate studies were performed (differentiated by sex) for
Jr. High students (gifted and under-achieving), Sr. High
students (non-college prep, college prep, and National Merit
Finalists), and college students. The range and mean of the
correlations for each index were as follows:
INDEX GROUP MEAN RANGE MEAN OF GROUP MEANS
E1 .77 - .87 .819
SN .70 - .87 .814
TF .44 - .86 .757
JP .71 - .94 .829
According to Myers':
These reliabilities appear creditable for aninstrument of this sort, representing in general
16U
• . . . . ,. .. - .. - . . . . - - , , . - . . . , . . . . V -*. ,, .I
the upper range of coefficients found in self-report instruments of similar length. It may benoted that while a wide range of age, intellectualability and socio-economic status is included, theonly coefficients below .75 are for the under-achieving 8th grade and the non-prep 12th grade andthat much of the lowest values for these groups areon TF. The possibility would seem to exist thatthe relative uncertainty on TF may reflect a lesserdevelopment of the judging process, which may proveto be a significant characteristic of such samples(15:20).
Myers went on to add the following observation ....
More probably the low coefficients reflect thefact that the development of judgment (whether Tor F) is one of the slowest and most reluctantachievements in the process of growing up (15:20a).
A review of the test-retest and split-half reliability
studies, even with the conflicting results with the TF index,
demonstrates the acceptable creditablity of the instr:.ifent in
providing reliable results.
Validity
To ensure the MBTI measures the personality traits it
professes to, extensive studies have been performed to test
the general validity and specific construct validity of the
MBTI in a number of applications. A partial review of some
of those studies follow.
In a study of the validity of MBTI type descriptions
performed at Mississippi State University by Carskadon and
Cook, 118 psychology students who were unfamiliar with the
r " 17

MBTI, were asked to rank and rate the accuracy of MBTI type
descriptions. A packet of four randomly ordered one page
type descriptions, adapted from Myers' MBTI M4anual, were
provided to each student eight weeks after being typed using
form G of the MBTI. The packet consisted of:
1. The students actual type description.
2. Type description with the El and JP indices
reversed.
3. Type description with the SN and TF indices
reversed.
4. Type description with all four indices reversed.
In example, if a student was typed as an ISTJ, the four type
description presented would correspond to an ISTJ, ESTP,
INFJ, and an ENFP.
The students were required to rank order the four
descriptions according to their perceived accuracy of each
description and then rate the accuracy of each description on
a four point scale. The four point scale corresponded to a
rating of the description as being very true, mostly true,
partly true, or not very true at all (6:89).
Analysis of the results indicated that 50% of the
subjects ranked their actual type description as the most
accurate, while only 13% ranked the type description with all
indices reversed as the most accurate. In rating the type
descriptions, 64% ranked their actual type descriptions as
either very true or mostly true and only 8% rated their
18

actual description as not very true at all. The results also
indicated that reversing the SN and TF indices had a greater
%' negative effect on an individuals perception of the accuracy
of the type descriptions. Statistical analysis of the
ranking and rating confirmed the significant difference in
perceived accuracy of the type descriptions and, according to
the authors, "thoroughly refuted the idea that type
descriptions other than one's own might be equally appealing
if given to persons taking the MBTI" (6:89,91).
There is an excellent opportunity to evaluate both the
reliability and possible validity of the MBTI because another
instrument, the Gray-Wheelwright Questionaire, attempts to
measure personality type based on Jung's theory. The Gray-
Wheelwright Psychological Type Questionnaire was developed
around the same time as the MBTI, independently and with no
intercommunication. The major difference between the two
instruments is the lack of the JP index on the Gray-
-': Wheelwright Questionnaire. Myers conducted a study to
determine the intercorrelations of the two instruments using
47 male Golden Gate College students. After correction for
attenuation, the correlation coefficients between the two
instruments were calculated as:
EI 1.08
SN .97
TF 1.22 (15:21)
19
-%-,%a"
- .I

According to Myers':
It would therefore appear that the MBTI andGray-Wheelwright (as far as it goes, lacking JP)are reflecting exactly the same things, though withdifferent reliabilities. This degree of agreementseems explicable in only two ways, one reasonableand the other not. The reasonable explanation isthat both tests are reflecting the same basicrealities, that is, the Jungian opposites whichboth were designed to reflect. If not, it must beassumed that not only did the authors of the MBTImiss their objective but so also did the Jungiananalysts Gray and Wheelwright in exactly the sameways, a coincidence which seems unlikely (15:22).
After demonstrating the general validity of the MBTI,
the specific application of the instrument to instruction and
learning must be demonstrated. A review of studies
concerning this relationship are presented in the next
section.
Applications of the MBTI
While it has been argued that typology theories have
been ineffective in explaining all aspects of individual
differences in personalities, a review of the literature
indicates a number of studies using the MBTI have provided
valuable insight into educational related differences of
students.
In a study by McCaulley and others, a total of 3,718
students from eight engineering schools participated in a two
year study to determine MBTI type difference of engineering
students as related to their "gender, ethnic origins, choice
20
.. .. . - . . . . . ,. - . v .,- ', .. .,..." -... -. ._"... ".. . . . . . .. . -.. -

I:of engineering discipline and retention in engineering
school" (10:394). Results of the research showed that the
engineering students in the study showed a different
distribution of type compared to type distribution of college
freshmen as indicated by the Center for Applications of
Psychological Type (CAPT) data base. CAPT, an organization
supporting the use of the Myers-Briggs Type Indicator,
maintains an extensive data base of MBTI scores (10:396).
Comparing the two type distributions, a larger
percentage of engineering students showed a preference
towards Introversion, Thinking, and Judging as measured by
the MBTI. Engineering students, as a group, showed a very
strong preference toward the Thinking (T) and Judging (J)
dimensions, with the four TJ types (ISTJ, INTJ, ESTJ, and
ENTJ) representing 49% of the engineering students typed.
Comparing the type distributions of the eight schools which
participated in the study showed the following range of
percentages of type:
Extroversion 33-65%
Sensing 41-59%
Thinking 68-83%
Judgment 45-69% (10:395)
In an attempt to determine the relationship of type to
retention rate, a follow-up study was also performed on 2045
of the 3,718 students. Statistical analysis demonstrated a
significant relationship between a student preference toward
21
. .
Judging and an increased probability of retention to the
second year as an engineering student (10:396).
Nisbet and others, in a study of 658 "high-risk"
freshmen at Ball State University, attempted to determine if
additional instruments were available to generate data that
would be predictive of college success. Four instruments
including the MBTI were evaluated for their contribution.
High risk students were identified by SAT verbal scores of
lower than 360 and high school graduation ranking in the
lower 25th to 50th percentile. Success was determined by
grade point average and retention for one full academic year
(17:228-229).
Regression analysis was performed to develop a
predictive model of second quarter grade point average and
completion of the third quarter. It was determined that
significant regression coefficients for the prediction of
second quarter grade point average were SAT math scores, high
school graduation percentile ranking, the reality orientation
and examination behavior scores of the Effective Study Test,
and the Judgement/Perception (JP) index of the MBTI (17:233).
Although use of MBTI scores resulted in only a small
(non statistically significnant) increase in the prediction
of third quarter completion, the study favorably reported
that the evaluation of the non-academic measurement tools
included in the research "seems to warrant their usefulness
in identifying potential problem students" and offered the
2 2
potential for developing special programs to "improve the
likelihood of such students achieving academic success"
(17:234).
A six year study by Godleski and others at the Cleveland
State University College of Engineering on the retention rate
of different types also indicated that individuals with
Intuition and Feeling preferences have shown the lowest
retention rates in their program (10:397).
To determine if certain personality types were asso-
ciated with greater success in completing program objectives,
a study by Buhmeyer and Johnson was performed on the
Physician-extender training program at the Medical School of
South Carolina. A Physician's Assistant (PA) is one of the
more familiai examples of a Physician-extender. The study
N considered six different personality measuring instruments,
including the MBTI. A weighted grade point average formula
was developed as a measurement of success of the objectives
of the program. Stepwise regression analysis was performed
to evaluate the independent variables identified by the six
personality measuring instruments (2:507-509).
According to the results of the study, Buhmeyer and
Johnson concluded that 11% of the variation of cumulative
grade point average was accounted for by an individual's
preference towards Feeling and Judgement as measured by the
Myers-Briggs Type Indicator (2:510).
A study by Yokomoto and others at the Indiana
23
University/Purdue University in Indianapolis (IUPUI) was
performed to determine if a correlation existed between
homework scores and exam scores, when the exams were "just
like the homework" or conceptual problems "not just like the
homework," for Sensing and Intuitive types. A stronger
correlation resulted for Sensing types for the "just like the
homework" type exams, while the Intuitive types showed a
higher correlation for the "not just like the homework" exam
type (10:398).
A limited study at the Colorado School of Mines (CSM) by
Sloan and others also indicated the "test designed by
Intuitive professors may inadvertently give an advantage to
Intuitive students" (10:399).
A study by Butler and Roberts at Texas Tech University
attempted to determine if a significant relationship existed
between an individuals reading ability and scores on each of
the four MBTI indicies. The study was limited to proficient
adult readers. The 100 participants in the study were
randomly selected from upper division undergraduate and
graduate students from the College of Education at Texas Tech
University. To determine the reading ability of the
participants the Nelson-Denny Reading Test was administered.
The test measured vocabulary level, reading comprehension,
reading rate, and total reading ability (3:80).
The resulting scores indicated "a significant positive
correlation between Sensing/Intuitive (SN) scores and
24

vocabulary, comprehension and total reading scores" (3:81).
A statistical t-test analysis of each of the seperate MBTI
indices demonstrated a significantly higher score on
vocabulary, comprehension, and total reading for Intuitive
(N) subjects when compared to Sensing (S) subjects (3:81).
In an extension of the MBTI personality types to
preferences in communication styles, based on the contention
that "each of the 16 psychological types has a unique pattern
of primary, secondary, tertiary, and least preferred
communication style" (21:30), a study was performed at the
University of Tulsa by Flavil R. Yeakley Jr to determine the
effect of differences in communication style preferences of
instructors and students. A study of lecture and discussion
classes indicated a statistically significant positive
correlation between strong similarity of communication style
preference and adjusted course grades. Adjusted course
grades were determined by subtracting the students grade
point average from his course grade. In both studies, the
greater the similarity of the communication style preference
of the student and the instructor, the higher the students
course grade in comparison to his cumulative grade point
average. (21:42)
A study performed by Smith, Irey, and McCaulley
attempted to answer the question of "How is a college
student's personality type related to his preferences for
various instructional strategies, his learning traits and his
25
.'.......... ...'."." .. ....... ......... " .................

evaluations of various instructional experiences?" (19:435)
in an analysis of a self-paced programmed learning course on
thermodynamics. The 53 students who participated in the
study, in addition to being type classified by the MBTI,
responded to a 13 question opinionnaire on college teaching
methods. While no statistically significant correlation was
found for any of the 13 questions to students Extraversion/
Introversion (EI) index scores, a statistically correlation
(significant to at least the .05 level) was found between at
least one of the other three MBTI indices and responses to
seven of the questions. The preference toward Intuition (N)
on the SN index was postively correlated to a preference for
self-paced instruction compared to "more traditional methods
of instruction" and students agreement with the statement
that "I do my best work in courses when I can work by
myself". The preference toward Intuition (N) was negatively
correlated to the belief that "self-paced or individualized
-: instruction is very dehumanizing and impersonal" (19:438).
The preference toward Feeling (F) on the TF index was
negatively correlated to responses to three of the statements
on the questionnaire:
* 1. 1 learn best in courses that are highly structured
1 where the instructor sets the goals, methods for learning,
and types of tests.
* * 2. 1 prefer classroom instruction to more individ-
ualized approaches to education.
26

3. I prefer such traditional methods of instructions as
lectures, discussions, seminars, and demonstrations to self-
paced instruction.
A negative correlation was also found for preference toward
Perception (P) on the JP index for the last statement listed
above and the agreement with statement that student preferred
"lecture courses to all other types of instruction" (19:438).
Additional data provided about the students in the study
indicated several additional correlations. For the students
in the study, MBTI preference toward Introversion (I) was
significantly correlated to a higher cumulative grade point
average, and preference toward Thinking (T) was significantly
correlated to a larger credit hour course load (19:439).
Another study at Texas Tech University involving 335
college freshman students determined the significantly
preferred and least preferred instructional media for
learning, according to MBTI personality type. The study by
Roberts determined the forced-rank-order preference of the
following thirteen instructional media methods:
1. lecture2. discussion3. small group work4. audio recordings5. readings (texts, articles)6. programmed instruction7. tutorial8. symbols (maps,charts,diagrams)9. pictures/slides10. motion pictures/TV11. environmental12. field trips/demonstrations/roleplaying13. laboratory
27
m - -• . , . ' . "- o
° ° ,• •..
Analysis of the rankings grouped according to MBTI type
indicated that seven of the eight Intuitive (N) type groups
significantly preferred reading as an instructional medium.
None of th_ eight Sensing (S) type groups significantly
prefered reading and one of the Sensing (S) type groups (the
ESFPs) significantly indicated reading as a least preferred
instructional medium (18:84-86).
Summary
Summaries of findings from a wide variety of studies,
including some with limited sample sizes, have been
presented. Many of the research studies did not utilize the
full breakout of 16 MBTI types but instead performed analyses
with groupings of types. While different applications of the
MBTI meet with different levels of success, the concensus
appears to be that the MBTI is a reliable, valid instrument
and has the potential for measuring significant individual
differences of students in an academic environment. From the
studies cited it may be concluded that the MBTI is a viable
tool in understanding personality differences that effect how
an individual perceives and processes information. The
literature supports the possibility that the AFIT/LS 85S
class may represent an unique distribution of personality
type. The findings cited also support the relationship of
MBTI type to different preferences for learning activities
28
*-< " -" -' , * " , .. -.- - -" - * .'. .. . . -. ." * .. -.-. " - -. • . " -" " . . ." ' .-. , .. " .. -." "'', " , . . ; . ; ' .> " " , . < . , " . " , , .' .- ' . ' " , " , , _ , , ._r -L ' . ' , ' , " ". . .

.42
and instructional methodologies. The studies also support
the contention that the differences identified are
significant differences affecting a students academic
performance.
29
4"... .• - * ** . -•*

III. Methodology
This chapter will discuss the methodology used to
achieve the objectives of this research study.
Population
The population examined in this study included all
resident graduate students in the class graduating September
1985 for the AFIT School of Systems and Logistics. The
following graduate degree programs were included in the AFIT
School of Systems and Logistics (LS) for the 85S class:
1. Graduate Engineering Management Program
2. Graduate Systems Management Program
3. Graduate Logistics Management Program
The following program majors were options under the
Graduate Logistics Management Program:
A. Acquistion Logistics Management
B. Contracting and Acquisition Management
C. International Logistics Management
D. Logistics Management
E. Maintenance Management
F. Transportation Management
The total number of students available for the study was 160.
A total of 132 individuals, approximately 82.5% of the
possible population, participated in the study by completing
30
*tSo
-.-

the .1BTI. Approximately 72.7% of the possible population (96
of the 132) responded to the Preferred Academic Environment
Questionnaire developed for this research study.
Data Collection
Information collected for this study includes scores
from the Myers-Briggs Type Indicator, course grades for the
first three academic quarters, and responses to the Preferred
Academic Environment Questionnaire developed for this study.
Since the MBTI Thinking/Feeling (TF) index distribution is0
effected by gender, the gender of all subjects was also
identified. All personal data collected for this study was
controlled according to the guidelines of the Privacy Act of
1974.
Form G of the MBTI was provided to all subjects during
the fourth academic quarter. Since complete instuctions are
provided on the cover of the MBTI booklet and there is no
time limit for completing the questions, the MBTI was
self-administered as the MBTI manual suggests (15:7). The
answer sheets for the MBTI were hand scored using answer keys
and scoring procedures as prescribed in the MBTI Manual.
After determination of the four type indices according
to the Myers-Briggs Type Indicator, typologies were formed
using four seperate techniques. The first step was to
differentiate the 16 types formed by combining the 4 seperate
indicated preferences that the MBTI measures.
31
V

The second step was to differentiate the combinations of
perception and judgement as measured by the SN and TF indices
(ST,SF,NF,and NT).
The third step was to differentiate according to types
grouped by motivation as suggested by the work of Mary H.
McCaulley (12:734). The resulting four types, formed by the
combination of indicated preferences on the E1 and SN indices
(IS,IN,ES,and EN).
The fourth method of differentiation was the four
determinations of type offered by the seperate MBTI indices:
E1 Extraversion or Introversion
SN Sensing or Intuition
TF Thinking or Feeling
JP Judgement or Perception
For each typology, a frequency of type was then
determined. Additionally, course grades for the first three
quarters were used to determine each subject's mean grade
point average (GPA). Grade point averages were determined
based on the following AFIT grade point scale:
A 4.0 C 2.0
A- 3.7 C- 1.7
B+ 3.3 D 1.0
- B 3.0 F 0.0
B- 2.7 S N/A
C+ 2.3 U N/A
Results from the preferred academic environment
32* ** ,- .,-~ -
, 3 . - . . .2

questionnaire were collected during the fourth academic
quarter. The 35 question survey instrument (found in
Appendix A) was developed based on findings and predictions
of research work on student preferences in i lation to the
four MBTI indices, with emphasis on the results reported in
Psychological (Myers-Briggs) Type Differences In Education by
McCaulley and Natter (13) and People Types And Tiger Stripes
by Lawrence (8). A total of 35 statements were provided.
Respondents were asked to reply to each statement utilizing a
seven-point Likert scale. The following seven-point Likert
scale was provided:
I = Strongly Agree
2 - Moderately Agree
3 = Slightly Agree
4 - Neither Agree Nor Disagree
5 = Slightly Disagree
6 = Moderately Disagree
7 = Strongly Disagree
Statements 1 through 10 requested the respondent indicate
agreement or disagreement with statements concerning study
habits and test taking. Statements 11 through 25 requested
the respondent indicate agreement or disagreement with
statements concerning learning activities or situations that
result in better academic performance for the respondent.
Statements 26 through 35 requested the respondent indicate
agreement or disagreement with statements concerning learning
33
-~~~~Z I . . . . . . . . .. . .

activities or situations that were important to the
respondent.
Analysis Techniques
Subprograms of the Statistical Package for the Social
Sciences (SPSS) were utilized to faciliate the statistical
analysis of this research study. To limit the probability of
a Type I error (rejecting null hypothesis if in fact it is
true) to a maximum of five percent, an alpha level limit of
0.05 was used to determine statistical significance.
First Research Objective: To determine if the
distribution of type for the AFIT School of Systems and
"-" Logistics class of September 1985 provides indications of a
.unique distribution of MBTI type.
*" The following null (Ho) and alternative (Ha) hypothesis
were used for statistical analysis:
Ho: Each observed specific type frequency distribution
of the AFIT/LS 85S class was the same as the expected
frequency based on the CAPT data base.
Ha: Each observed frequency distribution and expected
frequency distribution were not equal.
Calculations were made to determine the frequency
distribution using the four methods pr;.3ously mentioned.
": For comparison purposes, corresponding frequency
distributions were also determined from the Center for
Applications of Psychological Type (CAPT) data base for
34
. . - .. - * : : :

college graduate students.
It was decided to analyze the resulting distribution of
type in this research study in the same manner as the
Selection Ratio Type Tables (SRTT) prepared by CAPT. The
SRTT is a CAPT computer program which compares the 16 types
and type grouping by calculating a Self Selection Ratio
(SSR). The SSR is determined by dividing the observed
frequency of a specific type by the frequency of that type in
an appropriate base population. The SRTT also determines the
statistical significance of the differences observed
(9:40;14:40).
In comparing the distribution of type for the subjects
to the CAPT data base to determine if significantly more or
fewer individuals in any type cell than would be expected,
three calculations were performed. Besides reporting the
number of individuals represented in each type group; the
percentage of the total sample represented in each type
group, the selection ratio (SR), and the statistical
probability that the ratio was statistically different from
the expected were calculated. In example, there were 36
students typed as ISTJs and they represented 27.27% of the
total sample. The selection ratio (SR) was obtained by
calculating the ratio of the proportion of ISTJs in the
sample to the proportion of ISTJs in the data base
population. Dividing the percentage of ISTJs in the sample
(27.27%) by the percentage of ISTJs in the CAPT data base
35

(8.31%) results in a SR value of 3.28. An SR value of 3.28
indicates that there were over three and one quarter times as
many ISTJs in the sample based on the percentage of ISTJs in
the CAPT data base. To calculate the statistical sign-
ificance of the selection ratios, the SPSS nonparametric NPAR
Chi-Square Test was used to test whether a significant
difference existed between the observed number of individuals
in a specific MBTI type classification and the expected
number determined from the CAPT data base. For example, the
CAPT data base was used to determine the expected number of
observations in the ISTJ classification and in the other
combined fifteen classifications. Seperate calculations were
then performed for each of the remaining 15 classifications.
The same procedure was then followed for making calculations
on the other type groupings discussed earlier in this
chapter.
Each calculation was made as if it was the only test of
statistical significance calculation being made. The major
limitation with this methodology is that the large number of
calculations increases the possibility of introducing a Type
• - I error. But in defense of this methodology, McCaulley and
others in the study entitled Application Of The Myers-Brings
Type Indicator To Medicine and Other Health Professions
offered the following observations:
We stress that we realize that this is aprimitive way of describing a complex set ofinteractions, but that it still can be mostinformative if used with due caution. Readers
36at.

should keep in mind that when 44 analysis are doneas if they are independent, when in fact they arenot, one must realize that by chance 2 or 3"significant" findings are expected to occur. Someusers prefer to take seriously only relationshipssignificant at probability levels of one inone-thousand (9:41).
The assumption was made that the type distribution based
on 8649 graduate students in the CAPT data base represented a
good cross section of graduate students and was not baised
towards specific areas of study.
Second Research Objective: To determine if a difference
in MBTI type has an effect on academic success as measured by
grade point average.
To determine if there was a type difference in academic
achievement as measured by cumulative GPA, the SPSS sub-
program T-Test was used to compare the group means for E vs
I, S vs N, T vs F, and J vs P. For the two sets of four type
groupings (IS/ES/IN/EN and ST/SF/NF/NT), the SPSS subprogram
BREAKDOWN was utilized to statistically test whether the
means of the type groupings were significantly different from
each other. This was accomplished by computing the F
statistic in a one-way analysis of variance.
The null (Ho) and alternative (Ha) hypothesis for
comparison with two groups only were:
Ho: The mean GPA of one type group was equal to the mean
GPA of the corresponding type group.
Ha: The GPA means of the two groups were not equal.
The null (Ho) and alternative (Ha) hypothesis for
37
• .. -7A- . *!..* . . * *- ~ ~ -

comparison between more than two type groups were:
Ho: The GPA means for all groupings were equal.
Ha: The GPA means for at least two of the groupings were
not equal.
Comparisons of GPA means for the full sixteen types
(identified by using all four indices of the MBTI) were not
performed due to the expected uneven distribution of type
that would result in extremely small groups in many of the
sixteen types. It was decided to perform the analysis on
grouped types using one or two of the MBTI indicies. Due to
this grouping, statistical calculations were possible, but
there is the possibility that a finding for grouped types may
not hold true for all types within that group (9:41).
Third Research Objective: To determine if preferences
for instructional techniques and learning styles, according
to students' perception of effectiveness and importance, can
be related MBTI personality type.
To determine if there was a significant difference in
mean responses between the two appropriate type groups, the
SPSS subprogram T-Test was used to test the following null
and alternative hypotheses:
Ho: The rating means of the two MBTI type groups for a
specific Preferred Academic Environment Questionnaire
statement were equal.
Ha: The mean rating of the one MBTI type group was
greater (or less) than the mean rating of the corresponding
38
-6:...........A.L...

MBTI type group for a specific Preferred Academic Environment
Questionnaire statement.
Due to the expected uneven distribution of type and the
resulting small groups using the complete seperation of 16
groups, it was decided to perform the analysis of responses
by the specific MBTI index that related to the statement.
The group means of the responses for each of the 35
statements from the Preferred Academic Environment
Questionnaire were obtained using the Frequencies subprogram
of SPSS.
Using the mean rating as the measure of central
tendency, the following criteria was used in interpreting the
mean rating for each group: a mean rating of less than 3.5
represented agreement with the statement; a mean rating
between 3.5 and 4.5 (inclusive) represents neither agreement
nor disagreement with the statement; a mean rating greater
than 4.5 indicated disagreement with the statement.
Since the SPSS T-Test subprogram output only provides
results according to a two-tailed t-test, the following
procedures were followed to convert the results to a
one-tailed probability test. Based on the expected direction
of the difference in mean response for the type group coded
one, the expected positive or negative sign of the t-test
statistic was determined. The two-tailed probability
indicated on the SPSS T-Test output was then divided by two,
giving the appropriate one-tailed probability. The null
39
hypothesis that the response means were equal was rejected if
the resulting one-tailed probability was less than 0.05 and
the sign of the t-test statistic was as expected. If both
conditions were not satisfied, the null hypothesis was not
rejected (15:271).
Summary
This chapter has presented the methodology used in this
research study. It has explained the methods used to collect
data and the analysis techniques used. The next chapter will
discuss the analysis results of the information obtained.
4
p
" 40
IV. Results and Analysis
This chapter presents the results of the analysis of
the data collected through the two survey instruments used,
and the mean GPA comparison of MBTI types performed. The
results are presented in the following order: MBTI type
distribution, mean GPA comparison, and Preferred Academic
Environment Questionnaire results.
MBTI Type Distribution Results
The first portion of this section will provide a
discussion of the type distribution of the sample. The last
portion of this section will discuss the comparison of the
sample type distribution to the CAPT gradute student type
distribution and the implications of significant differences
found.
Of the 132 respondents to the MBTI, 16 were female and
116 were male. Because the percentage of Feeling (F) types
is greater for females than it is for males in the general
population (8:39), the distribution of type represented by
the respondents is presented differentiated by gender.
Table I presents the type distribution showing the full 16
type categories for males. Table III presents the type
distribution for males grouped into condensed groupings
41
%2
utilizing one or two of the MBTI indices. Table II and
Table IV present the same information for the 16 female
respondents.
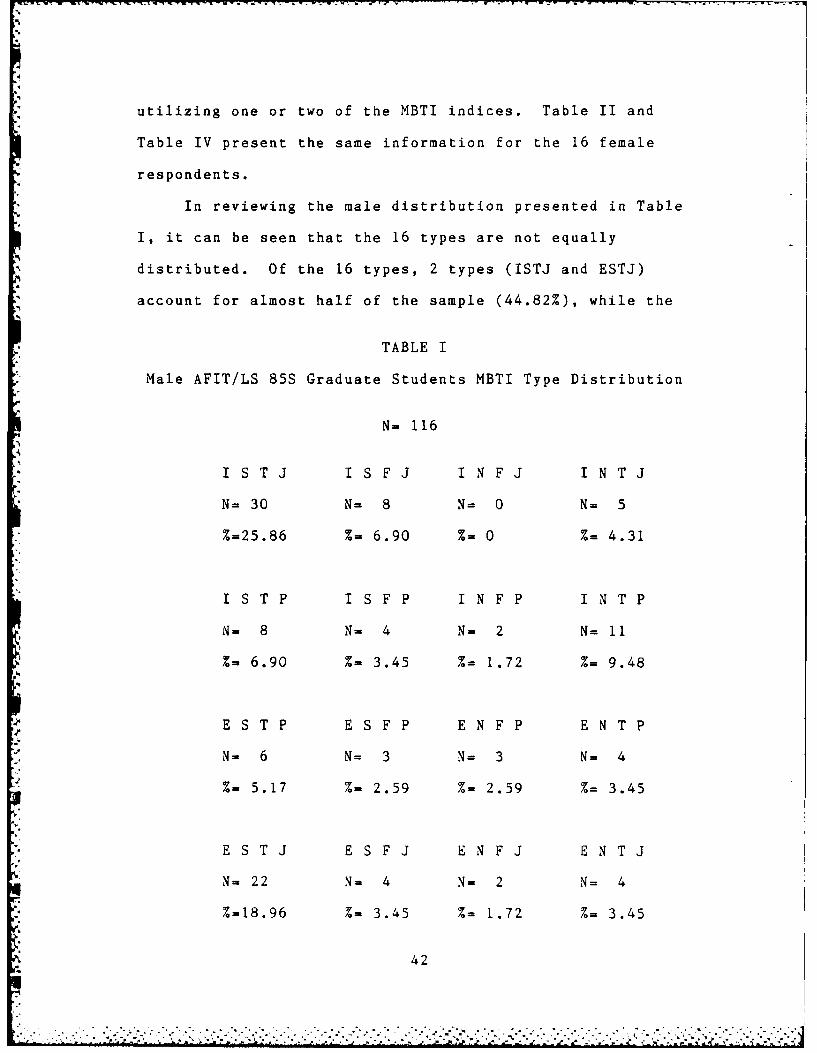
In reviewing the male distribution presented in Table
I, it can be seen that the 16 types are not equally
distributed. Of the 16 types, 2 types (ISTJ and ESTJ)
account for almost half of the sample (44.82%), while the
TABLE I
Male AFIT/LS 85S Graduate Students MBTI Type Distribution
N= 116
I STJ I S FJ I NFJ I NTJ
N= 30 N= 8 N= 0 N= 5
%=25.86 %= 6.90 %= 0 %= 4.31
I STP I S F P I NF P I NTP
N= 8 N= 4 N= 2 N= 11
%= 6.90 %= 3.45 %= 1.72 %= 9.48
E STP E S F P EN F P ENTP
N- 6 N= 3 N= 3 N= 4
%- 5.17 %= 2.59 %- 2.59 %= 3.45
E STJ E S F J E N FJ ENTJ
N= 22 N= 4 N= 2 N= 4
%-18.96 %= 3.45 %= 1.72 %= 3.45
42
-A -P
five least represented types account for 8.62% of the
sample. The INFJ type is not represented.
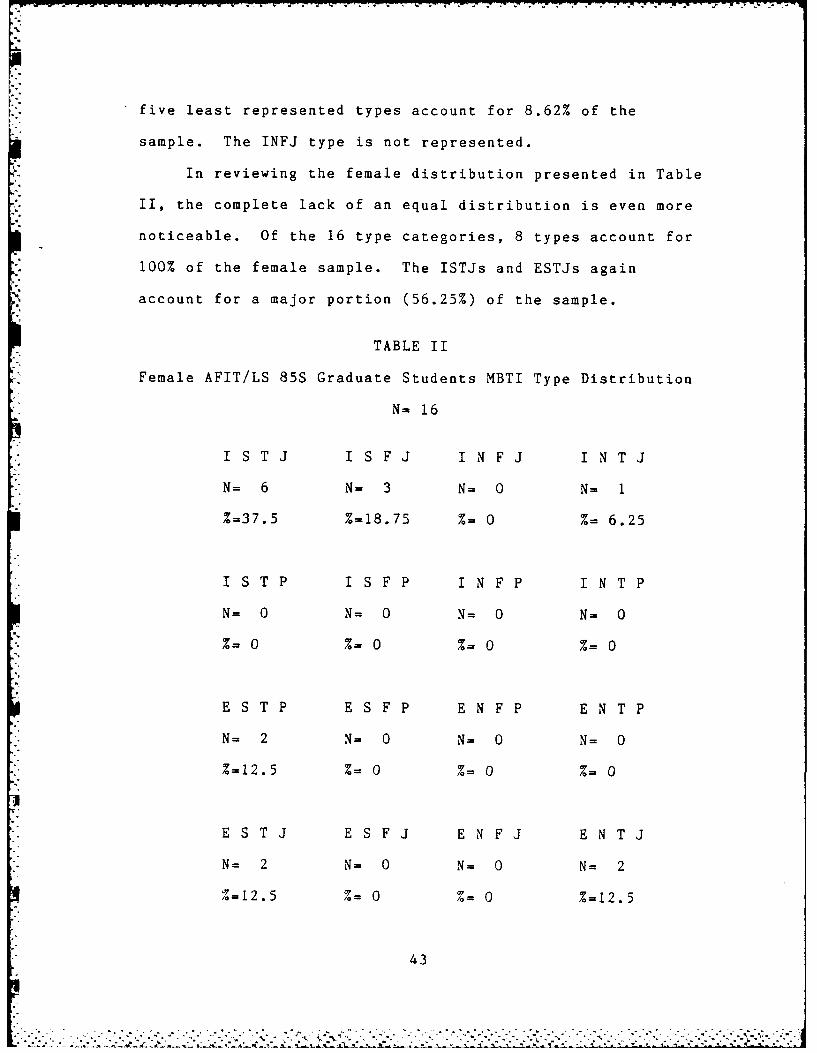
In reviewing the female distribution presented in Table
II, the complete lack of an equal distribution is even more
noticeable. Of the 16 type categories, 8 types account for
100% of the female sample. The ISTJs and ESTJs again
account for a major portion (56.25%) of the sample.
TABLE II
Female AFIT/LS 85S Graduate Students MBTI Type Distribution
N- 16
I STJ I S FJ I N FJ I NTJ
N= 6 N= 3 N= 0 N= 1
%=37.5 %=18.75 %= 0 %= 6.25
I STP I SFP I NFP I NTP
N= 0 N= 0 N= 0 N= 0
%= 0 %= 0 %= 0 %= 0
E STP ES FP EN FP ENTP
N= 2 N= 0 N= 0 N= 0
%=12.5 %= 0 %= 0 %= 0
E S T J E S F J E N F J E N T J
N= 2 N= 0 N= 0 N= 2
%=12.5 %= 0 %= 0 %=12.5
43

While it would be presumptuous to draw any conclusions
from the female sample size (16), it is very interesting to
note the lack of feeling types. While the purpose of differ-
* entiating samples by gender is because females are usually
over represented in Feeling types in comparison to males, this
does not appear to be the case in this sample. Of the eight
feeling types only one is represented in the female distrib-
ution, accounting for 18.75% of the female sample. With the
* male distribution, seven of the eight feeling types are
* represented, accounting for 22.41% of the male distribution.
* In reviewing the type distribution by groupings (Table
III and Table IV), the male and female distributions follow
* almost the same pattern. For both distributions the Is, Ss,
Ts and Js outnumber the Es, Ns, Fs and Ps. The ST and IS
groupings also represent the largest portion of both
distributions. The only noticeable difference between the two
distributions is in the IS, IN, ES, and EN groupings, where
the EN type grouping is the least represented in the male
sample and the IN type grouping is the least represented in
the female sample.
Since the type distributions by groupings for the male
and female distributions followed almost the same pattern,
there were no real surprises in the combined distribution. In
the IS, IN, ES, and EN grouping breakdown, the difference in
.. .' ranking of the female distribution failed to have enough of an1
* impact to change the ranking for the total sample.
44

TABLE IILI
Male AFIT/LS 85S Graduate StudentsMBTE Type Distri'~u.-ion
by Type Groupings
N= 116
Type N%
E 48 41.37
1L 68 58.62
S 85 73.28
N 31 26.72
T 90 77.59
F 26 22.41
J 75 64.66
P 41 35.34
ST 66 56.90
SF 19 16.38
NF 7 6.03
NT 24 20.69
IEN 18 15.52
EN 13 11.21
is 50 43.10
ES 35 30.17
45

TABLE IV
Female AFIT/LS 85S Graduate Student MBTI Type Distribution
by Type Groupings
N= 16
Type N
E 6 37.5
I 10 62.5
S 13 81.25
N 3 18.75
T 13 81.25
F 3 18.75
J 14 87.5
P 2 12.5
ST 10 62.5
SF 3 18.75
NF 0 0.0
NT 3 18.75
IN 1 6.25
EN 2 12.5
IS 9 56.25
ES 4 25.0
46

TABLE V
Combined Type Distribution of AFIT/LS 85S Graduate Students
by Type Groupings
N- 132
Type N%
E 54 40.91
1 78 59.09
S 98 74.24
N 34 25.76
T 103 78.03
F 29 21.97
J 89 67.42
P 43 32.58
ST 76 57.58
SF 22 16.67
NF 7 5.30
NT 27 20.55
IEN 19 14.39
EN 15 11.36
-- is 59 44.70
E ES 39 29.55
47

In reviewing the total combined sample (presented in
Table V and Table VI), discussion will be based on a
comparison to the male sample. The top ranking percentages
in the male and female distribution (ISTJ and ESTJ) still
maintain the major proportion of the combined distribution,
accounting for 45.45% of the combined samples. The INFJ type
is the only type not represented and the 5 least represented
types account for only 7.58% of the total distribution.
TABLE VI
Combined Type Distribution of AFIT/LS 85S Graduate Students
N= 132
I STJ I S FJ I NFJ I NTJ
N= 36 N= 11 N= 0 N= 6
%=27.27 %= 8.33 %= 0 %= 4.55
I S T P I S F P I N F P I N T P
N= 8 N= 4 N= 2 N= 1i
%= 6.06 %= 3.03 %= 1.52 %= 8.33
E STP E S F P EN F P ENTP
N= 8 N= 3 N= 3 N= 4
%m 6.06 % 2.27 % 2.27 % 3.03
E S T J E S F J E N F J E N T J
N= 24 N= 4 N= 2 N= 6
%=18.18 %= 3.03 %= 1.52 %= 4.55
48
-. ... A......... -. .... " . -
The following narrative discusses the statistical
analysis of the selection ratio comparison of the total
AFIT/LS 85S type distribution to the CAPT graduate student
type distribution data base. The selection ratio results are
presented in Table VII and Table VIII. The female, male, and
combined CAPT graduate student type distributions can be
found in Appendix B.
It should be noted that in making the statement that a
selection ratio (SR) was statistically significant implies
rejection of the null hypothesis in favor of the alternative
hypothesis. A lack of significance indicates a inability to
reject the null hypothesis.
In reviewing the results from the full 16 types
comparison, the largest selection ratio (SR) was 3.50 for the
ESTP type. The smallest SR value (0.14), discounting the 0
value for the non-represented INFJ category, was for the INFP
type. For six of the selection ratios (ISFJ, INTJ, ISFP,
ESFP, ENTP, and ENTJ), no significant difference was found at
the .05 level. The selection ratios of the INTP and ESFJ
types were significant at the .05 level and the selection
ratios of the INFJ, ISTP, and ENFJ types were significant at
the .01 level. At the most restrictive level of significance
(.001) there were five selection ratios indicating a
significant difference between the sample and the data base
distributions. The 5 types with selection ratios significant
at the .001 level were ISTJ, INFP, ESTP, ENFP and ESTJ.
49
+.. i.++ +i- . i .- -? -'i .+..- -+' i .+.+.-'. • .i. -'+- .. . ..-......-..-.-..-....-............-..........-.-.,-...'.."....-.-.-.-.....-...-.....

TABLE VII
Selection Ratio Comparison of AFIT/LS 85S Graduate Students
N= 132
I S TJ I S FJ I N FJ I NT J
N= 36 N= 11 N= 0 N= 6
%-27.27 %= 8.33 %= 0 %= 4.55
SR=3.28*** SR=1.02 SR-0.00** SR-0.85
I S TP I S FP I NF P I NT P
N= 8 N= 4 N- 2 N-l11
%= 6.06 %= 3.03 %.= 1.52 %- 8.33
SR=2.82** SR=Q.93 SR=0.14* SR-1.79*
E S TP E S FP E N FP E NT P
N: 8 N= 3 N- 3 N- 4
%.- 6.06 %= 2.27 %- 2.27 %- 3.03
SR=3.50*** SR=0.71 SR=0.18*** SR=0.69
E S TJ E S FJ E N FJ E NT J
N- 24 N= 4 N= 2 N= 6
%=1.18%=3.03 %- 1.52 Z-4.55
SR-2.23*** SR-O.38* SR=0.20** SR.-0.75
*indicates significance at the .05 level*indicates significance at the .01 levelindicates significance at the .001 level
50

Reviewing the over represented types, it was found there
were significantl, more ISTJ, ITP, INTP, ESTP, and ESTJ types
in the sample than the CAPT data base distribution indicates
would be expected at the .05 level of significance. At the
.01 level of significance the INTP type was excluded. At the
.001 level, three types remain with SR values of greater than
- 1.00. They are the ISTJs, ESTPs and the ESTJs. There were
five types with SR values of less than 1.00. They were the
ESFJs (significant at the .05 level); the ENFJs and INFJs
(significant at the .01 level); and the INFPs and ENFPs
(significant at the .001 level).
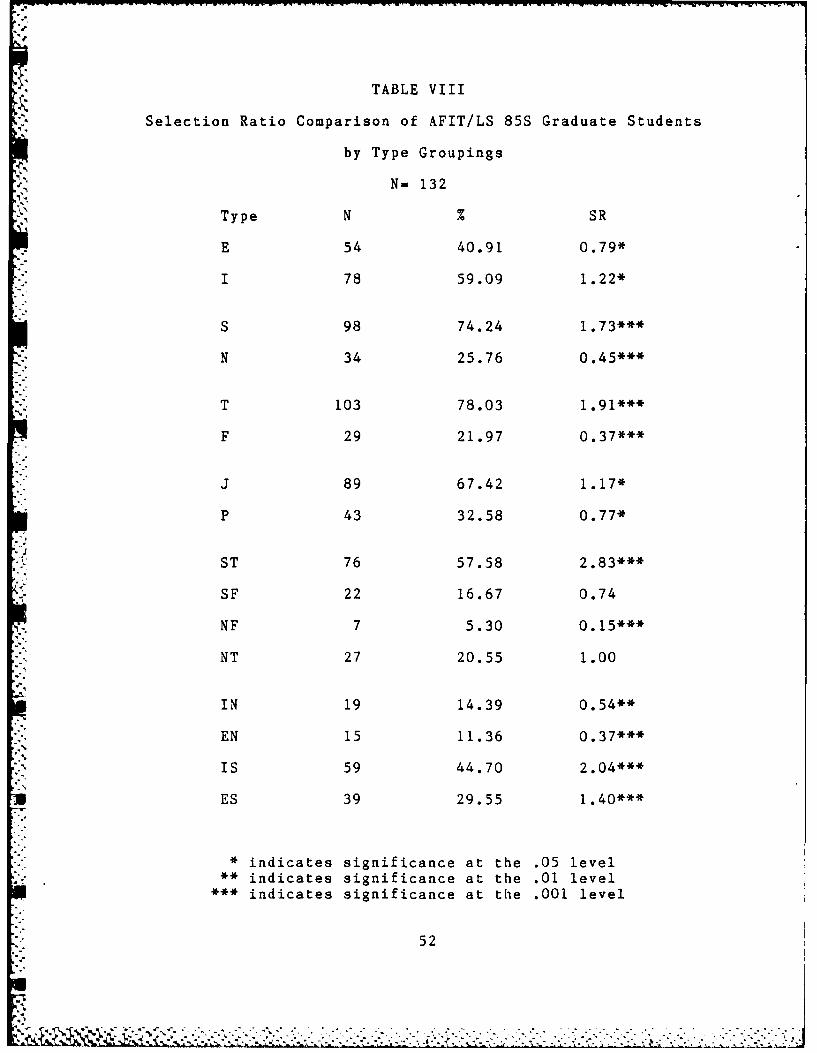
In surveying the selection ratio results of the El, SN,
TF, and JP groupings it was found that each of the type
groupings which represented the largest percentage of sample
(Is, Ss, Ts, and Js) also has significant SR ratios of greater
than one. The largest SR ratio (1.91) was found for the
Thinking (T) grouping. The smallest SR ratio was found for
the Feeling (F) group (0.37). The significance of this
finding may be tempered by the fact that the females in the
CAPT distribution accounted for 45.3% of the total CAPT type
distribution and the females in the AFIT/LS sample accounted
for only 12.12% of the total sample. The previously mentioned
lack of F types in the female sample would tend to limit the
importance of the lack of females in the total sample.
To avoid ignoring the possibility a type group may have a
significant selection ratio of greater or less than one but
51
* TABLE VIII
Selection Ratio Comparison of AFIT/LS 85 Giraduate Students
by Type Groupings
N- 132
Type N %SR
E 54 40.91 0.79*
1 78 59.09 1.22*
5 98 74.24 1.73***
N 34 25.76 0.45***
T 103 78.03 1.91***
F 29 21.97 Q*37***
J89 67.42 1.17*
P 43 32.58 0.77*
ST 76 57.58 2.83***
SF 22 16.67 0.74
NF 7 5.30 0.15***
NT 27 20.55 1.00
IN 19 14.39 Q*54**
EN 15 11.36 0.37***
is 59 44.70 2.04***
ES 39 29.55 1.40***
*indicates significance at the .05 level*indicates significance at the .01 level**indicates significance at the .001 level
52

the same 'relationship may not hold for the complete breakout
of types, exceptions within type groups should be noted. In
example, while there were significantly more I types in the
sample than in the CAPT distribution, there were two types
(INFJ and INFP) which were under represented in the sample.
In examining the ST, SF, NF and NT groupings it was
again found that the ST grouping, which represented the
largest percentage of the sample also had the largest SR
ratio (2.83). The NF grouping, which represents the smallest
percentage, also had the smallest SR ratio (0.15). Both the
ST and NF SR ratios were significant at the .001 level. No
statistical significance was found for the other two
groupings and the NT group had a selection ratio of 1.00
In the last grouping analyzed (IS, ES, IN, and EN), two
groupings had SR ratios significantly greater than 1.00; IS
significant at the .001 level and ES significant at the .05
level. The EN grouping had an SR ratio significantly less
than 1.00 at the .001 level and the IN grouping was also
under represented (significant at the .01 level). Again the
grouping with the highest percentage had the highest SR ratio
and the grouping with the smallest percentage had the lowest
SR ratio.
While it may seem redundant to discuss the groupings of
four types after discussing the El, SN, TF, and JP type
groupings, additional information is gained about the
interaction of combined under and over represented type
53

groups. For example, both the IN and the ES groupings
represent the combination of an over represented group and an
under represented group. By looking at the resulting
selection ratio for each grouping it is fairly obvious which
of the over or under represented group had more of an impact.
Since the ES grouping has a significant SR ratio of greater
than one the over representation of Js had a larger impact
than the under representation of Es. Conversely for the IN
grouping, the under represented N grouping must have a
greater impact since the selection ratio for the IN grouping
is significantly less than one.
- - In reviewing the total results of the selection ratio
analyses, the strongest pattern of difference between the
sample and the CAPT data base was found in the ST and NF type
groupings. With one exception (the INTPs), all type
categories with a significant positive selections ratio
(greater than 1.00) were found in the ST type column of the
- . MBTI type table. This finding was reinforced with the
* selection ratio comparison by type groupings for the ST, SF,
NF and NT grouping. A pattern also developed for types with
- . a significant selection ratio of less than 1.00. With one
exception (the ESFJs), all types which are significantly
* under represented in the sample were found in the NF column
of the MBTI type table. When looking at the selection ratio
comparison by type grouping this pattern is again shown in
the ST, SF, NF and NT grouping.
54

The information gained from this analysis provides some
valuable insights into the characteristics of the over
represented and majority types of the sample. Introverts
(I) can be expected to prefer to work alone and
uninterrupted, often with intense concentration. They can
also be expected to prefer and perform better on written
assignments (8:71). Sensing (S) types can be expected to be
more comfortable dealing with factual details that can be
used in a systematic manner to solve a "realistic and
practical" problem (8:72). Thinking (T) types can be
expected to be analytical and objective in their dealings
with problems, often appearing to be insensitive to other
people's feelings (8:74). Judging (J) types can be expected
to prefer to control their environment in a planned, orderly
and decisive manner (8:76). The under represented
dichotomus types for each of these indices can be expected
to display opposite characteristics.
The combination of Introversion with Sensing (IS)
results in individuals who have been described as "careful
compilers" who see the value of knowledge "to establish
truth" (13:166). The strongest pattern of type distribution
found, the combination of Sensing with Thinking (ST),
results in an individual that can be described as "practical
and matter-of-fact" due to their tendency to "focus their
attention on facts and handle these with impersonal
analysis" (8:A-3).
55
. . . . . . .. ...

Mean GPA Comparison Results
It was expected that different preferences identified by
MBTI indices would be associated with academic performance
due to motivational differences and differences affecting a
student's skill in demonstrating academic competence. In
attempting to determine if a difference existed beween
academic performance of different MBTI type groupings, with
group GPA means as the basis for comparison, subjects were
*differentiated according to MBTI type. Table IX summarizes
the results from the SPSS T-Test analysis of the group GPA
means for E versus I, S versus N, T versus F, and J versus P
types.
Discriminating subjects according to their EI preference
was expected to demonstrate the affect of the Introverts' (I)
stronger skills in writing and better performance on written
tests concerned with understanding concepts, improving their
chances for increased academic success in a graduate level
program (13:152). Seperating subjects according to their SN
preference was expected to demonstrate the academic advantage
of the Intuitive (N) types due to their tendency to quicker
insight. This gives them an advantage in testing (especially
with time restrictions) and in understanding complex
"" . relationships (13:156). Discriminating subjects according
.. to their TF preference was expected to demonstrate the
favorable difference of better application in technical
56
* *. **., .a ,.. .,e.. .. ....... , '. . . .. . . .. ....... ...- , . • .-. ...-.

Table IX
Group Mean GPA Comparison -- One MBTI Index Only
Type Group N Mean GPA Variance
E 54 3.5757 0.0767
I 78 3.6306 0.0686
* Pooled Variance Estimate *
T Value Degrees Of Freedom 2-Tail Prob
-1.16 130 0.250
* Equal Variance Test *
F Value 2-Tail Prob
1.11 0.662
Type Group N Mean GPA Variance
S 34 3.6219 0.0724
N 98 3.5684 0.0708
** Pooled Variance Estimate *
T Value Degrees Of Freedom 2-Tail Prob
-1.03 130 0.319
** Equal Variance Test **
F Value 2-Tail Prob
1.03 0.965
57

Table IX (continued)
Type Group N Mean GPA Variance
T 103 3.5907 0.0870
F 29 3.6356 0.0605
,. Pooled Variance Estimate *
T Value Degrees Of Freedom 2-Tail Prob
0.75 130 0.455
** Equal Variance Test **
F Value 2-Tail Prob
1.43 0.276
Type Group N Mean GPA Variance
J 89 3.6216 0.0650
P 43 3.5802 0.0870
-. Pooled Variance Estimate *
T Value Degrees Of Freedom 2-Tail Prob
-0.83 130 0.408
-* Equal Variance Test *
S F Value 2-Tail Prob
1.34 0.254
58
subjects concerning logical cause and effect relationships
such as mathematics (13:158). The JP differentiation of
subjects was expected to demonstrate the stronger study
habits and application of Judging (J) types that results in
higher academic grades than expected from their aptitiutde
and therefore higher grade point average than Perceptive (P)
types (13:162-163).
The pooled variance T-Test SPSS output values were used
in all calculations since the results of the F-test of the
sample variance, performed as part of the SPSS T-Test
analysis, indicated a probability of greater than .05 (alpha
level). Therefore, there was insignificant evidence to
reject the assumption of equal variances (16:270).
The pooled variance T-Test results did not indicate a
significant difference between GPA means by any of the
methods of grouping. The data did not present sufficient
evidence to reject the hypothesis that the GPA means were
equal.
The results of the comparison of mean GPA for the two
sets of four type grouping (SI/SFINFINT and IS/IN/ES/EN)
analyzed by the SPSS subprogram Breakdown are presented in
Table X. It was expected that differentiating subjects
according to type grouping utilyzing two MBTI indices would
demonstate the consolidated effect of the two different
preferences.
59
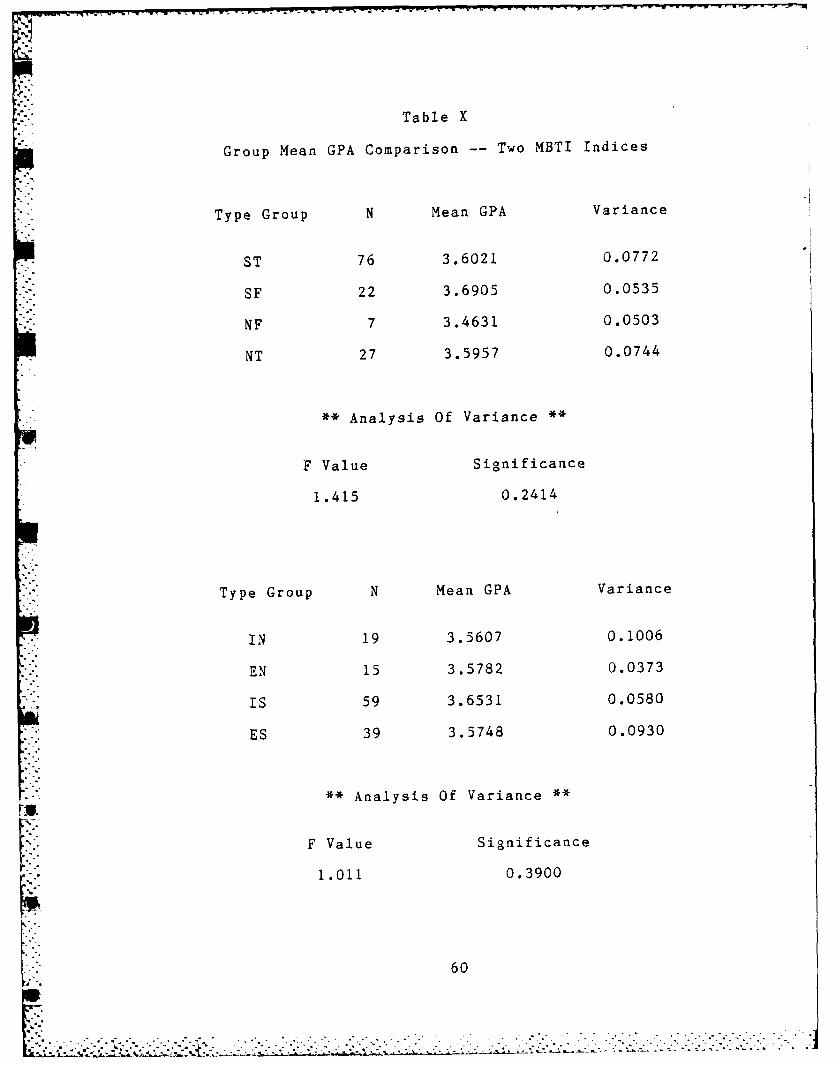
Table X
Group Mean GPA Comparison -- Two MBTI Indices
* - Type Group N Mean GPA Variance
ST 76 3.6021 0.0772
SF 22 3.6905 0.0535
NF 7 3.4631 0.0503
NT 27 3.5957 0.0744
* Analysis Of Variance *
F Value Significance
1.415 0.2414
Type Group N Mean GPA Variance
IN 19 3.5607 0.1006
EN 15 3.5782 0.0373
IS 59 3.6531 0.0580
ES 39 3.5748 0.0930
. Analysis Of Variance *
F Value Significance
1.011 0.3900
60

- -.- --
Again, the difference between group means was too small
in relation to the variance within the groups to indicate a
significant difference between even two of the groupings.
This resulted in a failure to reject the hypothesis that the
mean GPA for all four groupings were equal.
The mean GPA for all 132 subjects was calculated as
3.6081, with a standard deviation of 0.2673. Due to the
small variance within the sample and the resulting lack of
statistically significant difference in GPA means, the SPSS
NPAR Kruskail-Wallis One Way Analysis Of Variance test was
also performed on all comparison methods. However, the
Kruskall-Wallis H test of mean rank for each group also
failed to identify any statistically significant difference
between the type groups.
If MBTI personality type differences affected this
sample's motivation and demonstration of academic competence
in their first three academic quarters of the AFIT/LS
academic environment, the statistical analysis of their
resulting GPA means was not able to demonstrate that effect.
Preferred Academic Environment Questionnaire Results
To determine if MBTI type differences were related to
preferences for different instructional techniques and
learning styles, the mean ratings of the two appropriate
dichotomous type groups were analyzed. It was expected that
personality differences of the opposite types would result
61
. . .
" "' ' ' "- -- ' -•" -" "" "" " - " "."" "" " " " " "; Z . . -

in a statistically significant difference in agreement
rating for statements concerning the AFIT/LS academic
environment. The following seven-point Likert Scale was
used for indicating agreement or disagreement:
1= Strongly Agree
2= Moderately Agree
3= Slightly Agree
4= Neither Agree Nor Disagree
5= Slightly Disagree
6- Moderately Disagree
7= Strongly Disagree
In relation to the numerical Likert Scale values used,
a mean rating of less than 3.5 was interpreted as
.' representing agreement with a statement. A mean rating
greater than 4.5 indicated disagreement with a statement.
A mean rating between 3.5 and 4.5 (inclusive) represented
neither agreement nor disagreement with a statement. In
comparing the mean ratings of two type groups, a stronger
agreement would be indicated by a lower numerical mean
rating value.
The discussion of the results from the Preferred
Academic Environment Questionnaire are divided into three
sections: Statements 1 through 10, Statements 11 through
25, and Statements 26 through 35. Each section provides a
discussion of the SPSS T-Test results for statements where
62
V*..-Y..2:~fy.&&.C7 2 . §:~.::.

the expected significant difference in mean responses was
found and the reason for selecting the MBTI preference
index used to differentiate respondents. Summaries are
provided for each section which also include a discussion
of statements which failed to produce statistical
significant differences. The section concludes with an
overall discussion of all three sections of the Preferred
Academic Environment Questionnaire (hereafter also referred
to as the PAEQ).
The one tailed t-test results for statements with
statistical significance are presented in Tables XI, XII,
and XIII. Results from statements which failed to produce
statistical differences are available in Appendix C. The
pooled variance T-Test SPSS output values were used in all
calculations since the results of the F-test of the sample
variance, performed as part of the SPSS T-Test analysis,
indicated a probability of greater the .05 (alpha level).
Therefore, there was insignificant evidence to reject the
assumption of equal variances (16:270).
Statements Concerning Test Taking and Study Habits --
Statements 1 through 10. The first ten statements re-
quested the respondent indicate agreement or disagreement
with statements concerning study habits and test taking.
Statistical significant mean rating differences in the
predicted direction were found for statements 1, 4, 5, and
8.
63

Table XI
Preferred Academic Environment Questionnaire Section One
Statements with Significant Differences
Statement 1 (J < P expected)
Type Group N Mean Rating Std Dev
J 73 3.1507 1.630
P 23 4.6522 1.849
** Pooled Variance Estimate **
T Value Degrees Of Freedom 1-Tail Prob
3.73 94 0.000
Statement 4 (J < P expected)
Type Group N Mean Rating Std Dev
J 73 3.9863 2.072
P 23 5.1739 2.188
** Pooled Variance Estimate **
T Value Degrees Of Freedom 1-Tail Prob
2.37 94 0.010
Statement 5 (S < N expected)
Type Group N Mean Rating Std Dev
S 77 3.3896 1.640
N 19 4.4211 1.644
T Value Degrees Of Freedom 1-Tail Prob
2.45 94 0.008
64
......................

Table XI (continued)
Statement 8 (J < P expected)
Type Group N Mean Rating Std Dev
J 73 3.3973 1.991
P 23 4.8261 2.146
** Pooled Variance Estimate *
T Value Degrees Of Freedom 1-Tail Prob
2.95 94 0.002
Statement 1: I generally follow a study schedule
and divide my time according to what I need to do each day.
Discussion: According to the predicted relationships
of the JP index, Judging (J) types can be expected to have
and follow a study schedule. Perceptive (P) types are more
prone to procrastinate and study as the "spirit moves them"
(13:162,164). It was therefore expected J types would
indicate a stronger agreement (lower mean rating) with
Statement 1 in comparison to P types.
Results: The results from Statements I indicate that
as a group the Judging types did respond with an overall
agreement with this statement, with a mean rating of 3.1507.
In comparison, the Perceptive types had a mean rating of
4.6522 which indicated an overall disagreement with this
statement. The SPSS T-Test output found the stronger
agreement of the Judging group was statistically
65

significant. The one-tailed probability of 0.000 indicated
the possibility of drawing two samples that differ in rating
by more than the two group ratings found in this sample was
unlikely.
Statement 4: I make systematic notes and/or
outlines of class readings.
Discussion: In relationship to a Judging (J) type
preference, a student interested in controlling their outer
world in a planned and structured manner would see more
value in organizing and structuring their study of classroom
reading. Being a dichotomous opposite, a Perceiving (P)
type preference to keep structure at a minimum, plus a
tendency towards procrastination, would result in the
opposite perspective (8:54,55). It was expected J types
would indicate a stronger agreement with this statement
compared to P types.
Results: The results from Statement 4 indicated the
Perceiving (P) type group responded with an overall
disagreement with this statement. The mean rating of the P
type group was 5.1739. The mean rating (3.9863) of the
Judging type group indicated neither agreement nor
disagreement with the statement. While the J types did not
agree with this statement, the SPSS T-Test output indicated
the stronger disagteement of the perceiving types was
statistically significant with a one-tailed probability of
66
., - .'-

Statement 5: I do better on test questions
concerning factual details than on questions concerning
synthesis and evaluation.
Discussion: Concerning the preferences of a Sensing
(S) type in comparison to an Intuitive (N) type, a Sensing
student would be more comfortable dealing with factual
details than conceptual reasoning. Sensing types place an
importance on details while Intuitive types are more
interested in perceiving the relationships and meaning of
the facts than to the facts themselves (8:72-73). It was
therefore expected the S types would indicate a stronger
agreement with Statement 5.
Results: The results from Statement 5 indicated that
the Intuitive (N) type group showed neither agreement nor
disagreement with this statement. The mean rating of the N
type group was 4.4211. The mean rating of the Sensing (S)
type group (3.3896) did indicate an overall agreement with
the statement. The SPSS T-Test output indicated the
difference between the mean ratings of the two groups was
statistically significant with a one-tailed probability of
0.008.
Statement 8: 1 do not let course work pile up,
then cram at the last minute.
Discussion: Since Judging (J) types are expected to
*have and follow a study schedule they are less likely to
have the need to cram at the last minute. Due to Perceptive
67

(P) types' tendency to procrastinate, they would be expected
to leave the course work to the last minute more than the
Judging type (13:162,164). It was therefore expected
Perceptive types would designate a stronger agreement than
Judging types for this statement.
Results: The results from Statement 8 indicated that
the Judging (J) group showed an overall disagreement with
this statement. The mean rating of the J type group was
4.8261. The Perceptive (P) type group had a mean rating of
3.3973, indicating agreement with the statement. The output
of the SPSS T-Test showed the difference between the mean
ratings of the two groups was statistically significant with
a one-tailed probability of 0.002.
Section One Summary. The results from the first
section of the PAEQ indicated the Judging/Perceiving (JP)
index was the only MBTI preference that produced the results
expected. The results showed Judging (J) types indicated
* .- ;they do follow a study plan and do not let course work pile
up to the point that they are forced to cram for
examinations. The opposite findings were found for the
Perceiving (P) types. Perceiving (P) types indicated they
do better on test questions concerning factual details and
do not make systematic notes and/or outlines of class
readings. While the mean rating of the Judging (J) types
was not opposite in response (falling into the neither agree
nor disagree region), the difference in mean response
68

between the two groups was in the expected direction and
statistically significant.
No statistical difference between mean ratings was
found for the remaining six statements in the first section
of the Preferred Academic Environment Questionnaire. For
Statements 2, 3, 6, 7, 9 and 10; differentiating respondents
-" according to MBTI type preference groupings did not produce
the expected significant difference in mean rating. The
relationship of MBTI identified preferences to the areas
addressed by these statements did not appear to be strong
enough to result in a differentiation of mean responses.
Statements 2, 3, and 10 were analyzed by grouping
respondents according to their Sensing/Intuitive
preferences. The three statements were:
2. Time restrictions on tests do not negatively effect
my performance.
3. Hard items at the beginning of a test do not affect
my ability to answer easier items later.
10. A good grade on one test increases my confidence
for the next one.
Statement 2 was analyzed by comparing the mean rating
of the Intuitive (N) types verses the Sensing (S) types
because the Intuitive types tend to have quicker insight
which gives them an advantage in tests with time
restrictions (13:156). While there was a slightly stronger
agreement indicated by Intuitive (N) types, both groups
69
. . *,

indicated they neither agreed nor disagreed with Statement
2. Statements 3 and 10 were also expected to produce a
greater agreement from Intuitive types in comparison to the
"* Sensing respondents. Statements 3 and 10 were taken from
Learning Activity Questionnaire items found to be associated
with better grades from the Psychological (Myers-Briggs)'U.
Type Differences in Education study by McCaulley and Natter
(13:178). Since Intuitive types seem to have an advantage
in timed tests and have a greater potential for better
performance on written tests in general (13:156), it was
this author's contention that Intuitive types should
indicate a greater agreement with these two statements. The
difference between mean response ratings for Statements 3
and 10 was not in the expected direction. Sensing (S) types
agreed and Intuitive (N) types neither agreed nor disagreed
with Statement 3. Both types agreed with Statement 10.
Statements 6 and 7 were analyzed by differentiating the
respondents according to the JP index. The two statements
were:
6. I do not neglect or have problems organizing what
needs to be done with larger class projects.
7. I do not seem to take more lecture notes than
necessary.
The reasons for selecting the JP index for Statement 6
was the same as the reasons cited for Statement 1. The
major difference between the two statements was Statement 6
70
-. . . . . . .. - - . --.--B>-v. .- .
* *.io". f

concerned major class projects while Statement 1 concerned
daily study planning. While Perceptive (P) respondents
indicated an overall disagreement with the statement
concerning daily study scheduling, they indicated they did
not have problems organizing larger class projects. While a
significant difference was found for the mean ratings of J
and P respondents for Statement 1, both types indicated they
did not have problems organizing larger projects (Statement
6) and the response difference was nonsignificant.
Statement 7 was an item developed from the Learning Activity
Questionnaire study previously mentioned. In the results
reported by McCaulley and Natter, the Judging types were the
only type that significantly indicated they "seem to take
more notes than necessary" (13:162). The results for
Statement 7 indicated both types responded that they do not
take more lecture notes than necessary. The nonsignificant
difference was in the expected direction.
Statement 9 (I study with a group for tests) was the
remaining statement for which a significant difference was
not found. Results from Statement 9 were differentiated
according to the Extraversion-Introversion index since the
Extravert type would be expected to prefer working with
others while the Introvert type prefers to work alone --
where they will not be interrupted (13:150-152). Even
though there was a slight difference in response, both types
disagreed with this statement.
71
Statements Concerning Better Academic Performance --
Statements 11 through 25. The next 15 statements requested
respondents indicate agreement or disagreement with
. statements concerning learning activities or situations that
result in better academic performance for the respondent.
Statistically significant differences were found for
* statements 15, 16, 19, 21, and 22.
Table XII
Preferred Academic Environment Questionnaire Section Two
Statements with Significant Differences
Statement 15 (J < P expected)
Type Group N Mean Rating Std Dev
J 73 1.7534 0.997
P 23 2.2609 1.421
* Pooled Variance Estimate *
T Value Degrees Of Freedom 1-Tail Prob
1.91 94 0.029
Statement 16 (S < N expected)
Type Group N Mean Rating Std Dev
S 77 2.8961 1.283
N 19 3.7368 1.790
* Pooled Variance Estimate *
T Value Degrees Of Freedom 1-Tail Prob
2.35 94 0.011
72
-" - ;.-- ;-", 'x - -. -- - -----"------,----------.------.--"'--",-.-"----.------------.--'-.-----....-------.----,'---.------

Table XII (continued)
Statement 19 (S > N expected)
Type Group N Mean Rating Std Dev
S 77 3.5584 1.500
N 19 2.8947 1.487
* Pooled Variance Estimate *
T Value Degrees Of Freedom 1-Tail Prob
-1.73 94 0.043
Statement 21 (S < N expected)
Type Group N Mean Rating Std Dev
S 77 2.0519 1.037
N 19 2.9474 1.471
* Pooled Variance Estimate *
T Value Degrees Of Freedom 1-Tail Prob
3.08 94 0.001
Statement 22 (S > N expected)
Type Group N Mean Rating Std Dev
S 77 3.1429 1.295
N 19 2.3158 1.003
* Pooled Variance Estimate *
T Value Degrees Of Freedom 1-Tail Prob
-2.59 94 0.005
73U

Statement 15: I am most likely to perform better
academically in AFIT educational situations that let me know
what I am accountable for; when, how, and by what standards.
Discussion: Judging (J) types were expected to show a
stronger agreement with this statement due to their desire
for a structured system of accountability. The structured
environment that a Judging type needs may be seen as too
confining to a Perceiving (P) type (8:54).
Results: The results indicate that as a group the
Judging (J) types expressed a strong agreement (mean rating
of 1.7534) with this statement. The Perceiving (P) type
individuals also showed an overall agreement with this
statement. The mean rating of the P type group was 2.2609.
Even though it appears important to both type groups to know
how and what they are iccountable for, the output of the
SPSS T-Test indicated the stronger agreement of the J types
was statistically significant with a one-tailed probability
of 0.005.
Statement 16: 1 am most likely to perform better
academically in AFIT educational situations that require
accuracy and careful attention to details.
Discussion: Since a Sensing (S) type tends to rely on
their senses to perceive the facts of a problem or
situation, they tend to develop stronger skills in working
with facts. Due to their preference for factual
ir.formation, they tend to place stronger importance on
74
- .
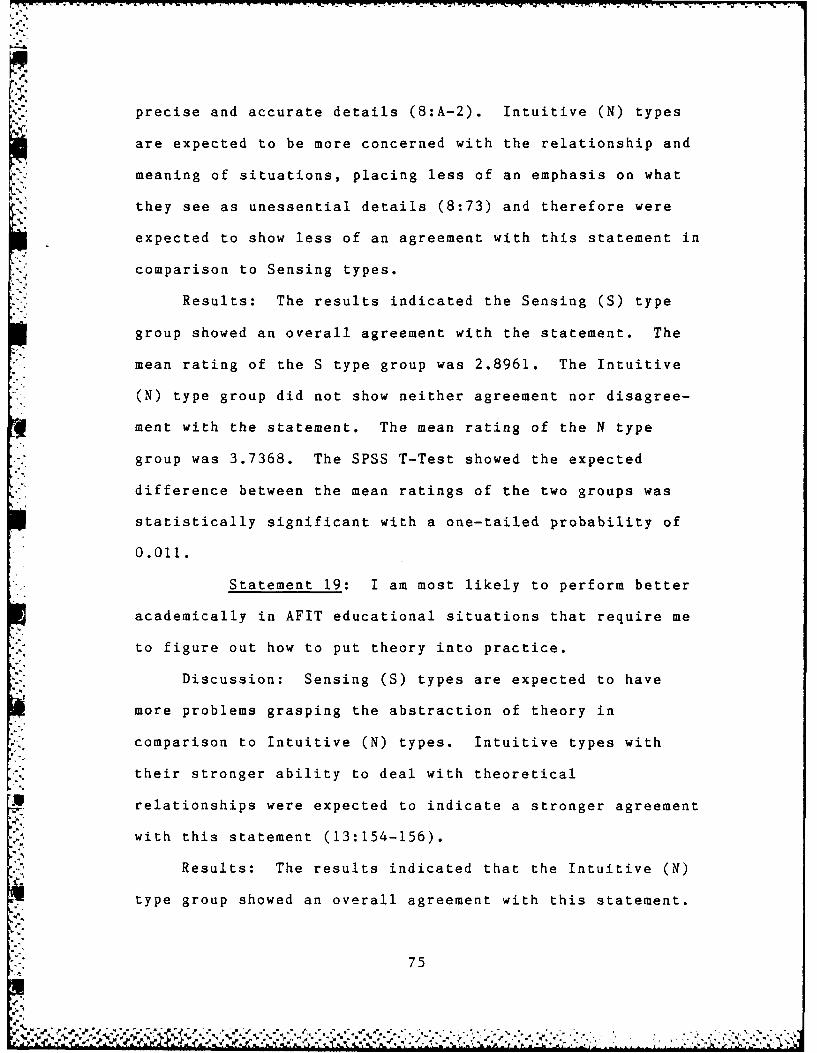
precise and accurate details (8:A-2). Intuitive (N) types
are expected to be more concerned with the relationship andN->[ meaning of situations, placing less of an emphasis on what
they see as unessential details (8:73) and therefore were
expected to show less of an agreement with this statement in
comparison to Sensing types.
Results: The results indicated the Sensing (S) type
group showed an overall agreement with the statement. The
mean rating of the S type group was 2.8961. The Intuitive
(N) type group did not show neither agreement nor disagree-
ment with the statement. The mean rating of the N type
group was 3.7368. The SPSS T-Test showed the expected
difference between the mean ratings of the two groups was
statistically significant with a one-tailed probability of
0.011.
Statement 19: I am most likely to perform better
academically in AFIT educational situations that require me
to figure out how to put theory into practice.
Discussion: Sensing (S) types are expected to have
more problems grasping the abstraction of theory in
comparison to Intuitive (N) types. Intuitive types with
their stronger ability to deal with theoretical
relationships were expected to indicate a stronger agreement
with this statement (13:154-156).
Results: The results indicated that the Intuitive (N)
type group showed an overall agreement with this statement.
wb.4".- .75
,z"1

The mean rating of the N type group was 2.8947. The mean
rating (3.5584) of the Sensing (S) type group showed neither
,.,..overall agreement nor disagreement with the statement. The
"" ""T-Test indicated the stronger agreement of the Intuitive
types was statistically significant with a one-tailed
probability of 0.043.
Statement 21: I am most likely to perform better
academically in AFIT educational situations that give me
ample opportunity to think out my ideas before I have to
answer.
Discussion: Since communication depends on the
translation from symbols into meaning by intuition, Sensing
(S) types tend to be at a disadvantage in quickly assimi-
lating exactly what is being asked. They feel more
comfortable and sure of their responses when they have the
opportunity to take the additional time needed to mentally
confirm the soundness of their understanding (14:147,152,
153). Therefore, Sensing types were expected to respond
*with a stronger agreement to this statement.
Results: The results indicated the Intuitive (N) type
.-.. group showed an overall agreement of the statement with a
mean rating of 2.9474. The mean rating (2.0519) of the
Sensing (S) type group showed an stronger overall agreement
" with this statement. The one-tailed probability of 0.001
, showed there was a statistically significant difference
between the two groups.
76

Statement 22: I am most likely to perform better
academically in AFIT educational situations that give me the
opportunity to be creative and work with my own ideas.
Discussion: Intuitive (N) types prefer and therefore
develop their intuition abilities. They are not as
interested in the systematic step by step solution to a
problem using a standard procedure, but are more comfortable
using their inventive and creative abilities (8:7).
Therefore, Intuitive types were expected to respond with a
stronger agreement to this statement.
Results: The reaults indicated the Intuitive (N) types
responded with an overall agreement with this statement.
The mean rating of the N type group was 2.3158. The Sensing
(S) type group also showed an overall agreement with this
statement. The mean rating of the S type group was 3.1429.
The output of the SPSS T-Test indicated the expected
stronger agreement of the N types was statistically
significant with a one-tailed probability of a 0.005.
Section Two Summary. The results from the second
section of the PAEQ demonstrated the relationship of
Sensing/Intuitive (SN) preferences to four statements
concerning situations that respondents indicated resulted in
better academic performance. The Judging/Perceiving (JP)
index relationship to Statement 15 was also demonstrated.
While a dichotomous response difference was not found for
Statement 15 since both Judging and Perceiving types
77
.

indicated they are more likely to perform better
academically when they know exactly what they are
accountable for, the mean response difference was in the
expected direction and statistically significant. Sensing
(S) types indicated they are more likely to perform better
academically in situations requiring accuracy and careful
attention to detail. Even though Intuitive (N) types did
not indicate agreement (mean response indicated neither
agreement nor disagreement), the stronger agreement of the
Sensing (S) types was significant. Intuitive (N) types
reported being at an academic advantage when they are
required to figure out how to put theory into practice.
Sensing (S) types did not indicate either agreement or
disagreement but the difference in mean response was as
expected and significant. Sensing (S) types also show a
significantly greater agreement to the statement that they
perform better academically when given ample opportunity to
think out their ideas before being required to respond.
Intuitive (N) types indicated they perform better in
situations where they are given the opportunity to be
creative and work with their own ideas. Even though there
was a significant difference between the mean response of
the two groups, a dichotomous response difference was not
found for either s stement since both type groups indicated
an overall agreement to both statements.
While a statistical difference between mean ratings was
78
:n * .

found for statements 15, 16, 19, 21, and 22; the difference
between mean responses for the other 10 statements in this
section of the questionnaire was not significant. The
relationship of MBTI preferences to the areas addressed by
these statements did not appear to be strong enough to
result in the expected differentiation of mean response.
Analysis of Statements 11 and 13 were performed by grouping
respondents according to their Extroversion/Introversion
(El) preference. The two statements were:
11. I am most likely to perform better academically in
AFIT educational situations that involve other students or
take group effort.
13. I am most likely to perform better academically in
AFIT educational situations that let me talk over questions
and ideas with others in classroom discussions.
Statement 11 was expected to generate a stronger
agreement response from Extravert (E) types due to their
preference to interact with others while an Introvert (I) is
more comfortable in their inner world of personal thoughts
(14:56). Even though the nonsignificant difference in
agreement was in the proper direction, both type groups
neither agreed nor disagreed with this statement. Statement
13 was expected to be more agreeable to Extravert (E) types
due to their need for approval and encouragement from the
outer world of people, which they are oriented towards
(14:55). Even though Extravert (E) types indicated
79
%,. . . . . .

agreement with Statement 13, the Introvert (I) type group
also agreed they perform better academically when they can
discuss questions and ideas with others. There was no
significant difference in mean response between the two
groups.
Statements 12, 14, 17, 18, 24, and 25 were analyzed by
dividing the respondents according to their Sensing and
Intuitive (SN) preferences. The five statements were:
12. I am most likely to perform better academically
in AFIT educational situations that let me work toward
goals step by step in an orderly way.
14. 1 am most likely to perform better academically
in AFIT education situations that present information in an
orderly, organized, and systematic manner.
17. I am most likely to perform better academically
in AFIT educational situations that require initiative to
plan and carry out new projects.
18. I am most likely to perform better academically
-" in AFIT educational situations that are more concerned with
understanding ideas and concepts than attending to factual
details.
'.1. 24. I am most likely to perform better academically
in AFIT educational situations that place time constraints
on tests.
25. I am most likely to perform better academically
in AFIT educational situations that place the major
so

emphasis on applications of theory and present examples
before explaining the theory.
Statements 12 and 14 were expected to be more
appealing to the Sensing (S) type due to their need for
approaching problems in a systematic, step by step process
where they can be assured of the accuracy and soundness of
their perceptions (8:7). The Sensing groups mean response
for Statements 12 and 14 indicated greater agreement, but
both type groups showed an overall agreement with both
statements.
Intuitive (N) types were expected to agree with
Statement 17 stronger than Sensing (S) types due to their
increased interest in doing things differently and working
with their intuitive ability to solve problems in unique
* ways. In comparison, an S type's tendency to rely on
established procedures and decreased ability to cope with
complex situations would result in less agreement with this
statement (8:72,73). Intuitive (N) types were expected to
agree stronger with Statement 1.8 due to their increased
ability to see the meaning of concepts and relationship of
ideas. Sensing (S) types tend to place an increased
importance on concrete observable facts and therefore
develop their skills in dealing with factual details to a
greater degree than Intuitive (N) types (8:A-2). Even
though the Intuitive (N) group's mean response indicated a
.:Y slightly greater agreement, both type groups showed an
81
a4.1

. ... . ; - - - - - - - - - ; .. . .J rr r C r r, . C , o - , .rT ° T i ,
overall greement with Statements 17 and 18.
For Statement 24, it was expected to see stronger
agreement from the Intuitive (N) types due to their
intuitive ability which tends to allow them to grasp
understanding more quickly. Since a Sensing (S) type tends
to be more deliberate in analyzing questions to make sure
they understand what is being asked, Sensing types were
expected to indicate less of an agreement (14:59,60).
Responses from Sensing (S) types did indicate an overall
disagreement with this statement. Intuitive (N) type's
mean response indicated neither agreement nor disagreement
and the difference was not significant. Statement 25 was
expected to show a stronger agreement from Sensing (S)
types due to their stronger interest in the practical
application of theory and a greater need to experience
before attempting to deal with abstraction (8:41). Even
though a slightly stronger agreement was shown by Sensing
(S) types for Statement 25, both types indicated an overall
agreement and the difference in mean response was not
statistically significant.
Responses to Statement 20 were grouped according to
the Judging and Perceiving references of respondents.
Statement 20 read: I am most likely to perform better
academically in AFIT educational situations that let me
concentrate on subjects that are important to me. The
structured environment that a Judging (J) type desires may
82

4-.seem to be too confining to a Perceiving type. Perceptive
(P) types would tend to be more comfortable in a flexible
atmosphere that allows them to concentrate on their chosen
interests, and therefore were expected to agree with the
statement stronger than Judging (J) types (8:54; 13:164).
Judging and Perceiving types both indicated a strong
agreement with this statement. The difference in mean
response was in the expected direction, but not
statistically significant.
Statement 23 was expected to show a stronger agreement
from Feeling (F) respondents when compared to Thinking (T)
respondents due to Feeling (F) types' greater concern for
human relationships. Statement 23 read: I am most likely
to perform better academically in AFIT educational
situations that are more concerned with human relationships
and ideals instead of theories and facts. While Thinking
(T) types tend to make decisions impersonally (depending on
facts and logic to make decisions), Feeling (F) types tend
to be less analytical and more concerned with people and
ideals (8:74,75). The mean response of both type groups
indicated neither agreement nor disagreement with this
statement, but the difference of a mean response was in the
expected direction.
83r"K,

Statements Concerning Important Differences in Learning
Styles and Instructional Techniqties -- Statements 26 through
35. The last ten statements requested respondents indicate
agreement or disagreement with statements concerning learning
activities or situations that were important to the respon-
dent. Statistically significant differences were found for
Statements 30, 34, and 35. Analysis for all three state-
ments was performed by differentiating respondents according
to the SN index.
Statement 30: It is important for me to have an
indepth explanation provided on how to apply theory.
Discussion: According to the relationship between
learning activities and the perception processes index (SN)
of the MBTI, Sensing (S) types are expected to have more
problems grasping the abstraction of theory. Sensing types
prefer to have an established method of solving a problem
step by step. Therefore, indepth explanations on the
* application of theory would be more important. In addition,
Sensing types are more prone to have comprehension problems
following partial explanations that would be intuitively
obvious to an Intuitive (N) type (13:154). Therefore,
Sensing types were expected to show a stronger agreement with
this statement.
Results: The results from Statement 30 indicated the
Sensing (S) type group showed an overall agreement wit. this
statement. The mnean rating of the S type group was 2.5714.
84

Table XIII
Preferred Academic Environment Questionnaire Section Three
Statements with Significant Differences
Statement 30 (S < N expected)
Type Group N Mean Rating Std Dev
S 77 2.5714 1.219
N 19 3.3158 1.734
* Pooled Variance Estimate *
T Value Degrees Of Freedom 1-Tail Prob
2.18 94 0.016
Statement 34 (S < N expected)
Type Group N Mean Rating Std Dev
S 77 1.6623 0.926
N 19 2.2105 1.316
* Pooled Variance Estimate **
T Value Degrees Of Freedom 1-Tail Prob
2.11 94 0.019
Statement 35 (S < N expected)
Type Group N Mean Rating Std Dev
S 77 1.8052 0.828
N 19 2.5263 1.541
-* Pooled Variance Estimate *
T Value Degrees Of Freedom 1-Tail Prob
2.80 94 0.003
85
.4 ... ',. . ..-.. "...". .... ".....' "v--..... .'.. ..... v..... ... '-..-, -. -" . - . -

The Intuitive (N) type group also showed an overall agreement
with this statement with a mean rating of 3.3158. While it
seems important to both type groups to have indepth
explanations provided, the SPSS T-Test output indicated the
stronger agreement of the Sensing types was statistically
significant with a one-tailed probability of 0.016.
Statement 34: It is important for me to have
information presented in an orderly, organized and systematic
manner.
Discussion: According to Gordon Lawrence in People
Types and Tiger Stripes, Margaret K. Morgan identified
Sensing (5) types as linear learners who prefer a "step by
step sequential approach to learning" (8:49). In comparison,
Intuitive (N) types tendency to quickly grasp meaning and
relationships can result in less of a need for a systematic
explanation of what is more obvious to them (13:156). It was
therefore expected Sensing types would indicate a stronger
agreement with Statement 34.
Results: The results indicated that as a group, the
Sensing (5) types expressed a strong agreement with this
statement, with a mean rating of 1.6623. The Intuitive (N)
type individuals also showed an overall agreement with this
statement. The mean rating of the N type group was 2.2105.
While it appears important to both type groups to have
information presented in an orderly, organized, and
systematic manner; the one-tailed probability of 0.013 showed
86

there was a statistical significance to the stronger
agreement of the Sensing group in comparison to the N types.
Statement 35: It is important for me to see the
practical value of theory.
Discussion: According to Mary H. McCaulley, the
practical utility of knowledge is of more interest to Sensing
(5) students. In contrast, Intuitive (N) types can be
expected to be more motivated in understanding theory than
applying it (9:135). It was therefore expected that Sensing
types would indicate a stronger agreement with this
statement.
Results: The results indicated that the Sensing (5)
type group strongly agreed with Statement 35. The mean
rating of the S type individuals was 1.8052. The mean rating
(2.5263) of the Intuitive (N) type group also showed overall
agreement with the statement. Even though it appears
Intuitive respondents also place an importance on the
practical value of theory, the T-Test results indicated the
stronger agreement of the Sensing group was statistically
significant with a one-tailed probability of 0.003.
Section Three Summary. The results from the third
section of the PAEQ indicated the Sensing/Intuitive (SN)
index was the only MBTI index that produced the expected
results for statements concerning learning activities or
situations important to the respondents. Even though Sensing
(S) types indicated a significantly stronger agreement f-r
87

A D-Ri6i @53 PERSONALITY TYPE ANALYSIS OF AIR FORCE INSTITUTE OF 2/2TECHNOLOGY SCHOOL OF (U) AIR FORCE INST OF TECH
I MRIGHT-PATTERSON AF8 OH SCHOOL OF SYST - R A CARTERUNLSIID SEP 85 ARFIT/GLM/LSM/85S-il F,'O 5/18 L
EEEEEEE7EhEEEEEEEEEohE

11111 ~1L .O52 1
MICROCOPY RESOLUTION TEST CHART
NATIONAL BUREAU OF STANDARDS-I963-A
, --.-.-. ° .,* *-. '. '., - . ,. '. ,*,.'. ,.- ." .f . , .... ' ,. . .. .. , I II
:.. .....;... ... . . .," ,. ,- ... ,. . ........ * .. .. '.,.. • .:.,*. ',... , .
three statements, a dichotomous response difference was not
found. Both Sensing (S) and Intuitive (N) types indicated
7:. they placed an importance on having indepth explanations
i--. provided on how to apply theory, on having information
presented in an orderly, organized and systematic manner, and
on realizing the practical value of theory. The difference
between mean responses for the remaining seven statements
were not statistically significant.
StaLement 26 was expected to result in a difference in
rating by Feeling (F) and Thinking (T) respondents.
Statement 26 read: It is important for me to receive positive
feedback on my performance, not just negative. It was
expected that the Feeling (F) types desire for approval and
concern for others in making their own decisions or
judgements would result in more importance being placed on
receiving positive feedback on their course work. In
comparison, the Thinking (T) types tendency to make
impersonal decisions based on logic would be expected to
decrease the importance of positive feedback (8:51). Even
though the Feeling (F) types's mean rating did indicate more
agreement, both type groups indicated agreement with
Statement 26 and the difference was not significant.
Statements 27, 28 and 29 were analyzed by grouping the
respondents according to their Extraversion (E) or
Introversion (I) preference. The three statements were:
27. It is important for me to have the choice of a
88

written assignment or an oral presentation.
28. It is important for me to have the opportunity to
talk over questions and ideas in classroom discussions.
29. It is important for me to have the choice to work
with others in group projects or to work alone.
Statements 27 and 29 were different from the other
statements in that they did not identify a situation that was
expected to be important to only one of the type groups.
Instead the statements were worded to determine if the
opportunity of selecting between a choice of situations, one
corresponding to an Extraversion (E) ';ype preference and one
corresonding to an Introversion (I) type preference, was
important to the respondent. Since there was not a predicted
direction of difference response means, these questions were
analyzed using a two-tailed t-test. Due to an Extravert's
A interest in the outward world of people and action, they tend
to prefer the opportunity to work with groups and feel more
comfortable making oral presentations. The Introvert's
preference to turn inward to reflect on ideas results in a
tendency to prefer working alone and on written assignments
(14:9,56). For each statement, both type groups indicated an
importance on having an opportunity to choose, but there was
no significant difference in mean responses. Statement 28
was expected to generate a greater agreement from the
Extravert (E) respondent due to their greater need to
verbalize their ideas in attempting to determine how others
89

.4',
react to their opinions (8:40). Both type groups indicated
overall agreement with Statement 28, but a greater
nonsignificant agreement was shown by E types.
The remaining three statements (31, 32, and 33) were
analyzed by differentiating respondents according to the
Judging/Perceiving (JP) index of the MBTI. The three
statements were:
31. It is important for me to know what I am account-
able for; when, how and by what standards.
32. It is important for me to write a paper on a topic
of my own choice.
33. It is important for me to have the opportunity to
be more flexible in following my interests.
Statement 31 is related to a Judging (J) type need for
"predictability and structure" and their interest in "what
they are accountable for" (8:54). Judging (J) types did
indicate a stronger agreement (nonsignificant), but both type
indicated it was important to understand what they are
accountable for. Statement 33 was expected to result in a
stronger agreement by the Perceiving (P) respondents due to
4,i their desire to follow their own interest and need for a
flexible environment (8:55). Statement 32 was based on the
same reasoning with the difference that it related only to
the choice of topic for a paper. Both type groups indicated
an overall agreement with each statement, but a nonsignif-
icant greater agreement was show by Perceiving (P) types.
90
4. ' . **m*,~* 4*~* - -.- -....--

Overall Analysis. From the overall results of the
Preferred Academic Environment Questionnaire presented 'in
Table XIV, it can be seen that of the 12 statements for which
the expected response differences were statistically
significant, 8 statements concerned differences relating to
the Sensing/Intuitive (SN) index and 4 statements concerned
differences relating to the Judging/Perception (JP) index.
The only statements producing a clear cut agree versus
disagree dichotomy were the two statements concerning study
habits (Statements 1 and 8). Results from 5 statements (4,
5, 15, 16 and 19), indicated a significant difference in mean
response ratings with one type group agreeing or disagreeing
and the other type group's mean response indicating neither
agreement nor disagreement. The remaining 5 statements (21,
22, 30, 34 and 35), for which statistical significance was
found, had both type groups indicating an overall agreement.
Even though statistical differences were not found, it is
I, clear from the results that most statements did produce
differences in the exetddirection. The PAEQ statements
analyzed by differentiating respondents according to the
Thinking/Feeling (TF) and Extraversion/Introversion (EI)
preferences did not produce significant differences. It
therefore appears that for the areas addressed in the
questionnaire used, the SN and JP indices of the MBTI
identify the strongest differences in preferences for
instructional techniques and learning styles.
19
Z~si-91

Table XIV
00 iPreferred Academic Environment Questionnaire Results
ExpectedE Group I Group Expected Difference Signif-
Statement Mean Mean Difference Found icant
9 4.8571 4.9180 E < I Yes No
11 3.8857 4.0000 E < I Yes No
13 2.8000 2.9672 E < I Yes No
27 3.4857 3.2131 n/a n/a No
28 2.3143 2.6230 E < I Yes No
29 2.6000 2.6721 n/a n/a No
ExpectedS Group N Group Expected Difference Signif-
Statement Mean Mean Difference Found icant
2 3.9740 3.7368 S > N Yes No
3 3.2857 3.7895 S > N No No
5 3.3896 4.4211 S < N Yes Yes
10 2.6623 3.0000 S > N No No
12 2.4545 2.7368 S < N Yes No
14 1.9221 2.3158 S < N Yes No
16 2.8961 3.7368 S < N Yes Yes
17 3.1688 2.6842 S > N Yes No
18 3.4805 2.8421 S > N Yes No
19 3.5584 2.8947 S > N Yes Yes
21 2.0519 2.9474 S < N Yes Yes
22 3.1429 2.3158, S > N Yes Yes
24 4.7792 4.4737 S > N Yes No
92

Table XIV (continued)
ExpectedS Group N Group Expected Difference Signif-
Statement Mean Mean Difference Found icant
25 2.8312 3.2632 S < N Yes No
30 2.5714 3.3158 S < N Yes Yes
34 1.6623 2.2105 S < N Yes Yes
35 1.8052 2.5263 S < N Yes Yes
ExpectedT Group F Group Expected Difference Signif-
Statement Mean Mean Difference Found icant
23 4.1053 3.5500 T > F Yes No
26 2.1447 1.7500 T > F Yes No
ExpectedJ Group P Group Expected Difference Signif-
Statement Mean Mean Difference Found icant
1 3.1507 4.6522 J < P Yes Yes
4 3.9863 5.1739 J < P Yes Yes
6 2.7260 3.0435 J < P Yes No
7 2.9178 2.5217 J > P Yes No
8 3.3973 4.8261 J < P Yes Yes
15 1.7534 2.2609 J < P Yes Yes
20 1.8219 1.5652 J > P Yes No
31 1.8356 2.1739 J < P Yes No
32 2.9041 3.0870 J > P No No
33 2.4521 2.0870 J > P Yes No
93

Summary
-" This chapter has presented the analysis of the findings
-" obtained in this research study. The next chapter will
discuss the resulting -onclusions as they correspond to the
specific research objectives of this study.
94
.- ,°%* S ~ . - 5 , - - - - - SS--

V. Conclusions and Recommendations
This chapter presents the conclusions reached by this
research effort. The conclusions are based on the results
and analysis previously discussed as they correspond to the
specific research objectives of this study. The chapter
concludes with recommendations for use of this research study
and possible further research topics.
First Research Objective Conclusions
First Research Objective: To determine if the
distribution of type for the AFIT School of Systems and
Logistics class of September 1985 (85S) provides indications
of a unique distribution of MBTI type.
Looking at the selection ratio of AFIT/LS 85S graduate
students in comparison to the CAPT graduate student data
base, a unique distribution of MBTI was found. With one
exception (INTP), all type categories with a significant
positive selection ratio (greater than 1.00) were found in
the ST type column of the MBTI type table. This finding was
reinforced by the type grouping selection ratio comparison
for the ST, SF, NF and NT grouping. A pattern also developed
for types with a significant selection ratio of less than
1.00. With one exception (ESFJ), all types which wereSsignificantly under represented in the AFIT/LS 85S sample
95
-•7 .- QW7
were found in the NF column of the MBTI type table. When
looking at the selection ratio comparison by type grouping
this pattern is again shown in the ST, SF, NF and NT
groupings.
Reviewing the percentage of respondents according to
type categories, it can be seen that a major portion of the
sample (45.45%) was found in two type cells -- ISTJ and ESTJ.
The four ST types account for 57.58% of the sample, while the
NF types account for only 5.3%. While Intuitive with Feeling
(NF) types were under represented, no identifiable pattern
was identified for the distribution of SF and NT types.
Therefore, it can be said that there is a unique distribution
of type for this sample. It is unique in that not only is
there a positive selection of ST types, but the ST types
represent the majority of the AFIT/LS 85S students sample.
Looking at the implication of this distribution of type,
according to the theory on which the MBTI is based, it is
possible to make some generalized statements about the over
and under represented types of the sample. The students
whose MBTI results indicate they have a preference toward
Sensing with Thinking (ST) can be expected to focus their
attention on concrete, verifiable facts which can be utilized
. in "hard headed, matter-of-fact impersonal analysis" (14:43).
The under represented Intuition with Feeling (NF) types can
be expected to focus their interest upon the of a situation,
especially when the NF individual can see the humanistic
96
.......... *'. * .-. *. ..-.. *.%**.I*

benefits of those possibilities (14:47).
At the more restrictive differentiation of types, the
information gained from this research provides some valuable
insights into the characteristics of the over represented and
majority types using only one MBTI index. Introverts (I) can
be expected to prefer to work alone and uninterrupted, often
with intense concentration. They can also be expected to
prefer and perform better on written assignments (8:71).
Sensing (S) types can be expected to be more comfortable
dealing with factual details that can be used in a systematic
manner to solve a "realistic and practical" problem (8:72).
Thinking (T) types can be expected to be analytical and
objective in their dealings with problems, often appearing to
be insensitive to other people's feelings (8:74). Judging
(J) types can be expected to prefer to control their
environment in a planned, orderly and decisive manner (8:76).
The under represented dichotomous types for each of these
indices can be expected to display opposite characteristics.
Second Research Objective Conclusions
Second Research Objective: To determine if a difference
in MBTI personality type has an affect on academic success as
measured by grade point average.
Significant differences in academic grade point averages
according to MBTI type preferences were not found. There are
a number of plausible explanations for this result. The lack
97
.

" of a significant difference could very well be due to the
lack of variance within the GPA's of the sample. In a
graduate program where students are expected to maintain at
least a 3.0 average and the highest GPA obtainable is a 4.0,
it is understandable not to find a large variance in mean
GPA's. Due to the small variance found in the sample it
would be naive to say that MBTI type preferences does not
have an affect on academic performance as measured by GPA.
Without speculating on other possibilities such as problems
with the methodology used, the safest conclusion that can be
reached is that this research study did not identify any
affect of MBTI type preference on grade point average.
If the sample would have allowed analysis of the full
MBTI type differentiation using all four MBTI indices
combined, it is conceivable that a difference might have been
found. The reason for this belief is that in combining all
four indices to differentiate the full 16 types, it is
possible the resulting types would have more strongly
reflected significant differences in ability, interest and
application. The failure of one index or two indices to
reflect a difference in mean GPA may well be due to lack of
identification of the total effect of preferences. The use
of all four indices may have provided that identification and
therefore a lack of significant difference in this research
98

study may be due to the limitations of this study and not of
the MBTI.
There is also the possibility that the AFIT selection
process only selects individuals who have successfully
learned how to compensate for any MBTI preferences that could
have negatively impacted on their grade point average.
Third Research Objective Conclusions
Third Research Objective: To determine if preferences
for instructional techniques and learning styles, according
to students' perception of.effectiveness and importance, can
- .be related to MBTI personality type.
Even though only 2 statements produced a clear cut agree
versus disagree dichotomy, 12 statements of the Preferred
Academic Environment Questionnaire identified significant
differences in respondent's perception of effectiveness and
importance of different instructional techniques and learning
styles. Of the 12 statements for which statistical
differences were found, 8 concerned predictable differences
due to the Sensing/Intuitive (SN) type preferences and 4
concerned predictable differences due to Judging/Perception
(JP) type preferences. It can therefore be concluded that of
the four indices of the MBTI, the SN and JP indices were
successful in identifying statistically significant
differences in statements concerning instructional techniques
and learning styles.
99

While statistical differences in the direction expected
were found for only 12 statements, it was encouraging to note
that with few exceptions, even the non-significant
differences were in the expected direction. Discounting the
two statements which were not analyzed according to an
expected difference in agreement according to type
(Statements 27 and 29), the only statements that did not
generate a difference in mean response in the expected
direction were Statements 3, 10, and 32. Statements 27 and
29 were intended to determine if the opportunity of selecting
between two stated options; one corresponding to an
Extraversion (E) preference and one corresponding to an
Introversion (I) preference, was more important to one type
in comparison to the other. Statement 3 concerned the effect
of difficult test questions at the beginning of a test.
Statement 10 concerned the effect of a good test grade on the
confidence of the respondent towards the next test.
*- Statement 32 concerned the importance of the option of
selecting a topic for a paper of their own choosing. It
*. should be noted that Statements 3 and 10 also had the weakest
relationship to MBTI theory -- being based on an inferred
relationship between statements determined to be related to
better grades in a study by McCaulley and Natter (13:178) and
predictions of better performance on tests by Intuitive (N)
types (13:156). Even including these two statements, 36.4%
of the 33 statements produced statistical significant
100
2 2' . 7

differences in the direction predicted by MBTI type
classification and approximately 81% of the statements with
nonstatistical significant differences were in the proper
direction according to predictions of educational differences
in relation to MBTI type. It can therefore be concluded the
MBTI does indeed relate to this samples' perception of the
effectiveness and importance of different learning styles and
instructional techniques.
Overall Conclusions
Relating the results of this research study back to the
problem statement in Chapter 1, even with the previously
discussed lack of results in the affect of MBTI type
preferences on academic grade point average, the MBTI did
indeed identify significant learning differences. With an
understanding of the distribution of types in the AFIT/LS 85S
class and the effect those type preferences have on the
AFIT/LS instructional-learning process, the problem of
enhancing instructional methods to more successfully meet the
needs of the students, the program objectives, and the Air
Force seems more obtainable.
Limiting factors had an impact on the ability of this
research study to investigate the full implications of MBTI
type preferences. The size limitations of a single AFIT/LS
graduate class did not allow the analysis of the complete
differentiation of the full 16 MBTI types. In addition, the
101

limited number of females in the sample population did not
allow investigation of the difference between female and male
respondents. This was unfortunate in light of the unexpected
lack of Feeling (F) types found in the limited female sample.
The timing of the MBTI survey may have also had an
impact on the accuracy of reported MBTI preferences. If
subjects had been surveyed prior to beginning their graduate
program, it may have been possible to avoid the possibility
that respondents were not reacting true-to-type due to the
AFIT academic environments influence. If respondents were
attempting to adapt to the AFIT/LS academic environment,
there is the possibility there MBTI results may have been
influenced.
A clear cut agree versus disagree differentiation of
respondent's mean response to Preferred Academic Environment
Questionnaire statements was not found. More information may
have been found if a correlation analysis was performed using
the MBTI index scores that indicate the strength of a
respondent's type preference.
Recommendations
The results of this research study have revealed a
number of patterns in the distribution of MBTI type, and the
instruction-learning environment for the AFIT/LS 85S class.
Follow up studies should be continued'to verify the validity
of these findings for future graduate classes. Follow up
102
I-.""""

studies should strongly consider using a larger sample
population and utilizing MBTI index scores. In addition,
surveying respondents prior to their start of the graduate
program and including an analysis of the type distrubition of
instructors may identify stronger implications for the
utilization of the MBTI. In attempting to determine the
reason for a lack of affect of MBTI type preferences on
academic grade point average, an investigation of the
adaptability of different types to a graduate academic
environment is an area that deserves consideration.
The results of this and any future studies should be
made available to all AFIT faculity with the hope that the
increased awareness resulting from these findings could be
put to use in developing classroom presentations and overall
planning of course work.
Workshops where students would be administered the MBTI,
and the results of an individual's MBTI explained, would
benefit the graduate students in understanding their own
. strengths and possible shortcomings in particular academic
situations. In understanding their reluctance to utilize
less preferred mental processes even in situations where they
would be more appropriate, a conscious effort could be made
to develop and apply less preferred processes more
successfully. This increased awareness may very well be the
strongest attribute of the MBTI. By being aware of the
possibility that students may have more problems
103

understanding certain concepts, instructors could increase
efforts to assure understanding is obtained. In addition,
V..-. the student could identify situations where increased efforts
on their own would be of benefit in assuring full
understanding.
The value of applying the MBTI in the many training
*environments of the Air force is an area of research which
also deserves strong consideration.
104
.. ::. °

Appendix A: Preferred Academic Environment Questionnaire
This q estimaire contains 35 individual qusticm. All questions sdxh d be
ansLered by indicating the ruixrical value tit corresponds to your degne of
agrnement with the statement about the AFIT ACIMC EWUCfl N1 on the line next to
the questicn. Ufe following nu rical scale is provided to irdicate your degree of
agreemnt:
1=- S W U AGREE 5 = SIL.Y DISAGRE2 = MERMEHY AME 6 = M!1MAM DISREE3= S[MMIL AGREE 7 - SUOU DISAGREE4 = N E E NOR DISAGRE
Section 1:
1. 1 gera-ty follow a study schedule and divide my time according to wh t I nee
to do each day.
2. Time restrictions on tests do not negatively effect my perforxunce.
* 3. Hard items at the beginning of a test do mt effect my ability to anser
easier item later.
4. 1 make systeautic notes andi/or outlines of clas readings.
105
. ,.,,., . , P. , ,. * , ' , .... ,. .. .. ,,...,. .... ,. .... .,.... ... '.

5. I do better on test questions concerning factual details than on questions
concerning synthesis and evaluation.
6. I do not neglect or have problem orgnizing what needs to be done with larger
class projects.
7. I do not sesn to take more lecture notes then necessary.
8. I do not let courseiork pile up, then cran at the last minute.
9. I study with a group for tests.
10. A good grade on one test increass my confidnce for the next n.
Section 2:
I am most likely to perform better acadeically in AR XAT CAL SIIATIONS that:
11. involve other students or take group effort.
12. let me work towrd goals step by step in an orderly vay.
13. let me talk over questions and ideas with others in classroom discussions.
14. present information in an orderly, organized and systemtic manner.
_ . ,,.-,;- ~ q --,-,,, -"-'-: -...--'...- .°- '.- .. : -. '-. ... .-.. -. .. ...-' .'- .. ."...' .'','- 1..-0-.6

15. let me kzow 4at I am accountable for; when, how, and by what standards.
16. require accuracy and careful attention to detail.
17. require initiative to plan and carry out new projects.
18. are wxre ccerned with u ideas and concepts than atmding to
factual details.
19. require me to figure out how to put theory into practice.
20. let me concentrate on subjects that are important to me.
21. give me ample opportunity to think out my ideas before I have to answr.
22. give me the opportunity to be creative and work with my own ideas.
23. are more concerned with human relatio ps and ideals instead of theories and
facts.
24. place time constraints on tests.
25. place the major e#MSIS on applications of theory and presents example
applications before exlaining the theory.
107
- . *°. . . . . . .

Secti.on 3:
IT IS DREAIT FR ME ID:
26. reeive positive feedback on my perfonnnce, rt just negative.
27. have the chice of a written assignment or an oral presetation.
*28. have the opportunity to talk over qu-scons and idess in classroon discussions.
29. have the cice to work with others in group projects or to work alone.
30. have an indepth explanation provided on how to apply theory.
31. know what I an accontable for; when, how, and by what standards.
32. write a paper on a topic of myan io ice.
33. have the opportunmity to be more flexible and follow my interests.
i-i 34. have informtion presented in an orderly orgmized and systematic nmaner.
35. see the practical value of tvry.
",P 108
-, \.'

Appendix B: CAPT MBTI Type Distributions
CAPT Male Graduate Students MBTI Type Distribution
N= 4731
I STJ I S FJ I NFJ I NTJ
N= 465 N= 322 N= 247 N= 298
%= 9.83 %= 6.81 %= 5.22 %= 6.30
I STP I S FP I NFP I NTP
N= 127 N- 142 N= 502 N= 256
%= 2.68 %= 3.00 %=10.61 %= 5.41
E STP ES F P ENFP ENTP
N= 91 N= 143 N- 450 N= 215
%= 1.92 %= 3.02 %= 9.51 %= 4.54
E S T J E S F J E N F J E N T J
N= 486 N= 340 N= 319 N= 328
%=10.27 %= 7.19 %= 6.74 %= 6.93
(9:B-18)
109
L " ,. , : ' j - . -. ? , . . . .- . .. .. - ? . .. ? . . . . . . - . . . -.- .. V .

CAPT Male Graduate Student MBTI Type Distribution
by Type Groupings
N= 4731
Type N%
E 2372 50.14
I 2359 49.86
5 2116 44.73
N 2615 55.27
T 2266 47.90
F 2465 52.10
J2805 59.29
P 1926 40.71
ST 1169 24.71
SF 947 20.02
NF 1518 23.19
NT 1097 23.19
I N 1303 27.54
EN 1312 27.73
is 1056 22.32
ES 1060 22.41
110 (9 :B-18)
a -7 * - .-- ,': -.

CAPT Female Graduate Students MBTI Type Distribution
N- 3918
I STJ I S FJ I NFJ I NTJ
N= 254 N= 385 N= 253 N= 166
%= 6.48 %= 9.83 %= 6.46 %= 4.24
I STP IS FP I NFP I NTP
N= 59 N= 141 N- 427 N= 146
%= 1.51 %= 3.60 %=10.90 %= 3.73
ESTP ESFP ENFP ENTP
N= 59 N- 132 N= 624 N- 162
%= 1.51 %= 3.37 %-15.93 %= 4.13
ESTJ ES FJ ENFJ ENTJ
N- 220 N= 355 N- 337 N- 198
%- 5.62 %= 9.06 %= 8.60 %= 5.05
(9:B-19)
U
°5

CAPT Female Graduate Student MBTI Type Distribution
by Type Groupings
N= 3918
Type N %
E 2087 53.27
I 1831 46.73
S 1605 40.96
N 2313 59.04
T 1264 32.26
F 2654 67.74
J 2168 55.33
P 1750 44.67
ST 592 15.11
SF 1013 25.85
NF 1641 41.88
NT 672 17.15
IN 992 25.32
EN 1321 33.72
IS 839 21.41
ES 766 19.55
'lk
(9:B-19)
112U
.-

Combined Type Distribution of CAPT Graduate Students
N= 8649
I ST J I S FJ I NF J I XT J
N= 719 N= 707 N= 500 N= 464
%=8.31 %= 8.17 %=5.78 %= 5.36
I ST P I S FP I NF P I NT P
N= 186 N.= 283 N= 929 N= 402
%= 2.15 %= 3.27 %=10.74 %= 4.65
E S TP E S F P E N FP E NT P
N= 150 N= 275 N= 1074 N= 377
%=1.73 %= 3.18 %=12.42 %= 4.36
E ST J E S FJ E NF J EX T J
N= 706 N= 695 N.= 656 N= 526
%=8.16 %=8.04 %=7.58 %= 6.08
(9 :B-20)
113

Combined Type Distribution of CAPT Graduate Students
by Type Groupings
N= 132
Type N %
E 4459 51.56
I 4190 48.44
S 3721 43.02
N 4928 56.98
T 3530 40.81
F 5119 59.19
J 4973 57.50
P 3676 42.50
ST 1761 20.36
SF 1960 22.66
NF 3159 36.52
NT 1769 20.45
IN 2295 26.53
EN 2633 30.44
IS 1895 21.91
"- 1826 21.11
(9:B-20)
114
4 : r'_. ; . ._ '_: - -- "'" '-i " " " """ " '""" "' "" -• '"" " .' " '

Appendix C: Preferred Academic Environment Questionnaire
Statements with No Significant Differences
Statement 2 (S > N expected)
Type Group N Mean Rating Std Dev
S 77 3.9740 2.109
N 19 3.7368 2.579
* Pooled Variance Estimate *
T Value Degrees Of Freedom 2-Tail Prob
-0.42 94 0.676
Statement 3 (S > N expected)
Type Group N Mean Rating Std Dev
S 77 3.2857 2.114
N 19 3.7895 1.843
** Pooled Variance Estimate *
T Value Degrees Of Freedom 2-Tail Prob
0.95 94 0.343
Statement 6 (J < P expected)
Type Group N Mean Rating Std Dev
J 73 2.7260 1.734
P 23 3.0435 1.796
* Pooled Variance Estimate *
T Value Degrees Of Freedom 2-Tail Prob
0.76 94 0.450
115
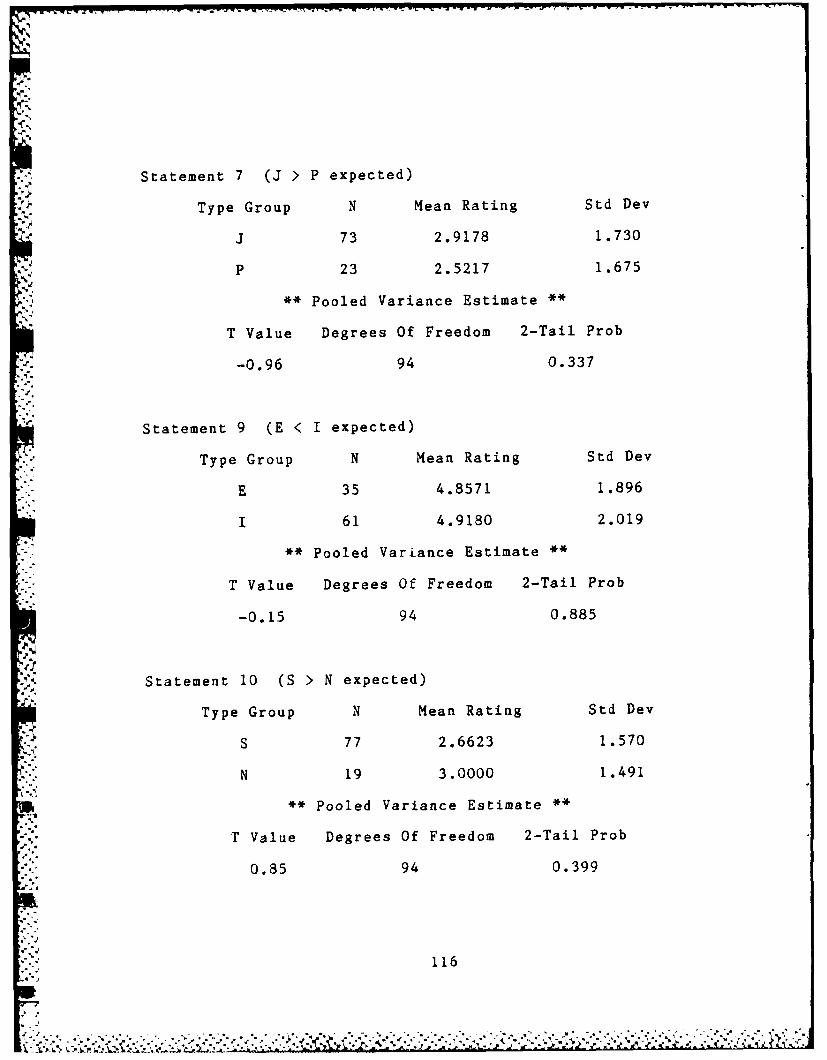
Statement 7 (J > P expected)
Type Group N Mean Rating Std Dev
J 73 2.9178 1.730
P 23 2.5217 1.675
** Pooled Variance Estimate **
T Value Degrees Of Freedom 2-Tail Prob
4. -0.96 94 0.337
Statement 9 (E < I expected)
Type Group N Mean Rating Std Dev
E 35 4.8571 1.896
I 61 4.9180 2.019
** Pooled Variance Estimate **
T Value Degrees Of Freedom 2-Tail Prob
-0.15 94 0.885
Statement 10 (S > N expected)
Type Group N Mean Rating Std Dev
S 77 2.6623 1.570
N 19 3.0000 1.491
** Pooled Variance Estimate **
T Value Degrees Of Freedom 2-Tail Prob
0.85 94 0.399
116
-tj°

'
Statement 11 (E < I expected)
Type Group N Mean Rating Std Dev
E 35 3.8857 1.728
I 61 4.0000 1.623
** Pooled Variance Estimate *
T Value Degrees Of Freedom 2-Tail Prob
-0.32 94 0.746
Statement 12 (S < N expected)
Type Group N Mean Rating Std Dev
S 77 2.4545 1.198
N 19 2.7368 1.727
-- Pooled Variance Estimate *
T Value Degrees Of Freedom 2-Tail Prob
0.84 94 0.404
Statement 13 (E < I expected)
Type Group N Mean Rating Std Dev
E 35 2.8000 1.431
I 61 2.9672 1.366
* Pooled Variance Estimate *
T Value Degrees Of Freedom 2-Tail Prob
-0.57 94 0.572
117
-. 4 •

Statement 14 (S < N expected)
Type Group N Mean Rating Std Dev
S 77 1.9221 0.970
N 19 2.3158 1.204
-" Pooled Variance Estimate *
T Value Degrees Of Freedom 2-Tail Prob
1.51 94 0.135
Statement 17 (S > N expected)
Type Group N Mean Rating Std Dev
S 77 3.1688 1.281
N 19 2.6842 1.057
* Pooled Variance Estimate *
T Value Degrees Of Freedom 2-Tail Prob
-1.52 94 0.131
Statement 18 (S > N expected)
Type Group N Mean Rating Std Dev
S 77 3.4805 1.627
N 19 2.8421 1.893
** Pooled Variance Estimate *
T Value Degrees Of Freedom 2-Tail Prob
-1.48 94 0.142
118
.-,.J.., --..-.-

Statement 20 (J > P expected)
Type Group N Mean Rating Std Dev
J 73 1.8219 1.135
P 23 1.5652 0.992
*Pooled Variance Estimate *
T Value Degrees Of Freedom 2-Tail Prob
. -0.97 94 0.333
Statement 23 (T > F expected)
Type Group N Mean Rating Std Dev
T 76 4.1053 1.457
F 20 3.5500 1.356
* Pooled Variance Estimate *
T Value Degrees Of Freedom 2-Tail Prob
-1.54 94 0.128
Statement 24 (S > N expected)
Type Group N Mean Rating Std Dev
S 77 4.7792 1.457
N 19 4.4737 2.091
* Pooled Variance Estimate *
T Value Degrees Of Freedom 2-Tail Prob
-0.75 94 0.457
119
-.- ',..

Statement 25 (S < N expected)
Type Group N Mean Rating Std Dev
S 77 2.8312 1.332
N 19 3.2632 1.485
-" Pooled Variance Estimate *
T Value Degrees Of Freedom 2-Tail Prob
1.24 94 0.219
Statement 26 (T > F expected)
Type Group N Mean Rating Std Dev
T 76 2.1447 1.140
F 20 1.7500 0.851
** Pooled Variance Estimate **
T Value Degrees Of Freedom 2-Tail Prob
-1.44 94 0.152
Statement 27
Type Group N Mean Rating Std Dev
E 35 3.4857 1.669
I 61 3.2131 1.392
* Pooled Variance Estimate *
T Value Degrees Of Freedom 2-Tail Prob
0.86 94 0.393
Ai 120

Statement 28 (E < I expected)
Type Group N Mean Rating Std Dev
E 35 2.3143 1.183
1 61 2.6230 1.143
** Pooled Variance Estimate **
T Value Degrees Of Freedom 2-Tail Prob
-1.26 94 0.212
Statement 29
Type Group N Mean Rating Std Dev
E 35 2.6000 1.265
I 61 2.6721 1.207
" Pooled Variance Estimate *
T Value Degrees Of Freedom 2-Tail Prob
-0.28 94 0.782
Statement 31 (J < P expected)
Type Group N Mean Rating Std Dev
j 73 1.8356 1.131
P 23 2.1739 1.403
;4* Pooled Variance Estimate *
' T Value Degrees Of Freedom 2-Tail Prob
1.18 94 0.241
121
N." V .LA°

Statement 32 (J > P expected)
Type Group N Mean Rating Std Dev
J 73 2.9041 1.600
P 23 3.0870 1.505
*Pooled Variance Estimate *
T Value Degrees Of Freedom 2-Tail Prob
0.48 94 0.629
Statement 33 (J > P expected)
Type Group N Mean Rating Std Dev
J 73 2.4521 1.354
4.P 23 2.0870 0.949
".-.
*Pooled Variance Estimate *
T Value Degrees Of Freedom 2-Tail Prob
-1.20 94 0.233
.6
X-'-I 23- . 87 1.50

Bibliography
1. Air Force Institute of Technology (AU). AFIT 1982 - 1984Catalog. Wright-Patterson AFB OH, 1982.
2. Buhmeyer, K. J. and A. H. Johnson. "Predicting SuccessIn A Physician - Extender Training Program,"
Psychological Reports, 42: 507-513 (1978).
3. Butler, Lester G. and Dayton Y. Roberts. "Relationshipof Personality Type And Reading Ability Among Pre- andIn- Service Teachers," Research In Psychological Type,5: 80-83 (1982).
4. Carskadon, Thomas G. "Sex Differences In Test-Retest*Reliabilities Of Continuous Scores On Form G Of The
Myers-Briggs Type Indicator," Research In PsychologicalType, 5: 78-79 (1982).
5. Carskadon, Thomas G. "Test-Retest Reliabilities OfContinuous Scores On The Myers-Briggs Type Indicator,"Psychological Reports, 41: 1011-1012 (1977).
6. Carskadon, Thomas G. and David D. Cook. "Validity ofMBTI Type Descriptions as Perceived by RecipientsUnfamiliar with Type," Research In Psychological Type,5:: 89-94 (1982).
7. Davies, Ivor K. Instructional Technique. New York:McGraw-Hill Publishing Co.,Inc, 1981.
8. Lawrence, Gordon. People Types and Tiger Stripes; APractical Guide to Learning Styles. (Second Edition).Florida: Center for Applications of Psychological Type.Inc., 1982.
9. McCaulley, Mary H. Application Of The Myers-Briggs TypeIndicator To Medicine And Other Health Professions:Monograph I. Contract 231-76-0051. Health ResourcesAdministration. U.S. Department of Health Education andWelfare, July 1981.
123
N.. . .'. -.* . . . . . . . . . . . . . . . .. ... . . . . . . . . . . . . . .... .. . . .... - -. . .

10. McCaulley, Mary and others. "Applications ofPsychological Type in Engineering Education,,,
Engineering Education, 69: 394-400 (February 1983).
11. McCaulley, Mary H. Executive Summary: Excerpt fromMonograph I: Application Of The Myers-Briggs TypeIndicator To Medicine And Other Health Professions.(1978). Contract 231-76-0051. Health ResourcesAdministration. U.S. Department of Health, Education andWelfare.
12. McCaulley, Mary H. "Psychological Types in Engineering:Implications for Teaching," Engineering Education, 66:729-736 (April 1976).
13. McCaulley, Mary H. and Frank Natter. Psychological(Myers-Briggs) Type Differences in Education. Report ofthe Governors Task Force on Disruptive Youth, Phase II.Tallahasse FL, Office of the Governors (1974).
14. Myers, I. B. with Peter B. Myers. Gifts Differing. PaloAlto: Consulting Psychologists Press, 1980.
15. Myers, I. B. Manual: The Myers-Briggs Type Indicator.Palo Alto: Consulting Psychologists Press, 1975.
16. Nie, Norman H. and others. SPSS: Statistical Package forthe Social Sciences. (Second Edition) New York: McGrawHill, 1975.
17. Nisbet, J. A. and others. "Predictors of AcademicSuccess With High Risk College Students," Journal ofCollege Student Personnel, 227-235 (May 1982).
18. Roberts, Dayton Y. "Personality and Media PreferencesAmong Community College Students," Research InPsychological Type, 5: 84-86 (1982).
19. Smith, Albert and others. "Self-Paced Instruction andCollege Student Personalities," Engineering Education,63: 435-440 (March 1973).
124
~~~~~Z~ Z :.;f.. JK

20. Van Scotter, Capt James R. Predictors of Success in AirForce Institute of Technology Resident Master's DegreePrograms: A Validity Study. MS Thesis, LSSR 4-83.School of Systems and Logistics, Air Force Institute ofTechnoloy (AU), Wright-Patterson AFB OH, September 1983(AD-A134 391).
21. Yeakley, Flavil R. "Communication Style Preferences AndAdjustments As An Approach To Studying Effects OfSimilarity In Psychological Type," Research InPsychological Type, 5: 20-29 (1982).
125
)"

VITA
Captain Richard A. Carter was born on 23 July 1955 in
Akron, Ohio. He graduated from high school in Akron, Ohio in
1973 and attended Miami University in Oxford, Ohio from which
he received a degree of Bachelor of Science in Secondary
Education in May 1977. Upon graduation, he received a
commission in the US Air Force through the ROTC program. He
was assigned to Malmstrom AFB, Montana, as a Minuteman
Missile Maintenance Officer, serving as Combat Targeting
Officer, Site Maintenance Officer, Officer-in-Charge
Recurring Training and Officer-in-Charge Missile Quality
Control. In 1981, Captain Carter attended and completed
missile combat crew training at Vandenberg AFB, California
and then returned to Malmstrom AFB, Montana serving as a
missile combat crew member and flight commander while
assigned to the 564th Strategic Missile Squadron. He then
served as a missile combat crew instructor and Chief of
Operation Branch in the 341st Strategic Missile Wing at
Malmstrom AFB, Montana until May 1984 when he entered the Air
Force Institute of Technology School of Systems and
Logistics.
Permanent Address: 102 Third Ave NW
* •Cut Bank, MT 59427
126

I.- <7-
UNCLASSIFIEDSECURITY CLASSIFICATION OF THIS PAGE
REPORT DOCUMENTATION PAGEis, REPORT SECURITY CLASSIFICATION lb. RESTRICTIVE MARKINGS
* UNCLASSIFIED_____________________
2s. SECURITY CLASSIFICATION AUTHORITY 3. DISTRIBUTION/AVAILABILITrY OF REPORT
Approved for public release;* 2 b. OECLASSIFICATION/DOWNGRADING SCHEDULE distribution unlimited
A.4 PERFORMING ORGANIZATION REPORT.NUMBER(S) 5. MONITORING ORGANIZATION REPORT NUMBER(S)
AFIT/GLM/LSM/85S-1 1____________________________
6s. NAME OF PERFORMING ORGANIZATION 6b. OFFICE SYMBOL 7a. NAME OF MONITORING ORGANIZATION(if applicable)
An ~ g -tj QAFIT/LS__ _ _ _ _ _ _ _ _ _ _ _ _ _ _ _ _ _ _ _ _
6c. ADDRESS (City. State and ZIP Code) 7b. ADDRESS (City, State and ZIP Code)
Air Force Institute of Technology
* Wright-Patterson AFB, Ohio 45433 _____________________
* SI. NAME OF FUNDING/SPONSORING 8b. OFFICE SYMBOL 9. PROCUREMENT INSTRUMENT IDENTIFICATION NUMBER* ORGANIZATION (if applicable)
Be8. ADDRESS (City. State and ZIP Code) 10. SOURCE OF FUNDING NOS. _______
PROGRAM PROJECT TASK WORK UNITELEMENT NO. NO. NO. NO.
1. TITLE (Include Security Classification)
12. PERSONAL AUTHOR(S)Richard A. Carter, B.S., Captain, USAF
13&. TYPE OF REPORT 13b. TIME COVERED 14. DATE OF REPORT (Yr.. Mo., Day) 16. PAGE COUNT
MSTessFROM-T 1985 September 13516. SUPPLEMENTARY NOTATION
17. COSATI CODES IS. SUBJECT TERMS (Continue on reverse if necessary and identify by block number)
FIELD GROUP SUB. GR.U9 Instruction, MrTI, Personality, Psychology
05 _10It. ABSTRACT (Continue on reverse if necesuary and identify by block number)
Title: PERSONALITY TYPE ANALYSIS OFW AIR FORCE INSTITUTE OF TECHNOLOGYSCHOOL OF SYSTEMS AND LOGISTICS GRADUATE DEGREE 85S CLASS
USING MYERS-BRIGGS TYPE INDICATOR
Thesis Chairman: Dennis E. Campbell,GM-13
Assistant Professor of Maintenance Management
ArForce 1nstituie ot Techniology (M67r
20. DISTRIBUTION/AVAILABILITY OF ABSTRACT 21. ABSTRACT SECURITY CLASSIFICATION
UNCLASSIFIED/UNLIMITED SAM ASRT.L OT IC USERS C1UNLASSIFIED22s. NAME OF RESPONSIBLE INDIVIDUAL 22b. TELEPHONE NUMBER 22c. OFFICE SYMBOL
(include Arwa Code P
Dennis E. Campbell, GM-13 513-255-4149 IAFIT/LSMSECURITY CLASSIFICATION OF THIS PAGE

UNCLASSIFIEDISECURITY CLASSIPICATION OP THIS PAGE
The objective of this research was to identify signif-icant learning differences in the AFIT School of Systems andLogistics (AFIT/LS) using the personality type theory devel-oped by psychologist Jung and identified by the Myers-BriggsType Indicator (MBTI).
The data were collected from graduate students ofAFIT/LS through the MBTI and a Preferred Academic EnvironmentQuestionnaire. Results of the MBTI categorized each of thesubjects into personality types. The Preferred AcademicEnvironment Questionnaire determined student study habits andtest taking preferences; AFIT situations which the studentfelt improved academic performance; and AFIT learningsituations which were important to the student. The datawere analyzed according to the distribution of MBTI type, theeffect of MBTI type upon grade point average, and studentpreference for instructional technique and learning styles asthey related to MBTI type. - ...
The results of the study showed that the majority of.students in the 85S class were of a MBTI type which had'identifiable characteristics relating to their preferredmethods of perceiving and making judgments. The researchresults also indicated that MBTI type had no significanteffect upon grade point average. Finally, the results ofthe study showed that MBTI type does relate to learningstyles and instructional technique preferences.
UNCLASSIFIED
SECURITY CLAWIPICATION OP THIS PAGE

FILMED
12-85
DTIC


![AND ENGINEERING 1/1 EEEEEEEEEEEEEE EEEmoEmoEEoiE ... › dtic › tr › fulltext › u2 › a139750.pdfically and abroad, the photoelastic method [7-8], the simulated material test](https://img.pdfslide.us/doc/110x75/5f22650b9d64bd7d3b730a39/and-engineering-11-eeeeeeeeeeeeee-eeemoemoeeoie-a-dtic-a-tr-a-fulltext.jpg)