Embed Size (px)
Citation preview
LLEE Working Paper Series
INFORMALITY AND PRODUCTIVITY: DO FIRMS ESCAPE EPL THROUGH
SHADOW EMPLOYMENT? EVIDENCE FROM A REGRESSION DISCONTINUITY DESIGN
Giuseppina Gianfreda Giovanna Vallanti
Working Paper No. 135 November 2017
Luiss Lab of European Economics Department of Economics and Business
LUISS Guido Carli
Viale Romania 32, 00197, Rome -- Italy http://dptea.luiss.edu/research-centers/luiss-lab-european-economics
© Giuseppina Gianfreda and Giovanna Vallanti. The aim of the series is to diffuse the
research conducted by Luiss Lab Fellows. The series accepts external contributions whose
topics is related to the research fields of the Center. The views expressed in the articles are those of the authors and cannot be attributed to Luiss Lab.
Informality and productivity: do firms escape EPL through
shadow employment? Evidence from a regression
discontinuity design∗
Giuseppina Gianfreda†
Università della Tuscia and LLEE
Giovanna Vallanti ‡
LUISS "Guido Carli" and LLEE
December 4, 2017
Abstract
Compliance with labour law has costs and benefits which may depend on the institutional
environment in which firms operate. Although several studies have documented a negative effect
of informality on firms’productivity and growth it is a fact that firms may resort to undeclared
employment to escape excessive tax or regulatory burden. We argue that firms may respond to
strict employment protection legislation through accrued informality thus (partially) offsetting
the negative effect of informality on productivity. We exploit the Italian dismissal legislation
imposing higher firing costs for firms with more than 15 workers and show that informality
reduces the turnover of formal jobs for firms above the 15 workers threshold; furthermore, while
the overall effect of informality on firms’productivity is negative, the differential effect for firms
above the threshold as compared to smaller firms is positive and significant.
Key words: tax evasion, EPL, productivity, firm size, RD estimation
JEL Classification: D02; D22; D24
∗We thank Barbara Petrongolo, Giovanni Notaro and Fabiano Schivardi for their useful comments and suggestionsand the seminar participants to the SIDE meeting in Turin and AIEL meeting in Trento. We are also grateful toValeria Foroni of the Italian Ministry of Justice and Silvia Dini of the Consiglio Superiore della Magistratura for theirhelp with the courts’data. All errors are ours.†Giuseppina Gianfreda, Università della Tuscia, DISUCOM, via Santa Maria in Gradi, 4. Phone: +390761357887.
Email: [email protected].‡Corresponding author: Giovanna Vallanti. Università LUSS "Guido Carli", Department of Economics and Fi-
nance, viale Romania 32, Rome 00197, Italy. Phone: +390685225910. Email: [email protected].
1 Introduction
Shadow economy is a common phenomenon in both developing and developed countries. It accounts
for 10% to 20% of GDP in most OECD countries, 20% to 30% in Southern European OECD
countries and in Central European transition economies (Schneider and Enste, 2000). The extent
of the shadow economy is closely related to the existence of an informal labour market. Even in the
more advanced countries where the shadow economy mostly assumes the form of underreporting of
income to the tax authorities, it involves a large use of undeclared (informal) labour.1 Informal work
is the norm in most-middle income countries, and it is also sizable in some high-income economies
(OECD, 2004, 2009). Thought in the latest group, informal employment generally takes the form of
under-declered work,2 nevertheless in some OECD countries (as Southern Europen and transition
countries) and, within countries, in some industries the share of wholly-undeclered workers may be
substantial.
Against the pervasiveness of the shadow economy, most empirical evidence shows that going
informal is detrimental for firms’ productivity even when it is just partial. This may occur for
a number of reasons. Informal firms have a limited access to capital markets (Cull et al., 2007)
and to market support institutions and law enforcement (World Bank, 2007). Moreover, they tend
to invest less both in physical and human capital (Gandelman and Rasteletti, 2013). If operating
informally implies costs for firms in terms of lower productivity, on the other side firms often resort
to informality to escape excessive regulatory pressure on their activity.3 Among the others, high
labour adjustment costs induced by rigid labour market regulation (e.g. employment protection
legislation) give incentives for firms to create (and destroy) jobs in the informal sector to avoid
severance costs and increase flexibility (Di Porto et al, 2016). As a consequence, in an overregulated
labour market, the added flexibility resulting from the use of informal workers may enable firms to
adjust more in response to business cycle fluctuations (Bosch and Esteban-Pretel, 2012) and operate
more effi ciently (Almeida and Carneiro, 2012).
The coexistence in many economies of formal and informal labour markets allows firms to hire
1 In this paper we refer as informal employment as workers who are engaged in the production of legal goodsand services and are not offi cially registered, are excluded from social security benefits and the protection affordedby formal labour market contracts. Analogously, we follow Schneider et al. (2010) and define informal economy ascomprising of market-based legal production of goods and services deliberately hidden from public authorities to avoidpaying taxes, social security, contributions, and to meet legal obligations/requirements and market standards.
2Under-declaration is the situation where employers decleare only part of the wages that are paid to employees(OECD, 2009).
3Ultimate causes of underground economy may thus be found within the institutional framework in which firmsoperate as, for example, the level of taxation and fiscal regulations (Loayza, 1996; Friedman et al., 2000; Loayza etal., 2005; Packard et al, 2012), the strictness of labour and product market regulations (Botero et al, 2003; Djankovet al., 2002; Loayza et al., 2005; Packard et al, 2012), poor institutions in general (Friedman et al., 2000; Scheneider,2000; Loayza et al., 2005; Packard et al, 2012). Furthermore, formality implies costs which go beyond the burden oftaxes, such as compliance with legal requirements or rent seeking bureaucracy (Sarte, 2000).
2
and dismiss workers in both the regulated (formal) and unregulated (informal) sector.4 The decision
of firms to adjust in the formal or informal sector (and the extent of such an adjustment) depends
on the trade-off between the costs associated to formal and informal employment. Formal contracts
have to abide with employment protection legislation (EPL) and other labour taxes. Informal jobs
avoid labour regulation, but they imply costs in terms of exclusion from certain public goods and
services (e.g., social infrastructure, property rights and the justice system), together with fines and
other non-monetary costs (e.g. loss of reputation, social stigma, etc.) in case of detection.
In this paper we analyze the effect of informality on turnover of formal jobs and productivity
of firms which are subject to different degree of labour market regulation (EPL). We claim that, in
presence of high firing costs, firms with an easier access to informal sector may benefit from greater
flexibility in their employment and production decisions which, in turn, lead them to operate more
effi ciently and increase productivity. As a result, the negative effect of informality on productivity
may be relatively lower for firms facing higher firing costs.
From the empirical side, the extent of underground activities and informal economy is diffi cult
to detect and measure. Since workers and firms who operate irregularly are unlikely to provide
information on their hidden activities, this makes it diffi cult to obtain direct data on informality at
firm level. Nevertheless, a number of reliable indicators has been produced in order to measure the
informal economy at a more aggregate level. In our analysis we use tax evasion estimated at the
province level as a proxy of the costs for firms and workers of going informal in that particular local
market. The low degree of tax compliance is related to a large dimension of the informal labour
market, which implies lower searching and hiring costs in the informal sector for firms, as well as,
in general, to a more positive attitudes towards informality.
The impact of informality on firms’ productivity is then analyzed by means of a regression
discontinuity design (RDD) that exploits the variation in EPL across Italian firms below and above
an employment size threshold (15 employees), the EPL provisions being more stringent for firms
above the 15-employee threshold. The discontinuous change in legislation at the threshold should
result in a discontinuous effect of informality on firms’behavior. We use this idea to study two
related aspects. First we consider whether in presence of a large share of informality, firms’ job
reallocation in the formal labour market drops just above the threshold, implying that the presence
of an informal sector reduces turnover of formal (regulated) jobs when firing costs are higher since
firms have an incentive to hire workers in the informal sectors.5 Second, we analyze weather the
4Although we acknowledge that there are industries/sectors that are essentially formal (such as the public sector),we follow Bosch andvEsteban-Pretel (2012) and argue that firm’s decision on adjusting in the formal and informalsecotrs concerns jobs with similar characteristics.
5There is a large empirical and theoretical literature which shows that strict EPL has a negative effect on bothjob creation and job destruction, reducing the overall turnover of regular jobs (Bertola et al, 1999; Blanchard and
3
negative effect of informality on the productivity of firms just above the threshold is relatively abated
as compared to the impact below the threshold.
To this purpose we use firm level detailed balance sheet data for a sample of small firms around
the 15 workers threshold. Focusing on small firms has two main advantages: i) the sample of firms
is homogenous enough as to preserve comparability between the treatment and the control group;
ii) the incidence of informality is higher for small firms. One reason is that as the marginal cost of
informality increases with firms’size due to concealment efforts (Fortin et al. 1997; Carfora et al.)
which may cause firms to operate below the optimal size to avoid the attention of fiscal authorities
(OECD 2004).
In order to identify the impact of informality proxied with tax evasion on firm’s labor adjustments
and productivity we have to tackle the problem of endogeneity. Indeed it may be that propensity to
tax compliance, labor adjustments and productivity are driven by local factors such as for example
the quality of institutions, cultural factors, etc.; in addition our results could be biased by reverse
causality, as tax compliance may be influenced by labor market conditions and firms’performance.
We address endogeneity in two ways: i) we include firm’s fixed effects; ii) we identify two instruments
for tax evasion, namely the judges’ turnover in civil courts and the timing of local (province)
elections. Both instruments are used separately and jointly.
As far as judges’turnover within judicial districts is concerned, it is well known that tax com-
pliance depends on the level of the enforcement of legislation, which in turn is related to courts’
effi ciency. One of the determinants of Courts’ internal organization has been shown to be the
turnover rate of the judges (Guerra and Tagliapietra, 2005). Judges’ turnover is not related to
our depend variables nor it is determined by local factors; indeed the transfer of a judge is the
result of independent decisions taken from different agents and approved on the bases of objective
circumstances provided for by the law. It is then exogenous with respect to our empirical model.
As to the timing of local (province) level elections, the impact of the occurrence of elections on
the probability of auditing is a well-established result in the literature (Besley et al. 2014; Skouras
and Christodoulakis, 2013); a change in the (local) ruling coalition can represent a shock to local
entrenched powers and by this way influence the enforcement of tax regulation. Although Italian
provinces have no tax competence (as most taxes are established at the central Government level
while local taxes are decided upon and collected by municipalities) tax auditing and collection is
carried out a province level, within the same boundaries of province constituencies. In addition,
province elections occur at intervals which are established by law (i.e. every 5 years), therefore the
timing of election is exogenous.
Portugal, 2001; Hijzen et al, 2013; Vindigni et al, 2015).
4
The panel dimension of our data also allows to control for unobserved heterogeneity among
sectors and provinces via fixed effects. Therefore, our main results are not driven by cross-sectional
differences among provinces, such as cultural, economic and social characteristics that may impact on
both labour market adjustments, firms’productivity and informality decisions. Finally, our results
are also robust to the inclusion of province-specific time dummies, which captures any time and
province variant omitted factors - such as local economic development and informal institutions -
which could influence both productivity and informality.
Our results show that lower costs of informality reduces labor reallocation rates in the formal
sector for firms facing higher firing costs confirming that they tend to adjust more on the informal
sector. Moreover, firms with higher firing costs experience productivity gains from informality
resulting from the opportunity to adjust in the unregulated sector. In other words, while the overall
effect of informality on productivity is still negative —in line with the literature —the incremental
effect of informality on labor productivity for firms facing higher firing costs (i.e. firms above the 15
workers’threshold) is positive. A quantification of our results suggests that moving from the 90th
to the 10th percentile of the informality distribution (i.e. from the province of Avellino to Gorizia
in our sample), would lead to a 10 percentage points decrease in the turnover of formal employment
(more than 50 percent of the average turnover) for firms above the threshold relative to smaller firms
and an increase of productivity of about 16 percent.
The rest of the paper is organized as follows. The next section discusses the theoretical framework.
Section 3 illustrates the institutional background and discusses the instruments. Section 4 presents
the main characteristics of the data. Section 5 sets out the empirical methodology. The main results
of the article are presented d in Section 6. In Section 7 we provide some robustness checks and
Section 8 concludes.
2 Informality, labour regulation and firm productivity
Three strands of literature contribute to explain the relationship between informality and firms’
productivity in presence of firing costs: (i) the literature studying the linkage between the informal
economy and the formal institutional and regulatory environment; (ii) the literature on the effects of
informality on firms’outcome; (iii) the literature focusing specifically on the effects of labor market
regulations on firms’outcome.
2.1 Informality and institutions
Institutions influence the decision of firms to go underground for two main reasons. First, the
compliance to offi cial rules implies excessive costs to firms, for example because of high tax rates,
overregulation, excessive bureaucracy or strict labour legislation; second, institutions are weak, as
5
in presence of corruption or bad legal environment. Both types of reasons may coexist, and often
do, as shown by a large body of empirical literature.
Focusing on Latin America Loayza (1996) shows that the size of the informal sector depends
positively on the tax burden and on labour market restrictions and negatively on the quality of
government institutions such as the quality of bureaucracy, corruption and the rule of law. In a
study concerning 69 countries, Friedman et al. (2000) provide evidence that over-regulation, weak
legal environment and corruption determine the size of the informal sector, undermining public
finance and the capacity of the state to enforce property rights. Considering 21 high developed
OECD countries. Schneider (2011) finds that tax policies and the social security burden are among
the main determinants of the shadow economy, followed by tax morale and the quality of state
institutions.
Restricting to the ambit of the labour market, the effect of taxes, labour regulations and social
security is often analyzed with respect to the substitution between the regulated and unregulated
employment (Schneide and Enste, 2000). Lemieux et al. (1994) show a negative elasticity of the
hours worked in the shadow (untaxed) economy with respect to the net wage rate in the offi cial
sectors; Botero et al. (2004) provide evidence that protective collective relation laws are associated
with a larger shadow economy. Using a moral hazard framework with credit rationing, Straub (2005)
demonstrates that labour market rigidities push firms to remain informal and reduce employment
in the formal sector. More recently, Di Porto et al. (2015) have documented a positive relationship
between labour market rigidities and the size of the shadow economy in around 30 countries.
Following this literature, we assume that in presence of high firing costs firms tend to adjust more
in the informal sector. However we take a step further and analyse the impact of firms’decision to
adjust informally - in order to avoid strict EPL - on productivity.
2.2 Informality and firms’outcome
Informality entails several types of costs: i) direct costs related to punishment or concealment costs
in case of unreported activities are detected; ii) constraints on firms’dimension as to the optimal
scale or to optimal capital intensity; ii) limited access to market supporting institutions and law
enforcement services The latter ranges from poor protection by the juridical system against crime
to a reduced capacity to enforce contracts and property rights, which also impairs firms’access to
capital markets
Loayza (1996) shows that the size of the public sector negatively affects economic growth by
increasing the number of activities which do not use public services or use them less effi ciently.
Several studies show that firms’size is negatively related to tax evasion (Dabla Norris et al. 2008);
one reason is that as the marginal cost of tax evasion increases with firms’size due to concealment
6
efforts (Fortin et al. 1997; Carfora et al.) which may cause firms to operate below the optimal size to
avoid the attention of fiscal authorities (OECD 2004). Focusing on developing countries, La Porta
and Schleifer (2008) provide evidence that unregistered firms are far less productive than formal
firms because of the reduced ability of their managers, higher cost of capital, and insuffi cient scale.
Although going informal entails important drawbacks for firms, it also allows to escape costs and
constraints related to the institutional environment. Therefore the final effect of firms’productivity
may be ambiguous. Tax evasion may be a way for smaller firms to get financing, so that smaller
firms tend to increase tax evasion when they have a limited access to financial markets (Beck. et al.,
2005; 2010). Sarte (2000) shows that when the informal sector arise as a response against predatory
and rent-seeking bureaucracy, it may be effi cient for firms to locate economic activity in this sector.
Almeida and Carneiro (2009) show that reduced informality caused by a stricter enforcement of
employment regulation constraints firms’size in Brazil and reduces productivity.
Our results conciliates the two views; we show that while the overall effect of informality on
firms’productivity is negative, the productivity loss is smaller for those firms facing higher firing
costs
2.3 Labour regulation, job turnover and productivity
Since the seminal contribution by Mortensen and Pissarides (1994), labour reallocation is considered
crucial in determining labour market outcomes through the capacity of the firm to quickly adjust to
exogenous shocks. In a world where agents (firms and workers) are heterogeneous and the matching
process between vacancies and workers is costly, when a shock hits the economy the desired allocation
of jobs among firms and sectors changes, leading to job destruction on the one hand and to the
creation of new vacancies on the other. Firms’capacity to reallocate labour depends on the strictness
of employment protection legislation (EPL); a higher degree of workers protection has been shown
to unambiguously reduce both job creation and job destruction (Hopenhayn and Rogerson 1993;
Mortensen and Pissarides 1994; Pissarides 2000).
A more controversial issue is how this effect translates into changes in productivity at firm level.
On the one hand, in a standard search and matching model, the presence of dismissal costs will reduce
the productivity threshold at which workers and firms decide to terminate their relationship, and
this causes a decrease in firms’average productivity. On the other, given that the worker-vacancy
match implies the presence of quasi-rents, which are typically allocated between workers and firms
through a Nash bargaining mechanism, an increase in firing costs reduce firms’outside options.6
This induces a rise in the reservation productivity (below which firms do not hire) and potentially
6When a firm is bargaining the wage with a continuing employee, the threat point in the bargaining process is thevalue of an unfilled vacancy minus the firing cost that the firm must pay if the negotiation is not successful.
7
increases firm’s average productivity since less productive matches are not realized (Lagos 2006;
Autor 2007).
There are other channels through which the presence of dismissal costs can impact firms’pro-
ductivity. When firing is costly, the firm has a lower incentive to undertake risky investments with
high returns and high risk of failure in order to minimize the likelihood of paying firing costs. In this
respect, Bartelsman and Hinloopen (2005) find that EPL has a significant negative effect on invest-
ments in ICT. Analogously, Saint-Paul (2002) argues that high firing costs may induce secondary
innovation that improves existing products rather than introducing more innovative ones. Capital
accumulation is another channel through which the extent of firing costs may affect productivity.
Again, an increase in firing costs has an ambiguous effect on capital to labour ratio. On the one
hand, stricter dismissal rules may induce a substitution effect from labour to capital (Besley and
Burgess 2004). On the other hand, EPL strengthens workers’bargaining power and exacerbate hold-
up problems related to the investment activity, resulting in less investment and capital stock per
worker (Bertola 1994; Garibaldi and Violante 2005). Finally, dismissal costs influence productivity
since it affects employees’behaviour and incentives. Belot, Boone and Van Ours (2007) show that an
increase in the stability of the employment relationship induces to invest in productivity-enhancing
human capital, which would otherwise be suboptimal because of the hold-up problem. Conversely,
by using a standard model of effi ciency wages Ichino and Riphahn (2005) claim that when firing
become more costly for the firm workers tend to exert less effort since there is less threat of layoff
in response to shirking.
3 The institutional background and the identification strategy
3.1 Employment protection legislation and the 15 employees threshold
According to Italy’s Statuto dei Lavoratori, passed in 1970, an individual dismissal is legal only when
it satisfies a just cause, e.g. it can be justified by an objective reason (concerning the production
activity for example) or subjective reasons, which are mainly related to misconduct on the part of
the worker. The worker has always the right to appeal the firm’s decision and the final outcome
ultimately depends on the court’s ruling on the specific case. If the worker does not appeal the firing
decision, or if the dismissal is ruled fair, the legislation does not impose any severance payment to
the firm.7 Conversely, when the dismissal is ruled unfair, the judge imposes a specific compensation
on the firm.
The maximum compensation to which unlawfully fired workers are entitled to varies with firm
size in two important dimensions. For firms with less than 16 employees, the unfairly dismissed
7When the layoff is ruled fair, a common practice in Italy is that the labour union pays all the legal costs.
8
worker must be compensated with a fixed severance payment that varies between 2.5 and 6 months
of salary independently on the length of judicial procedure and with no obligation of reinstatement of
the dismissed worker. Conversely, for firms with more than 15 employees, to which Article 18 of the
Statuto dei Lavoratori applies, the worker is entitled to a compensation equal to forgone wages, social
security and health insurance contributions for a period from the date of the dismissal to the judicial
settlement of the case (with a minimum of 5 months and with no upper limits). Moreover he/she
can choose either to be reinstated in the firm or to be paid an additional financial compensation of
15 months of salary.8 This implies that: (a) firing costs for firms above the 15 employees threshold
are always higher than those for smaller firms; and (b) the cost of unfair dismissals increases with
the duration of the labour trial only for firms with more than 15 employees .
A number of papers have exploited the discontinuity in EPL at the 15 employees threshold in
Italy. These studies are mainly focused on identifying the overall effect of EPL on firm’s employment
decisions and productivity.9 Differently, our empirical strategy allows us to identify the extent to
which informality affects firms’productivity in different firing costs regimes. More specifically, our
identification scheme is based on the idea that the costs of informality are different for firms below
and above the threshold, i.e. firms subject to a stricter EPL may benefit more from hiring in the
informal sector. The discontinuity in firing legislation at the 15-employees threshold should allow
us to isolate the effect of interest (the differential impact of informality on productivity) from other
(unobserved) factors such as the degree of local economic development, quality of (local) institutions,
that may affect all firms within the same location.
3.2 The instrumental variables
In order to corroborate our results and control for the potential endogeneity of the indicator of
judicial ineffi ciency, we also present two-stage least squares (2SLS) estimates using two instruments
for the duration of labour trials: (1) the judges’turnover in judicial districts and (2) the timing of
the local (province) elections.
8The recent reform of the Italian labour market, in force since July 18, 2012, has changed some of the rules relatedto the termination of the employment relationship. In particular, also for firms with more than 15 employees, it hasbeen restricted reinstatement to certain specific cases of unfair or unjustified dismissal and introduced an upper limitup to 24 months’salary to the compensation a firm has to pay in case of unfair dismissal. The change in legislationdoes not affect our estimates, since our data covers the period 2006-2010.
9Boeri and Jimeno (2005) study the effect of employment protection on lay-off probabilities by comparing smalland large firms. Garibaldi et al (2004), and Schivardi and Torrini (2008) assess the effects of employment protectionon the size distribution of Italian firms, by looking at the probability of firm size adjustments around the 15 employeethreshold. Similarly, Hijzen et al (2013) analyse the effect of different EPL provisions on the composition of workforce,worker turnover and productivity of firms above and below the 15 employees threshold. All these papers identify theeffect of employment protection by exploiting the fact that Italian firms with fewer than 15 employees are subject tolower dismissal costs than firms with more than 15 employees. Other studies exploit both the discontinuity in EPL atthe 15 employees threshold as well as the temporal variation in the legislation, in order to assess the effect of reformson job flows (Kluger and Pica, 2008), wages (Leonardi and Pica, 2013), productivity and capital deepening (Cinganoet al, 2015). Gianfreda and Vallanti (2017) show that stricter EPL due to labour trial delays reduce job reallocationrates and productivity for firms above the 15 workers threshold.
9
3.2.1 Judges’turnover
Tax compliance depends on the level of enforcement of legislation (detection and fines), which in
turn is related to the effi ciency of civil courts. It has been show that judges’turnover has a quite
strong impact on the effi ciency of Courts’ internal organization (Guerra and Tagliapietra, 2005).
Therefore this instrument is correlated with the extent of local informality through the effi ciency of
judicial courts and also satisfies the exclusion restriction as the transfer of judges from one offi ce
to another is the result of a number of decisions taken by agents at different levels of the judiciary
hierarchy who respond to different sets of incentives. The transfer generally follows a three-step
procedure: i) the publication of vacant positions to be filled ii) the request of the judge who is
willing to be transferred and occupy the vacant position; iii) the approval by the self-governing body
of the judiciary, the Consiglio Superiore della Magistatura (CSM). Judges’ turnover rate within
each districts depends on the number of vacant positions available which in turn is related to career
advancements or retirement. Once a vacant position is created, the judge who is willing to be
transferred has to apply to the CSM; as a general rule, judges cannot be transferred to a different
assignment or district without their consent.10 Once applications are received, the CSM decides on
the basis of a competitive procedure among candidates. The criteria for the CSM collegial decision
are the following: competence, which is assessed on the basis of the functions so far carried out and
the judge’s capacities; the judge’s health status and his/her family members’ (offsprings, spouse,
parents and brothers/sisters if leaving with the judge, in some cases relatives and relatives-in-law);
family ties; merit (which also depends on the fact that in the past the judge has occupied vacancies
for which an urgent procedure had been set up or vacancies for which no application had been
received); seniority.11 Therefore, the complexity of the transfer procedure, to which the decisions
taken by different agents contribute, is such that the turnover rate in each district ends up to be
independent from (local) factors that might also affect firm-level outcomes.
3.2.2 Local political elections
The influence of electoral cycle on fiscal choices has been widely investigated since Nordhaus (1975).
Recent literature on this topic follows two main approaches. A strand of contributions build on
models based on information asymmetries between voters and politicians following Rogoff and Sibert
10An important feature of the Italian judicial system is the principle of "inamovibilità", according to which ajudge can be transferred to a different Court or to a different assignment only upon his/her consent. The principleof "inamoviblità" is a constitutional provision aiming at assuring the independence of the judiciary, which could beundermined should a judge be compelled to quit his/her activity for suspension or transfer. There are some ecceptionsnamely the need to cover vacancies in cases established by law, as disciplinary actions or for reasons of "incompatibilitàambientale", i.e. the judge is considered incompatible with the workplace. The judge can appeal the CSM decisionin all cases.11See the "Circolare 15098 of November 30, 1993 and subsequent amendments. Health status and familiy ties are
not taken in consideration for top positions, such as for example the Supreme Court.
10
(1988) and Rogoff (1990): according to this line, politicians manipulate budgetary instruments to
signal their competency in electoral and pre-electoral periods. Another strand of literature focus on
tax choices as a tool to increase the probability of re-election; in this framework not only tax setting
but also the probability of auditing and controls can be influenced by the occurrence of an election.
On the empirical ground, focusing on German municipalities Foremny and Riedel (2014) show that
the growth rate of local business taxes is significantly lower in election periods while Skouras and
Christodoulakis (2013) find that around election audit activity by tax collector is reduced and
underreporting increases in Greece; Ronconi (2009) show that the occurrence of a political election
influence actual enforcement of labour legislation. In addition, other studies focus on the ruling
coalition attitude toward tax compliance of as a determinant of tax evasion: a change in the (local)
ruling coalition can represent a shock to local entrenched powers and by this way influence the
enforcement of tax regulation (Besley et al, 2014). Fantozzi and Raitano (2015) investigated tax
compliance in Italy as a result of a change in ruling parties and found an increase in self-employed
underreporting under centre-right coalition.
Building on these contributions, we instrument the tax gap at province level with a dummy
indicating the occurrence of a province election in the year. There are several reasons for choosing
province level elections. On the administrative point of view, the Italian territory is organized in
regions, provinces and municipalities.12 Although the Italian provinces have no a direct tax com-
petence (as most taxes are established at the central Government level while local taxes are decided
upon and collected by municipalities),t a tax auditing and collection is carried out a province level,
within the same boundaries of province constituencies (by the so called “Direzioni Provinciali”).
Therefore, we interpret the occurrence of a province election as a potential shock to the local estab-
lished powers. Elections can bring a switch in the local ruling coalition, which may influence firms’
expectation about the severity of tax enforcement and by this way tax compliance. In addition,
province elections occur at intervals which are established by law (i.e. every 5 years),13 therefore
the timing of election is exogenous and the time of elections is different across provinces.14
12From the administrative point of view, the Italian territory is organized in regions, provinces and municipalities.Provinces have administrative tasks in province areas and in inter municipality territory; they have coordination tasksand are in charge of the implementation of public works in various sectors, including the economic, productive, tradesectors; they carry out programming activity for the provincial territory.13 In the period under study the legislation regulating the election and the tasks of province level representatives
was the Testo Unico, G.U. n. 227 del 28 settembre 2000, s.o. n. 162/L. The legislation was reformed in 2014. Between2007 and 2010 elections occurred before the end of the natural term only in 13 provinces. In most cases anticipationwas due to the resignation of the President motivated by the choice to campaign in the Parliament election.14 In our sample period there are 98 elections episods: 8 in 2007, 20 in 2008, 68 in 2009 and 8 in 2010.
11
4 Data sources and descriptive statistics
4.1 Firms data
Firm level data are drawn from AIDA (Analisi Informatizzata delle Aziende Italiane) produced by
Bureau van Dijk (BvD). BvD collects balance sheet data from the national Chambers of Commerce.
The version of Aida used in our analysis includes all Italian firms that have reported their financial
statement to the national Chamber of Commerce in the period 2007-2010, for a total of more than
800,000 Italian firms operating in all productive sectors. Apart from balance sheet data, Aida
provides a wide range of financial and descriptive information (industry and activity codes, firm age,
etc.) and the number of employees. Moreover, AIDA gives information on the location of firms at
a municipality level, allowing the match of firms’data with the courts’database.
The Aida database has a drawback, as it does not allow to distinguish between newly created
firms and firms that simply enter the sample at a given period t but were already operating in the
period before; similarly, it is not possible to identify firms’closures from firms that exit the sample
for other reasons. Therefore, we have restricted the analysis to continuing firms, e.g. firms that
are in the sample for at least two consecutive periods.15 Given this limitation and after cleaning
the database from outliers and missing information, our final sample consists of around 160,000
private firms operating in both the manufacturing and non manufacturing sectors.16 Observations
are annual and cover the period from 2007 to 2010. We define job reallocation at firm level as the
absolute value of the change in employment between two consecutive periods divided by the average
employment between the two periods (see Capellari et al. 2011; Kugler and Pica, 2008, Autor et al,
2007):
JT =|nft − nft−1|12 (nft + nft−1)
Labour productivity is obtained as the log of value added per worker. To preserve comparability
between treatment and control groups, we further restrict the sample to firms within the interval
10—20 employees, yielding a sample size of slightly more than 50,000 observations (19464 firms).
Tables 3 shows the descriptive statistics.
15Our sample is therefore unbalanced and potentially includes entry and exit firms. In section XXX we providesome results obtained by using a balanced sample which includes only firms that are continuously observable everyyear from 2007 and 2010.16The sectors are: (1) Agriculture, forestry and fishing; (2) Mining and quarrying; (3) Food, beverages and to-
bacco;(4) Textiles; (5) Wood products; (6) Paper products, publishing and printing; (7) Refined petroleum, nuclearfuel and chemical products; (8) Rubber and plastic products; (9) Other non-metallic products; (10) Basic metalsand fabricated metal products; (11) Machinery and equipment; (12) Electrical and optical equipment; (13) Transportequipment; (14) Other manufacturing sectors; (15) Electricity, gas and water supply; (16) Construction; (17) Whole-sale and retail trade, Repairs; (18) Hotels and restaurants; (19) Transport and communications; (20) Other services.The financial and public sectors are excluded from the analysis.
12
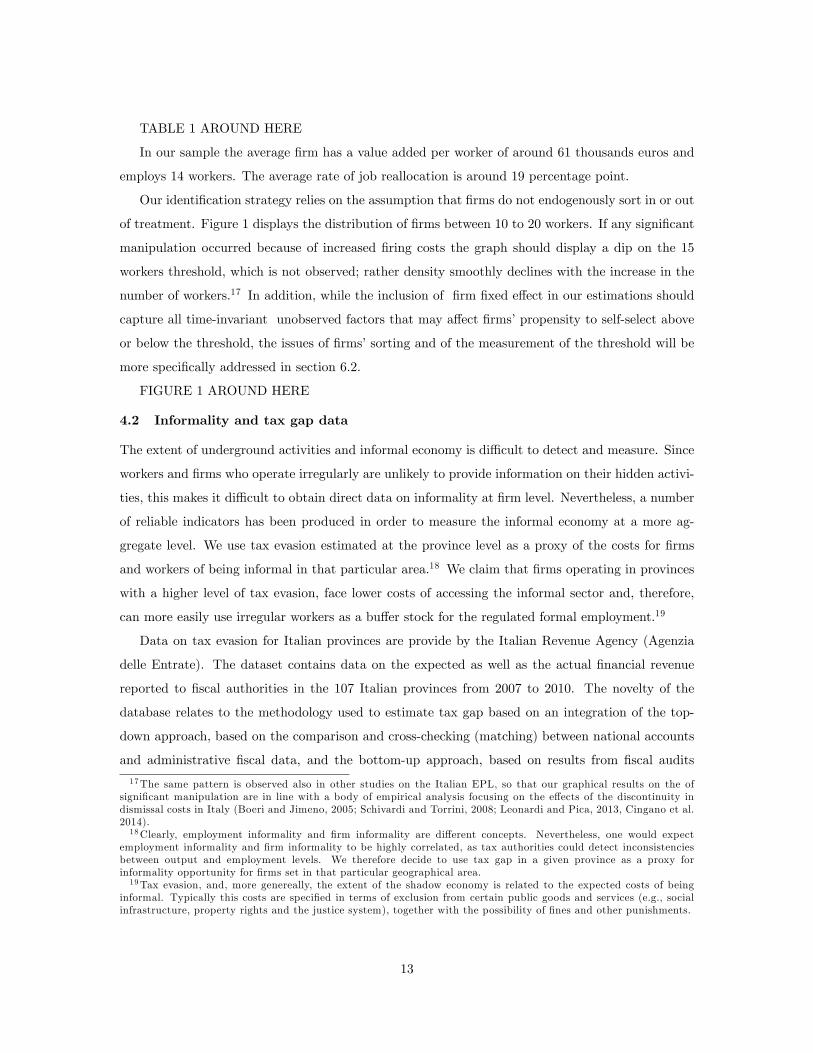
TABLE 1 AROUND HERE
In our sample the average firm has a value added per worker of around 61 thousands euros and
employs 14 workers. The average rate of job reallocation is around 19 percentage point.
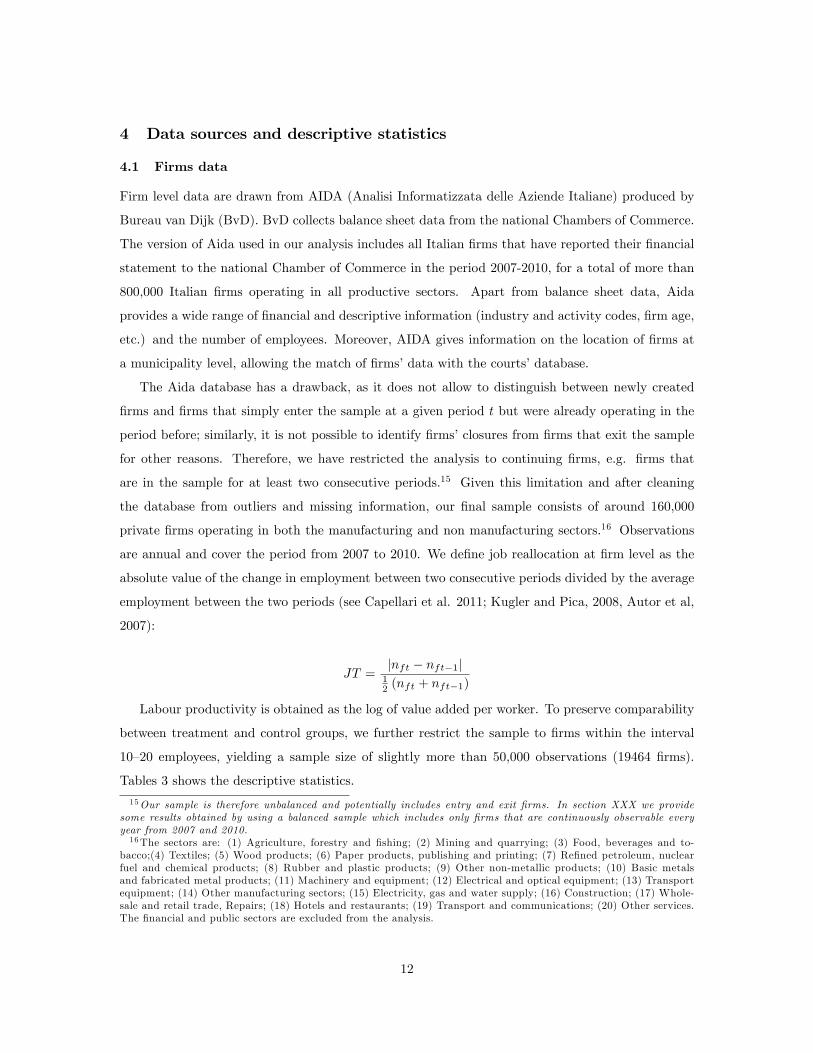
Our identification strategy relies on the assumption that firms do not endogenously sort in or out
of treatment. Figure 1 displays the distribution of firms between 10 to 20 workers. If any significant
manipulation occurred because of increased firing costs the graph should display a dip on the 15
workers threshold, which is not observed; rather density smoothly declines with the increase in the
number of workers.17 In addition, while the inclusion of firm fixed effect in our estimations should
capture all time-invariant unobserved factors that may affect firms’propensity to self-select above
or below the threshold, the issues of firms’sorting and of the measurement of the threshold will be
more specifically addressed in section 6.2.
FIGURE 1 AROUND HERE
4.2 Informality and tax gap data
The extent of underground activities and informal economy is diffi cult to detect and measure. Since
workers and firms who operate irregularly are unlikely to provide information on their hidden activi-
ties, this makes it diffi cult to obtain direct data on informality at firm level. Nevertheless, a number
of reliable indicators has been produced in order to measure the informal economy at a more ag-
gregate level. We use tax evasion estimated at the province level as a proxy of the costs for firms
and workers of being informal in that particular area.18 We claim that firms operating in provinces
with a higher level of tax evasion, face lower costs of accessing the informal sector and, therefore,
can more easily use irregular workers as a buffer stock for the regulated formal employment.19
Data on tax evasion for Italian provinces are provide by the Italian Revenue Agency (Agenzia
delle Entrate). The dataset contains data on the expected as well as the actual financial revenue
reported to fiscal authorities in the 107 Italian provinces from 2007 to 2010. The novelty of the
database relates to the methodology used to estimate tax gap based on an integration of the top-
down approach, based on the comparison and cross-checking (matching) between national accounts
and administrative fiscal data, and the bottom-up approach, based on results from fiscal audits
17The same pattern is observed also in other studies on the Italian EPL, so that our graphical results on the ofsignificant manipulation are in line with a body of empirical analysis focusing on the effects of the discontinuity indismissal costs in Italy (Boeri and Jimeno, 2005; Schivardi and Torrini, 2008; Leonardi and Pica, 2013, Cingano et al.2014).18Clearly, employment informality and firm informality are different concepts. Nevertheless, one would expect
employment informality and firm informality to be highly correlated, as tax authorities could detect inconsistenciesbetween output and employment levels. We therefore decide to use tax gap in a given province as a proxy forinformality opportunity for firms set in that particular geographical area.19Tax evasion, and, more genereally, the extent of the shadow economy is related to the expected costs of being
informal. Typically this costs are specified in terms of exclusion from certain public goods and services (e.g., socialinfrastructure, property rights and the justice system), together with the possibility of fines and other punishments.
13
(Carfora et al., 2015). The indicator of tax evasion (tax_gap) has been constructed as the relative
difference of the expected and the reported revenue, i.e.
tax_gap =(expected revenue− reported revenue).
expected revenue.
Table 2 reports some descriptive statistics concerning the tax gap over the sample period 2007
to 2010 for the 107 Italian provinces, which are ranked from the most to the least tax compliant.
TABLE 2 AROUND HERE
The data show great territorial heterogeneity in the extent of tax evasion; for example, the
differences of the tax gap between the province at the 10th (Avellino) and 90th (Gorizia) percentile
of the tax compliant distribution ’is around 0.26 percentage points. The standard deviation across
provinces is quite large, being more than one third of the average. The within-province time-series
variation of tax gap is also substantial: the standard deviation normalized on the mean ranges from
0.03 (in Grosseto) to 0.21 (in Firenze), with a sample average of around 0.10. This descriptive
evidence suggests considerable heterogeneity in informality both cross-sectionally and over time.
Descriptive evidence of the link between informality and productivity around the 15-employees
cut-off is provided in Figure 2, which plots labour productivity just below and above the threshold
cut-off in the two provinces, corresponding to the 10th and 90th percentiles of the tax gap distribution
respectively.
FIGURE 2 AROUND HERE
Figure 2 clearly shows a significant downward jump of productivity at the 15 employees threshold
in Gorizia where firms facing stricter EPL (firms above the threshold) cannot easily adjust in the
informal labour market. Conversely, the discontinuity around the threshold is smaller and not
statistically significant in Avellino, one of the province with the highest presence of informality in
Italy . A temptative interpretation of this visual evidence suggests that in the neighborhood of the
15-employees threshold labour productivity seems to respond less to changes in firing costs when
firms can more easily adjust their workforce using informal (not regulated) workers.
In the next sections, we will provide more rigorous evidence of the causal relationship between
informality and productivity by controlling for firms’characteristics, a number of fixed effects and
using instruments to address the potential endogeneity of our proxy for informal sector.
4.3 Data on judges turnover and elections
We draw data on the number of judges allocated to each judicial districts as well as on the number of
inbound and outbound judges from 2006 to 2010 from courts’self regulating body (CSM) database.
Judges turnover at district level is calculated as in Guerra and Tagliapietra (2015) according to the
14
following formula:
Turnover =100x(number of outbound judges+ number of inbound judges)
number of expected judges/
Data on elections at province level are published on the site of the Italian Ministery of the Interior
(Historical archive of the elections). From 2006 to 2010 there have been 110 province level elections;
table 3 shows the province where elections took place in every year.
TABLE 3 AROUND HERE
5 Empirical specification
We estimate the effect of informality on the turnover of formal jobs and labour productivity using
firm level data. At firm level, the size of firms plays a significant role in moderating the impact
of informality on firms adjustments and productivity. In our analysis, we exploit the discontinuity
of firing legislation at the 15-employees threshold to identify the causal effect of informality on
productivity.
The model specification is as follows:
yrft = β1tax_gaprt + β2size
rf + β3(taxgap
rt × sizerf ) + β4incomert
+Xrftγ +Dη + ηf + u
rft (1)
where the dependent variable yrft is either the job turnover or productivity (log of value added)
depending on specification; tax_gaprt is the informality index (in log); sizerf is a dummy variable
which takes value 1 for large firms i.e. firms with number of employees larger than 15, and zero
otherwise;20 Xrfst are a set of other controls which include a polynomial of a third degree in firm
size, ηf stands for firm fixed effects which "absorb" any time-invariant unobservable attributes at
firm level, and in particular the effect of the different (time-invariant) EPL regime that applies to
firms above and below the 15 employees threshold. The indices r and t refer to provinces and year
respectively. D is the matrix of dummies that includes, depending on the specification considered,
province-by-year21 and industry-by-year dummies while urt is the error term. The coeffi cient on
tax_gaprt gives the common effect of informality on small and large firms, while the interaction
term tax_gaprt ×sizerf captures the differential effect of informality induced by the more strict EPL20We define firms as small if they have less than 15 employees in all years and large if they have more than 15
employees in all years of the sample period. We also check the robustness of our results to a different thresholddefinition (see section 7.3) and to the inclusion in the sample of firms which move above and below the threshold overthe sample period. Results are available upon request.21The inclusion of province-by-year dummies allows to control for all province-specific time-varying characteristics
(for example, the quality of local infrastructure) which have the same effects across firms.
15
regimes on large firms productivity. The variable tax_gaprt is instrumented with the judges’turnover
in judicial districts and the timing of local (province) elections, while the interaction tax_gaprt×sizerfis instrumented by interacting each instruments with the dummy sizerf .
The two instruments will be used in the IV regressions both separately and jointly, thus producing
three sets of estimates. The results are remarkably robust to every specification. Moreover, in all
regressions we control for differences in the economic development at region level by including among
the regressors region per capita income (GDP).
Given that (time variant) differences in the regional underlying economic conditions (as GDP
per capita) may not necessarily capture all the factors affecting firm productivity (e.g. those factors
related to the institutional environment at large), in section 6.2 we show that our results are also
robust to the inclusion of a full set of province-year and sector-year dummies. In this way, we can
rule out any possible source of bias arising from (time and province variant) omitted factors - not
already captured by the regional income per capita - which could influence both informality and
productivity, thus yielding further support to our identification strategy.
6 Results
6.1 Baseline model
In Table 4 we report the effect of informality on the reallocation of formal (regulated) jobs at
firm level estimated as in equation 1, using all sets of instruments shown so far. As the variable
measuring informality varies both across provinces and time, we are able to control for any time-
invariant unobserved firm characteristics by the use of firm fixed effects, thus fully exploiting the
firm level dimension of the dataset.
TABLE 4 AROUND HERE
Tax evasion has no significant effect on labour adjustments for firms under the 15 workers thresh-
old while it has a negative impact for firms employing more than 15 workers. The coeffi cient of the
interaction term is always negative and significant and the overall coeffi cient estimated for large
firms is around 0.31 when both instruments are used in the estimation. Based on the coeffi cients
reported in column 3, the estimated differential effect for firms above the 15 employees threshold is
-0.405. This implies that moving from the 10th to the 90th percentile of the informality distribution
(i.e. from the province of Gorizia to Avellino in our sample), would lead to a 10 percentage points
decrease in the turnover of formal employment for firms above the threshold to smaller firms.
In all cases the two instruments are relevant, as the null that the equation is underidentified is
always rejected, while the F statistics is well above the rule of thumb threshold of 10 in all cases.
Furthermore, the overidentification test does not reject the null that the instrument are uncorrelated
16
with the error term. First stage regressions are displayed in table 6, while table 7 shows findings
from OLS estimates.22
Table 5 shows the effect of informality on firms’labour productivity.
TABLE 5 AROUND HERE
In all cases the overall effect of tax evasion on firms’productivity is negative and significant;
this result is in line with previous literature. However, the interaction coeffi cient is positive and
significant. This implies that in presence of a stricter employment legislation (firms above the
threshold), firms react by adjusting in the informal sector. This mitigates the negative impact of
informality on productivity.
Based on the coeffi cients reported in column 3, the estimated differential coeffi cient for firms
above the 15 employees threshold is 0.609, which implies that reducing the informality rate of
Avellino to the rate of Gorizia, would lead to a decrease of the average value added per worker in
firms above the threshold by around 16%.
6.2 Robustness
6.2.1 The inclusion of province/sectors by year dummies
The differential impact informality on job reallocation and productivity for firms above and below
the 15-employees threshold is remarkably robust to the inclusion of province-by-year dummies, as
shown in table 8. In this specification the main effect (tax_gap) is not included because it is absorbed
by the province-year dummies, which also capture all time variant and province specific factors that
may affect simultaneously the extent of informality and firms’productivity.23 The stability of the
coeffi cient on the tax_gap × size interaction term when adding province-year dummies provides
further reassurance that the estimated differential effect is not driven by any possible source of bias
arising from province-time variant omitted factors. The coeffi cients in columns 2 and 4 show that our
results are also robust to the inclusion of sector specific year dummies, implying that the estimated
effect is not driven by any industry specific time varying conditions.
TABLE 8 AROUND HERE
6.2.2 Robustness to different sample size and threshold specification
In Table 9 we check the robustness of our main results by widening the sample to include firms within
the size interval 6-25 employees. Our results are robust to the change in the size range (column 1
and 4): the estimated coeffi cients on the interaction (tax_gap × size) are similar to those in Tables
22The coeffi cients of the first stage regressions show that both instruments are correlated with our endogenousregressors confirming the relevance of our instruments.23 In this set of regressions the identification of the effect comes entirely from the differential in the EPL provisions
for firms above and below the threshold.
17
4 and 5, confirming the relative negative effect of informality of the turnover rate of regulated jobs
and the positive effect on productivity in the firms facing higher firing costs.
TABLE 9 AROUND HERE
An additional concern may be that the 15-employees threshold is imprecisely estimated at firm
level due to the complex calculation of the workforce, in particular because of presence of part-time
workers (see for a discussion Hijzen et al., 2014) 24 . In order to address this problem, we check
the robustness of our results to the exclusion of firms between 14/15 and 16/17 employees from the
sample. We therefore compare the effect of informality on labour adjustment and productivity of
firms between 5 and 13/14 employees (control group) and firms between 17/18 and 25 employees
(treatment group). Those firms are suffi ciently above and below the threshold to avoid the problem
of measurement error in the estimation of the size cut-off. Results are remarkably robust to this
change (columns 2, 3, 5, 6).
6.2.3 Firm growth regressions
The validity of the RDD rests on the assumption that firms do not self select above or below the
threshold; in other terms we have to exclude that firms may manipulate the number of workers in
order to escape strict EPL or that informality influences firms manipulation. As in Schivardi and
Torrini and Hijzen et al. (2008)25 , we check for the potential sorting induced by informality by
estimating the following linear probability model for the probability of growth of firms around the
threshold:
gft = Sftγ + (Sft × tax_gaprt )δ +Xftβ +Dϕ+ ηf + urft (2)
where gft = 1 if firm f in year t has a larger size than in t − 1. The term Sft denotes a set of
size dummies for firms with 13, 14 and 15 employees and tax_gaprt is our variable for informality
at province level. The matrix Xft includes a set of controls at firm level such as a third-degree
polynomial in firm size. Finally, we also include firm fixed effects to account for firm-specific time-
invariant factors that may affect firms’propensity to grow. We instrument the interactions (Sft ×
tax_gaprt ) with the two instruments (interacted with the size dummies) already used in our baseline
specifications (e.g. judges’turnover rates and a dummy for local elections). The results are reported
in Table 10.24As in Schivardi and Torrini (2008), Garibaldi et al. (2004) and Gianfreda and Vallanti (2017) our measure of
firm size does not distinguish between full and part time workers. However, the problem of misclassification due topartimers have been shown to be relatively negligeable if the interval in firm size is not too short, ranging from 2.7 to5.8% from 5-25 to 11-20 firms size (Hijzen et al. 2013).25The result that EPL provisions do not affect firms propensity to grow is not new in the empirical literature. See
among the others, Cingano et al (2015), Leonardi and Pica (2013) and Schivardi and Torrini (2005) which examinethe effect of EPL on firms’size distribution below and above the 15 employees-threshold in Italy.
18
TABLE 10 AROUND HERE
Column 1 shows that the probability of expansion of firms just below 15 employees is not sig-
nificantly different from that of other firms.26 Moreover, all the interaction terms are not signifi-
cant, implying that informality do not affect such a probability. Columns 2- 4 report the results
obtained splitting the sample in different productivity percentile and once again the growth prob-
ability for firms just below the threshold is not significantly affected by informality in any of the
sub-samples. These results confirm that informality does not affect significantly the propensity to
grow in the formal sector around the 15-employee threshold and therefore self-selection of firms into
treatment/control.
7 Conclusions
We assess the impact of informality on labour market adjustments and then firm’s productivity. We
argue that in presence of high firing costs, informality may allow firms greater flexibility in their
employment and production decisions which, in turn, can lead them to operate more effi ciently and
increase productivity.
Exploiting the variability of the extent of tax compliance across Italian provinces and the discon-
tinuity of the firing legislation at the 15-employees threshold, we show that informality significantly
reduces the reallocation rate of regulated jobs. This provides some evidence of the substitution
between formal (regulated) jobs and jobs created in the informal sector for firms in operating in a
stricter EPL regime. Moreover, while the overall effect of informality on productivity is negative
— in line with the literature —the incremental effect of informality on labor productivity for firms
facing higher firing costs (i.e. firms above the 15 workers’threshold) is positive. This last result
suggests that firms operating in a highly regulated environment may get some benefit in terms of
productivity from adjusting in the informal sector.
References
[1] Aghion, P., Fally T. and S. Scarpetta, (2007). “Credit constraints as a barrier to entry and
post-entry growth of firms.”Economic Policy, 22, 52, 731-779.
[2] Almeida, R.. and P. Carneiro, Enforcement of labour regulation and firm size. Journal of Com-
parative Economics, 37 (2009) 28-46.
[3] Autor, D. H., W. R. Kerr and A. D. Kugler (2007). "Does Employment Protection Reduce
Productivity? Evidence From US States," Economic Journal, Royal Economic Society, vol.
117(521), pages 189-217 (6).
26This result is in line with that in other empirical studies for Italy on the effect of EPL discontinuity at the 15employees —threshold (see for example Schivardi and Torrini, 2008).
19
[4] Bartelsman, E. J. and J. Hinloopen (2005). "Unleashing animal spirits: ICT and economic
growth", in L. Soete and B. ter Weel (eds.), The Economics of the Digital Economy, Edward
Elgar Publishing
[5] Beck, T., A. Demirguc-Kunt, V. Maksimovic, Financial and Legal Constraints to Growth: Does
Firm Size Matter? The Journal of Finance, vol. LX No.1 (2005), 137-177
[6] Beck, T., C. Lin, Y. Ma, Why Do Firms Evade Taxes? The Role of Information Sharing and
Financial Sector Outreach. The Journal of Finance 69 (2010).
[7] Besley T., A. Jensen and T. Persson (2015), Norms, Enforcement and Tax Evasion, CEPR
Discussion Paper No DP10372, Center for Economic and Policy Research.
[8] Bertola, G. (1994). “Flexibility, investment, and growth.”Journal of Monetary Economics 34
(2), 215—238.
[9] Bassanini A., L. Nunziata and D. Venn (2009). "Job protection legislation and productivity
growth in OECD countries," Economic Policy, CEPR;CES;MSH, vol. 24, pages 349-402, 04.
[10] Belot, M., J. Boone and J. Van Ours (2004). "Does the recent success of some OECD countries
in lowering their unemployment rates lie in the clever design of their labor market reforms?,"
Oxford Economic Papers, Oxford University Press, vol. 56(4).
[11] Belot, M., J. Boone and J. Van Ours (2007). "Welfare-Improving Employment Protection",
Economica, 74, 381—396.
[12] Bertola, G. (1992). "Labor Turnover Costs and Average Labor Demand," Journal of Labor
Economics, University of Chicago Press, vol. 10(4), pages 389-411.
[13] Bertola, G. (1994). "Flexibility, investment, and growth," Journal of Monetary Economics,
Elsevier, vol. 34(2), pages 215-238.
[14] Bertola, G. and R. Rogerson (1997). "Institutions and labor reallocation," European Economic
Review, vol. 41(6), pages 1147-1171.
[15] Besley, T. and R. Burgess (2004). "Can Labor Regulation Hinder Economic Performance?
Evidence from India," The Quarterly Journal of Economics, MIT Press, vol. 119(1), pages
91-134.
[16] Blanchard, O. and P. Portugal (2001). “What Hides behind an Unemployment Rate? Compar-
ing Portuguese and U.S. Labor Markets”, American Economic Review 91(1):187-207.
20
[17] Blanchard, O. and J. Wolfers (2000). "The Role of Shocks and Institutions in the Rise of
European Unemployment: The Aggregate Evidence," Economic Journal, vol. 110(462), pages
C1-33.
[18] Bloom, N (2009). "The impact of uncertainty shocks", Econometrica, vol. Vol. 77 (3), 623—685.
[19] Boeri, T. and J.F. Jimeno (2005). ‘The effects of employment protection: learning from variable
enforcement’, European Economic Review, vol. 49(8), pp. 2057—77.
[20] Bosch M. and J Esteban-Pretel (2012), Job Creation and Job Destruction in the Presence of
Informal Markets, Journal of Development Economics 98 pp. 270—286
[21] Botero J G, S. Djankov, R. La Porta, F. Lopez-de-Silanes, A. Shleifer (2004), “The Regulation
of Labour”, The Quarterly Journal of Economics, November
[22] Bottasso, A., Conti, M. and G. Sulis, (2016) "Firm Dynamics and Employment Protection:
Evidence from Sectoral Data," IZA Discussion Papers 9740, IZA.
[23] Chemin, M. (2012). "Does Court Speed Shape Economic Activity? Evidence from a Court
Reform in India," Journal of Law, Economics and Organization, vol. 28(3), pages 460-485.
[24] Chemin, M. (2009). "Do judiciaries matter for development? Evidence from India," Journal of
Comparative Economics, Elsevier, vol. 37(2), pages 230-250.
[25] Cingano, F., M. Leonardi, J. Messina and G. Pica (2015). “Employment Protection Legislation,
Capital Investment and Access to Credit: Evidence from Italy”, Economic Journal, forthcoming.
[26] Cingano, F., M. Leonardi, J. Messina and G. Pica (2010). “The Effect of Employment Protection
Legislation and Financial Market Imperfections on Investment: Evidence from a Firm-Level
Panel of EU Countries”, Economic Policy vol. 25, pages 117-163.
[27] Coviello D., Moretti L., Spagnolo G. and P. Valbonesi (2016). “Court Effi ciency and Procure-
ment Performance”2016, The Scandinavian Journal of Economics, forthcoming.
[28] Dabla Norris, E., M. Gradstein, G. Inchauste, What causes firms to hide output? The deter-
minants of informality. Journal of Development Economics 85 (2008) 1—27
[29] Davis, S. J., J. Haltiwanger and S. Schuh (1996). “Job Creation and Job Destruction”, MIT
press.
[30] Di Porto E., L. Elia and C.Tealdi (2016), Informal work in a flexible labour market, Oxford
Economic Papers, March pp.1—22
21
[31] Fantozzi, R. and M. Raitano, Political cycle and reported labour incomes in Italy: Quasi-
[32] Fortin, B., N. Marceau, L. Savard, Taxation, wage controls and the informal sector. Journal of
Public Economics 66 (1997) 293—312
[33] Friedman, E., S. Johnson, D. Kaufmann, P. Zoido-Lobaton, Dodging the grabbing hand: the
determinants of unoffi cial activity in 69 countries. Journal of Public Economics 76 (2000) 459—
493
[34] Djankov S. & R. La Porta & F. Lopez-De-Silanes & A. Shleifer (2003). "Courts," The Quarterly
Journal of Economics, 118(2): 453-517.
[35] Economic Forum (2014). The Global Competitiveness Report 2014-2015, Geneva,
www.weforum.org/gcr.
[36] Fabbri, D. (2010). "Law Enforcement and Firm Financing: Theory and Evidence", Journal of
the European Economic Association, 8(4): 776-816.
[37] Fraisse, H., F. Kramarz and C. Prost (2009). “Labor Court Inputs, Judicial Cases Outcomes
and Labor Flows: Identifying Real EPL”, Working papers 256, Banque de France.
[38] Gandelman N. and A. Rasteletti, (2013). "Credit Constraints, Sector Informality and Firm
Investments: Evidence from a Panel of Uruguayan Firms," Research Department Publications
IDB-WP-392, Inter-American Development Bank, Research Department.
[39] Garibaldi, P. and G., L. Violante (2005). ‘The employment effects of severance payments with
wage rigidities’, Economic Journal, vol. 115, pp. 799—832.
[40] Garibaldi, P., Pacelli, L., and A. Borgarello, ( 2004). Employment protection legislation and
the size of firms. Giornale degli economisti e annali di economia 63, 33—68.
[41] Giacomelli S. and C. Menon (2013). "Firm size and judicial effi ciency: evidence from the
neighbour’s court", Temi di discussione (Economic working papers) 898, Bank of Italy.
[42] Gomez-Salvador, R, Messina, J. and G. Vallanti (2004). "Gross job flows and institutions in
Europe," Labour Economics, Elsevier, vol. 11(4), pages 469-485.
[43] Guiso, L., Sapienza, P. and Zingales, L. (2004). "The role of social capital in financial develop-
ment", American Economic Review 94(3): 526 —556.
[44] Hijzen A., Mondauto L. and S. Scarpetta, (2013)."The Perverse Effects of Job-security Provi-
sions on Job Security in Italy: Results from a Regression Discontinuity Design," OECD Social,
Employment and Migration Working Papers 151, OECD Publishing.
22
[45] Hopenhayn, H. and R. Rogerson (1993). "Job Turnover and Policy Evaluation: A General
Equilibrium Analysis," Journal of Political Economy, vol. 101(5), pages 915-38.
[46] Ichino, A. and R. T. Riphahn (2005). ‘The effect of employment protection on worker effort:
a comparison of absenteeism during and after probation’, Journal of the European Economic
Association, vol. 3, pp. 120—43.
[47] ISTAT, (2001). La giustizia civile in Italia: funzionalità e processo di riforma, Informazioni n.3.
ISTAT, Rome.
[48] Jappelli, T, M. Pagano and M. Bianco (2005). "Courts and Banks: Effects of Judicial Enforce-
ment on Credit Markets," Journal of Money, Credit and Banking, vol. 37(2), pages 223-44.
[49] Koeniger W. and J. Prat, (2007). “Employment protection, product market regulation and firm
selection.”The Economic Journal, 117, F302-F332
[50] Kugler, A., and G. Pica, (2008). "Effects of Employment Protection on Worker and Job Flows:
Evidence from the 1990 Italian Reform", Labour Economics, Vol. 15 (1) pp. 78-95.
[51] Kugler, A. and M, Kugler (2009). Labor market effects of payroll taxes in developing countries:
evidence from Colombia , Economic Development and Cultural Change, vol. 57(2) pp. 335—58
[52] Kumar, K. B., R. G. Rajan and L. Zingales, (1999). "What Determines Firm Size?," NBER
Working Papers 7208, National Bureau of Economic Research, Inc.
[53] Lagos, R. (2006) "A Model of TFP", Review of Economic Studies, Wiley Blackwell, vol. 73(4),
pages 983-1007.
[54] Lederman D., N.V. Loayza, R.R. Soares (2005), Accountability and Corruption: Political In-
stitutions Matter. Economics and Politics, 17:1, pp 1-35
[55] Leonardi M. and G. Pica (2013). "Who Pays for it? The Heterogeneous Wage Effects of Em-
ployment Protection Legislation," Economic Journal, Royal Economic Society, vol. 123(12),
pages 1236-1278.
[56] Loayza, N.V. (1996), The Economics of the Informal Sector: A Simple Model and Some Em-
pirical Evidence from Latin America, Carnegie-Rochester Conference Series on Public Policy
45, 129-162.
[57] Messina, J. and G. Vallanti (2007). "Job Flow Dynamics and Firing Restrictions: Evidence
from Europe," Economic Journal, Royal Economic Society, vol. 117(521), 279-301, 06.
23
[58] Micco, A. and C. Page´s (2004). "Employment Protection and Gross Job Flows" Econometric
Society 2004 Latin American Meetings 295, Econometric Society.
[59] Mortensen, D.T. and C. A. Pissarides (1994). "Job Creation and Job Destruction in the Theory
of Unemployment," Review of Economic Studies, vol. 61(3), pages 397-415.
[60] Nordhaus, W., The political business cycle. Review of Economic Studies, 42, (1975) 169—190.
[61] Nunn N. (2007). "Relationship-Specificity, Incomplete Contracts, and the Pattern of Trade,"
The Quarterly Journal of Economics, MIT Press, vol. 122(2), pages 569-600, 05.
[62] Packard T., J. Koetll, C. E. Montenegro (2012), In from the Shadow. Integrating Europe’s
Informal Labour, The World Bank
[63] Palumbo G., Giupponi, G., Nunziata, L. and J. Mora-Sanguinetti (2013). Judicial performance
and its determinants, cross country perspective, OECD Economic Papers.
[64] Poschke, M. (2009). "Employment protection, firm selection, and growth," Journal of Monetary
Economics, Elsevier, vol. 56(8), pages 1074-1085.
[65] OECD (2006). “The Short-term labour market effects of structural reforms: Pain before the
gain?”The Employment Outlook, OECD, Paris.
[66] OECD (2013). “What makes civil justice effective?”, OECD Economics Department Policy
Notes, No. 18 June.
[67] OECD (2012). "Reviving growth and productivity", OECD “Better Policies”Series.
[68] Pissarides, C.A., (2000). Equilibrium Unemployment Theory, Cambridge MIT Press.
[69] Rajan, R. and L. Zingales (1998). “Financial Dependence and Growth”, The American Eco-
nomic Review 88: 559-586.
[70] Saint-Paul, G. (1993). "On the political economy of labor market flexibility", NBER Book Series
NBER Macroeconomics Annual, MIT Press, 151—96.
[71] Salvanes, K. G. (1997). " Market Rigidities and Labour Market Flexibility: An International
Comparison," Scandinavian Journal of Economics, vol. 99(2), pages 315-33.
[72] Sarte, P.-D., Informality and rent-seeking bureaucracies in a model of long-run growth- Journal
of Monetary Economics 46 (2000) 173-197
24
[73] Schaffer, M. E. (2010). "XTIVREG2: Stata module to perform extended IV/2SLS, GMM and
AC/HAC, LIML and k-class regression for panel data models," Statistical Software Components
S456501, Boston College Department of Economics, revised 22 Feb 2015.
[74] Schivardi, F. and R. Torrini, (2008). "Identifying the effects of firing restrictions through size-
contingent differences in regulation," Labour Economics, Elsevier, vol. 15(3), pages 482-511.
[75] Schneider, F. (2001) The Shadow Economy and Shadow Economy Labor Force: What Do We
(Not) Know?, IZA DP No. 5769
[76] Schneider, F. and D. Enste (2000), Shadow Economies: Size, Causes and Consequences, Journal
of Economic Literature 38/1, 73-110.
[77] it Skouras, S. and N. Christodoulakis, Electoral misgovernance cycles: evidence from wildfires
and tax evasion in Greece, Public Choice (2014) 159:533—559
[78] Venn, D. (2009), “Legislation, Collective Bargaining and Enforcement: Updating the OECD
Employment Protection Indicators”, OECD Social, Employment and Migration Working Paper,
No. 89.
[79] World Bank (2012). Doing Business 2011. Washington, DC: World Bank Group
[80] World Bank (2013). Doing Business 2012. Washington, DC: World Bank Group.
25
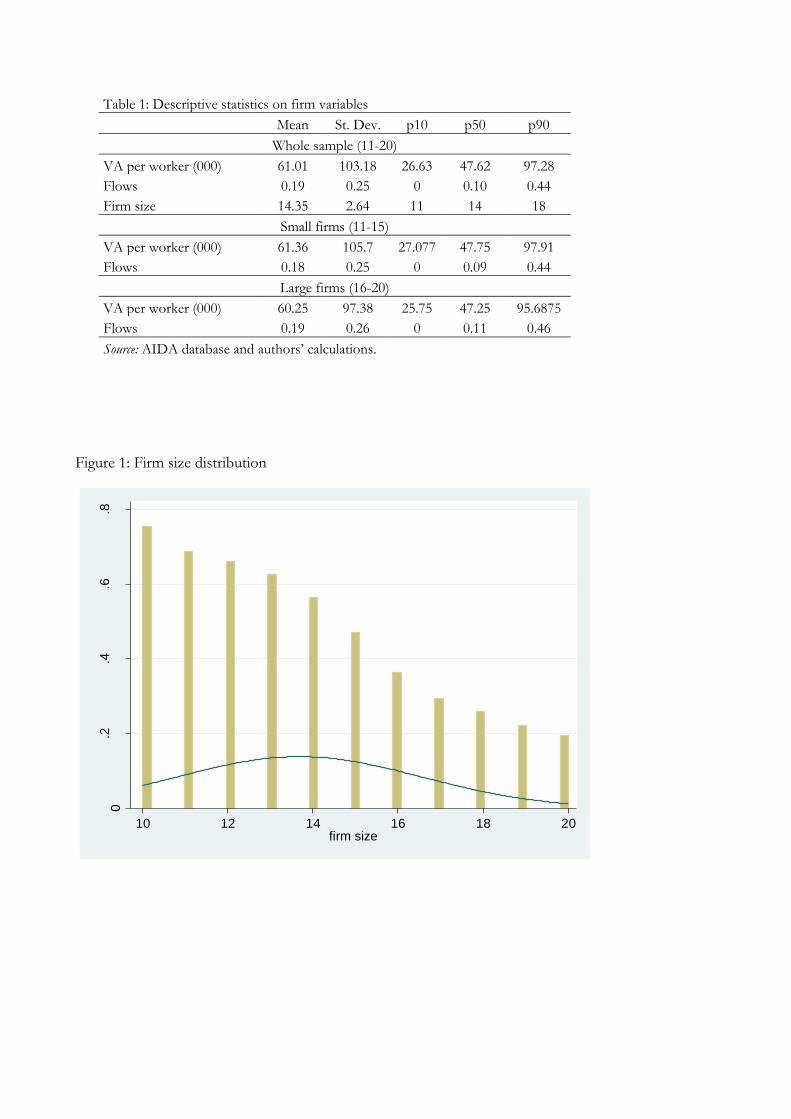
Table 1: Descriptive statistics on firm variables
Mean St. Dev. p10 p50 p90
Whole sample (11-20)
VA per worker (000) 61.01 103.18 26.63 47.62 97.28
Flows 0.19 0.25 0 0.10 0.44
Firm size 14.35 2.64 11 14 18
Small firms (11-15)
VA per worker (000) 61.36 105.7 27.077 47.75 97.91
Flows 0.18 0.25 0 0.09 0.44
Large firms (16-20)
VA per worker (000) 60.25 97.38 25.75 47.25 95.6875
Flows 0.19 0.26 0 0.11 0.46
Source: AIDA database and authors’ calculations.
Figure 1: Firm size distribution
0.2
.4.6
.8
Den
sity
10 12 14 16 18 20firm size
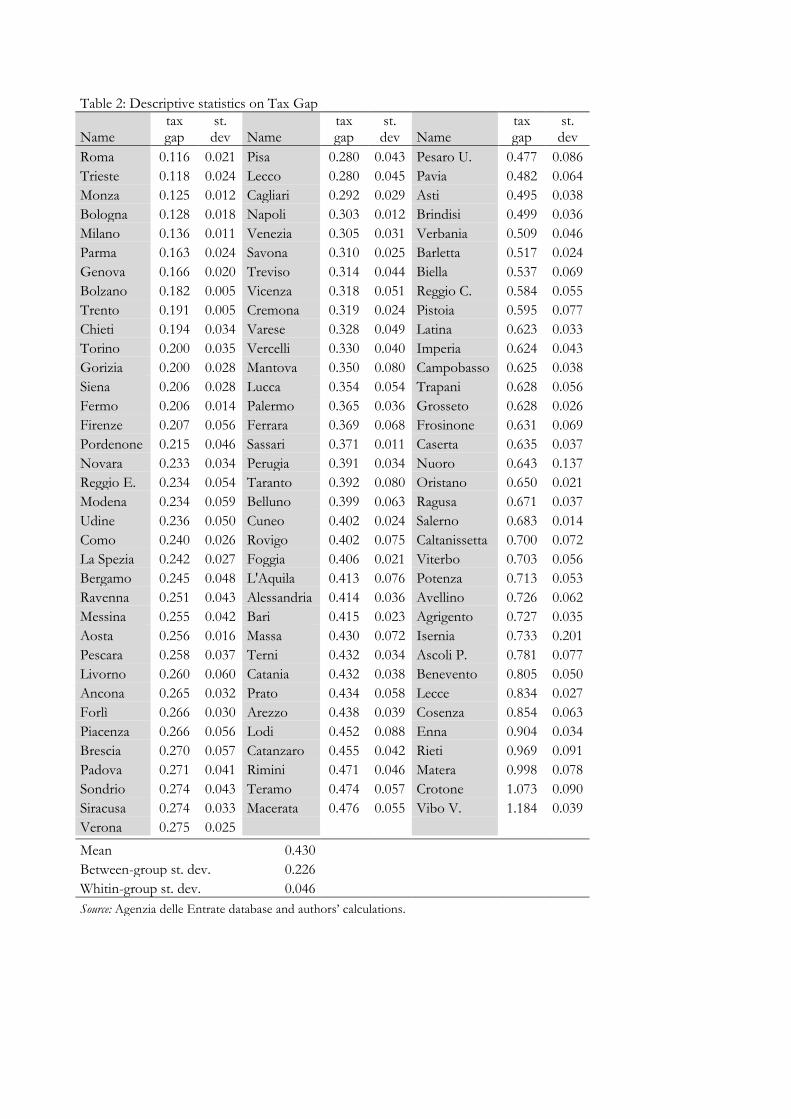
Table 2: Descriptive statistics on Tax Gap
Name tax gap
st. dev Name
tax gap
st. dev Name
tax gap
st. dev
Roma 0.116 0.021 Pisa 0.280 0.043 Pesaro U. 0.477 0.086
Trieste 0.118 0.024 Lecco 0.280 0.045 Pavia 0.482 0.064
Monza 0.125 0.012 Cagliari 0.292 0.029 Asti 0.495 0.038
Bologna 0.128 0.018 Napoli 0.303 0.012 Brindisi 0.499 0.036
Milano 0.136 0.011 Venezia 0.305 0.031 Verbania 0.509 0.046
Parma 0.163 0.024 Savona 0.310 0.025 Barletta 0.517 0.024
Genova 0.166 0.020 Treviso 0.314 0.044 Biella 0.537 0.069
Bolzano 0.182 0.005 Vicenza 0.318 0.051 Reggio C. 0.584 0.055
Trento 0.191 0.005 Cremona 0.319 0.024 Pistoia 0.595 0.077
Chieti 0.194 0.034 Varese 0.328 0.049 Latina 0.623 0.033
Torino 0.200 0.035 Vercelli 0.330 0.040 Imperia 0.624 0.043
Gorizia 0.200 0.028 Mantova 0.350 0.080 Campobasso 0.625 0.038
Siena 0.206 0.028 Lucca 0.354 0.054 Trapani 0.628 0.056
Fermo 0.206 0.014 Palermo 0.365 0.036 Grosseto 0.628 0.026
Firenze 0.207 0.056 Ferrara 0.369 0.068 Frosinone 0.631 0.069
Pordenone 0.215 0.046 Sassari 0.371 0.011 Caserta 0.635 0.037
Novara 0.233 0.034 Perugia 0.391 0.034 Nuoro 0.643 0.137
Reggio E. 0.234 0.054 Taranto 0.392 0.080 Oristano 0.650 0.021
Modena 0.234 0.059 Belluno 0.399 0.063 Ragusa 0.671 0.037
Udine 0.236 0.050 Cuneo 0.402 0.024 Salerno 0.683 0.014
Como 0.240 0.026 Rovigo 0.402 0.075 Caltanissetta 0.700 0.072
La Spezia 0.242 0.027 Foggia 0.406 0.021 Viterbo 0.703 0.056
Bergamo 0.245 0.048 L'Aquila 0.413 0.076 Potenza 0.713 0.053
Ravenna 0.251 0.043 Alessandria 0.414 0.036 Avellino 0.726 0.062
Messina 0.255 0.042 Bari 0.415 0.023 Agrigento 0.727 0.035
Aosta 0.256 0.016 Massa 0.430 0.072 Isernia 0.733 0.201
Pescara 0.258 0.037 Terni 0.432 0.034 Ascoli P. 0.781 0.077
Livorno 0.260 0.060 Catania 0.432 0.038 Benevento 0.805 0.050
Ancona 0.265 0.032 Prato 0.434 0.058 Lecce 0.834 0.027
Forlì 0.266 0.030 Arezzo 0.438 0.039 Cosenza 0.854 0.063
Piacenza 0.266 0.056 Lodi 0.452 0.088 Enna 0.904 0.034
Brescia 0.270 0.057 Catanzaro 0.455 0.042 Rieti 0.969 0.091
Padova 0.271 0.041 Rimini 0.471 0.046 Matera 0.998 0.078
Sondrio 0.274 0.043 Teramo 0.474 0.057 Crotone 1.073 0.090
Siracusa 0.274 0.033 Macerata 0.476 0.055 Vibo V. 1.184 0.039
Verona 0.275 0.025 Mean 0.430 Between-group st. dev. 0.226 Whitin-group st. dev. 0.046 Source: Agenzia delle Entrate database and authors’ calculations.
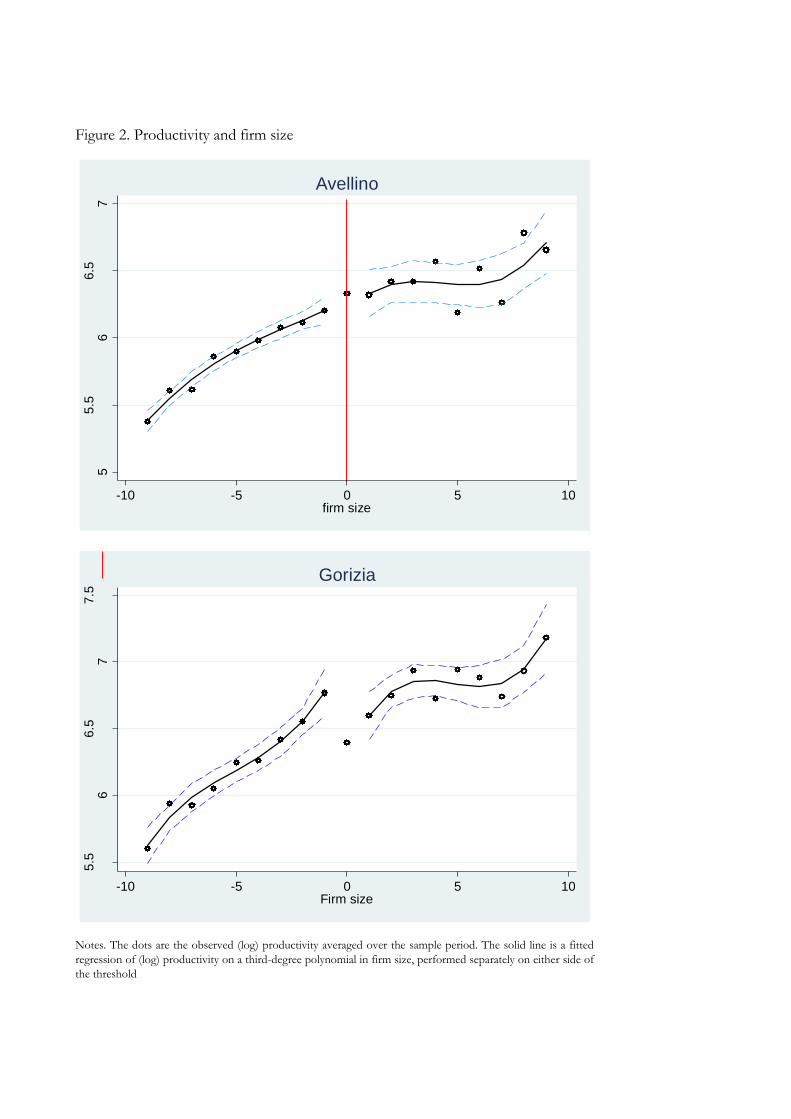
Figure 2. Productivity and firm size
Notes. The dots are the observed (log) productivity averaged over the sample period. The solid line is a fitted
regression of (log) productivity on a third-degree polynomial in firm size, performed separately on either side of
the threshold
55.5
66.5
7
-10 -5 0 5 10firm size
Avellino
5.5
66.5
77.5
-10 -5 0 5 10Firm size
Gorizia
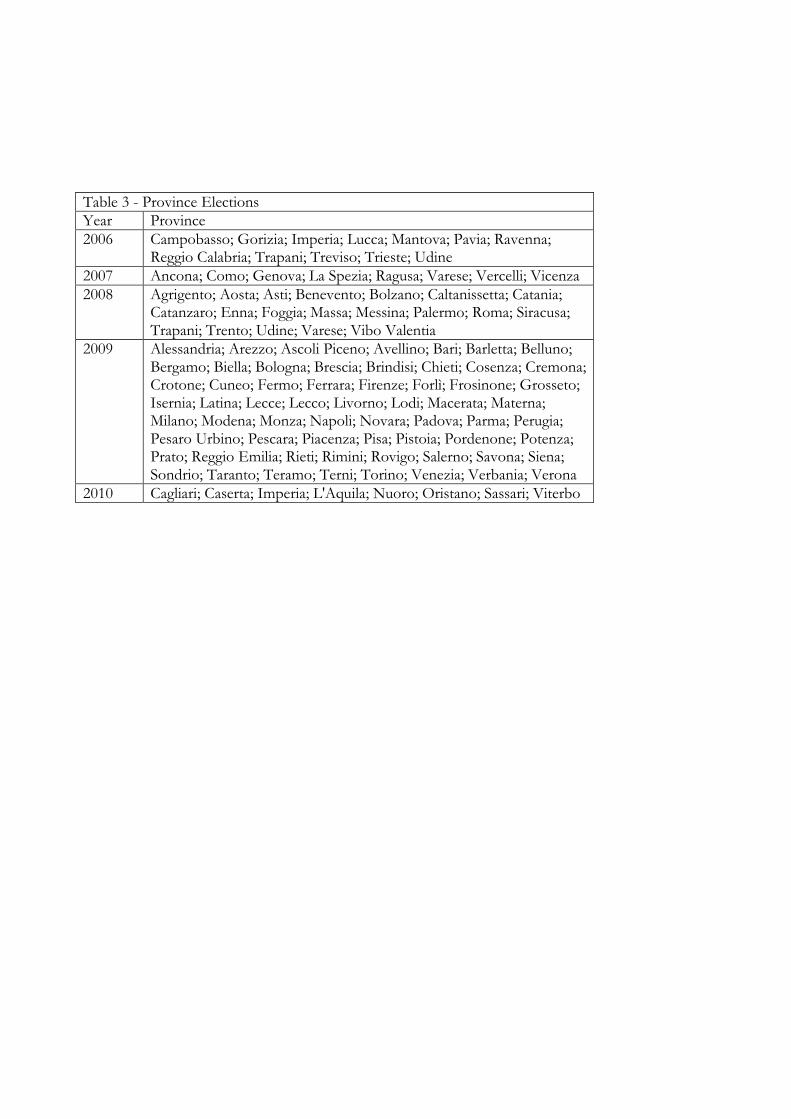
Table 3 - Province Elections
Year Province
2006 Campobasso; Gorizia; Imperia; Lucca; Mantova; Pavia; Ravenna; Reggio Calabria; Trapani; Treviso; Trieste; Udine
2007 Ancona; Como; Genova; La Spezia; Ragusa; Varese; Vercelli; Vicenza
2008 Agrigento; Aosta; Asti; Benevento; Bolzano; Caltanissetta; Catania; Catanzaro; Enna; Foggia; Massa; Messina; Palermo; Roma; Siracusa; Trapani; Trento; Udine; Varese; Vibo Valentia
2009 Alessandria; Arezzo; Ascoli Piceno; Avellino; Bari; Barletta; Belluno; Bergamo; Biella; Bologna; Brescia; Brindisi; Chieti; Cosenza; Cremona; Crotone; Cuneo; Fermo; Ferrara; Firenze; Forlì; Frosinone; Grosseto; Isernia; Latina; Lecce; Lecco; Livorno; Lodi; Macerata; Materna; Milano; Modena; Monza; Napoli; Novara; Padova; Parma; Perugia; Pesaro Urbino; Pescara; Piacenza; Pisa; Pistoia; Pordenone; Potenza; Prato; Reggio Emilia; Rieti; Rimini; Rovigo; Salerno; Savona; Siena; Sondrio; Taranto; Teramo; Terni; Torino; Venezia; Verbania; Verona
2010 Cagliari; Caserta; Imperia; L'Aquila; Nuoro; Oristano; Sassari; Viterbo
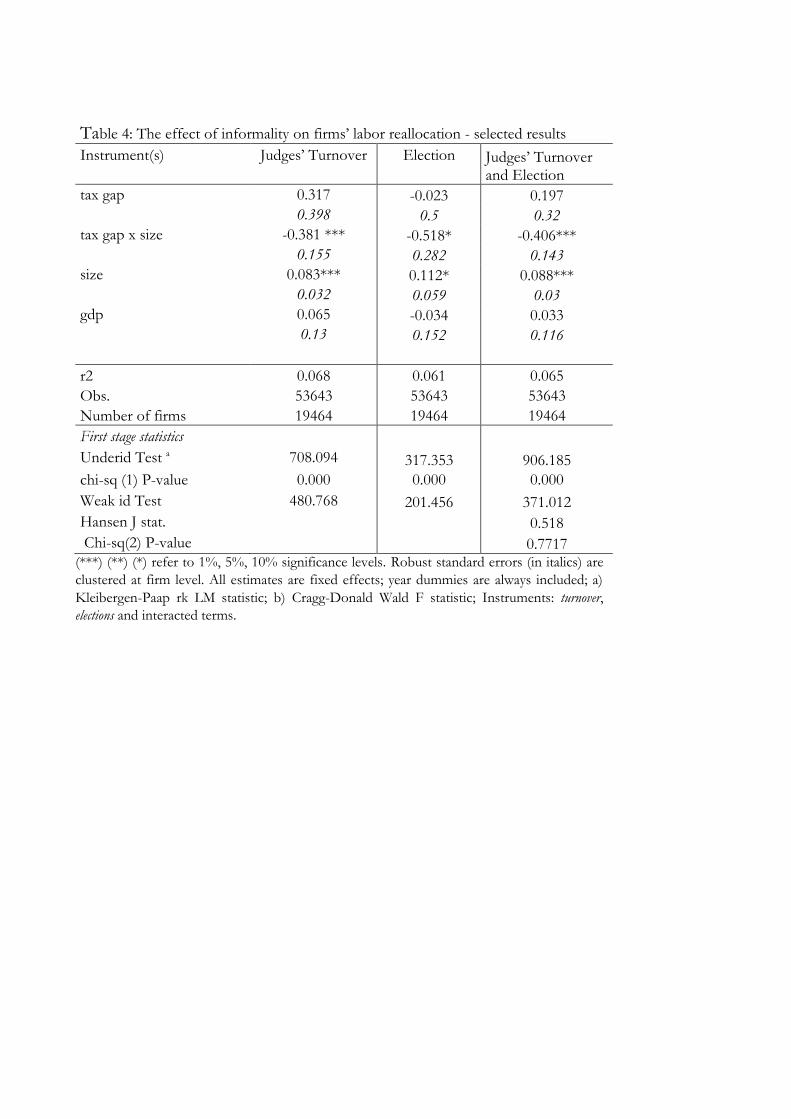
Table 4: The effect of informality on firms’ labor reallocation - selected results
Instrument(s) Judges’ Turnover Election Judges’ Turnover and Election
tax gap 0.317 -0.023 0.197 0.398 0.5 0.32
tax gap x size -0.381 *** -0.518* -0.406*** 0.155 0.282 0.143
size 0.083*** 0.112* 0.088*** 0.032 0.059 0.03
gdp 0.065 -0.034 0.033 0.13 0.152 0.116
r2 0.068 0.061 0.065
Obs. 53643 53643 53643
Number of firms 19464 19464 19464
First stage statistics Underid Test a 708.094 317.353 906.185
chi-sq (1) P-value 0.000 0.000 0.000
Weak id Test 480.768 201.456 371.012
Hansen J stat. 0.518
Chi-sq(2) P-value 0.7717
(***) (**) (*) refer to 1%, 5%, 10% significance levels. Robust standard errors (in italics) are
clustered at firm level. All estimates are fixed effects; year dummies are always included; a)
Kleibergen-Paap rk LM statistic; b) Cragg-Donald Wald F statistic; Instruments: turnover,
elections and interacted terms.
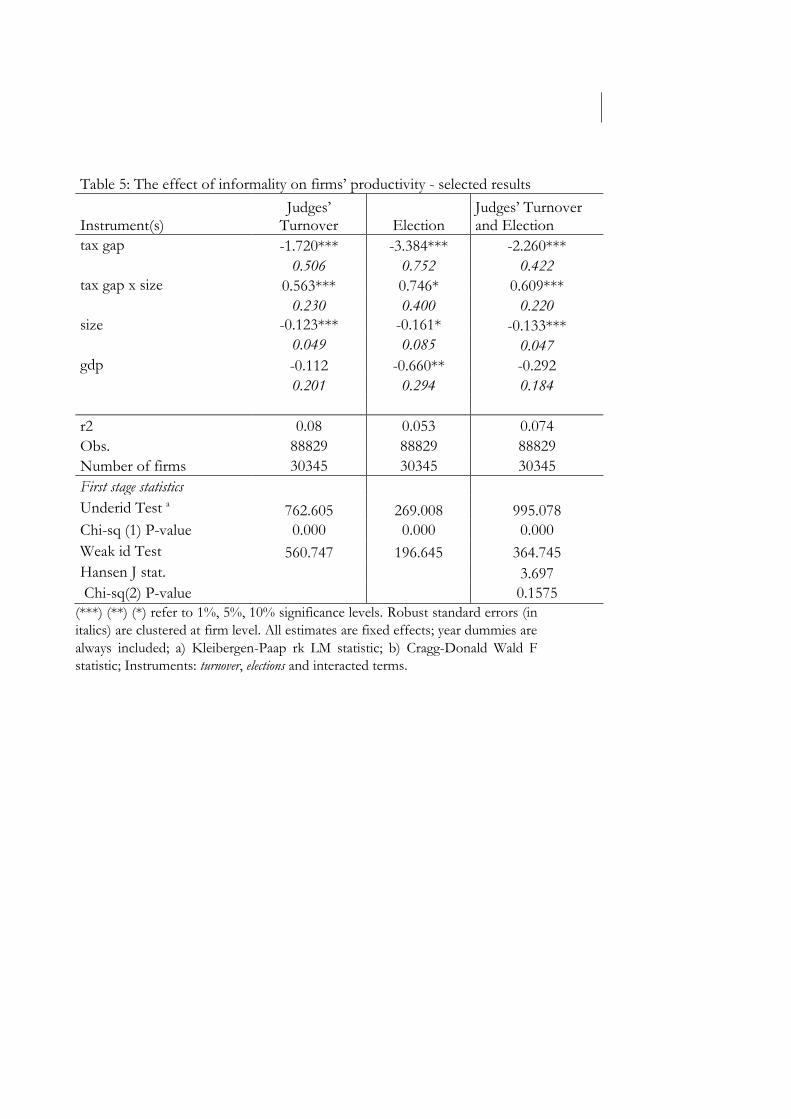
Table 5: The effect of informality on firms’ productivity - selected results
Instrument(s) Judges’
Turnover Election Judges’ Turnover and Election
tax gap -1.720*** -3.384*** -2.260*** 0.506 0.752 0.422
tax gap x size 0.563*** 0.746* 0.609*** 0.230 0.400 0.220
size -0.123*** -0.161* -0.133*** 0.049 0.085 0.047
gdp -0.112 -0.660** -0.292 0.201 0.294 0.184
r2 0.08 0.053 0.074
Obs. 88829 88829 88829
Number of firms 30345 30345 30345
First stage statistics
Underid Test a 762.605 269.008 995.078
Chi-sq (1) P-value 0.000 0.000 0.000
Weak id Test 560.747 196.645 364.745
Hansen J stat. 3.697
Chi-sq(2) P-value 0.1575
(***) (**) (*) refer to 1%, 5%, 10% significance levels. Robust standard errors (in
italics) are clustered at firm level. All estimates are fixed effects; year dummies are
always included; a) Kleibergen-Paap rk LM statistic; b) Cragg-Donald Wald F
statistic; Instruments: turnover, elections and interacted terms.
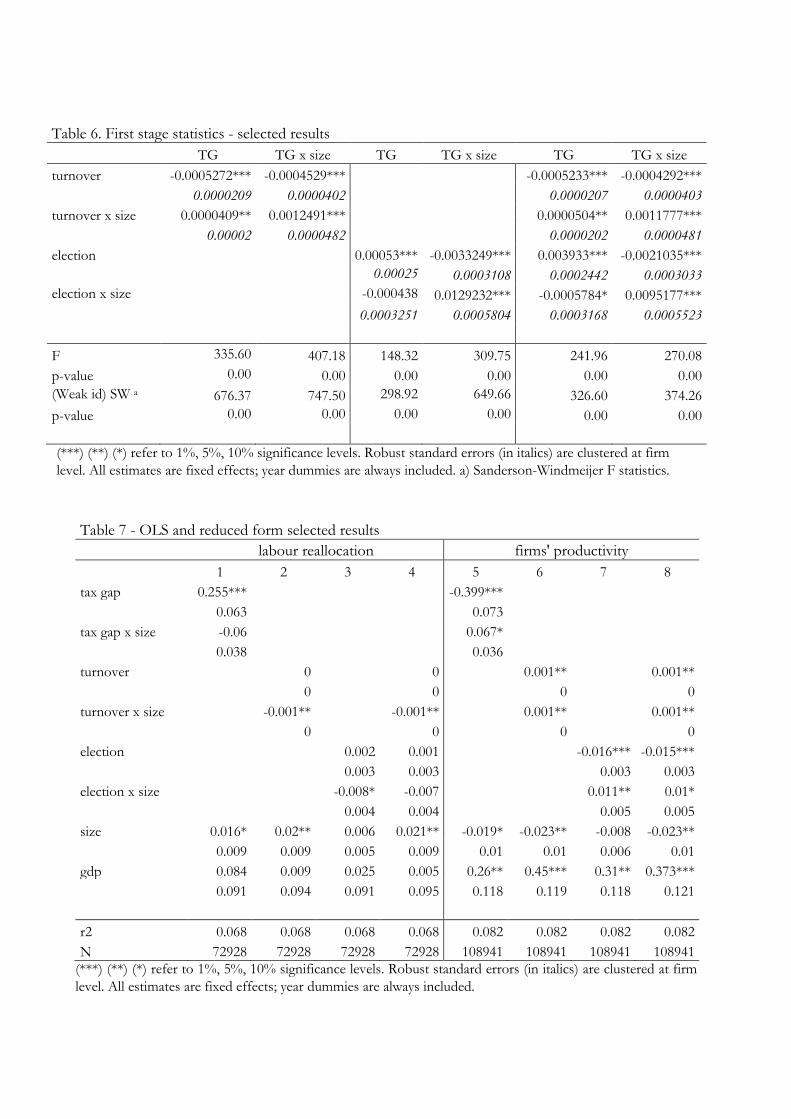
Table 6. First stage statistics - selected results
TG TG x size TG TG x size TG TG x size
turnover -0.0005272*** -0.0004529*** -0.0005233*** -0.0004292***
0.0000209 0.0000402 0.0000207 0.0000403
turnover x size 0.0000409** 0.0012491*** 0.0000504** 0.0011777***
0.00002 0.0000482 0.0000202 0.0000481
election 0.00053*** -0.0033249*** 0.003933*** -0.0021035***
0.00025 0.0003108 0.0002442 0.0003033
election x size -0.000438 0.0129232*** -0.0005784* 0.0095177***
0.0003251 0.0005804 0.0003168 0.0005523
F 335.60 407.18 148.32 309.75 241.96 270.08
p-value 0.00 0.00 0.00 0.00 0.00 0.00
(Weak id) SW a 676.37 747.50 298.92 649.66 326.60 374.26
p-value 0.00 0.00 0.00 0.00 0.00 0.00
(***) (**) (*) refer to 1%, 5%, 10% significance levels. Robust standard errors (in italics) are clustered at firm
level. All estimates are fixed effects; year dummies are always included. a) Sanderson-Windmeijer F statistics.
Table 7 - OLS and reduced form selected results
labour reallocation firms' productivity
1 2 3 4 5 6 7 8
tax gap 0.255*** -0.399***
0.063 0.073
tax gap x size -0.06 0.067*
0.038 0.036
turnover 0 0 0.001** 0.001**
0 0 0 0
turnover x size -0.001** -0.001** 0.001** 0.001**
0 0 0 0
election 0.002 0.001 -0.016*** -0.015***
0.003 0.003 0.003 0.003
election x size -0.008* -0.007 0.011** 0.01*
0.004 0.004 0.005 0.005
size 0.016* 0.02** 0.006 0.021** -0.019* -0.023** -0.008 -0.023**
0.009 0.009 0.005 0.009 0.01 0.01 0.006 0.01
gdp 0.084 0.009 0.025 0.005 0.26** 0.45*** 0.31** 0.373***
0.091 0.094 0.091 0.095 0.118 0.119 0.118 0.121
r2 0.068 0.068 0.068 0.068 0.082 0.082 0.082 0.082
N 72928 72928 72928 72928 108941 108941 108941 108941
(***) (**) (*) refer to 1%, 5%, 10% significance levels. Robust standard errors (in italics) are clustered at firm
level. All estimates are fixed effects; year dummies are always included.
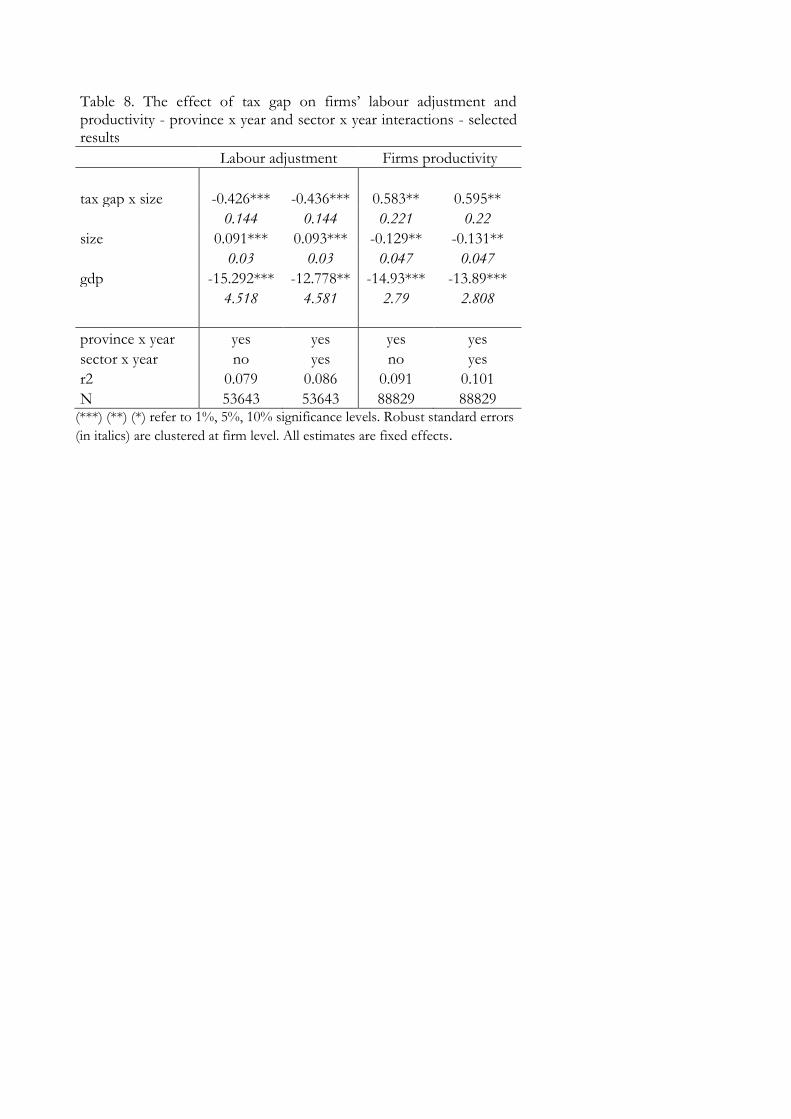
Table 8. The effect of tax gap on firms’ labour adjustment and productivity - province x year and sector x year interactions - selected results
Labour adjustment Firms productivity
tax gap x size -0.426*** -0.436*** 0.583** 0.595**
0.144 0.144 0.221 0.22
size 0.091*** 0.093*** -0.129** -0.131**
0.03 0.03 0.047 0.047
gdp -15.292*** -12.778** -14.93*** -13.89***
4.518 4.581 2.79 2.808
province x year yes yes yes yes
sector x year no yes no yes
r2 0.079 0.086 0.091 0.101
N 53643 53643 88829 88829 (***) (**) (*) refer to 1%, 5%, 10% significance levels. Robust standard errors
(in italics) are clustered at firm level. All estimates are fixed effects.
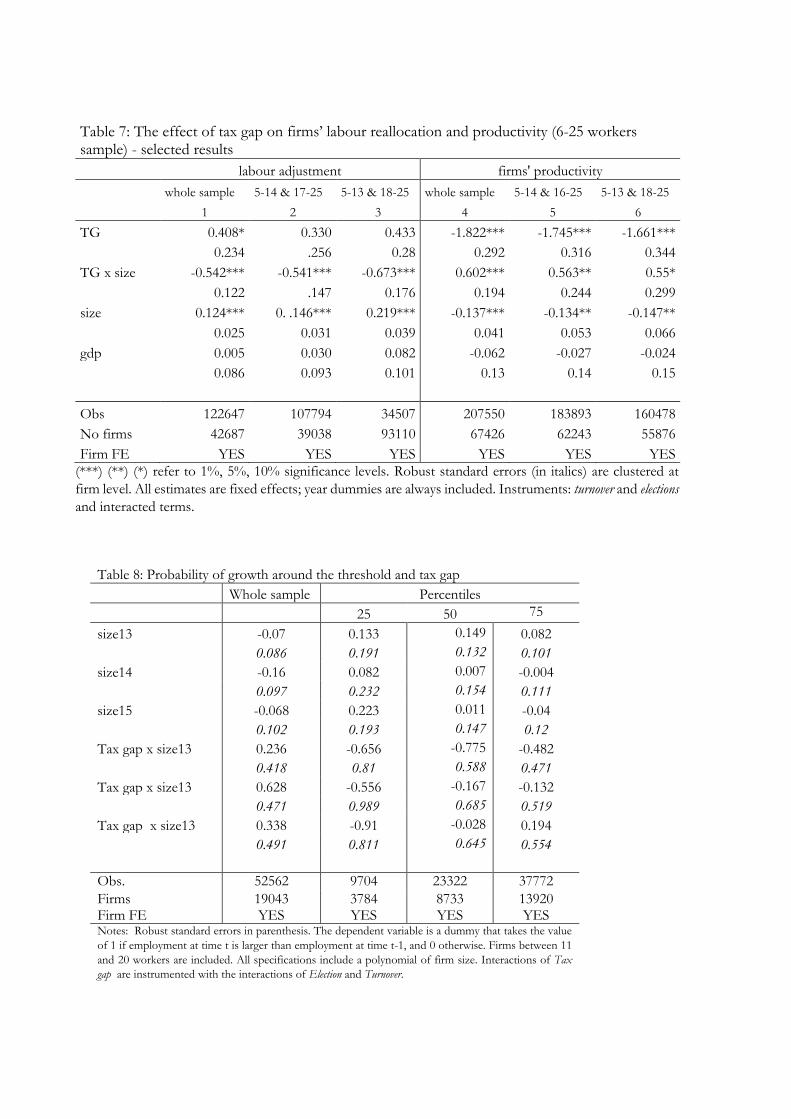
Table 7: The effect of tax gap on firms’ labour reallocation and productivity (6-25 workers sample) - selected results
labour adjustment firms' productivity
whole sample 5-14 & 17-25 5-13 & 18-25 whole sample 5-14 & 16-25 5-13 & 18-25
1 2 3 4 5 6
TG 0.408* 0.330 0.433 -1.822*** -1.745*** -1.661***
0.234 .256 0.28 0.292 0.316 0.344
TG x size -0.542*** -0.541*** -0.673*** 0.602*** 0.563** 0.55*
0.122 .147 0.176 0.194 0.244 0.299
size 0.124*** 0. .146*** 0.219*** -0.137*** -0.134** -0.147**
0.025 0.031 0.039 0.041 0.053 0.066
gdp 0.005 0.030 0.082 -0.062 -0.027 -0.024
0.086 0.093 0.101 0.13 0.14 0.15
Obs 122647 107794 34507 207550 183893 160478
No firms 42687 39038 93110 67426 62243 55876
Firm FE YES YES YES YES YES YES
(***) (**) (*) refer to 1%, 5%, 10% significance levels. Robust standard errors (in italics) are clustered at
firm level. All estimates are fixed effects; year dummies are always included. Instruments: turnover and elections
and interacted terms.
Table 8: Probability of growth around the threshold and tax gap
Whole sample Percentiles
25 50 75
size13 -0.07 0.133 0.149 0.082
0.086 0.191 0.132 0.101
size14 -0.16 0.082 0.007 -0.004
0.097 0.232 0.154 0.111
size15 -0.068 0.223 0.011 -0.04
0.102 0.193 0.147 0.12
Tax gap x size13 0.236 -0.656 -0.775 -0.482
0.418 0.81 0.588 0.471
Tax gap x size13 0.628 -0.556 -0.167 -0.132
0.471 0.989 0.685 0.519
Tax gap x size13 0.338 -0.91 -0.028 0.194
0.491 0.811 0.645 0.554
Obs. 52562 9704 23322 37772
Firms 19043 3784 8733 13920 Firm FE YES YES YES YES Notes: Robust standard errors in parenthesis. The dependent variable is a dummy that takes the value
of 1 if employment at time t is larger than employment at time t-1, and 0 otherwise. Firms between 11
and 20 workers are included. All specifications include a polynomial of firm size. Interactions of Tax
gap are instrumented with the interactions of Election and Turnover.