Embed Size (px)
Citation preview
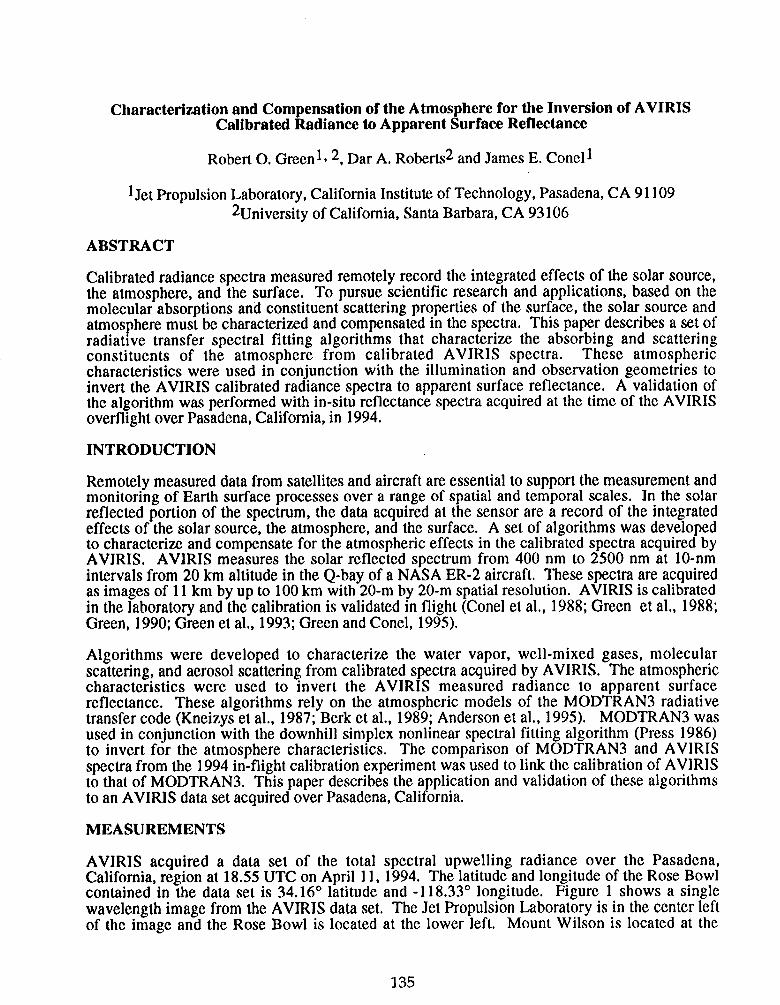
Characterization and Compensation of the Atmosphere for the Inversjon of AVIRISCalibrated Radiance to Apparent Surface Reflectance
Robert 0, Green 1~2, Dar A, Roberts2 and James E. Conel 1
lJet Propulsion Laboratory, California Institute of Technology, Pasadena,CA91109Zuniversity of Ca]ifomia, Santa Barbara, CA 93106
ABSTRACT
Calibrated radiance spectra measured remotely record the integrated effects of the solar source,the atmosphere, and the surface. To pursue scientific research and applications, based on themolecular absorption and constituent scattering properties of the surface, the solar source andatmosphere must be characterized and compensated in the spectra. This paper describes a set ofradiative transfer spectral fitting algorithms that characterize the absorbing and scatteringconstituents of the atmosphere from calibrated AVIRIS spectra. These atmosphericcharacteristics were used in conjunction with the illumination and observation geometries toinvert the AVIRIS calibrated radiance spectra to apparent surface reflectance. A validation ofthe algorithm was performed with in-situ reflectance spectra acquired at the time of the AVIRISoverflight over Pasadena, California, in 1994.
INTRODUCTION
Remotely measured data from satellites and aircraft are essential to support the measurement andmonitoring of Earth surface processes over a range of spatial and temporal scales. In the solarreflected portion of the spectrum, the data acquired at the sensor are a record of the integratedeffects of the solar source, the atmosphere, and the surface. A set of algorithms was developedto characterize and compensate for the atmospheric effects in the calibrated spectra acquired byAVIRIS. AVIRIS measures the solar reflected spectrum from 400 nm to 2500 nm at 10-nmintervals from 20 km altitude in the Q-bay of a NASA ER-2 aircraft. These spectra are acquiredas images of 11 km by up to 100 km with 20-m by 20-m spatial resolution. AVIRIS is calibratedin the laboratory and the calibration is validated in flight (Conel et al., 1988; Green et al., 1988;Green, 1990; Green et al., 1993; Green and Conel, 1995).
Algorithms were developed to characterize the water vapor, well-mixed gases, molecularscattering, and aerosol scattering from calibrated spectra acquired by AVIRIS. The atmosphericcharacteristics were used to invert the AVIRIS measured radiance to apparent surfacereflectance. These algorithms rely on the atmospheric models of the MODTRAN3 radiativetransfer code (Kneizys et al., 1987; Berk et al., 1989; Anderson et al., 1995). MODTRAN3 wasused in conjunction with the downhill simplex nonlinear spectral fitting algorithm (Press 1986)to invert for the atmosphere characteristics. The comparison of MODTRAN3 and AVIRISspectra from the 1994 in-flight calibration experiment was used to link the calibration of AVIRISto that of MODTRAN3. This paper describes the application and validation of these algorithmsto an AVIRIS data set acquired over Pasadena, California.
MEASUREMENTS
AVIRIS acquired a data set of the total spectral upwelling radiance over the Pasadena,California, region at 18.55 UTC on April 11, 1994. The latitude and longitude of the Rose Bowlcontained in the data set is 34.16° latitude and -118.33° longitude. Figure 1 shows a singlewavelength image from the AVIRIS data set, The Jet Propulsion Laboratory is in the center leftof the image and the Rose Bowl is located at the lower left. Mount Wilson is located at the
135
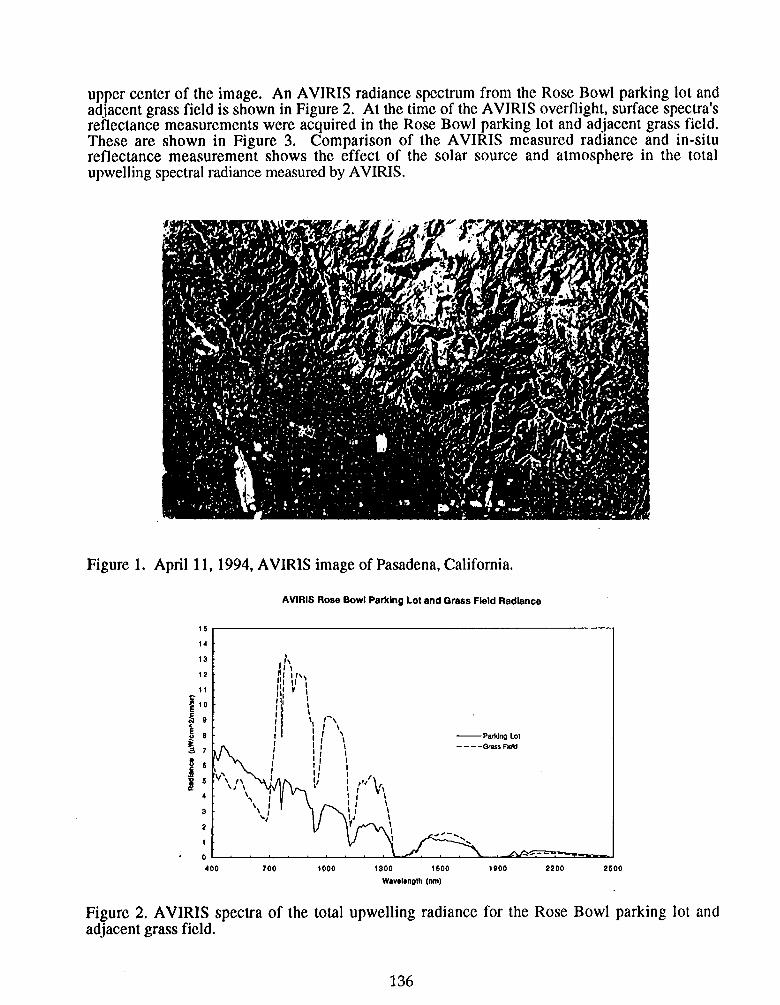
upper center of the image. An AVIRIS radiance spectrum from the Rose Bowl parking lot andadjacent grass field is shown in Figure 2. At the time of the AVIRIS overflight, surface spectra’sreflectance measurements were acquired in the Rose Bowl parking lot and adjacent grass field.These are shown in Figure 3. Comparison of the AVIRIS measured radiance and in-situreflectance measurement shows the effect of the solar source and atmosphere in the totalupwelling spectral radiance measured by AVIRIS.
Figure 1. April 11, 1994, AVIRIS image of Pasadena, California.
AVIRIS Rose Bowl Parking Lot and Grass Flald Radlanca
— Parking Lot
----Ora.5s F@ld
13
12
1!
10
9
8
7
6
6
4
3
2
1
0
400 700 1000 1300 1600 1900 2200 2500
Wavelength (rim)
Figure 2. AVIRIS spectra of the total upwelling radiance for the Rose Bowl parking lot andadjacent grass field.
136
Rose Bowl Perking Lot end Gress Field Reflectance 940413
1,0
0.9
0,8
0.7
0.6
!
0.5
0.4
0.3
0.2
0.1
0.0
— Parking Lot
------ -1 Standard Devlabn
+1 standard Deviation
— Qra$s Fldd
-1 Standafd Deviation
400.0 700.0 1000.0 1300,0 1s00.0 1900.0 2200.0 2500.0
Wavelength (rim)
.’
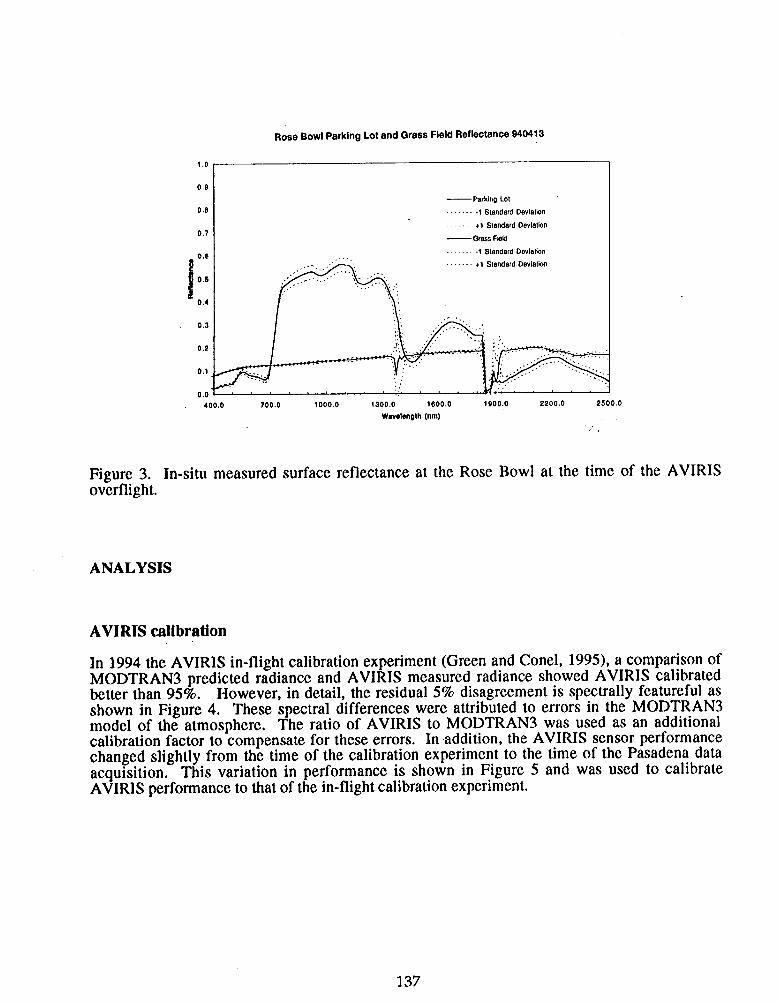
Figure 3. In-situ measured surface reflectance at the Rose Bowl at the time of the AVIRISoverflight.
ANALYSIS
AVIRTS calibration
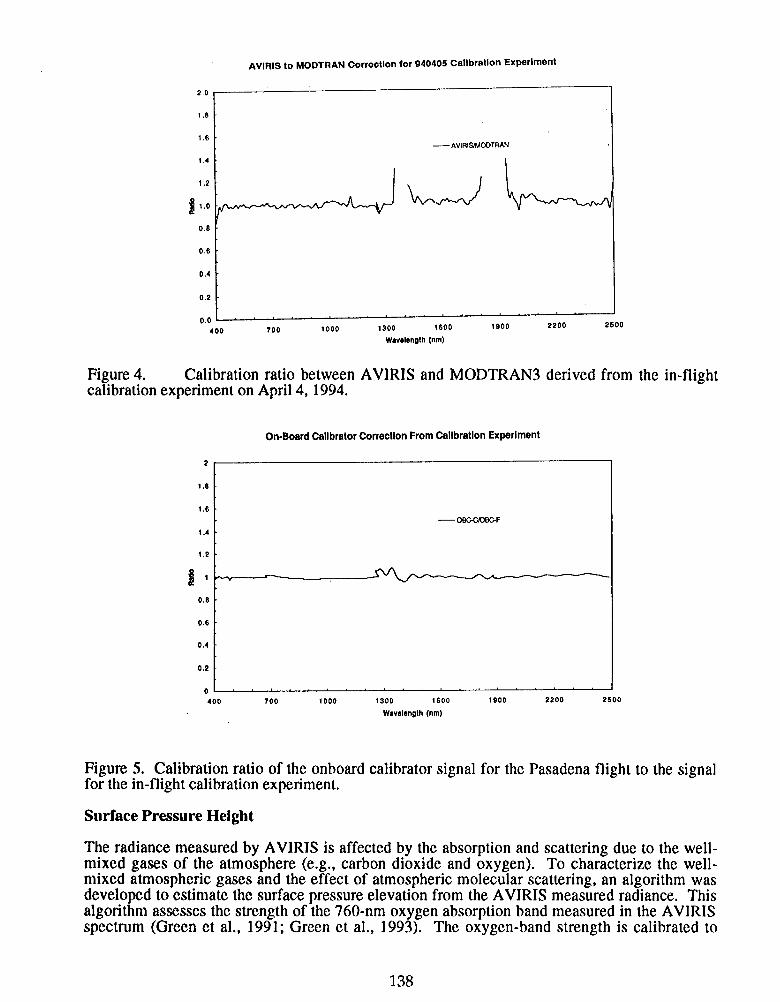
In 1994 the AVIRISin-flight calibration experiment (Green and Conel, 1995), a comparison ofMODTRAN3 predicted radiance and AVIRIS measured radiance showed AVIRIS calibratedbetter than 95%. However, indetail, theresidua15% disagreement isspectrally featurefulasshown in Figure 4. These spectral differences were attributed to errors in the MODTRAN3model of the atmosphere. The ratio of AVIRIS to MODTRAN3 was used as an additionalcalibration factor to compensate for these errors. In addition, the AVIRIS sensor performancechanged slightly from the time of the calibration experiment to the time of the Pasadena dataacquisition, This variation in performance is shown in Figure 5 and was used to calibrateAVIRIS performance to that of the in-flight calibration experiment.
137
AVIRIS to MODTRAN Correotlon for 940405 Calibration Experiment
2,0
1.8
t .6
t .4
i ,2
81.0
0.6
0.6
0.4
0.;
0.(
— AVIR12.MOOTRAN
-L.-JL
400 700 1000 1300 1600 1900
Wwoleng!h (rim)
Figure 4. Calibration ratio between AVIRIS and MODTRAN3calibration experiment on April 4, 1994.
2
1.6
1.6
1.4
f .2
81
0,8
0.6
0.4
0.2
0
On-Board Calibrator Correction From Callbratlon Experiment
2200 2600
derived from the in-flight
— OBGCCiIC.F
400 700 1000 1300 1600
Wavelength (rim)
Figure 5. Calibration ratio of the onboard calibrator signalfor the in-flight calibration experiment.
Surface Pressure Height
1s00 2200 2500
for the Pasadena flight to the signal
The radiance measured by AVJRIS is affected by the absorption and scattering due to the well-mixed gases of the atmosphere (e.g., carbon dioxide and oxygen). To characterize the well-mixed atmospheric gases and the effect of atmospheric molecular scattering, an algorithm wasdeveloped to estimate the surface pressure elevation from the AVIRIS measured radiance, Thisalgorithm assesses the strength of the 760-nm oxygen absorption band measured in the AVIRISspectrum (Green et al., 1991; Green et al., 1993). The oxygen-band strength is calibrated to
138
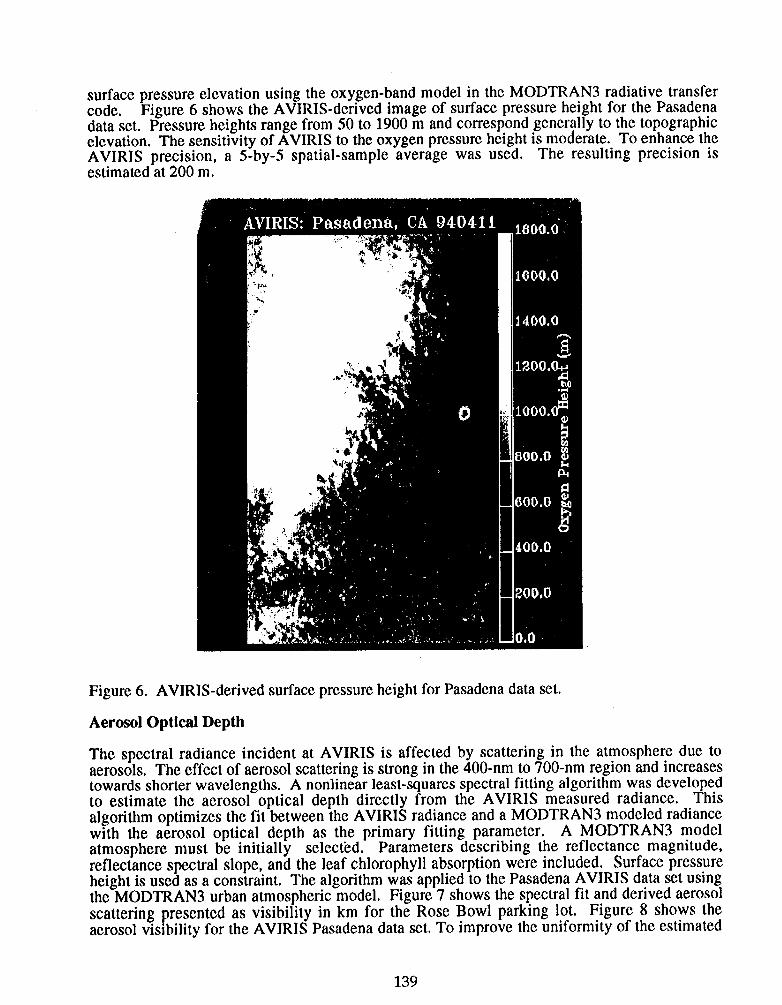
surface pressure elevation using the oxygen-band model in the MODTRAN3 radiative transfercode. Figure 6 shows the AVIRIS-derived image of surface pressure height for the Pasadenadata set. Pressure heights range from 50 to 1900 m and correspond generally to the topographicelevation. The sensitivity of AVIRIS to the oxygen pressure height is moderate. To enhance theAVIRIS precision, a 5-by-5 spatial-sample average was used. The resulting precision isestimated at 200 m.
Figure 6. AVIRIS-derived surface pressure height for Pasadena data set.
Aerosol Optical Depth
The spectral radiance incident at AVIRIS is affected by scattering in the atmosphere due toaerosols. The effect of aerosol scattering is strong in the 400-nm to 700-nm region and increasestowards shorter wavelengths. A nonlinear least-squares spectral fitting algorithm was developedto estimate the aerosol optical depth directly from the AVIRIS measured radiance. Thisalgorithm optimizes the fit between the AVIRIS radiance and a MODTRAN3 modeled radiancewith the aerosol optical depth as the primary fitting parameter. A MODTRAN3 modelatmosphere must be initially selecfed. Parameters describing the reflectance magnitude,reflectance spectral slope, and the leaf chlorophyll absorption were included. Surface pressureheight is used as a constraint. The algorithm was applied to the Pasadena AVIRIS data set usingthe MODTRAN3 urban atmospheric model. Figure 7 shows the spectral fit and derived aerosolscattering presented as visibility in km for the Rose Bowl parking lot. Figure 8 shows theaerosol visibility for the AVIRIS Pasadena data set. To improve the uniformity of the estimated
139
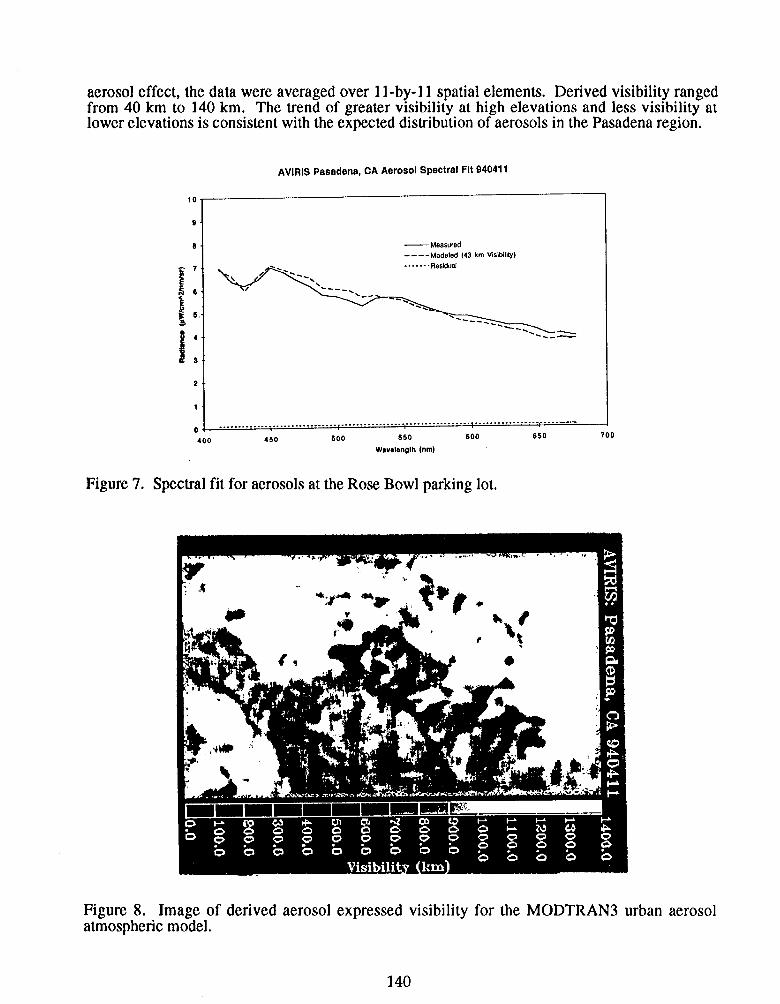
aerosol effect, the data were averaged over 11-by- 11 spatial elements. Derived visibility rangedfrom 40 km to 140 km. The trend of greater visibility at high elevations and less visibility atlower elevations is consistent with the expected distribution of aerosols in the Pasadena region.
AVIRIS Paaadena, CA Aerosol Spectral Flt 940411
s
8
I
— Measured
---- Modeled (43 km Vislblllty).......R~s@,J~
2.
1.
. . . . . . . . . . . . . . . . . . . . . . . . . . . . . . . . . . . . . . . . . . . . . . . . . . . . . . --------- --------- --—.+ . . . . . . . . . . . . . I“.
400 450 600 650 600 650 700
Wwslenglh (rim)
Figure 7. Spectral fit for aerosols at the Rose Bowl parking lot,
Figure 8. Image of derived aerosol expressed visibility for the MODTRAN3 urban aerosolatmospheric model.
140
Water Vapor
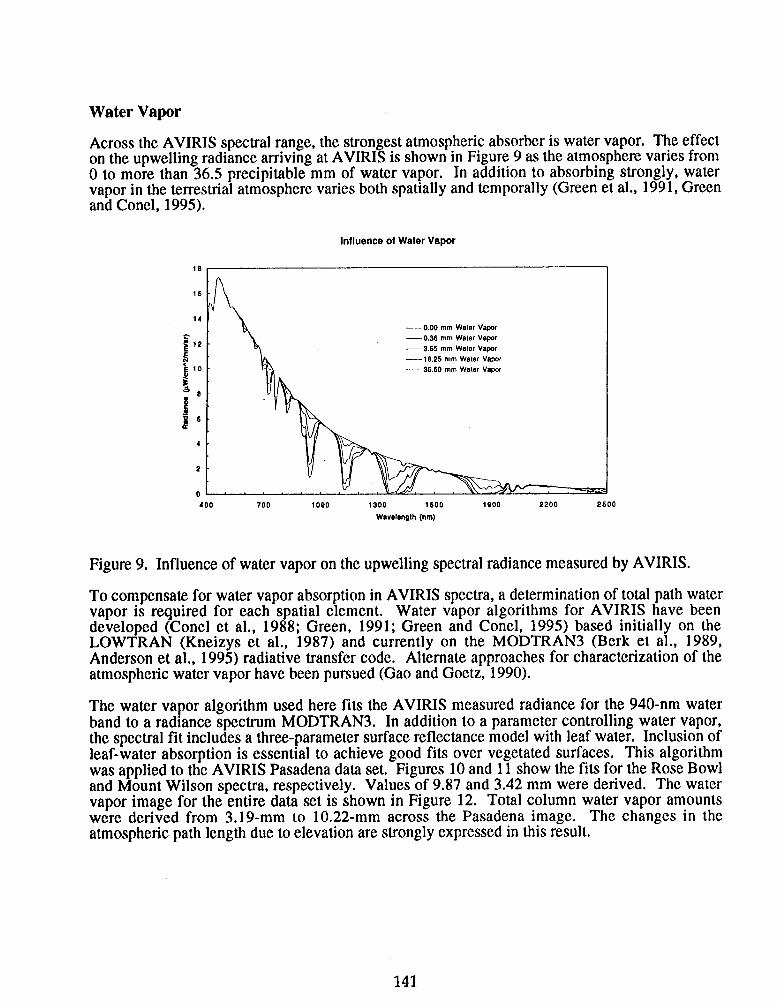
Across the AVIRIS spectral range, the strongest atmospheric absorber is water vapor. The effecton the upwelling radiance arriving at AVIRIS is shown in Figure 9 as the atmosphere varies fromO to more than 36.5 precipitable mm of water vapor. In addition to absorbing strongly, watervapor in the terrestrial atmosphere varies both spatially and temporally (Green et al., 1991, Greenand Conel, 1995).
Influence of Water Vapor
18
16
14
4
2
0
h ——0.00 mm Water Vapor
— 0.36 mm Water Vapor
—-3.65 mm Water Vapor
— 16.25 mm Water VaPOf
—— 96.50 mm Water Vapor
400 700 1000 1300 1800 1900 2200 26oO
Wmwlonolh (rim)
Figure 9. Influence of water vapor on the upwelling spectral radiance measured by AVIRIS.
To compensate for water vapor absorption in AVIRIS spectra, a determination of total path watervapor is required for each spatial element. Water vapor algorithms for AVIRIS have beendeveloped (Cone] et al., 1988; Green, 1991; Green and Conel, 1995) based initially on theLOWTRAN (Kneizys et al., 1987) and currently on the MODTRAN3 (Berk et al., 1989,Anderson et al., 1995) radiative transfer code. Alternate approaches for characterization of theatmospheric water vapor have been pursued (Gao and Goetz, 1990).
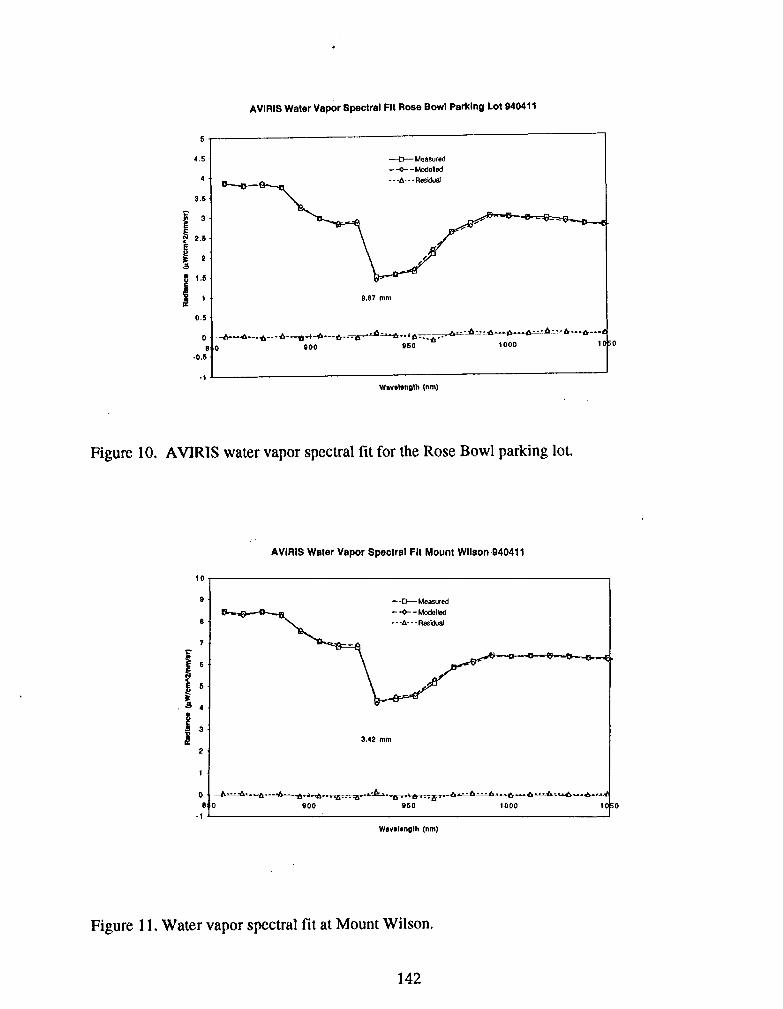
The water vapor algorithm used here fits the AVIRIS measured radiance for the 940-nm waterband to a radiance spectrum MODTRAN3. In addition to a parameter controlling water vapor,the spectral fit includes a three-parameter surface reflectance model with leaf water. Inclusion ofleaf-water absorption is essential to achieve good fits over vegetated surfaces. This algorithmwas applied to the AVIRIS Pasadena data set, Figures 10 and 11 show the fits for the Rose Bowland Mount Wilson spectra, respectively. Values of 9.87 and 3.42 mm were derived. The watervapor image for the entire data set is shown in Figure 12. Total column water vapor amountswere derived from 3.19-mm to 10.22-mm across the Pasadena image. The changes in theatmospheric path length due to elevation are strongly expressed in this result,
141
6
4,5
3.5
0.6
0
(.0.5
,
AVIRIS Water Vapor Spectral Fit Rose Bowl Parking LotS40411
-c-- Measur6d- + - MOdelled..-A. -. R@AJal
9.87 mm
Wwelength (rim)
Figure 10. AVIRIS water vapor spectral fit for the Rose Bowl parking lot.
AVIRIS Water Vapor Spectral Flt Mount Wllaon 940411
-23- Measured--- Modelled
---A--- Resicj@
3.42 mm
.1 1
Wavelength (rim)
iO
iO
Figure 11. Water vapor spectral fit at Mount Wilson.
142
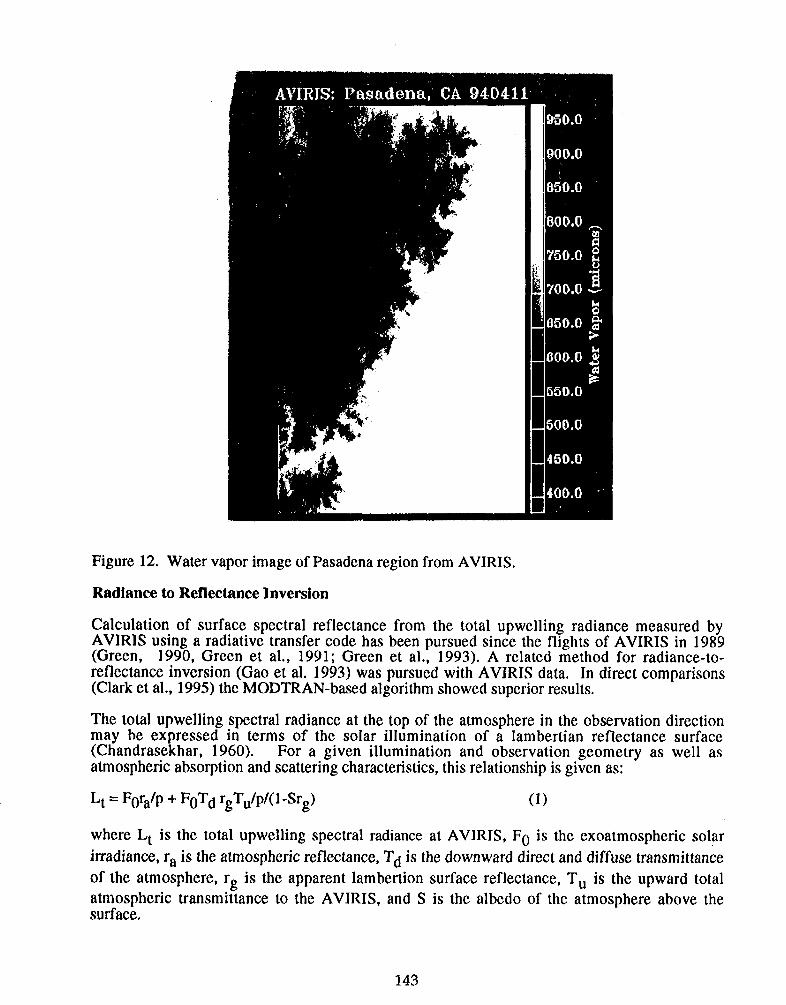
Figure 12. Water vapor image of Pasadena region from AVIRIS.
Radiance to Reflectance Inversion
Calculation of surface spectral reflectance from the total upwelling radiance measured byAVIRIS using a radiative transfer code has been pursued since the flights of AVIRIS in 1989(Green, 1990, Green et al., 1991; Green et al., 1993). A related method for radiance-to-reflectance inversion (Gao et al. 1993) was pursued with AVIRIS data, In direct comparisons(Clark et al., 1995) the MODTRAN-based algorithm showed superior results.
The total upwelling spectral radiance at the top of the atmosphere in the observation directionmay be expressed in terms of the solar illumination of a Iambertian reflectance surface(Chandrasekhar, 1960). For a given illumination and observation geometry as well asatmospheric absorption and scattering characteristics, this relationship is given as:
(1)Lt = Fora/p + FOTd rgTu/pKl -Srg).
where Lt is the total upwelling spectral radiance at AVIRIS, F. is the exoatmospheric sol?r
irradiance, ra is the atmospheric reflectance, Td is the downward direct and diffuse transmittance
of the atmosphere, rg is the apparent lambertion surface reflectance, Tu is the upward totalatmospheric transmittance to the AVIRIS, and S is the albedo of the atmosphere above thesurface.
143
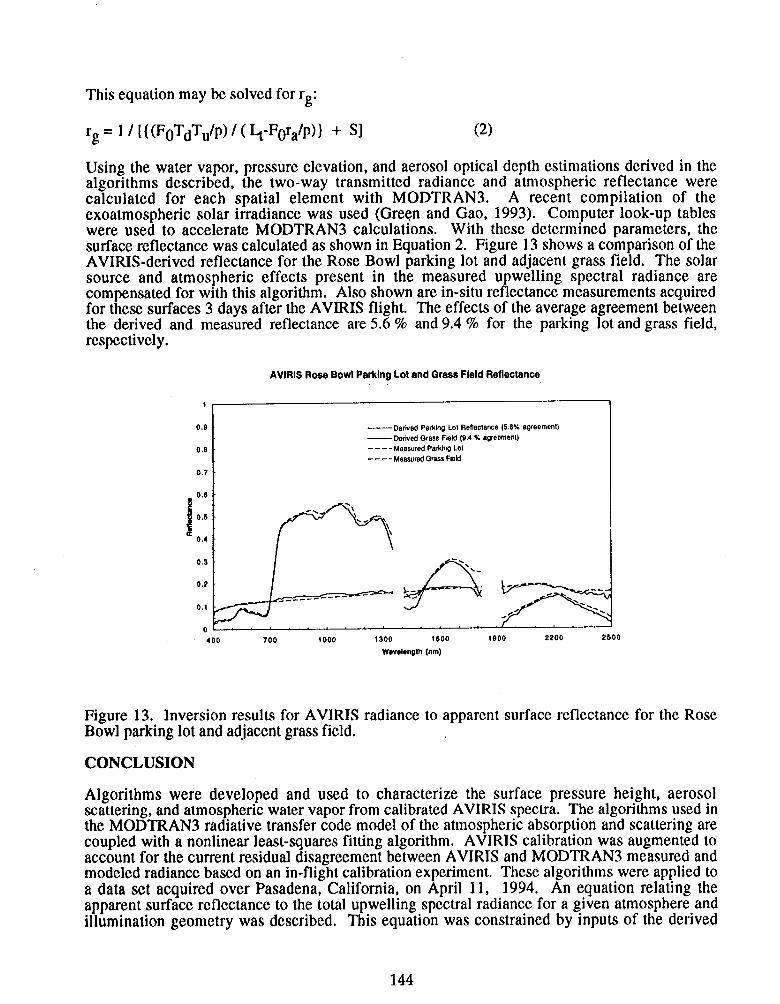
This equation may be solved for rg:
rg=l/[{(FOTdTu/p) /(~-FOra/p)} + W (2)
Using the water vapor, pressure elevation, and aerosol optical depth estimations derived in thealgorithms described, the two-way transmitted radiance and atmospheric reflectance werecalculated for each spatial element with MODTRAN3. A recent compilation of theexoatmospheric solar irradiance was used (Gret?n and Gao, 1993). Computer look-up tableswere used to accelerate MODTRAN3 calculations. With these determined parameters, thesurface reflectance was calculated as shown in Equation 2. Figure 13 shows a comparison of theAVIRIS-derived reflectance for the Rose Bowl parking lot and adjacent grass field. The solarsource and atmospheric effects present in the measured upwelling spectral radiance arecompensated for with this algorithm. Also shown are in-situ reflectance measurements acquiredfor these surfaces 3 days after the AVIRIS flight. The effects of the average agreement betweenthe derived and measured reflectance are 5.6 % and 9.4 % for the parking lot and grass field,respective] y.
AVIRIS Rose Bowl Parking Lot and Grass Field Reflectance
1
0.9 — Dert.’ed Parklno Lot Reflectance (5.6% agreement)— Derived Grass Field (9.4% agreement)
0.8
0.7
0.6
! ~
0.6
0.4
---- Measured Paddng Lot
---- MeasuredGrass Field
m
o r r400 700 1000 1300 1600 1900 2200 2500
Wevelen!$h (rim)
Figure 13. Inversion results for AVIRIS radiance to apparent surface reflectance for the RoseBowl parking lot and adjacent grass field.
CONCLUSION
Algorithms were developed and used to characterize the surface pressure height, aerosolscattering, and atmospheric water vapor from calibrated AVIRIS spectra. The algorithms used inthe MODTRAN3 radiative transfer code model of the atmospheric absorption and scattering arecoupled with a nonlinear least-squares fitting algorithm. AVIRIS calibration was augmented toaccount for the current residual disagreement between AVIRIS and MODTRAN3 measured andmodeled radiance based on an in-flight calibration experiment. These algorithms were applied toa data set acquired over Pasadena, California, on April 11, 1994. An equation relating theapparent surface reflectance to the total upwelling spectral radiance for a given atmosphere andillumination geometry was described, This equation was constrained by inputs of the derived
144
atmospheric absorption and scattering characteristics to MODTRAN3. Apparent surfacereflectance was derived for the complete AVIRIS data set. Solar source and atmospheric effectswere compensated in the derived apparent reflectance spectra. At the Rose Bowl parking lotand adjacent grass field, the derived apparent reflectance was compared with in-situmeasurements. An agreement of 5.6’% and 9.4 % was shown, providing an end-to end validationof the algorithm. Physically based derivation of the apparent surface spectral reflectance fromcalibrated upwelling radiance using only the spectra themselves is essential for research andapplication that are based on absorption and scattering characteristics of the surface.
ACKNOWLEDGMENT
The majority of this research was carried out at the Jet Propulsion Laboratory, CaliforniaInstitute of Technology, under contract with the National Aeronautics and Space Administration.A portion of the work was performed at the Institute for Computational Earth System Science,University of California, Santa Barbara, CA,
REFERENCES
Anderson, G. P., J. Wang, and J. H. Chetwynd (1995), “MODTRAN3: An Update AndRecent Validations Against Airborne High Resolution Interferometer Measurements,”Summaries of the Fifth Annual JPL Airborne Earth Science Workshop, Jet PropulsionLaboratory, Pasadena, CA, JPL 95-1, Vol. 1,5-8.
Berk, A,, L, S, Bernstein, and D. C, Robertson, MODTRAN: A Moderate ResolutionModel for LOWTRAN 7, Final Report, GL-TR-0122, AFGL, Hanscom AFB, MA, 42 pp., 1989.
Chandrasekhar, S., “Radiative Transfer:’ Dover Press, New York, 1960.
Clark, R. N., G. A. Swayze, K, Heidebrecht, R. O. Green, and A. F. H. Goetz,“Calibration to Surface Reflectance of Terrestrial Imaging Spectrometry Data: Comparison ofMethods;’ Summaries of the Fifth Annual JPL Airborne Earth Science Workshop, Jet PropulsionLaboratory, Pasadena, CA, JPL Pub. 95-1, Vol. 1,1995.
Cone], J. E., R, O. Green, R. E, Alley, C. J. Bruegge, V. Carrere, J. S. Margolis, G. Vane,T. G. Chrien, P. N. Slater, S. F. Biggar, P. M. Teillet, R, D. Jackson and M. S. Moran, In-flightRadiometric Calibration of the Airborne Visible/Infrared Imaging Spectrometer (AVJRIS), SPIEVol. 924, Recent Advances in Sensors, Radiometry and Data Processing for Remote Sensing,1988.
Gao, B. C., and Goetz, A. F. H., “Column Atmospheric Water-Vapor And VegetationLiquid Water Retrievals From Airborne Imaging Spectrometer Data, ” Journal Of GeophysicalResearch Atmospheres, Vol. 95, No. D4, 1990.
Gao, B. C., Heidebrecht, K. B., Goetz, A. F. H., “Derivation Of Scaled SurfaceReflectance From AVIRIS Data”, Remote Sensing Of Environment, Vol. 44, No. 2-3, 1993.
Green, R. O., G. Vane, and J. E. Conel, “Determination of AVIRIS Spectral, Radiometric,Spatial and Signal-to-Noise characteristics Using atmospheric and surface measurements fromthe vicinity of the Rare-Earth-Bearing carbonatite at Mountain Pass, California,” in theProceedings of the Airborne Visible/Infrared Imaging Spectrometer (A VIRIS) PerformanceEvaluation Workshop, JPL Pub, 88-38, Jet Propulsion Laboratory, Pasadena, CA, pp. 162-184,1988.
145
Green, R. O., Retrieval of Reflectance from Calibrated Radiance Imagery Measured bythe Airborne Visible/Infrared Imaging Spectrometer (AVIRIS) for Lithological Mapping of theClark Mountains, California, Proc. Second AVIRIS Workshop, .7PL Publication 90-54, JetPropulsion Laboratory, Pasadena, CA, pp. 167-175, 1990.
Green, R. O., Retrieval of Reflectance From AVJRIS-Measured Radiance Using aRadiative Transfer Code, Proc. Third AVIRIS Workshop, JPL Publication 91-28, Jet PropulsionLaboratory, Pasadena, CA, pp. 200-210, 1991.
Green, R. O., J. E. Conel, J. Margolis, C. Bruegge and G. Hoover, “An InversionAlgorithm for Retrieval of Atmospheric and Leaf Water Absorption from AVIRIS Radiance withCompensation for Atmospheric Scattering,” Proceedings of the i%ird A VIRIS Workshop, R. O.Green, editor, JPL Publication 91-28, pp. 51-61, Jet Propulsion Laboratory, Pasadena, CA,1991.
Green, R. O., J. E. Conel and D. A. Roberts, “Estimation of Aerosol Optical Depth andCalculation of Apparent Surface Reflectance from Radiance Measured by the AirborneVisible/Infrared Imaging Spectrometer (AVIRIS) Using MODTRAN2,” SPIE Conf No. 1937,Imaging Spectromet~ of the Terrestrial Environment, p. 12, 1993.
Green, R. O., and B. C. Gao, “A Proposed Update to the Solar Irradiance Spectrum Usedin LOWTRAN and MODTRAN, ” Summaries of the Fourth Annual JPL Airborne GeoscienceWorkshop, JPL Publication 93-26, Jet Propulsion Laboratory, Pasadena, CA, 1993.
Green, R. O., and J. E. Conel, “Movement of Water Vapor in the Atmosphere Measuredby an Imaging Spectrometer at Rogers Dry Lake, CA, ” Summaries of the Fifth Annual JPLAirborne Earth Science Workshop, JPL Publication 95-1, Vol. 1, Jet Propulsion Laboratory,Pasadena, CA, 1995.
Kneizys, F. X., E. P. Shettle, G, P. Anderson, L. W. Abrew, J. H. Chetwynd, J. E. A.Shelby, and W. O. Gallery, “Atmospheric TransmittanceZUadiance; Computer Code LOWTMN7,” AFGL, Hanscom AFB, MA, 1987.
Press, W. H,, “Numerical Recipes: The Art of Scientific Computing,” CambridgeUniversity Press, Cambridge, 1986.
146