Embed Size (px)
DESCRIPTION
Living with SARS: The Economic Consequences on Singapore. Edward Robinson Economic Policy Department Monetary Authority of Singapore 2 August 2003. Outline of Presentation. Business Cycles in Singapore The Economy Pre-SARS Diagnosis: The Q2 Impact from SARS - PowerPoint PPT Presentation
Citation preview

Living with SARS: Living with SARS:
The Economic Consequences The Economic Consequences on Singaporeon Singapore
Edward Robinson
Economic Policy Department
Monetary Authority of Singapore
2 August 2003
Outline of Presentation
• Business Cycles in Singapore• The Economy Pre-SARS• Diagnosis: The Q2 Impact from
SARS• Post SARS: The Initial Upturn• Support Provided by
Macroeconomic Policy

Business Cycles
in Singapore

GDP Growth from 1980
-15
-10
-5
0
5
10
15
20
1980 1984 1988 1992 1996 2000
YO
Y %
Gro
wth
-60
-40
-20
0
20
40
60
80
YO
Y %
Gro
wth
Singapore’sReal GDP (LHS)
Composite Foreign
GDP (LHS)
Global Chip Sales (RHS)
2003Q2 (est.)

World Demand-Domestic Supply Curve
DS1
WD1
WD2
Price Level (Domestic currency)
Real GDPQ1Q2

Fall in External Demand
Drop in Exports
Businesses' Profit Margins Squeezed
Cutback in Investment Spending
Cutback in Labor Costs:Wage Cuts,
Shorter Work Weeks, Retrenching Workers
Private Disposable Income Falls
Drop in Consumer Spending
Consumer Sentiments Down
Decline in GDP
Dynamics of a
Downturn

A Different Kind of Shock
SARS:A MedicalEmergen
cy
Direct Impact
on Consume
r Behaviou
r
People Shun
Crowded Places
Negative Impact
on Commerce Sector
GDP Growth
Globalisation
Exposure to Foreign Risks

The Economy Pre-SARS

GDP Profile of Various Recessions in Singapore
96
98
100
102
104
106
108
110
112
114
-6 -5 -4 -3 -2 -1 0 1 2 3 4 5 6
Ind
ex
, Se
as
on
all
y A
dju
ste
dRecovery derailed by
uncertainties…
2001 Downturn
Trough = Q3 01
1998 Asia Financial Crisis
Trough = Q3 981985 Recession
Trough = Q4 85 Q2 2002
quarters

… as manufacturing output levelled off due to geopolitical
uncertainties…
95
100
105
110
115
120
125
130
135
Q12001
Q2 Q3 Q4 Q12002
Q2 Q3 Q4 Q12003
Ind
ex (
Q3
2001
=100
), S
A
Manufacturing Value-added
Q3 01

The Q2 Impact from SARS…
Verily I say unto you; where art
thou, my patrons?

Four Stages of an Epidemic
Timeline
Acceptance
Up to 4 quarters
Public accustomed to epidemic
Fears dissipated
Partial resumption of economic activity
Intensive research on cure
Possible Relapse
A few months
Denial Low public awareness
First fatality reported
1-2 quarters
Impact/Fear Greater public
awareness
Fear factor
Economic activity disrupted
Heightened uncertainties & risk aversion
Stepped up measures to prevent the spread of the disease
Recovery
Infection rate tapers off
Economic activity slowly returns to pre- crisis levels
Underperformance for several years before returning to trend

The outbreak had disproportionate impact on the
various sectors…
Tier 1:
Severely
Affected
Hotels
Air Transport

The outbreak had disproportionate impact on the
various sectors…
Tier 2: Significantly Affected
Restaurants
Retail
Land Transport
Tier 1:
Severely
Affected Hotels
Air Transport

The outbreak had disproportionate impact on the
various sectors…
Tier 1:
Severely
Affected
Hotels
Air Transport
Tier 3: Moderately Affected
Real Estate
Stock broking
Tier 2: Significantly Affected
Restaurants
Retail
Land Transport

The outbreak had disproportionate impact on the
various sectors…
Tier 1:
Severely
Affected
Hotels
Air Transport
Tier 4: Less Affected
Manufacturing
Construction
Post and Communication
Wholesale
Sea Transport
Services Allied to Transport
Tier 2: Significantly Affected
Restaurants
Retail
Land Transport
Tier 3: Moderately Affected
Real Estate
Stock broking

45
50
55
60
65
70
75
80
85
Jan2000
Jul Jan2001
Jul Jan2002
Jul Jan2003
Ra
tio
-70
-60
-50
-40
-30
-20
-10
0
10
20
30
YO
Y %
Gro
wth
Air Passenger Growth (RHS)
Passenger Load Factor (LHS)
100
200
300
400
500
600
700
800
Jan2000
Jul Jan2001
Jul Jan2002
Jul Jan2003
Th
ou
san
ds
-90
-60
-30
0
30
YO
Y %
Gro
wth
Level (SA)
YOY Growth
Tier 1 Travel Related Segments
State in Apr-May: Critical Condition
Visitor Arrivals Air Passenger
May May

100
120
140
160
180
200
Jan2002
Apr Jul Oct Jan2003
Apr
Ind
ex
(1
99
7=
10
0)
-30
-20
-10
0
10
20
YO
Y %
Gro
wth
Level YOY Growth
State in Apr-May: Weak Condition
Tier 2 Domestic Oriented Segments
Retail Sales Volume

Tier 3 Asset Markets
State in Apr-May: Moderately Affected
95
105
115
125
135
Jan Feb Mar Apr May Jun Jul2
Tro
ug
h =
10
0
US (NASDAQ)
US (DJIA)
Singapore (STI)
2003

Domestic Demand-Supply CurveDS1
DD1
Price Level (Domestic currency)
Real GDPQ1Q2
DD2
DS2
Q3

Deadweight Cost to Society
Q3 Q2
DS1DS2
DD1
DD2
Real GDP
Price Level (Domestic currency)
Q1

Support Provided by Policy

Fiscal Support
Expansionary Fiscal Policy
off-budget packages
TransportIndustries$73.5m
Courage Fund$14.8m
Tourism-related Industries
$155m
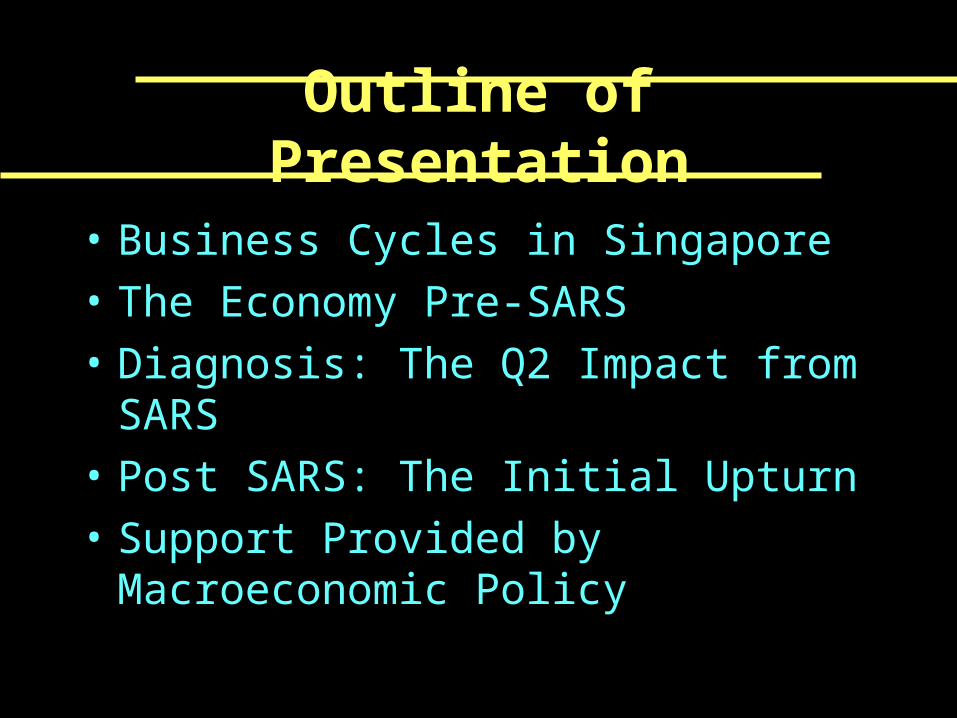
Monetary Support
Conducive Monetary Conditions
Low Interest Rates Flexible Mgt of S$

Support Provided by PolicyDS1
DD1
Price Level (Domestic currency)
Real GDPQ1
DD2
DS2
A
DS3
B
Q3
Q4
Q2

Post-SARS: the
InitialUpturn
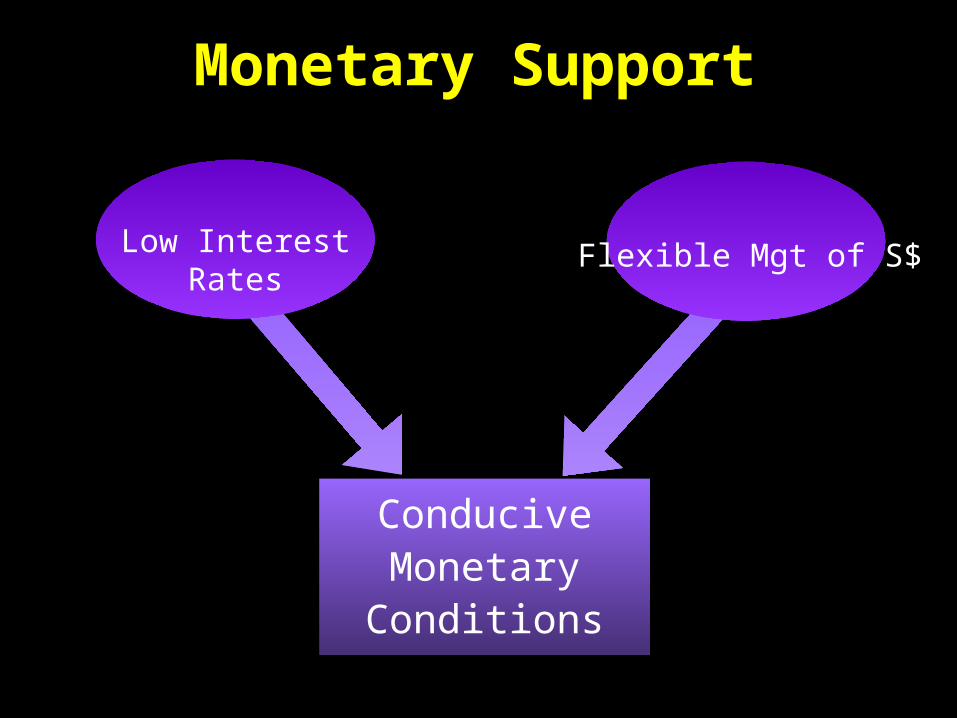
Travel-related sectors saw a modest turnaround around
end-Q2
-80
-60
-40
-20
0
20
40
60
80
2000 2001 2002 2003
MO
M S
A %
Gro
wth
20
30
40
50
60
70
80
90
Ho
tel
Occ
up
ancy
Rat
e (%
), S
A
Air Passengers Handled (LHS)
Jun
Visitor Arrivals
(LHS)
Hotel Occupancy Rate (RHS)

Manufacturing sector could see some recovery going forward
Recession Unlikely, Q3 growth positive, Improvement in Sars hit sectors
90
95
100
105
110
115
120
125
2000 2001 2002 2003
Ind
ex (
1999
=10
0),
SA
7
8
9
10
11
$ B
n,
SA
Index of Industrial Production (LHS)
Non-oil Domestic
Exports (RHS)
Jun

Outlook for GrowthExpansiona
ry Fiscal Policy
multiplier effect
Support for the economy
Easier Monetary
Condition
s
Weak External Demand?
2nd Waveof Infection?
GDP Forecast Range
0.5 – 2.5%

Singapore hit by increasing frequency of shocks
* Key Points *
Sars was different in natureSars was different in nature• Medical Emergency• Both DD/SS Effects• Sectoral Specific
Economic ResilienceEconomic Resilience• Strong Institutions
• Decisive Govt Response (Medical+Economic) • Flexibility in Markets • Social Cohesion

~ Thank You ~