Embed Size (px)
Citation preview

Living Standards Measurement Study –Integrated Surveys on Agriculture:
Main Features, Challenges and Next Steps
Gero CarlettoDevelopment Research Group
The World Bank
February 27th, 2012
Outline• The Living Standards Measurement Study• The LSMS-ISA project– Main features– Progress to date
• Methodological validation/research• Challenges• Next steps
The LSMS• Flagship initiative in DECRG since 1980• Evolution …– Poverty monitoring and measurement: the
“McNamara anecdote”– Technical assistance, capacity building– Back to the “roots”: “wholesale” research– Focus on agriculture: LSMS-ISA
The LSMS-ISA project• Started in early 2009• Tanzania pilot in mid-2008
• Funding from the Bill and Melinda Gates Foundation, with additional funding from USAID, DFID and a number of other sources, including governments
• Working on four fronts:• Household survey data collection• Methodological validation/research/tool development• Capacity Building• Dissemination
The team• Gero Carletto• Luc Christiaensen (from Nov 2011)• Kinnon Scott (on DAIS until Sept. 2012)• Kathleen Beegle (WDR until June 2012)• Diane Steele (LSMS Database coordinator)• Talip Kilic• Kristen Himelein (sampling)• Mimi Oseni (50% with AFTAR)• Alberto Zezza (50% with LDIA project)• Siobhan Murray (GIS; part-time)• Raka Banerjee (ETC; project coordinator)• Jon Kastelic (formerly in Malawi; data processing)• Prospere Backiny-Yetna (in Mali; formerly in Niger)• Bjorn Campenhout (in Uganda, 50% with IFPRI)• Colin Williams (formerly in Nigeria, now on STC)
Main Features• 6+ year program (2009-2015)• Panel household surveys with emphasis on
agriculture in 7 Sub-Saharan African countries• Sample: 3-5,000 households– Population-based frame (Global Strategy)– Representative at national- and few sub-national
levels• Tracking– Movers– Subsample of individual split-offs
Main Features (cont’d)
• Multi-faceted “integration”– Multi-topic survey instrument
• Farm plus nonfarm, consumption, nutrition, inter alia– Build on existing/planned surveys
• country ownership• Sustainability• … but large trade-offs
– Link to major initiatives• National Strategy for the Development of Statistics (NSDS)• Global Strategy to Improve Agricultural and Rural Statistics
– Improved links to other data sources• GIS, censuses, surveys, etc.
Main Features (cont’d)
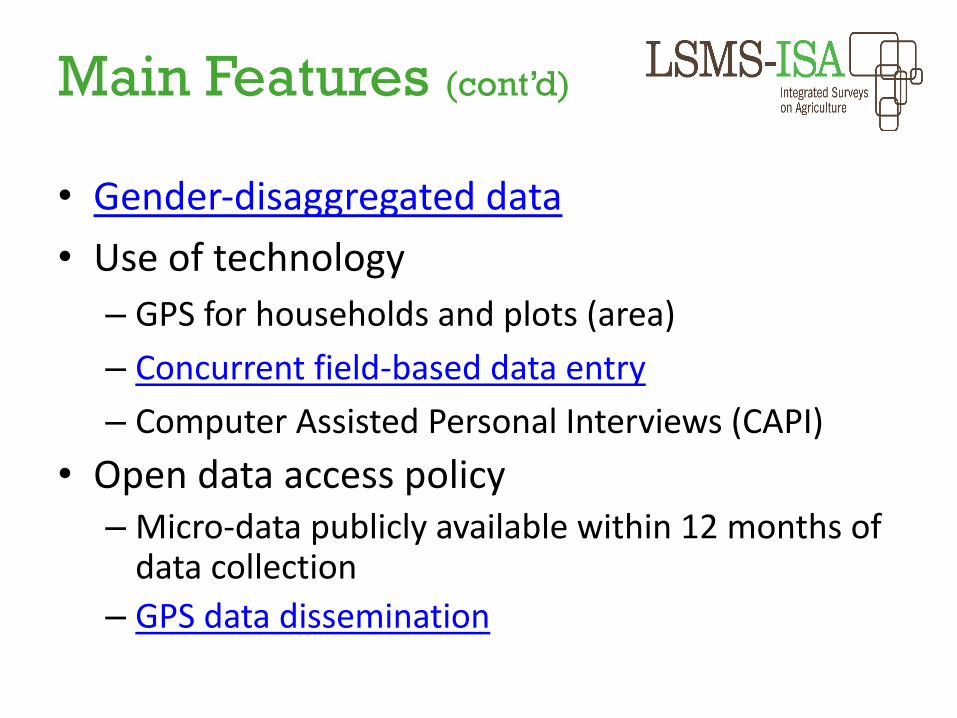
• Gender-disaggregated data• Use of technology– GPS for households and plots (area)– Concurrent field-based data entry– Computer Assisted Personal Interviews (CAPI)
• Open data access policy– Micro-data publicly available within 12 months of
data collection– GPS data dissemination
Main Features (cont’d)
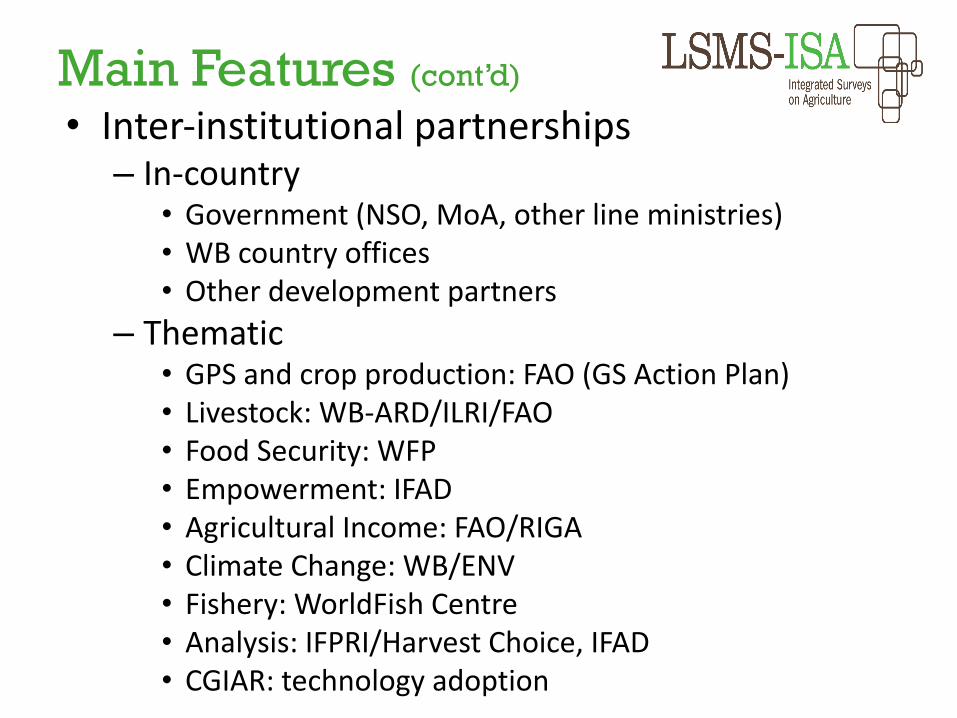
• Inter-institutional partnerships– In-country• Government (NSO, MoA, other line ministries)• WB country offices• Other development partners
– Thematic• GPS and crop production: FAO (GS Action Plan)• Livestock: WB-ARD/ILRI/FAO• Food Security: WFP• Empowerment: IFAD• Agricultural Income: FAO/RIGA• Climate Change: WB/ENV• Fishery: WorldFish Centre• Analysis: IFPRI/Harvest Choice, IFAD• CGIAR: technology adoption
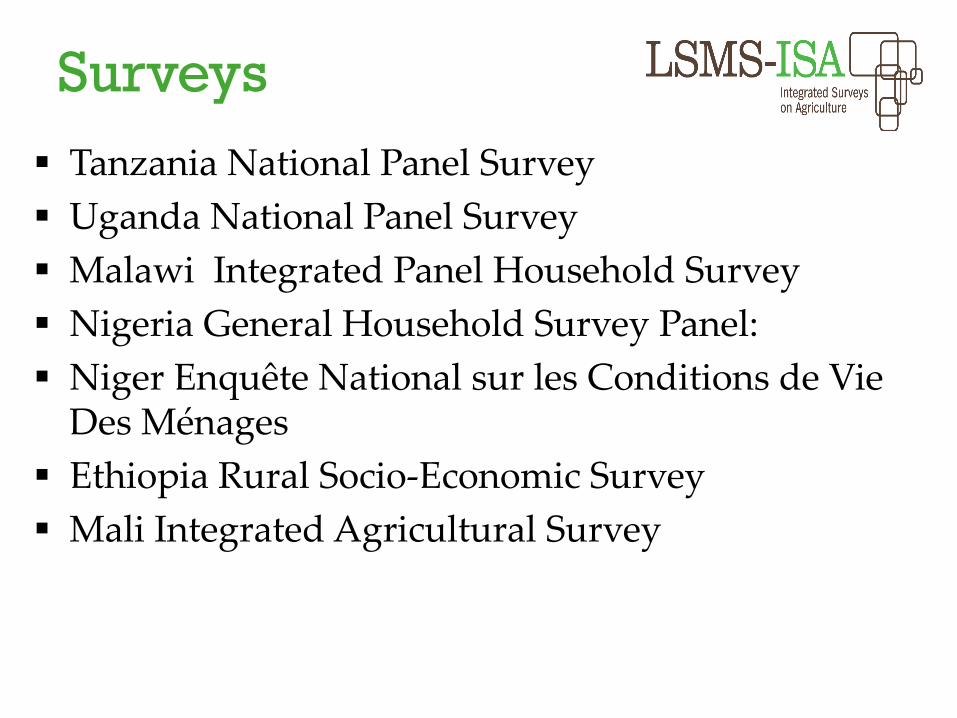
Surveys§ Tanzania National Panel Survey
§ Uganda National Panel Survey
§ Malawi Integrated Panel Household Survey
§ Nigeria General Household Survey Panel:
§ Niger Enquête National sur les Conditions de Vie Des Ménages
§ Ethiopia Rural Socio-Economic Survey
§ Mali Integrated Agricultural Survey
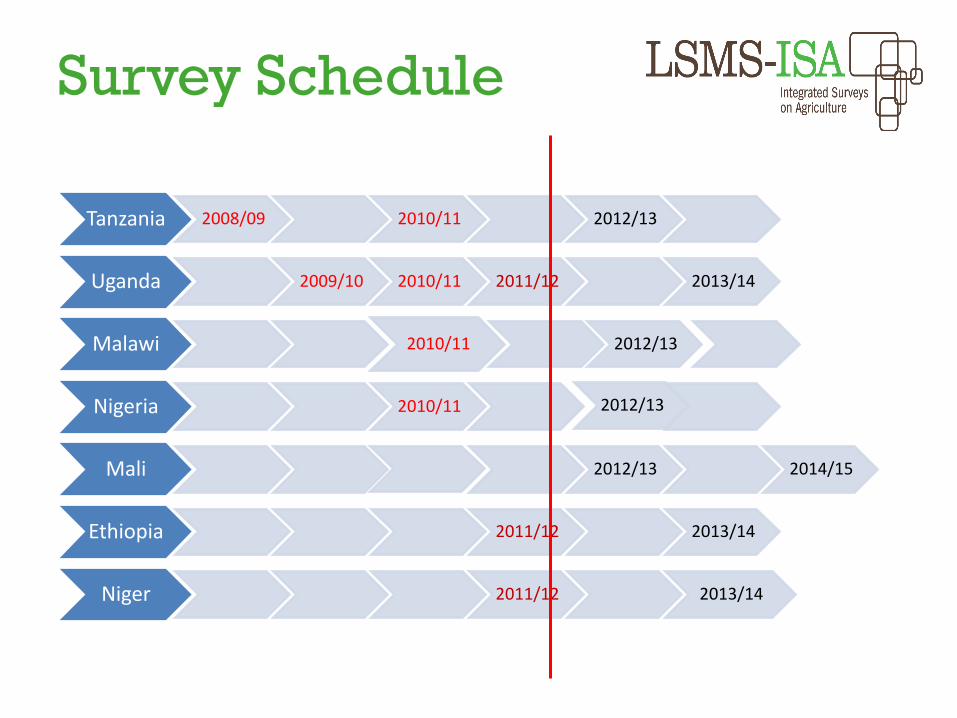
Survey Schedule
Tanzania 2008/09 2010/11 2012/13
Uganda 2009/10 2010/11 2011/12 2013/14
Malawi 2010/11 2012/13
Nigeria 2010/11 2012/13
Mali 2012/13 2014/15
Ethiopia 2011/12 2013/14
Niger 2011/12 2013/14
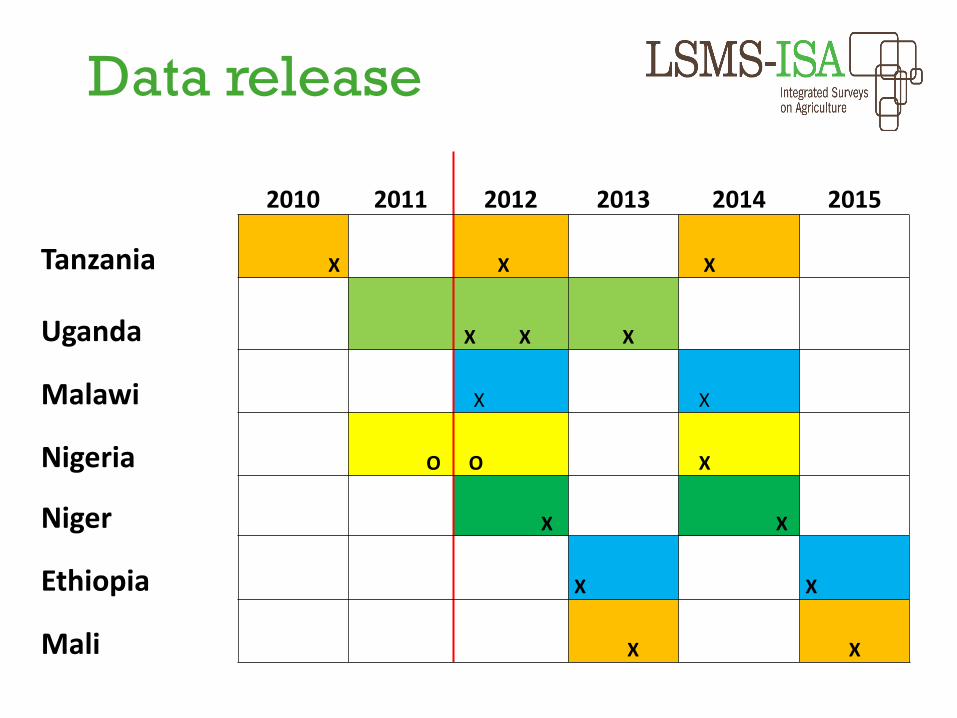
Data release
2010 2011 2012 2013 2014 2015
Tanzania X X X
Uganda X X X
Malawi X X
Nigeria O O X
Niger X X
Ethiopia X X
Mali X X
Project outputs• Documented public-access microdata• Sourcebooks, best practice guidelines• Tools– Computer Assisted Personal Interviews (CAPI)
software– ADePT-Agriculture and ADePT-Livestock– Comparative Living Standards Project (CLSP)
• Research and analysis for policy and programming
• Methodological validation– Research pillar of Action Plan of Global Strategy– DFID grant
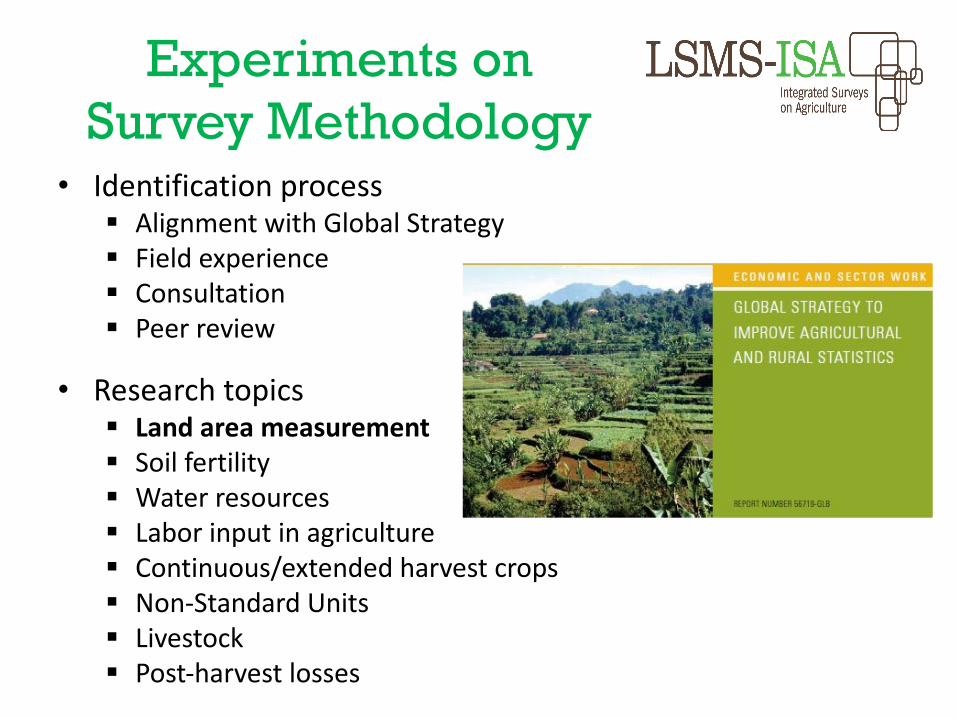
Experiments on Survey Methodology
• Identification process§ Alignment with Global Strategy§ Field experience§ Consultation§ Peer review
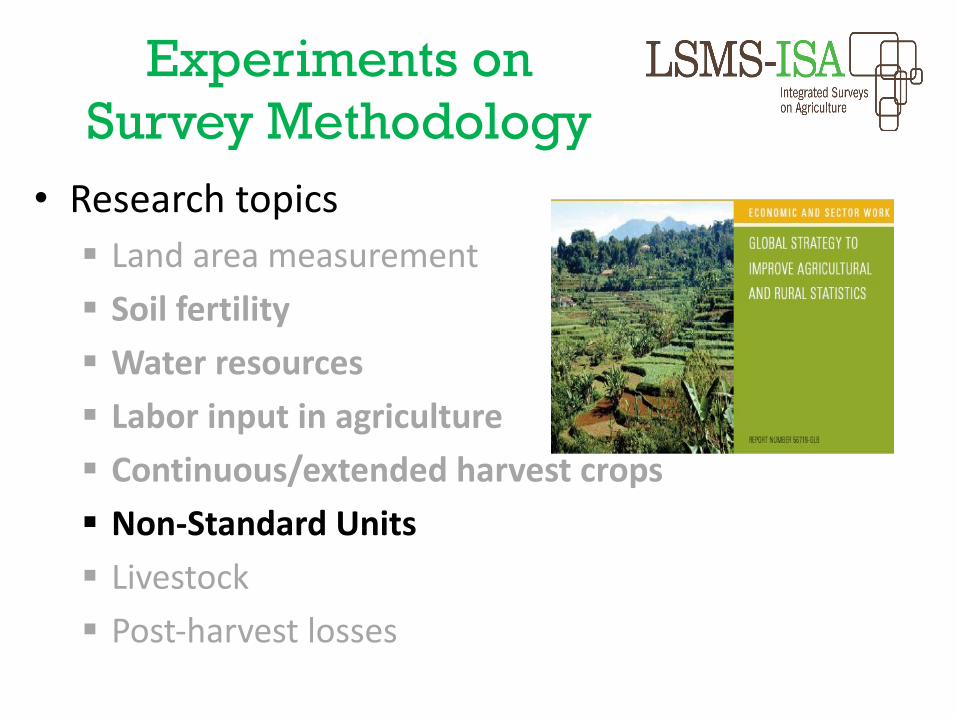
• Research topics§ Land area measurement§ Soil fertility§ Water resources§ Labor input in agriculture§ Continuous/extended harvest crops§ Non-Standard Units§ Livestock§ Post-harvest losses
Land Area Measurement
• Why is it important?• Fundamental component of agricultural statistics• Priority #1 of Global Strategy• Current methods inaccurate or impractical
• What are the different methods available?• Traversing (compass and rope method)• P2/A• Self-reporting• GPS
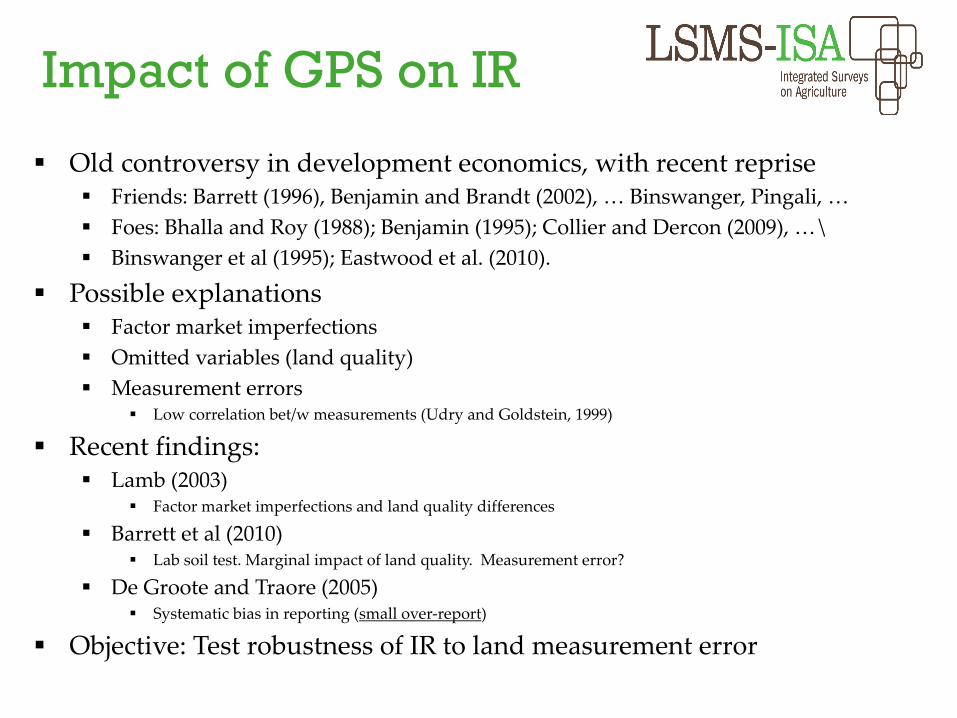
Impact of GPS on IR
§ Old controversy in development economics, with recent reprise§ Friends: Barrett (1996), Benjamin and Brandt (2002), … Binswanger, Pingali, …§ Foes: Bhalla and Roy (1988); Benjamin (1995); Collier and Dercon (2009), …\§ Binswanger et al (1995); Eastwood et al. (2010).
§ Possible explanations§ Factor market imperfections§ Omitted variables (land quality)§ Measurement errors
§ Low correlation bet/w measurements (Udry and Goldstein, 1999)
§ Recent findings:§ Lamb (2003)
§ Factor market imperfections and land quality differences
§ Barrett et al (2010)§ Lab soil test. Marginal impact of land quality. Measurement error?
§ De Groote and Traore (2005)§ Systematic bias in reporting (small over-report)
§ Objective: Test robustness of IR to land measurement error
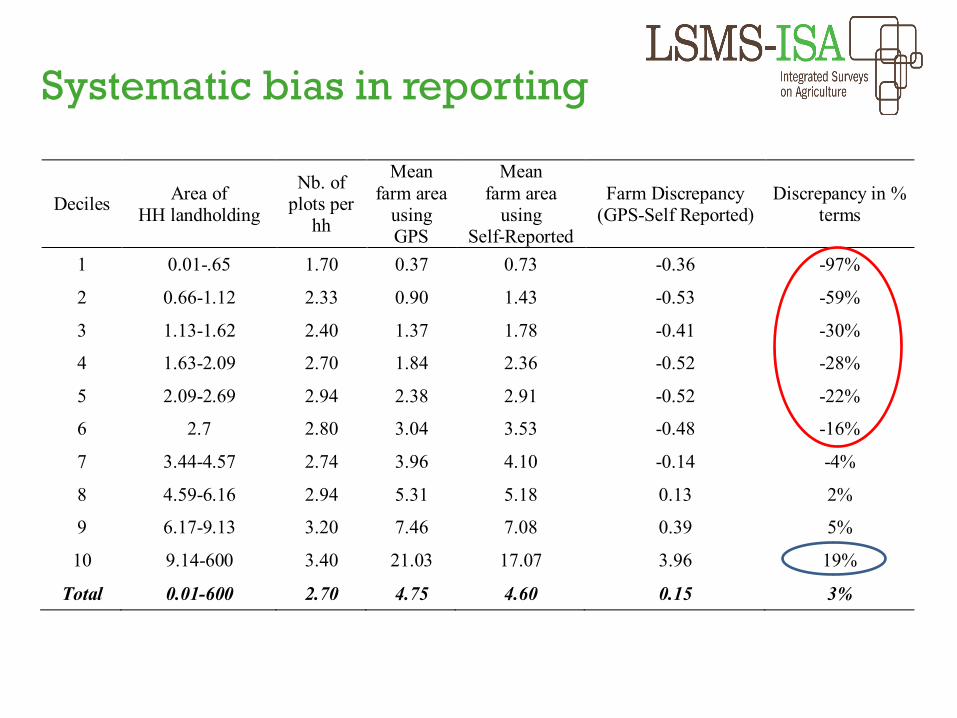
Systematic bias in reporting
Deciles Area of HH landholding
Nb. of plots per
hh
Mean farm area
using GPS
Mean farm area
using Self-Reported
Farm Discrepancy (GPS-Self Reported)
Discrepancy in % terms
1 0.01-.65 1.70 0.37 0.73 -0.36 -97%
2 0.66-1.12 2.33 0.90 1.43 -0.53 -59%
3 1.13-1.62 2.40 1.37 1.78 -0.41 -30%
4 1.63-2.09 2.70 1.84 2.36 -0.52 -28%
5 2.09-2.69 2.94 2.38 2.91 -0.52 -22%
6 2.7 2.80 3.04 3.53 -0.48 -16%
7 3.44-4.57 2.74 3.96 4.10 -0.14 -4%
8 4.59-6.16 2.94 5.31 5.18 0.13 2%
9 6.17-9.13 3.20 7.46 7.08 0.39 5%
10 9.14-600 3.40 21.03 17.07 3.96 19%
Total 0.01-600 2.70 4.75 4.60 0.15 3%
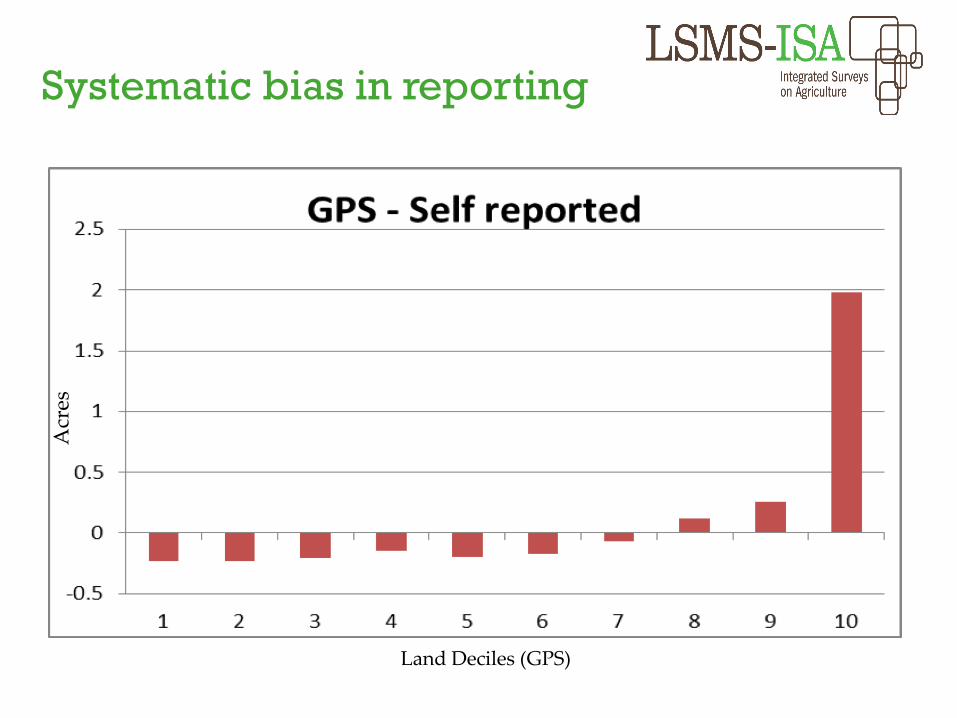
Land Deciles (GPS)
Acr
esSystematic bias in reporting
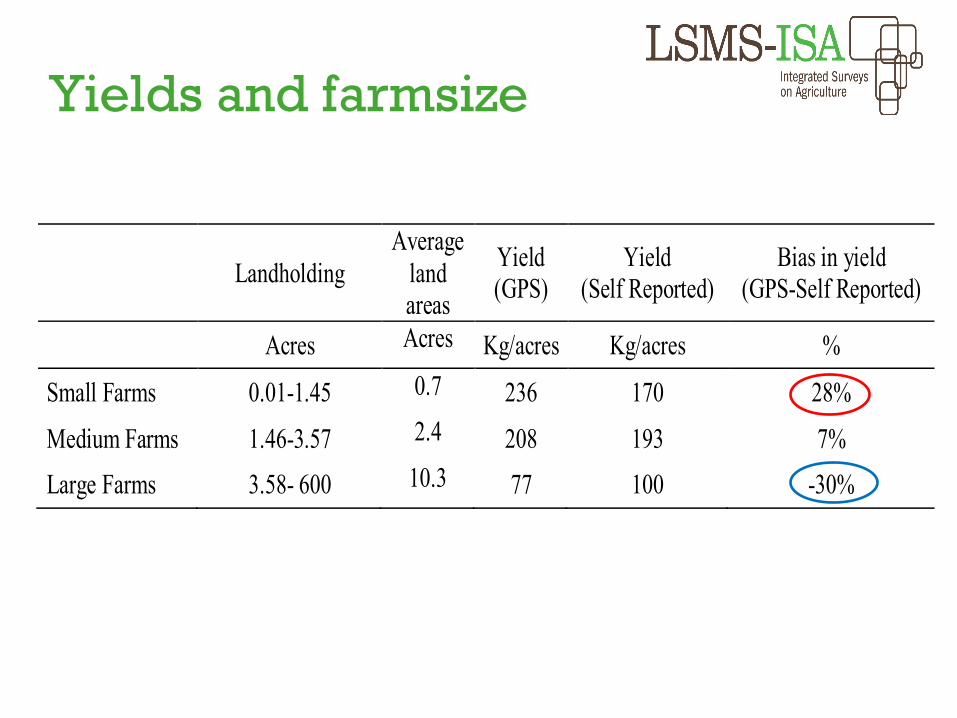
Yields and farmsize
Landholding Average
land areas
Yield (GPS)
Yield (Self Reported)
Bias in yield (GPS-Self Reported)
Acres Acres Kg/acres Kg/acres %
Small Farms 0.01-1.45 0.7 236 170 28%
Medium Farms 1.46-3.57 2.4 208 193 7%
Large Farms 3.58- 600 10.3 77 100 -30%
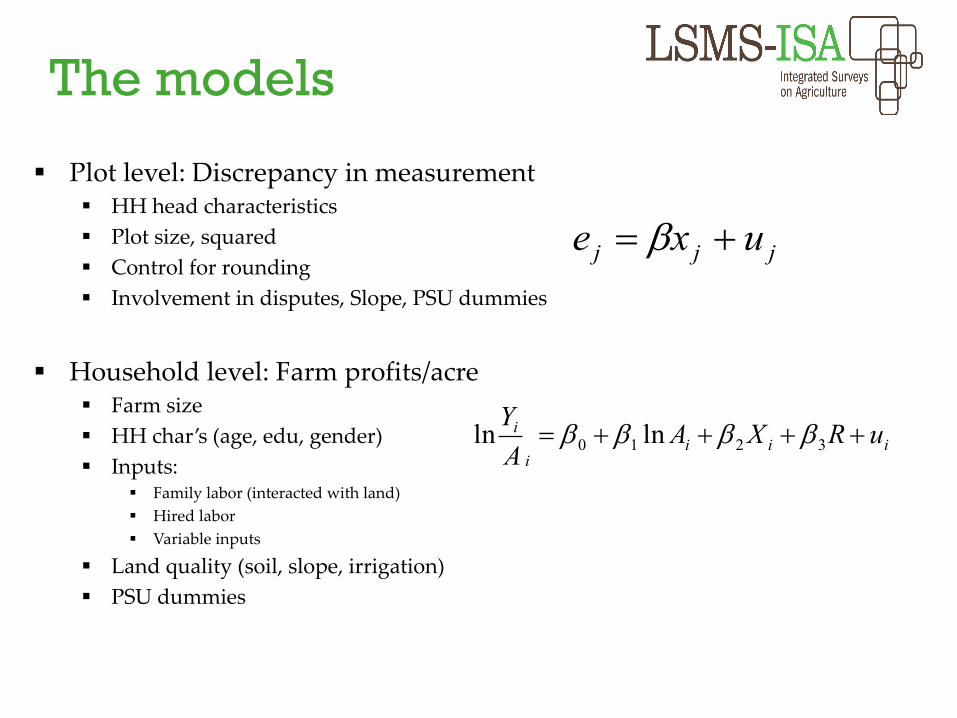
The models
§ Plot level: Discrepancy in measurement§ HH head characteristics§ Plot size, squared§ Control for rounding§ Involvement in disputes, Slope, PSU dummies
§ Household level: Farm profits/acre§ Farm size§ HH char’s (age, edu, gender)§ Inputs:
§ Family labor (interacted with land)§ Hired labor§ Variable inputs
§ Land quality (soil, slope, irrigation)§ PSU dummies
jjj uxe += b
iii
i
i uRXAAY
++++= 3210 lnln bbbb
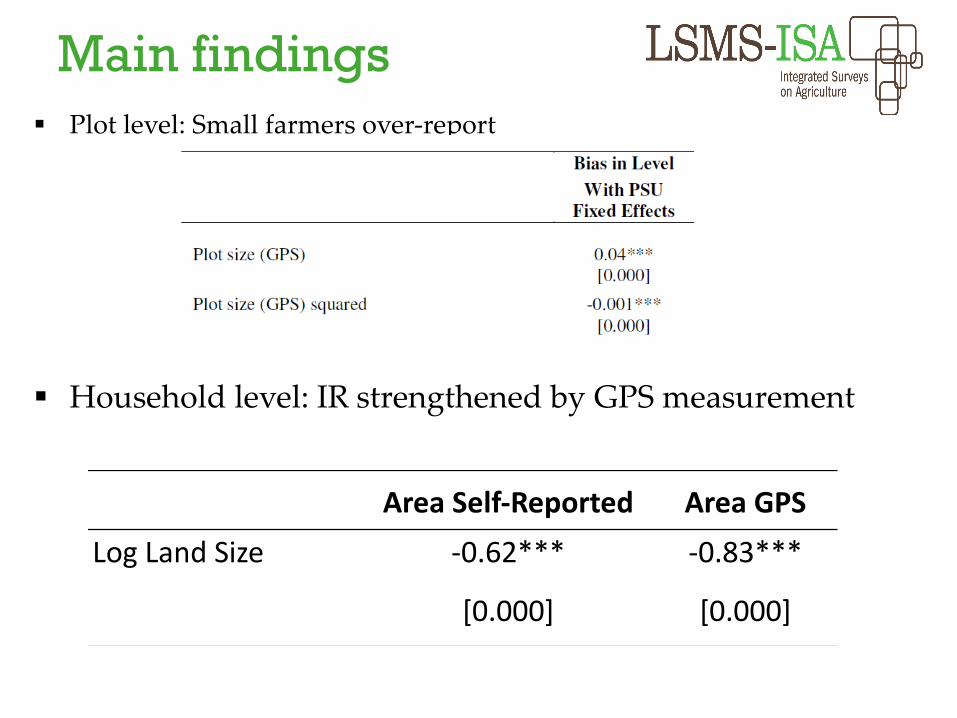
Main findings§ Plot level: Small farmers over-report
§ Household level: IR strengthened by GPS measurement
Area Self-Reported Area GPSLog Land Size -0.62*** -0.83***
[0.000] [0.000]
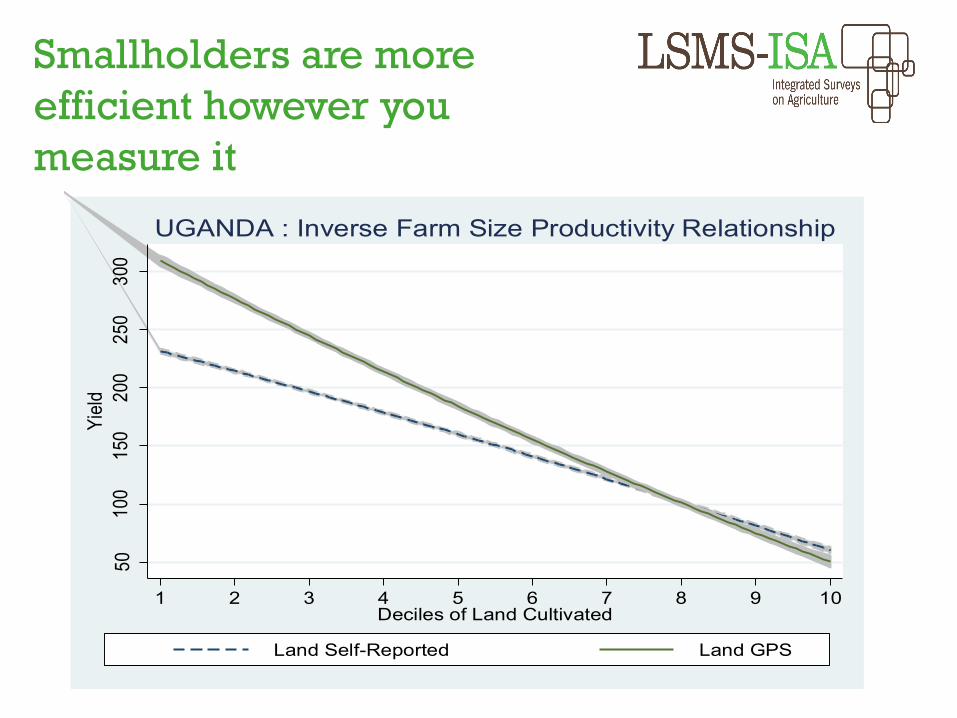
Smallholders are more efficient however you measure it
5010
015
020
025
030
0Yi
eld
1 2 3 4 5 6 7 8 9 10Deciles of Land Cultivated
Land Self-Reported Land GPS
UGANDA : Inverse Farm Size Productivity Relationship
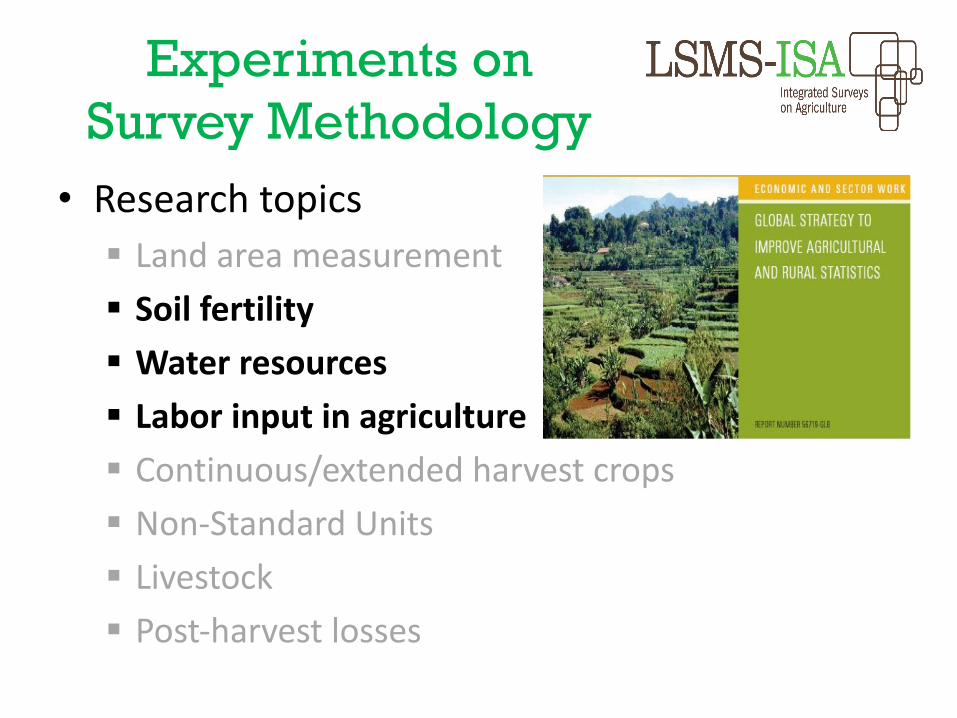
Experiments on Survey Methodology• Research topics
§ Land area measurement§ Soil fertility§ Water resources§ Labor input in agriculture§ Continuous/extended harvest crops§ Non-Standard Units§ Livestock§ Post-harvest losses
Soil Fertility
• Why is it important?• Fundamental driver of productivity in Africa –
remains a key unobserved variable for analysis
• What are the different methods available?• Conventional soil analysis (CSA)• Farmers’ subjective evaluations • Spectral soil analysis (SSA)
Water Resources• Why is it important?• Agriculture in Africa is predominantly rainfed – water is a
key input to production• Large discrepancies across data sources• Low resolution/idiosyncratic risk• Lack of access to data
• What are the different methods available?• Satellite imagery• Weather stations• Self-reporting• Community rain gauges
Labor Inputs
• Why is it important?• Labor inputs are fundamental to labor
productivity measurement• Very poorly measured
• What are the different methods available?• Recall (6 month or 12 month, by activity, by
demographics)• Computer-assisted telephone interviews (CATI)• Labor input diaries
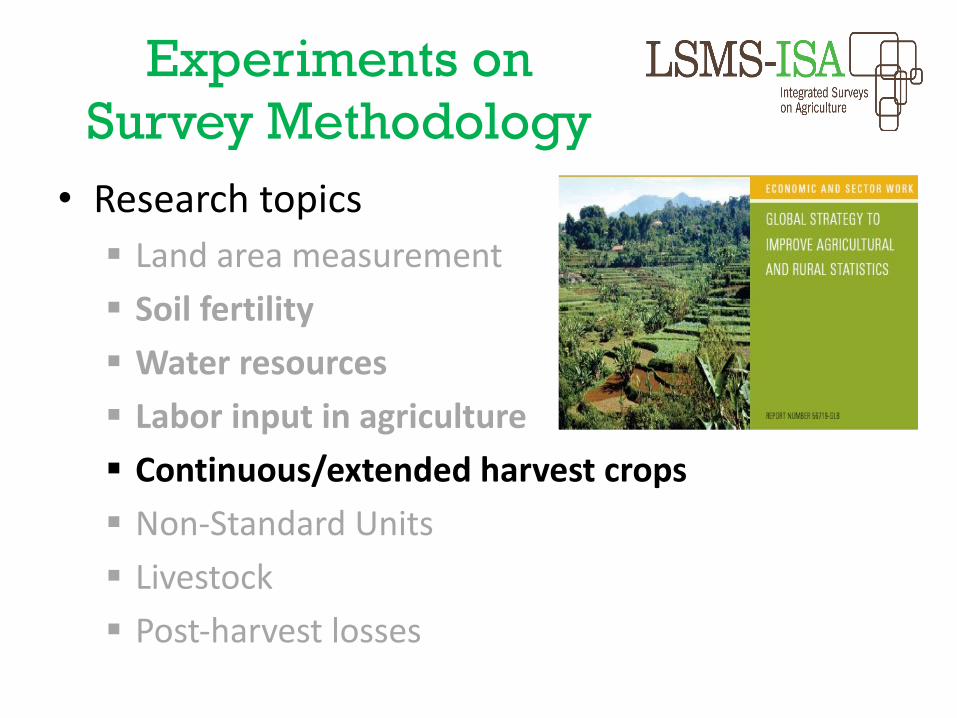
Experiments on Survey Methodology• Research topics
§ Land area measurement§ Soil fertility§ Water resources§ Labor input in agriculture§ Continuous/extended harvest crops§ Non-Standard Units§ Livestock§ Post-harvest losses
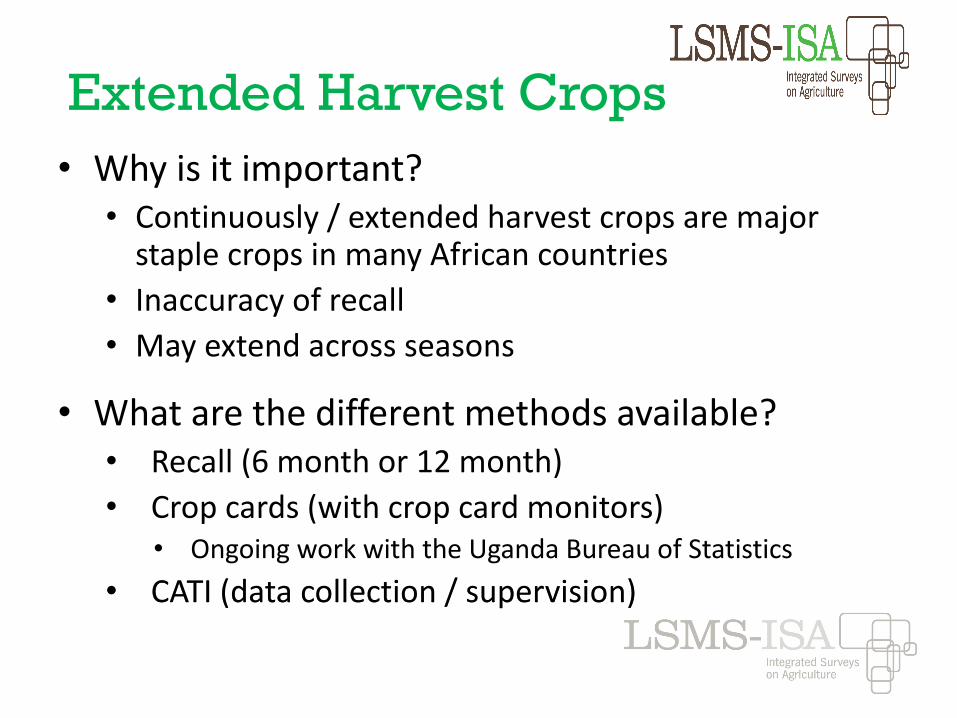
Extended Harvest Crops• Why is it important?• Continuously / extended harvest crops are major
staple crops in many African countries• Inaccuracy of recall• May extend across seasons
• What are the different methods available?• Recall (6 month or 12 month)• Crop cards (with crop card monitors)
• Ongoing work with the Uganda Bureau of Statistics• CATI (data collection / supervision)
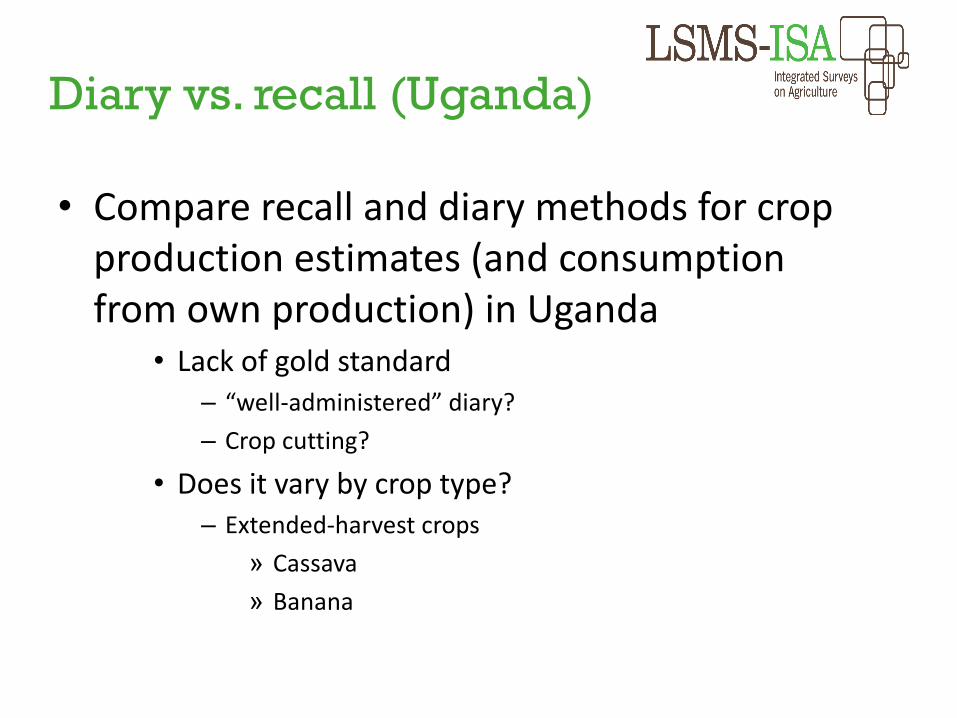
Diary vs. recall (Uganda)
• Compare recall and diary methods for crop production estimates (and consumption from own production) in Uganda
• Lack of gold standard– “well-administered” diary?– Crop cutting?
• Does it vary by crop type?– Extended-harvest crops
» Cassava» Banana
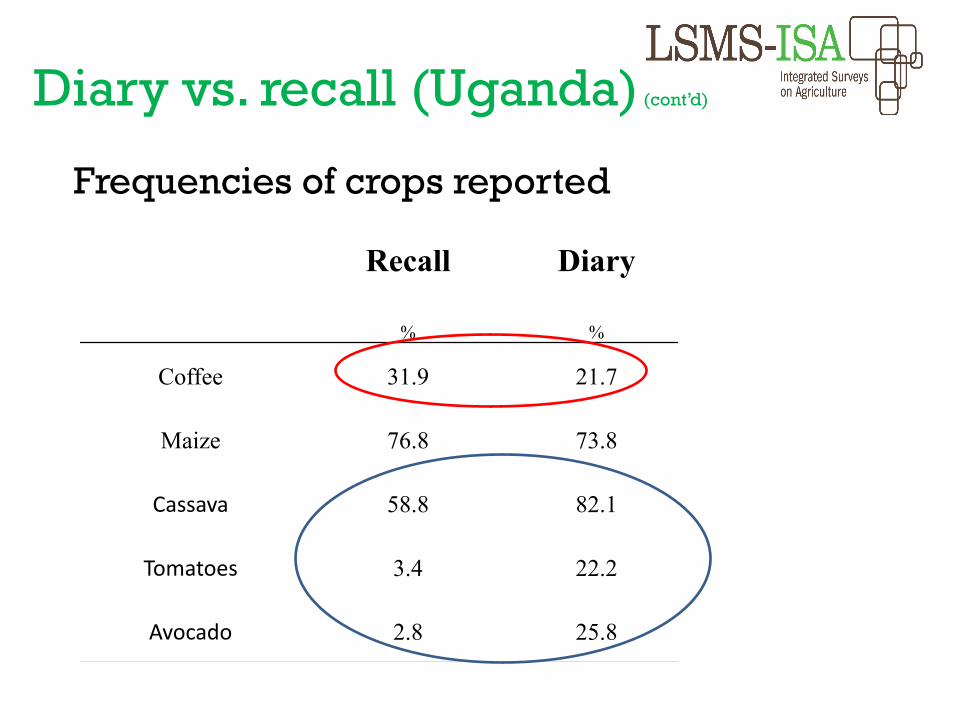
Frequencies of crops reported
Recall Diary
% %
Coffee 31.9 21.7
Maize 76.8 73.8
Cassava 58.8 82.1
Tomatoes 3.4 22.2
Avocado 2.8 25.8
Diary vs. recall (Uganda) (cont’d)
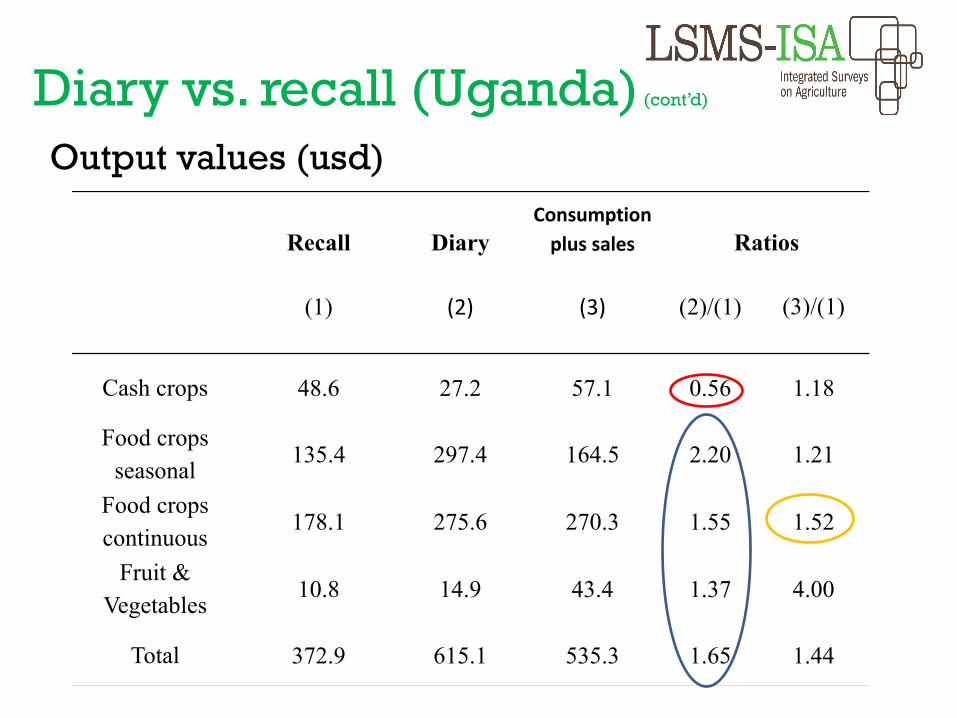
Output values (usd)
Recall DiaryConsumption
plus sales Ratios
(1) (2) (3) (2)/(1) (3)/(1)
Cash crops 48.6 27.2 57.1 0.56 1.18
Food crops seasonal
135.4 297.4 164.5 2.20 1.21
Food crops continuous
178.1 275.6 270.3 1.55 1.52
Fruit & Vegetables
10.8 14.9 43.4 1.37 4.00
Total 372.9 615.1 535.3 1.65 1.44
Diary vs. recall (Uganda) (cont’d)
Experiments on Survey Methodology
• Research topics§ Land area measurement§ Soil fertility§ Water resources§ Labor input in agriculture§ Continuous/extended harvest crops§ Non-Standard Units§ Livestock§ Post-harvest losses
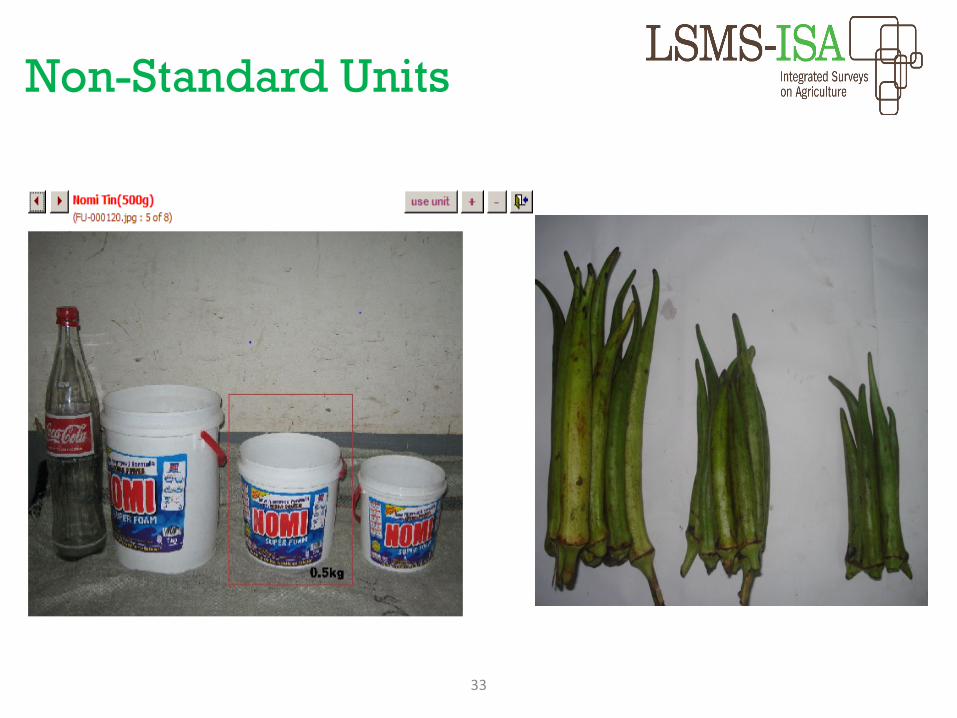
Non-Standard Units
33
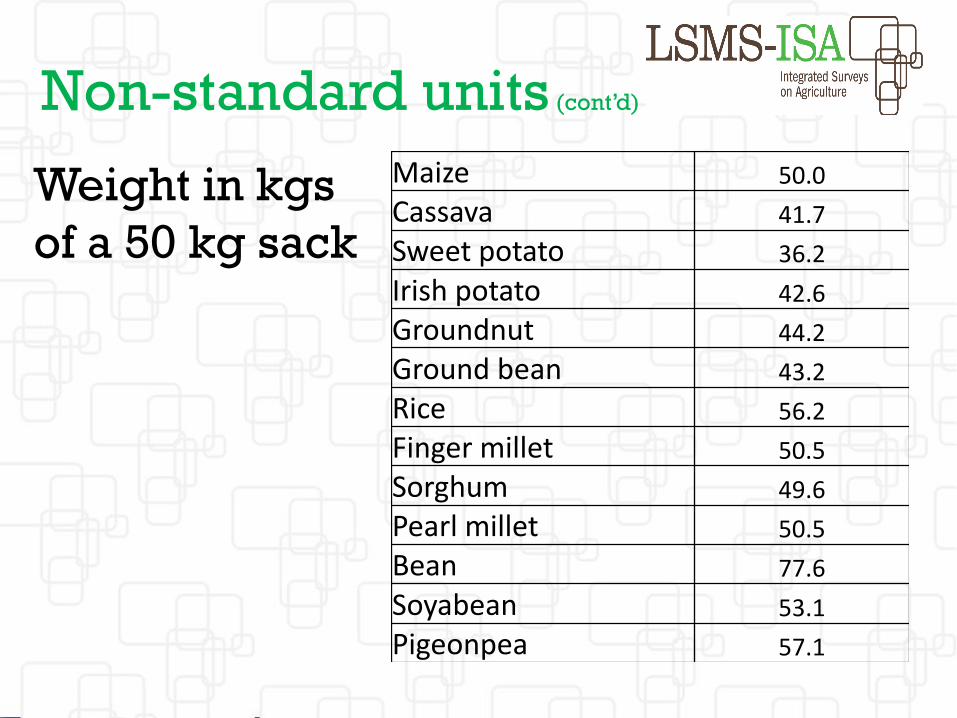
Weight in kgsof a 50 kg sack
Maize 50.0Cassava 41.7Sweet potato 36.2Irish potato 42.6Groundnut 44.2Ground bean 43.2Rice 56.2Finger millet 50.5Sorghum 49.6Pearl millet 50.5Bean 77.6Soyabean 53.1Pigeonpea 57.1
Non-standard units (cont’d)
Non-standard units (cont’d)
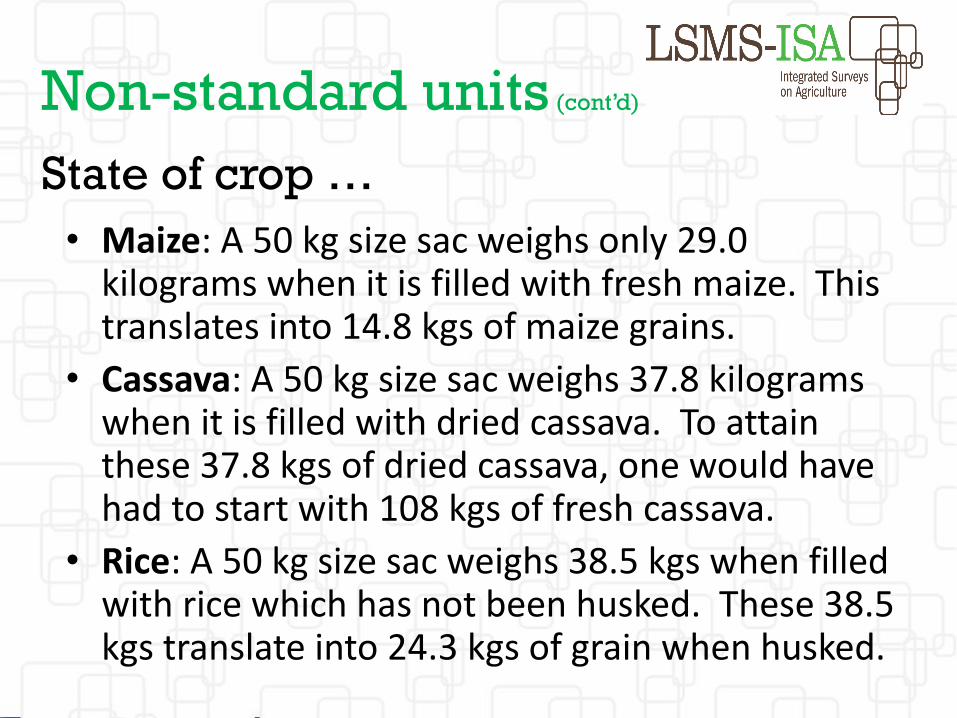
• Maize: A 50 kg size sac weighs only 29.0 kilograms when it is filled with fresh maize. This translates into 14.8 kgs of maize grains.
• Cassava: A 50 kg size sac weighs 37.8 kilograms when it is filled with dried cassava. To attain these 37.8 kgs of dried cassava, one would have had to start with 108 kgs of fresh cassava.
• Rice: A 50 kg size sac weighs 38.5 kgs when filled with rice which has not been husked. These 38.5 kgs translate into 24.3 kgs of grain when husked.
State of crop …
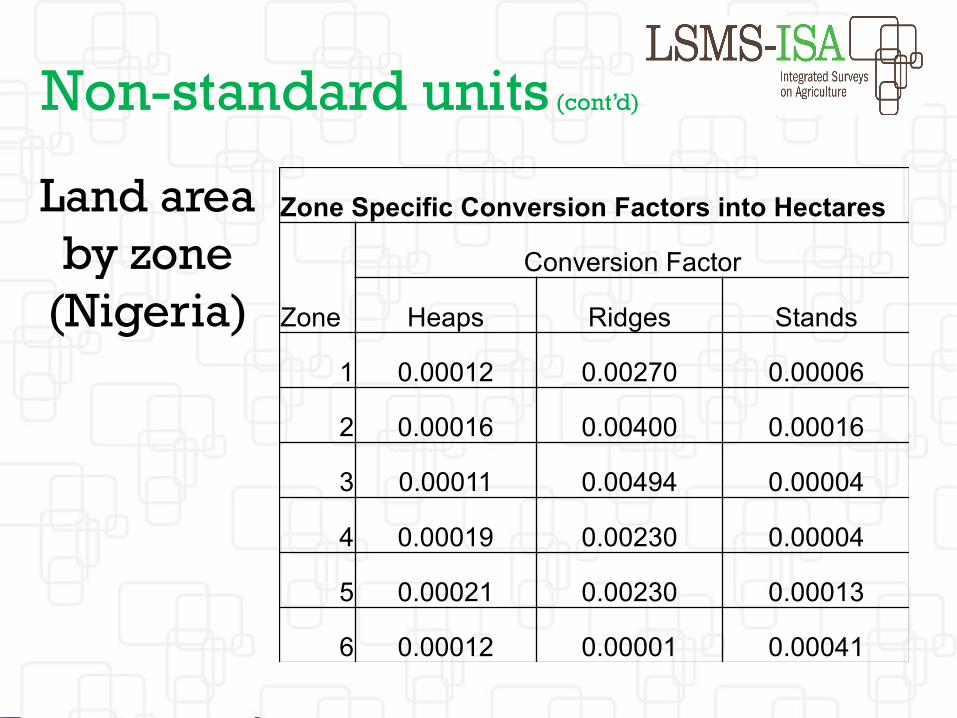
Land area by zone
(Nigeria)
Zone Specific Conversion Factors into Hectares
Zone
Conversion Factor
Heaps Ridges Stands
1 0.00012 0.00270 0.00006
2 0.00016 0.00400 0.00016
3 0.00011 0.00494 0.00004
4 0.00019 0.00230 0.00004
5 0.00021 0.00230 0.00013
6 0.00012 0.00001 0.00041
Non-standard units (cont’d)
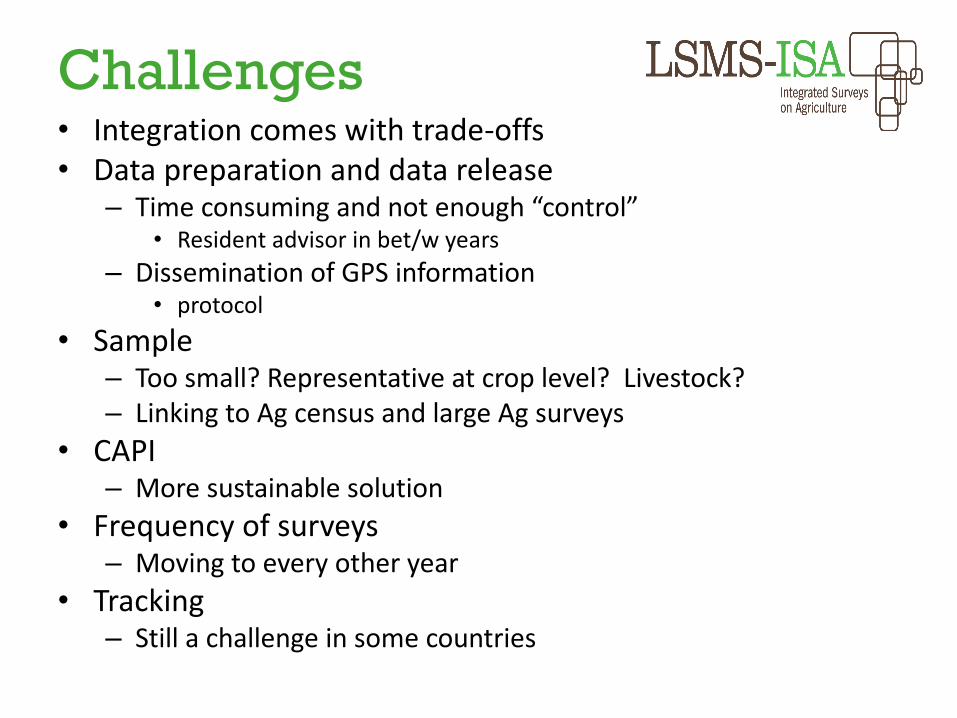
Challenges• Integration comes with trade-offs• Data preparation and data release
– Time consuming and not enough “control”• Resident advisor in bet/w years
– Dissemination of GPS information• protocol
• Sample– Too small? Representative at crop level? Livestock?– Linking to Ag census and large Ag surveys
• CAPI– More sustainable solution
• Frequency of surveys– Moving to every other year
• Tracking– Still a challenge in some countries
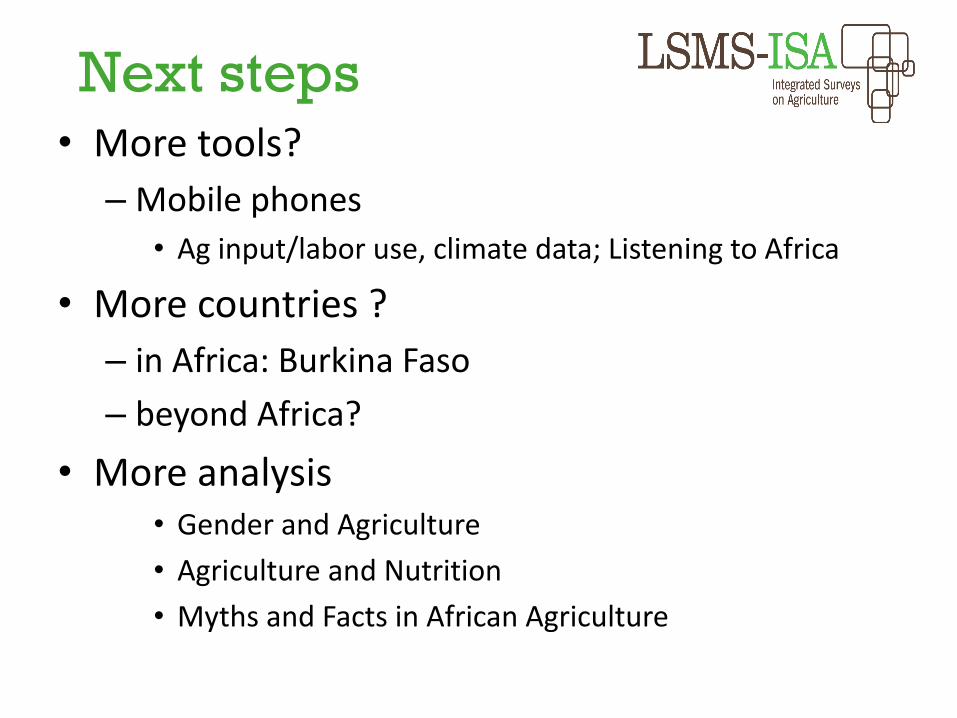
Next steps• More tools?– Mobile phones• Ag input/labor use, climate data; Listening to Africa
• More countries ?– in Africa: Burkina Faso– beyond Africa?
• More analysis• Gender and Agriculture• Agriculture and Nutrition• Myths and Facts in African Agriculture
http://www.worldbank.org/lsms-isa

The End
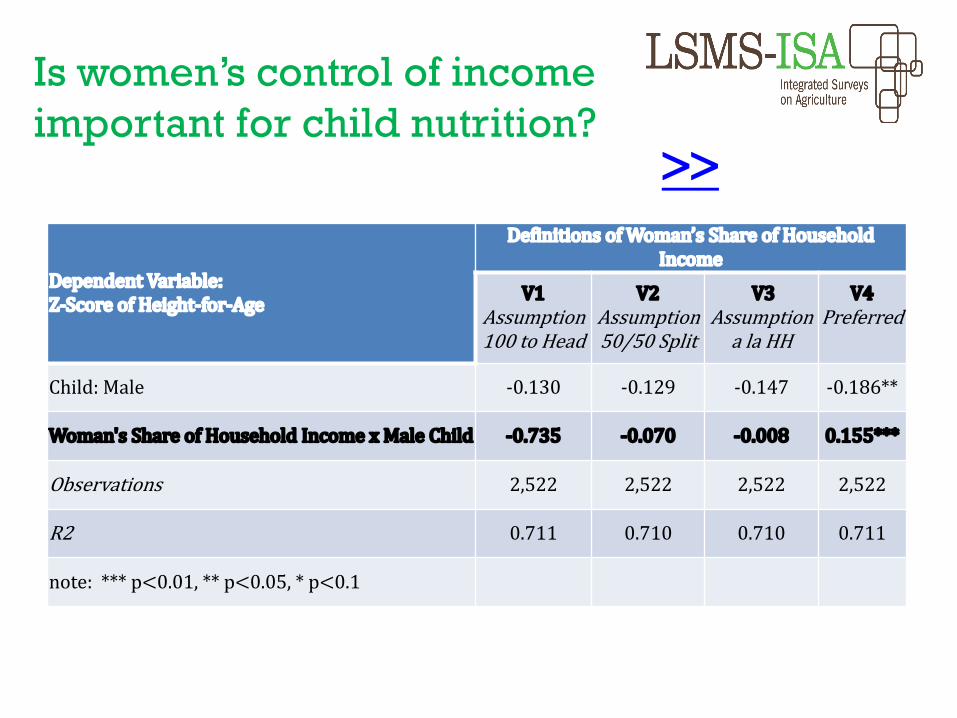
Is women’s control of income important for child nutrition?
DependentVariable:Z-ScoreofHeight-for-Age
DefinitionsofWoman’sShareof HouseholdIncome
V1Assumption100toHead
V2Assumption50/50Split
V3Assumptionala HH
V4Preferred
Child:Male -0.130 -0.129 -0.147 -0.186**
Woman'sShareofHouseholdIncomexMaleChild -0.735 -0.070 -0.008 0.155***
Observations 2,522 2,522 2,522 2,522
R2 0.711 0.710 0.710 0.711
note:***p<0.01,**p<0.05,*p<0.1
>>
Missing Plot Measurements
0.0%
2.0%
4.0%
6.0%
8.0%
10.0%
1 2 3 4 5 6 7 8 9 10 11 12
Month
Perc
ent o
f Plo
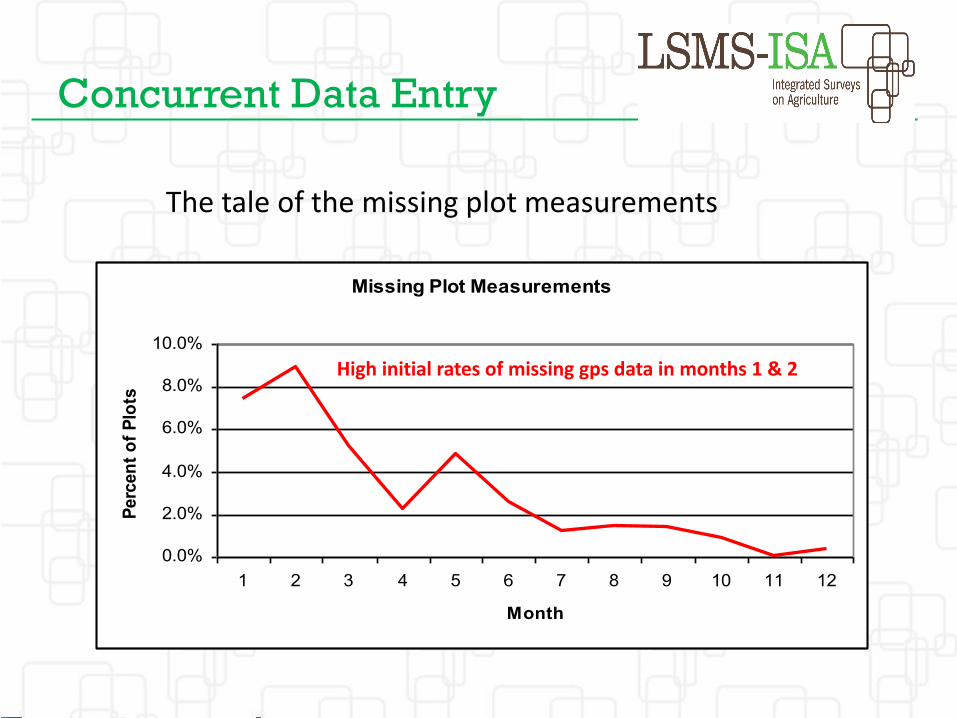
tsConcurrent Data Entry
The tale of the missing plot measurements
High initial rates of missing gps data in months 1 & 2
Missing Plot Measurements
0.0%
2.0%
4.0%
6.0%
8.0%
10.0%
1 2 3 4 5 6 7 8 9 10 11 12
Month
Perc
ent o
f Plo
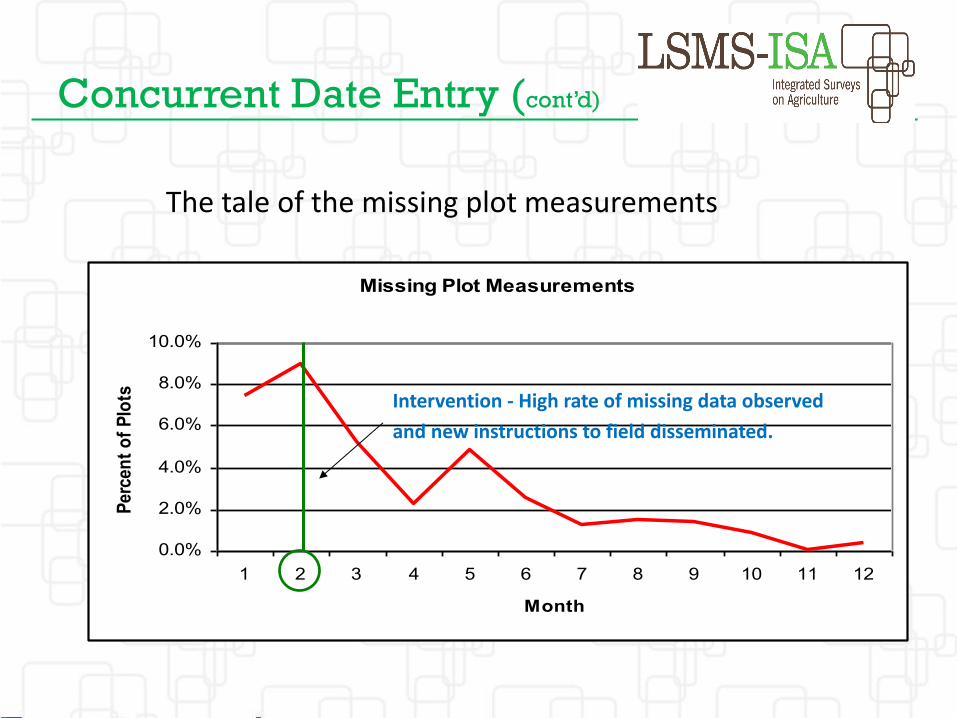
tsConcurrent Date Entry (cont’d)
The tale of the missing plot measurements
Intervention - High rate of missing data observed and new instructions to field disseminated.
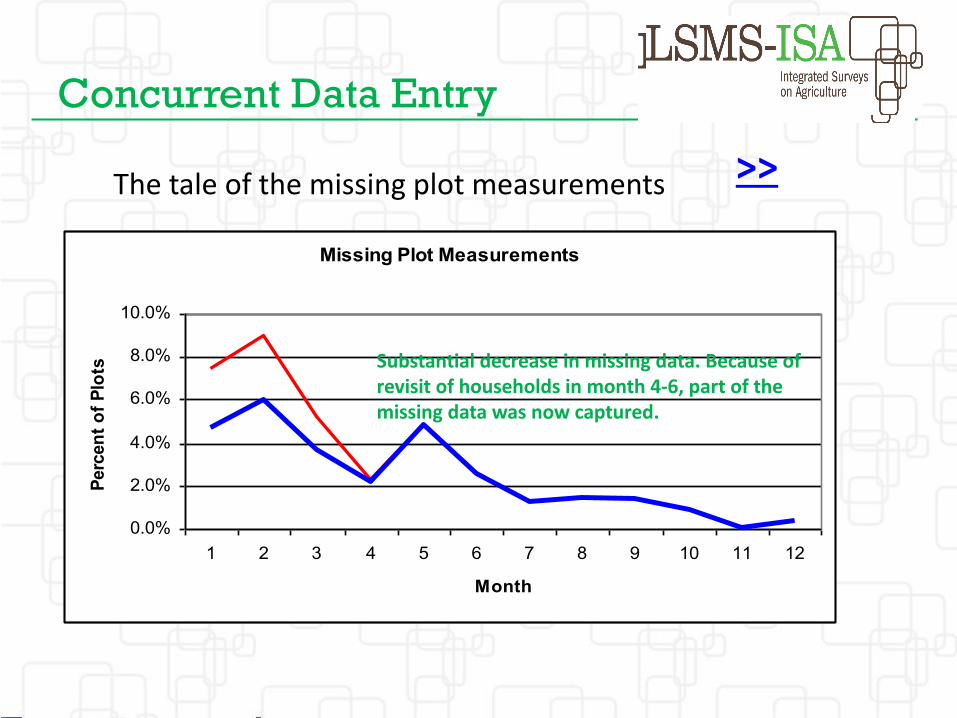
Concurrent Data Entry
Missing Plot Measurements
0.0%
2.0%
4.0%
6.0%
8.0%
10.0%
1 2 3 4 5 6 7 8 9 10 11 12
Month
Perc
ent o
f Plo
ts
The tale of the missing plot measurements
Substantial decrease in missing data. Because of revisit of households in month 4-6, part of the missing data was now captured.
>>
CAPI• “Comparative Assessment of Software
Programs for the Development of Computer-Assisted Personal Interview (CAPI) Applications”, with the University of Maryland IRIS Center
• Implementation in LSMS-ISA partner countries relying on readily available commercial software products
• Plans to create a public, freely available CAPI software package
>>
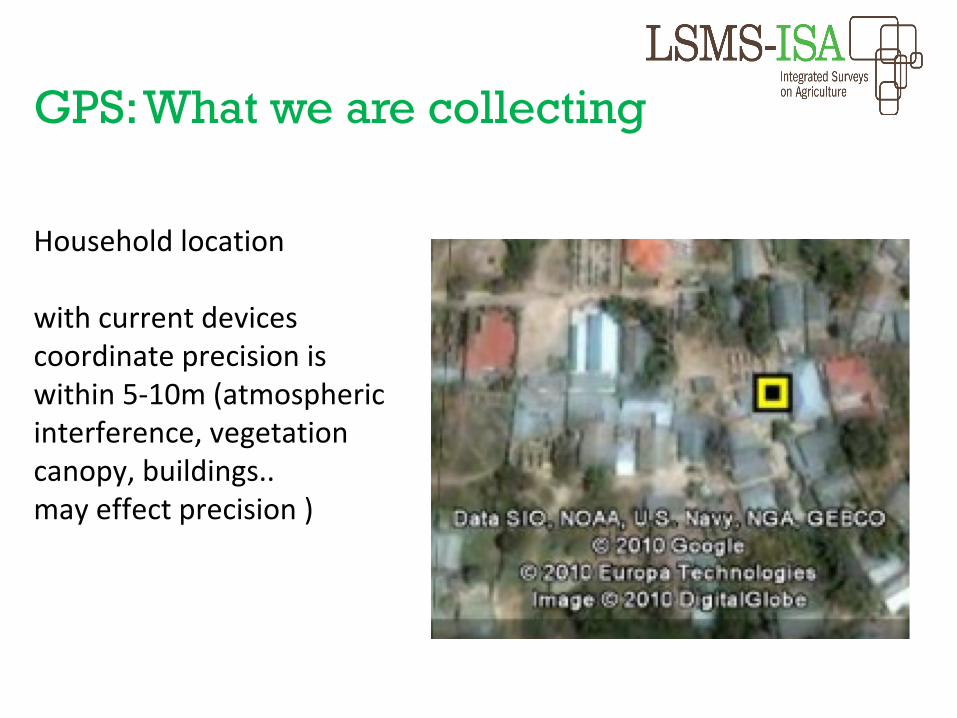
GPS: What we are collecting
Household location
with current devices coordinate precision iswithin 5-10m (atmosphericinterference, vegetation canopy, buildings..may effect precision )
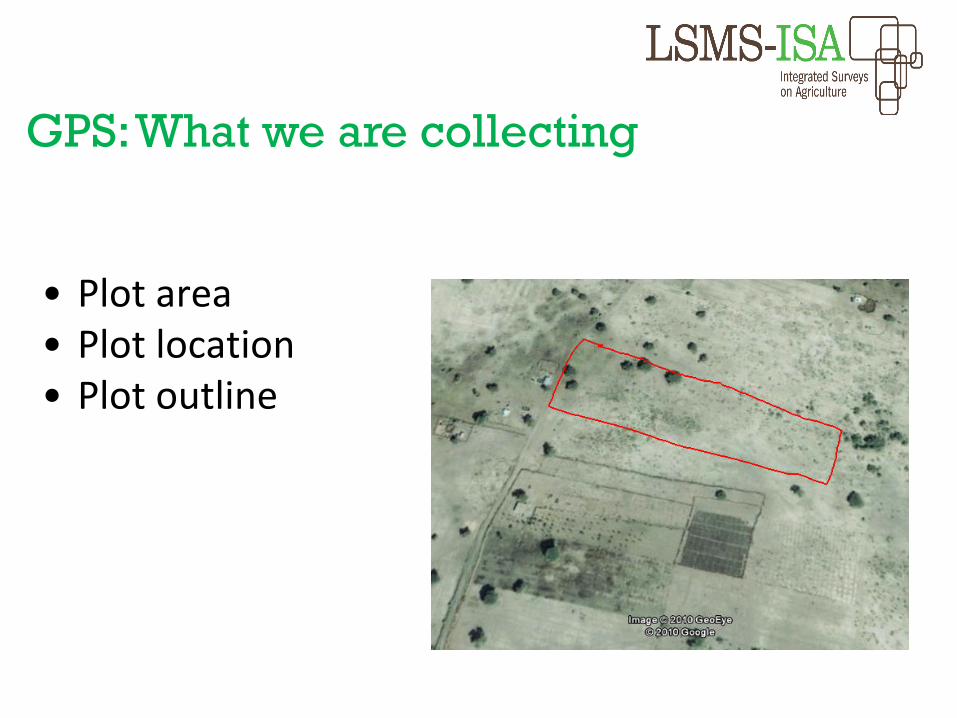
GPS: What we are collecting
• Plot area• Plot location• Plot outline
• NOT proposing to disseminate actual household GPS coordinates
• ARE proposing to disseminate modified EA center-points, offset to prevent identification of communities AND a set of geovariables generated using the true locations
• true household GPS locations maintained in the Statistics Office, to be used for continuation of the panel or at the discretion of the NSO
Dissemination Strategy
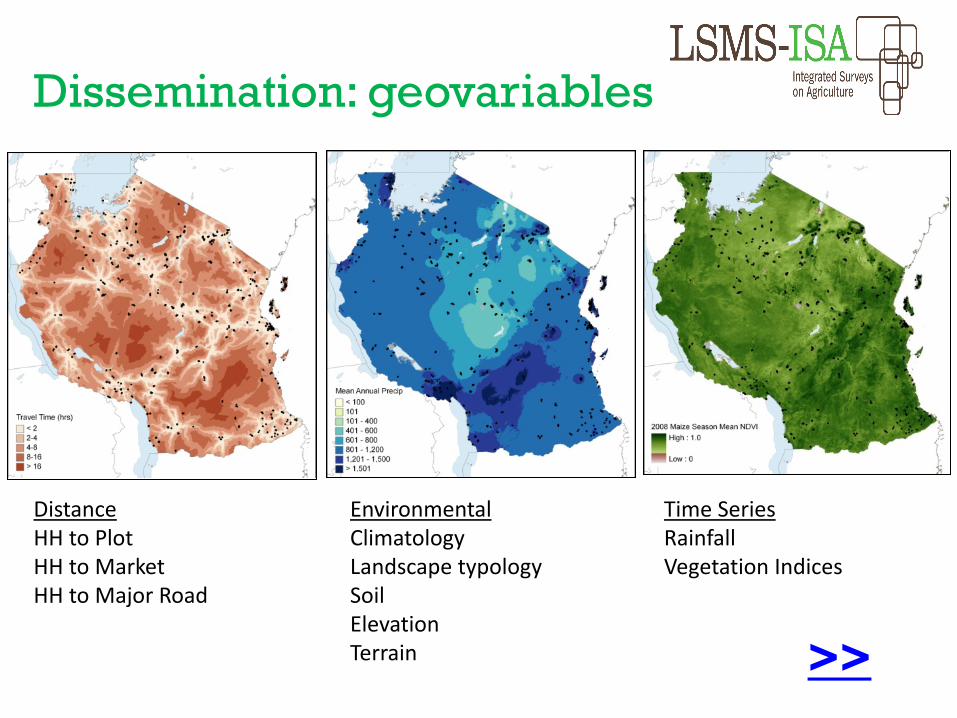
DistanceHH to PlotHH to MarketHH to Major Road
Dissemination: geovariables
EnvironmentalClimatologyLandscape typologySoilElevationTerrain
Time SeriesRainfallVegetation Indices
>>
![Oracle® Communications LSMS · [8] Query Server Installation and Upgrade Instructions, 909-1968-001, Current Version, Oracle. [9] LSMS 13.0 Cable diagram, Current Version, Tekelec](https://img.pdfslide.us/doc/110x75/603b685e20c97e7bb6250995/oracle-communications-lsms-8-query-server-installation-and-upgrade-instructions.jpg)