Embed Size (px)
Citation preview
Living in a Carbon-based World: CO2 and its impact on the EU
PowerSectorGavin Bell
March 2010
First, a little about me...
18.04.23ecovest limited2
Ph.D. from Canterbury EMRG
One of the many from Canty that ended up in Europe...
Worked since 1999 in energy sector as consultant and in industry UK, Germany, Austria, Netherlands, Spain, Albania,
Montinegro, Macedonia, Norway, Denmark, Czech Republic, Cuba
Headed up the continental power market analysis team and the cross commodity analysis team at Statkraft Europe’s largest renewable generator Around 55 TWh annual production
Currently CEO of Ably (plant data and analysis firm) and independent consultant Based in Norway since 2003
Key EU ETS Takeaways
18.04.23ecovest limited3
EU ETS market is part of an ”energy complex” involving power, fuels, CO2, and other commodity markets Each drives the other Increasingly, money cannot be made in one
market only – you need to look at them all simultaneously
CO2 will drive increasing internationalisation of energy markets, as CO2 markets interlink EU ETS in the forefront
Any CO2 market is a political beast – politics drives the price and direction
Outline
4
EU ETS Overview A multi-commodity energy complex Short term interactions Long term interations and drivers Summary
ecovest limited 18.04.23
EU ETS Overview
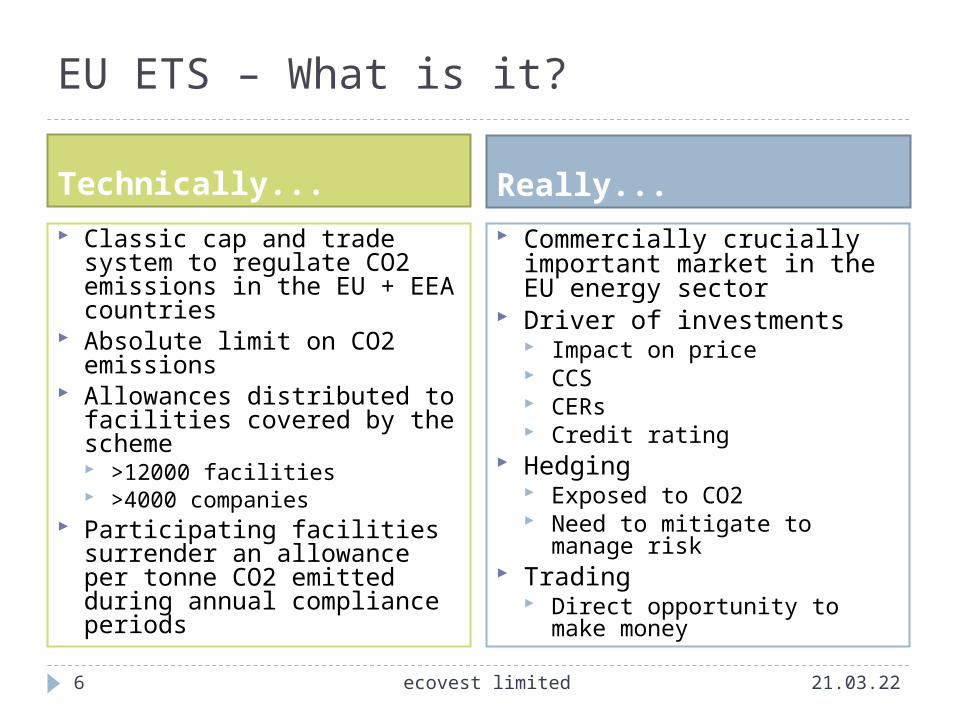
EU ETS – What is it?
Technically... Really...
6
Classic cap and trade system to regulate CO2 emissions in the EU + EEA countries
Absolute limit on CO2 emissions
Allowances distributed to facilities covered by the scheme >12000 facilities >4000 companies
Participating facilities surrender an allowance per tonne CO2 emitted during annual compliance periods
Commercially crucially important market in the EU energy sector
Driver of investments Impact on price CCS CERs Credit rating
Hedging Exposed to CO2 Need to mitigate to manage
risk Trading
Direct opportunity to make money
ecovest limited 18.04.23
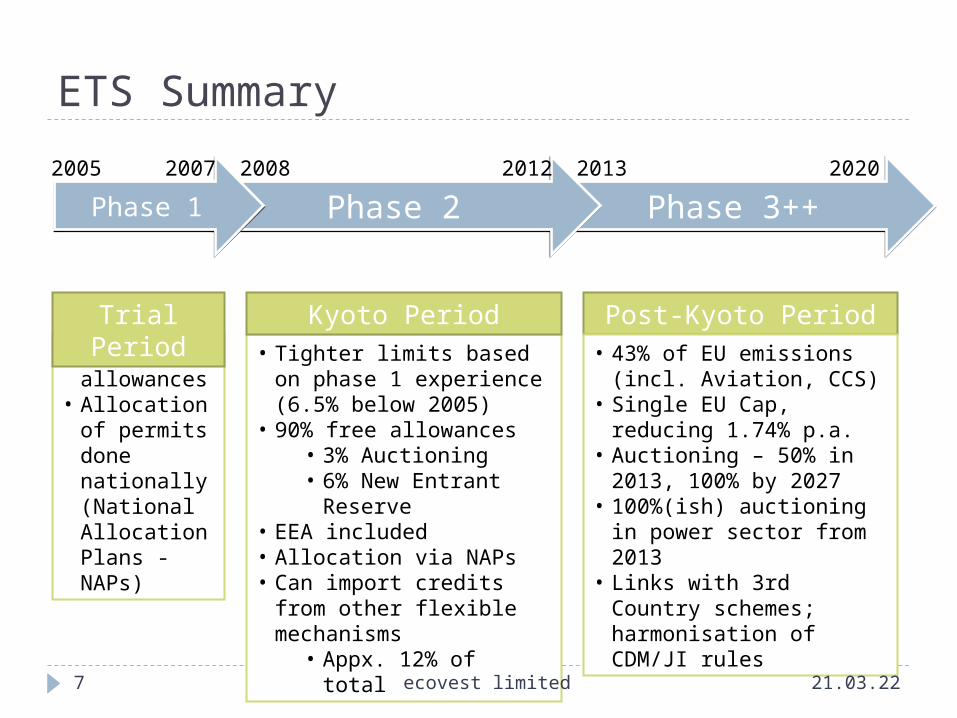
ETS Summary
Phase 3++Phase 3++Phase 2Phase 2Phase 1Phase 1
2005 2007 2008 2012 2013
Post-Kyoto Period
2020
• 43% of EU emissions (incl. Aviation, CCS)
• Single EU Cap, reducing 1.74% p.a.
• Auctioning – 50% in 2013, 100% by 2027
• 100%(ish) auctioning in power sector from 2013
• Links with 3rd Country schemes; harmonisation of CDM/JI rules
• 95% free allowances
• Allocation of permits done nationally (National Allocation Plans - NAPs)
• Tighter limits based on phase 1 experience (6.5% below 2005)
• 90% free allowances• 3% Auctioning• 6% New Entrant
Reserve• EEA included• Allocation via NAPs• Can import credits from
other flexible mechanisms
• Appx. 12% of total
Kyoto PeriodTrial Period
ecovest limited7 18.04.23
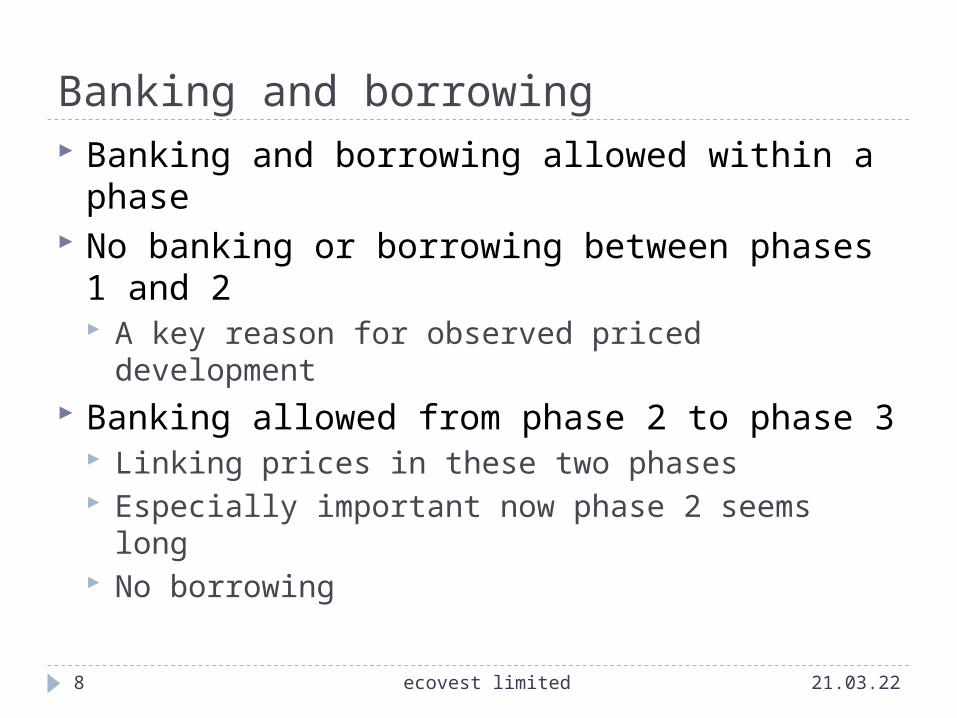
Banking and borrowing Banking and borrowing allowed within a phase No banking or borrowing between phases 1
and 2 A key reason for observed priced development
Banking allowed from phase 2 to phase 3 Linking prices in these two phases Especially important now phase 2 seems long No borrowing
ecovest limited8 18.04.23
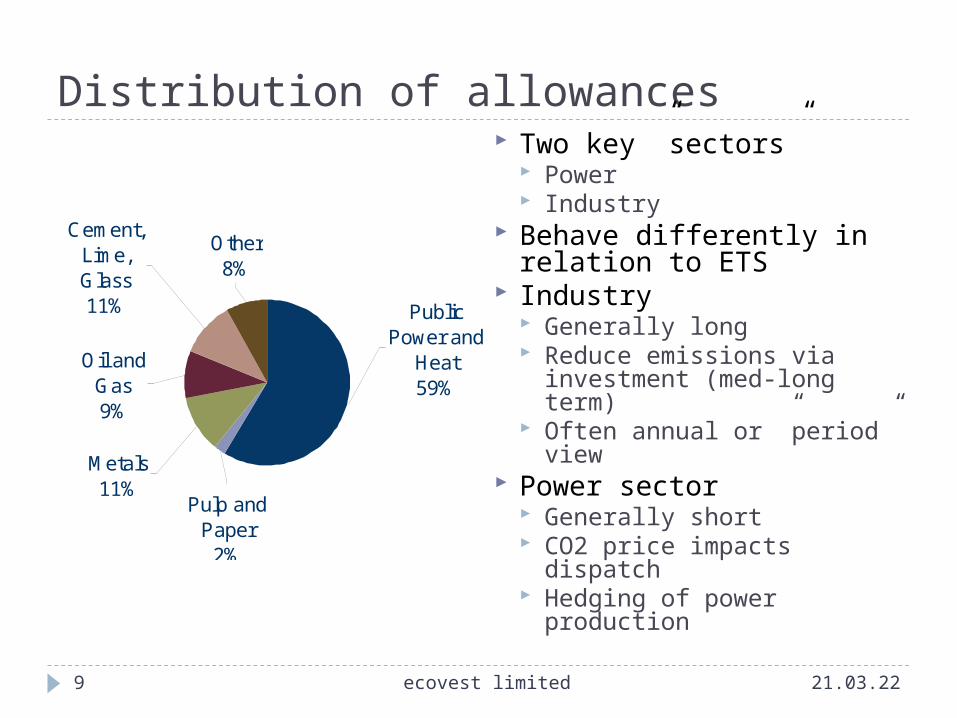
Distribution of allowances
Metals11%
Pulp and Paper
2%
Oil and Gas9%
Cement, Lime, Glass11%
Other8%
Public Power and
Heat59%
Two key ”sectors” Power Industry
Behave differently in relation to ETS
Industry Generally long Reduce emissions via
investment (med-long term)
Often annual or ”period” view
Power sector Generally short CO2 price impacts dispatch Hedging of power
production
ecovest limited9 18.04.23
0
5
10
15
20
25
30
35
EUA
Pri
ce (€
/t)
2005 2006 2007 2008 2009 2010
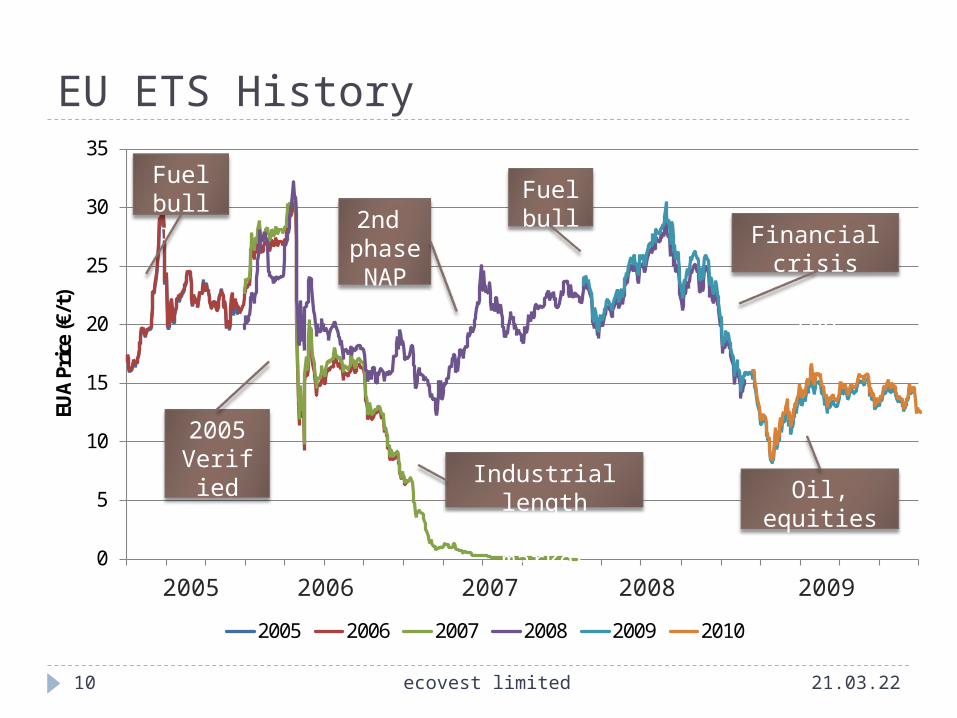
EU ETS History
10
2005 2006 2007 2008 2009
Fuel bull run
2005 Verifie
d emissi
ons
2nd phase NAP cut
Fuel bull run Financial
crisisFuel bear
run
Industrial length
gradually in market
Oil, equities bull run
ecovest limited 18.04.23
A multi-commodity energy complex
CO2 and Power (and fuels, currencies, interest rates etc etc)
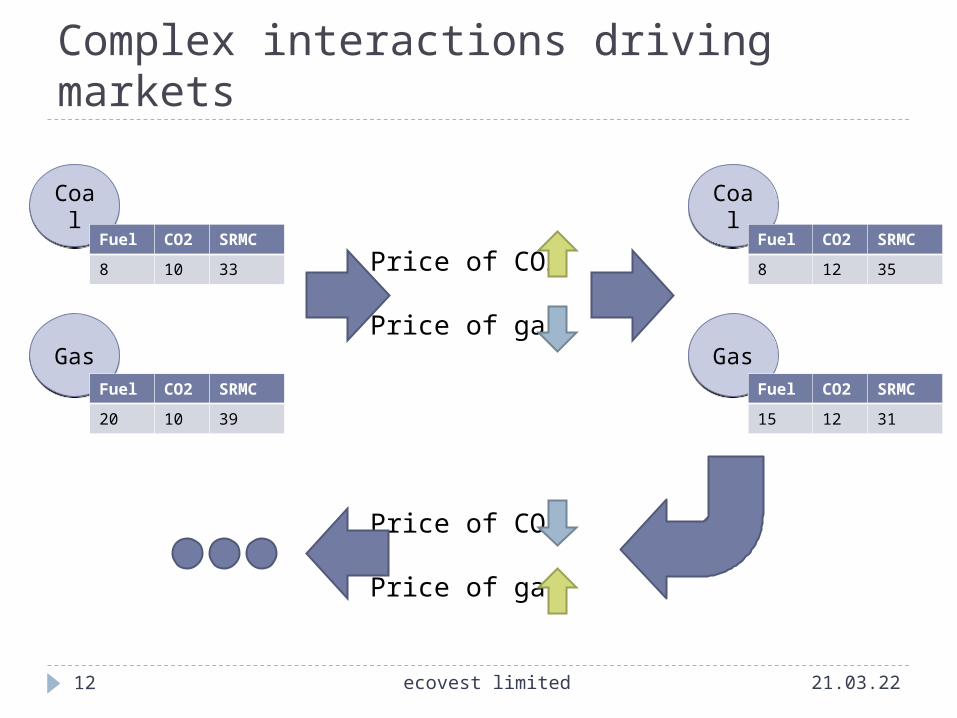
Coal
Coal
GasGas
Complex interactions driving markets
Fuel CO2
SRMC
8 10 33
Fuel CO2
SRMC
20 10 39
Price of CO2
Price of gas
Coal
Coal
GasGas
Fuel CO2
SRMC
8 12 35
Fuel CO2
SRMC
15 12 31
Price of CO2
Price of gas
ecovest limited12 18.04.23
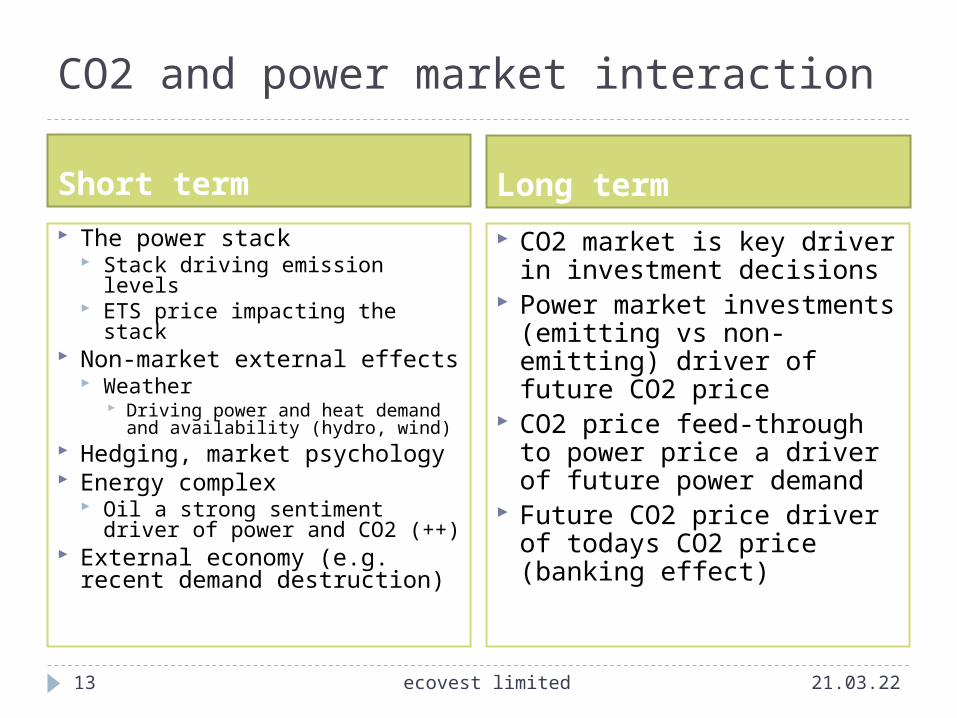
CO2 and power market interaction
Short term Long term The power stack
Stack driving emission levels ETS price impacting the stack
Non-market external effects Weather
Driving power and heat demand and availability (hydro, wind)
Hedging, market psychology Energy complex
Oil a strong sentiment driver of power and CO2 (++)
External economy (e.g. recent demand destruction)
CO2 market is key driver in investment decisions
Power market investments (emitting vs non-emitting) driver of future CO2 price
CO2 price feed-through to power price a driver of future power demand
Future CO2 price driver of todays CO2 price (banking effect)
ecovest limited13 18.04.23
Question...
14
?What is correlation and what is causality?
ecovest limited 18.04.23
Short term interaction
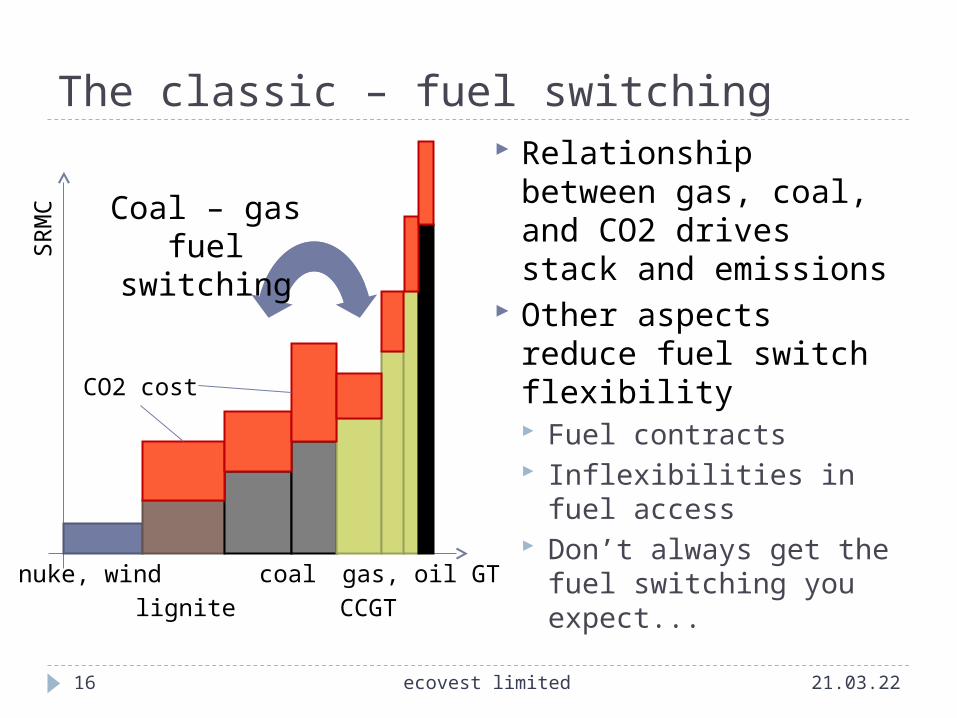
The classic – fuel switching
16
Relationship between gas, coal, and CO2 drives stack and emissions
Other aspects reduce fuel switch flexibility Fuel contracts Inflexibilities in fuel
access Don’t always get the
fuel switching you expect...
coalCCGT
gas, oil GTlignite
nuke, wind
Coal – gas fuel
switching
CO2 cost
SR
MC
ecovest limited 18.04.23
-260-240-220-200-180-160-140-120-100
-80-60-40-20
020406080
100
Mill
tonnes
8
10
12
14
16
18
20
22
24
26
28
30
€/t
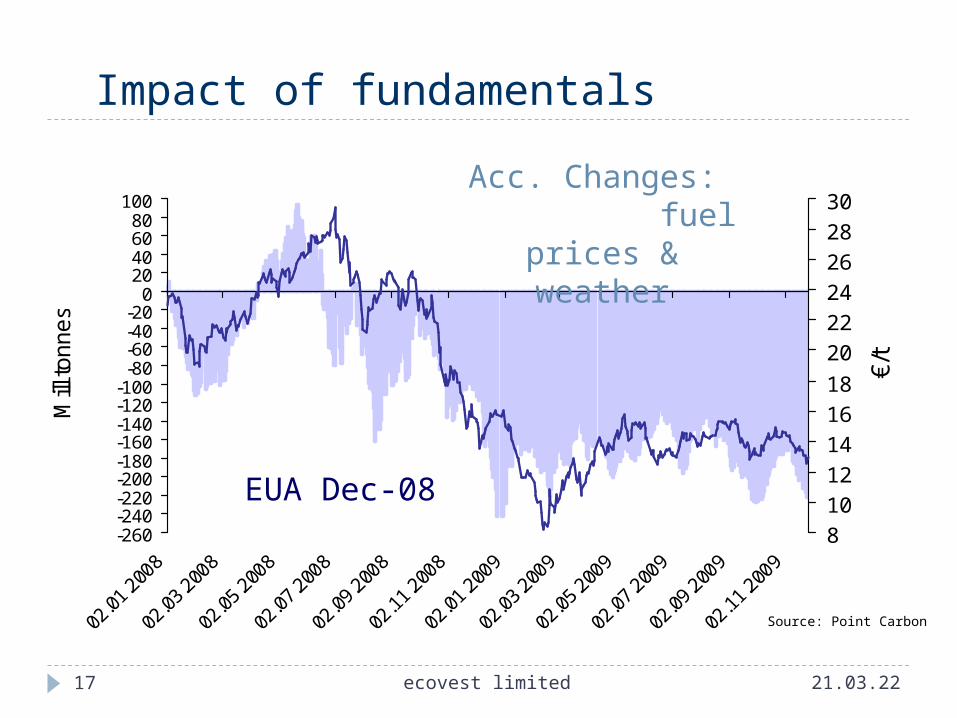
Impact of fundamentals
EUA Dec-08
Acc. Changes: fuel prices &
weather
ecovest limited17 18.04.23
Source: Point Carbon
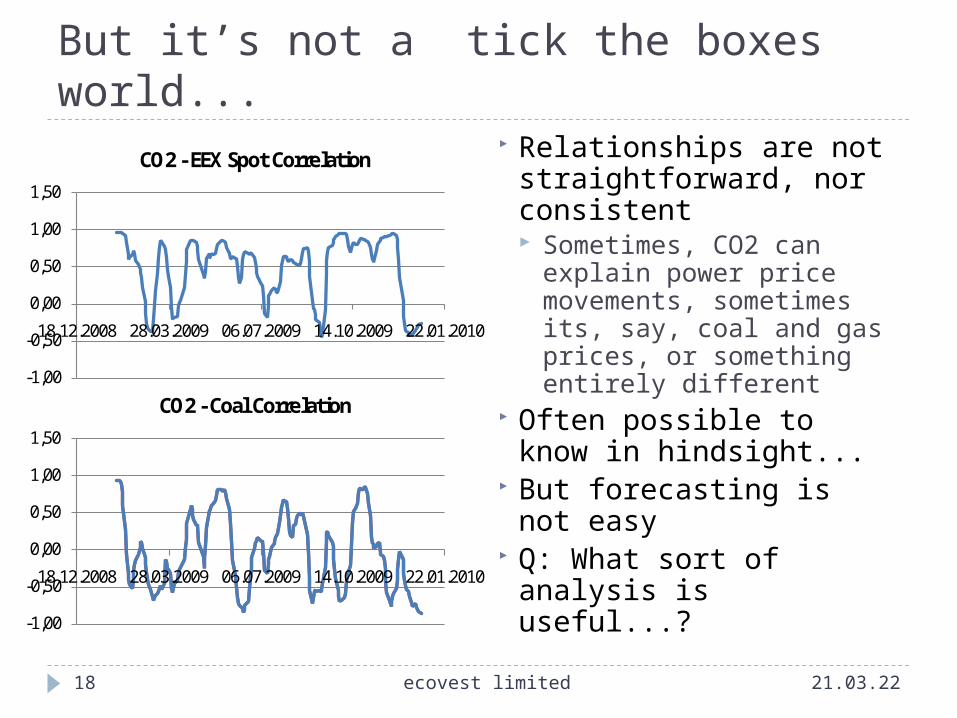
But it’s not a ”tick the boxes” world... Relationships are not
straightforward, nor consistent Sometimes, CO2 can
explain power price movements, sometimes its, say, coal and gas prices, or something entirely different
Often possible to know in hindsight...
But forecasting is not easy
Q: What sort of analysis is useful...?-1,00
-0,50
0,00
0,50
1,00
1,50
18.12.2008 28.03.2009 06.07.2009 14.10.2009 22.01.2010
CO2 - Coal Correlation-1,00
-0,50
0,00
0,50
1,00
1,50
18.12.2008 28.03.2009 06.07.2009 14.10.2009 22.01.2010
CO2 - EEX Spot Correlation
ecovest limited18 18.04.23
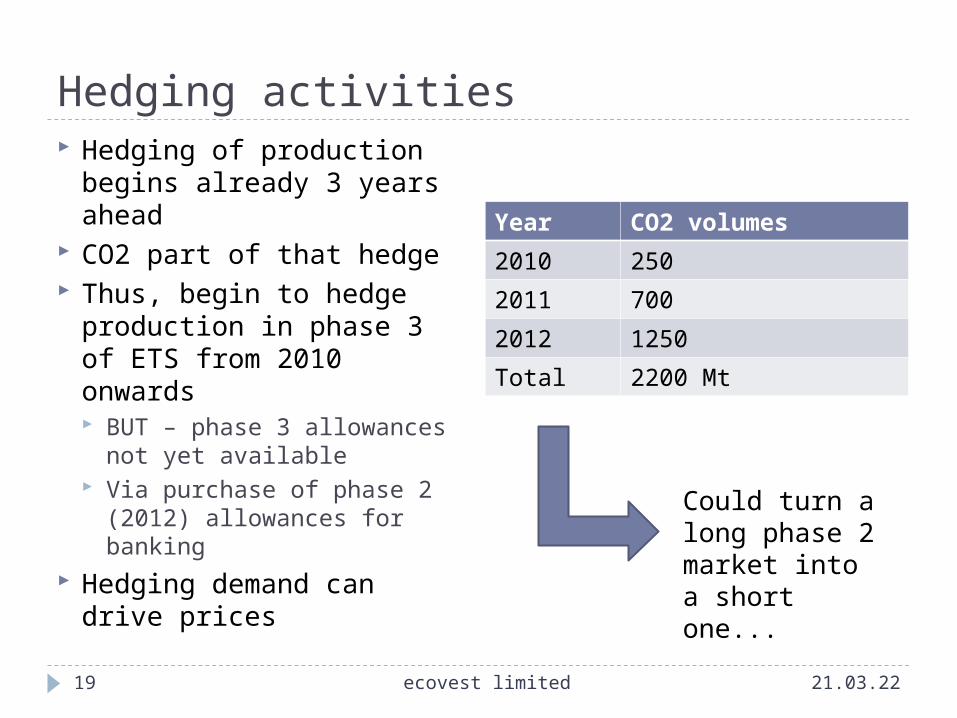
Hedging activities
19
Hedging of production begins already 3 years ahead
CO2 part of that hedge Thus, begin to hedge
production in phase 3 of ETS from 2010 onwards BUT – phase 3 allowances
not yet available Via purchase of phase 2
(2012) allowances for banking
Hedging demand can drive prices
Year CO2 volumes
2010 250
2011 700
2012 1250
Total 2200 Mt
Could turn a long phase 2 market into a short one...
ecovest limited 18.04.23
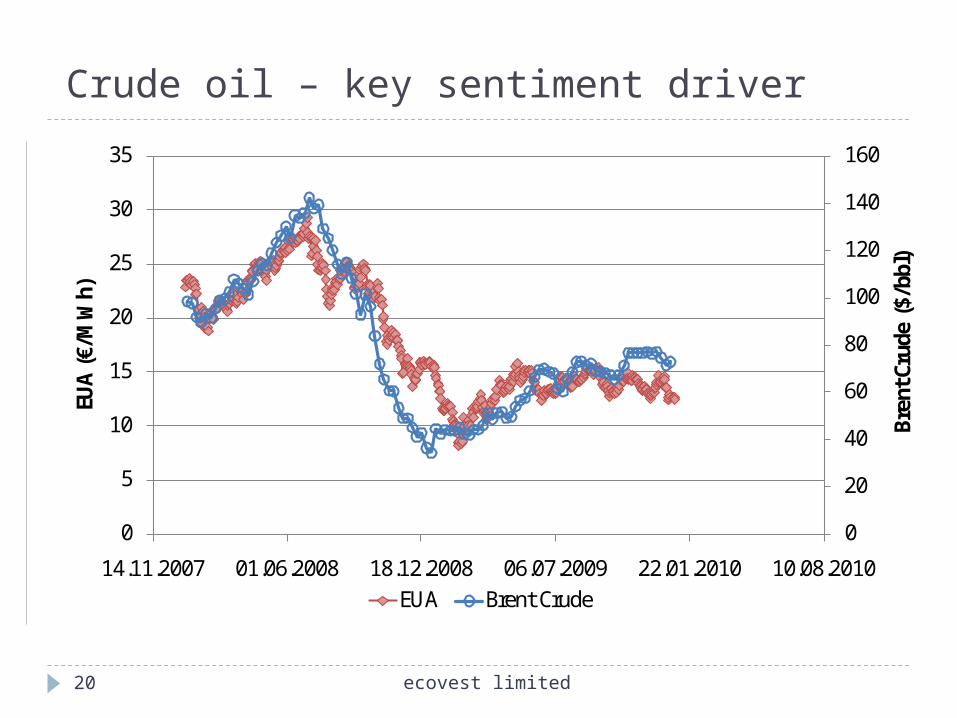
Crude oil – key sentiment driver
0
20
40
60
80
100
120
140
160
0
5
10
15
20
25
30
35
14.11.2007 01.06.2008 18.12.2008 06.07.2009 22.01.2010 10.08.2010
Bren
t Cru
de (
$/bb
l)
EUA
(€/M
Wh)
EUA Brent Crude
ecovest limited20
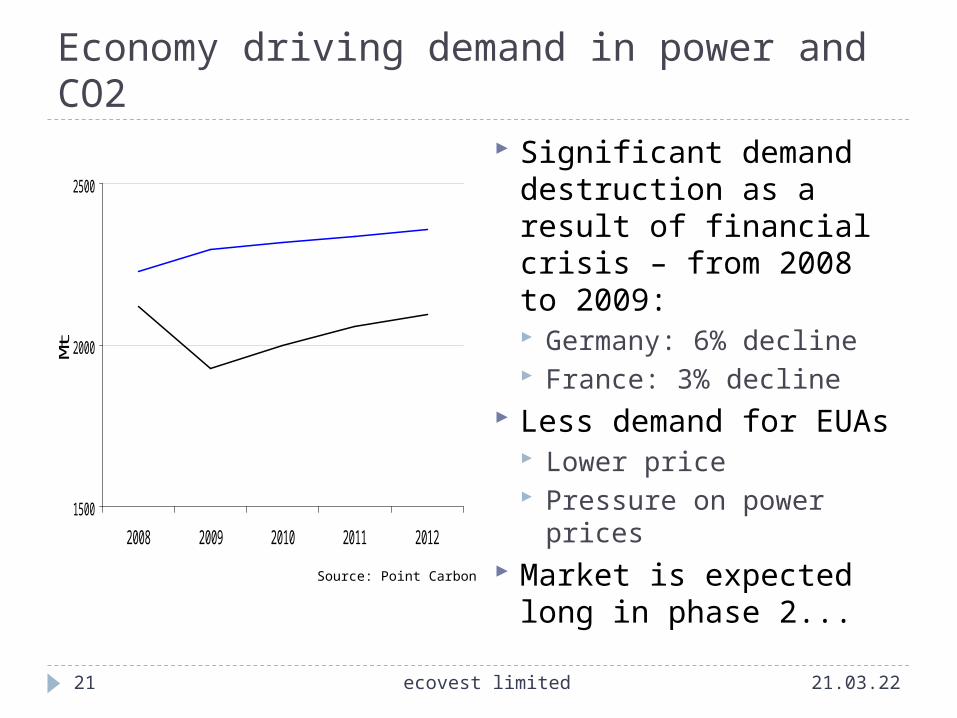
Economy driving demand in power and CO2
21
Significant demand destruction as a result of financial crisis – from 2008 to 2009: Germany: 6% decline France: 3% decline
Less demand for EUAs Lower price Pressure on power
prices Market is expected
long in phase 2...
1500
2000
2500
2008 2009 2010 2011 2012
Mt
ecovest limited 18.04.23
Source: Point Carbon
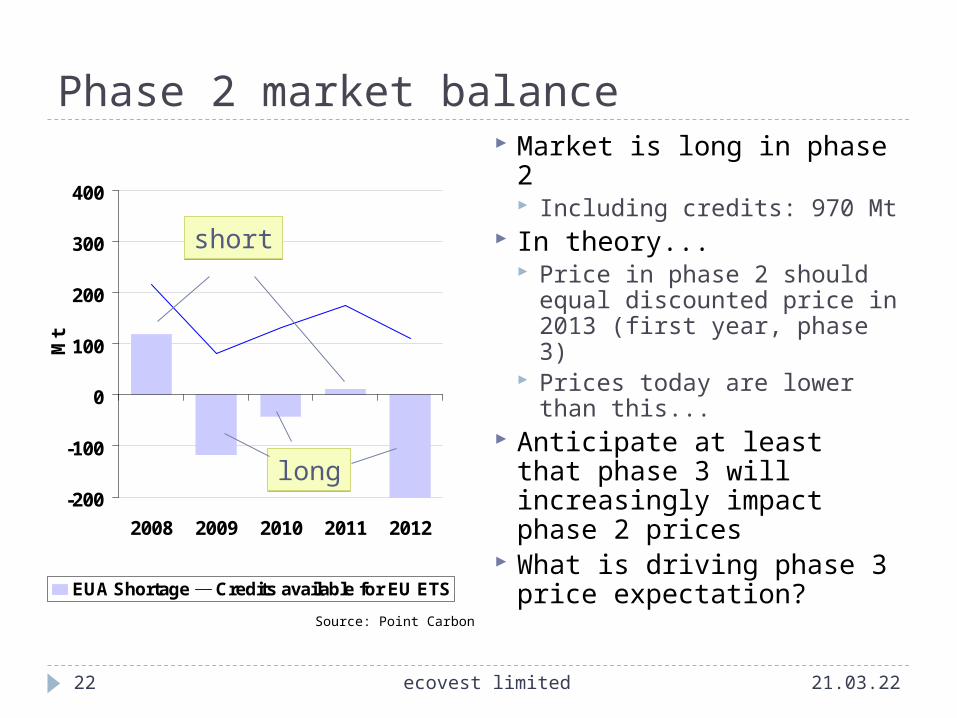
Phase 2 market balance
22
Market is long in phase 2 Including credits: 970 Mt
In theory... Price in phase 2 should
equal discounted price in 2013 (first year, phase 3)
Prices today are lower than this...
Anticipate at least that phase 3 will increasingly impact phase 2 prices
What is driving phase 3 price expectation?
-200
-100
0
100
200
300
400
2008 2009 2010 2011 2012
Mt
EUA Shortage Credits available for EU ETS
shortshort
longlong
ecovest limited 18.04.23
Source: Point Carbon
Long term interaction
CO2 price in 2020 and beyond
24
How can we assess the long term price? And thus today’s ”equilibrium” price level?
Equilibrium model What price balances supply and demand That is, long term relationships between
Power and CO2 Industry and CO2 CERs, other ETS schemes and the EU ETS
Or... an educated guess – it is a political process after all What price needed to drive CCS? EU effectively target long term caps to achieve this
price level...
ecovest limited 18.04.23
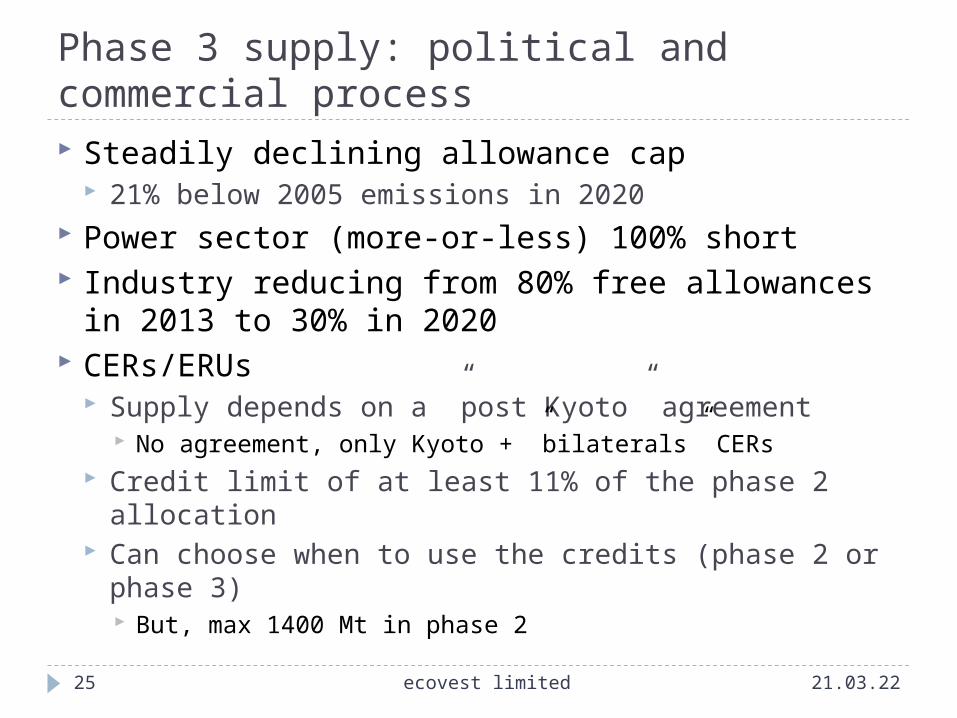
Phase 3 supply: political and commercial process
25
Steadily declining allowance cap 21% below 2005 emissions in 2020
Power sector (more-or-less) 100% short Industry reducing from 80% free allowances in
2013 to 30% in 2020 CERs/ERUs
Supply depends on a ”post Kyoto” agreement No agreement, only Kyoto + ”bilaterals” CERs
Credit limit of at least 11% of the phase 2 allocation Can choose when to use the credits (phase 2 or
phase 3) But, max 1400 Mt in phase 2
ecovest limited 18.04.23
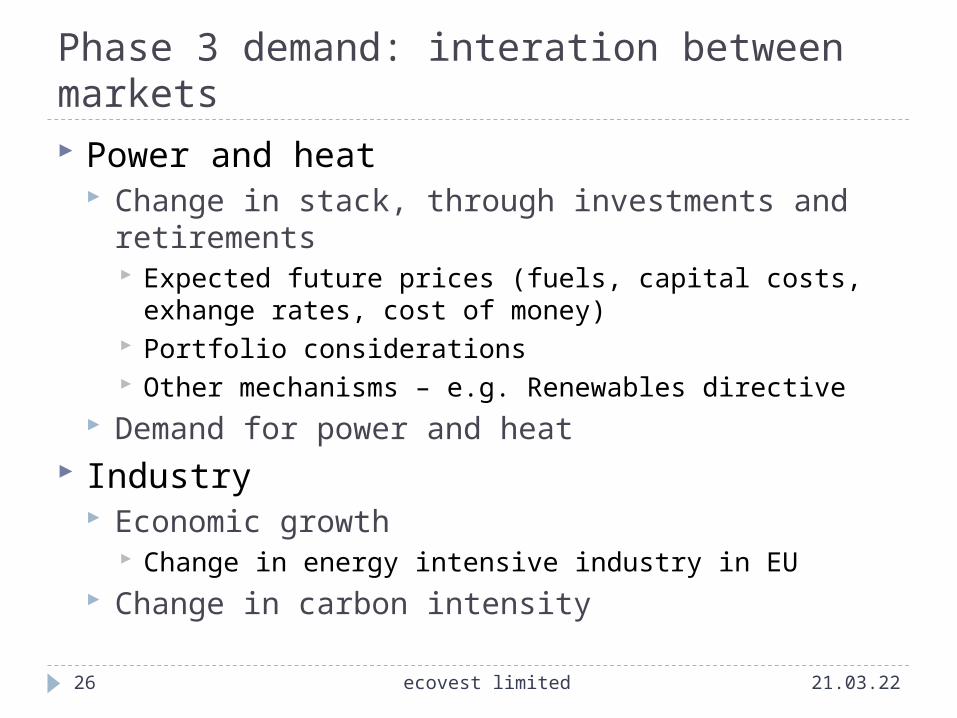
Phase 3 demand: interation between markets
26
Power and heat Change in stack, through investments and
retirements Expected future prices (fuels, capital costs, exhange
rates, cost of money) Portfolio considerations Other mechanisms – e.g. Renewables directive
Demand for power and heat Industry
Economic growth Change in energy intensive industry in EU
Change in carbon intensity
ecovest limited 18.04.23
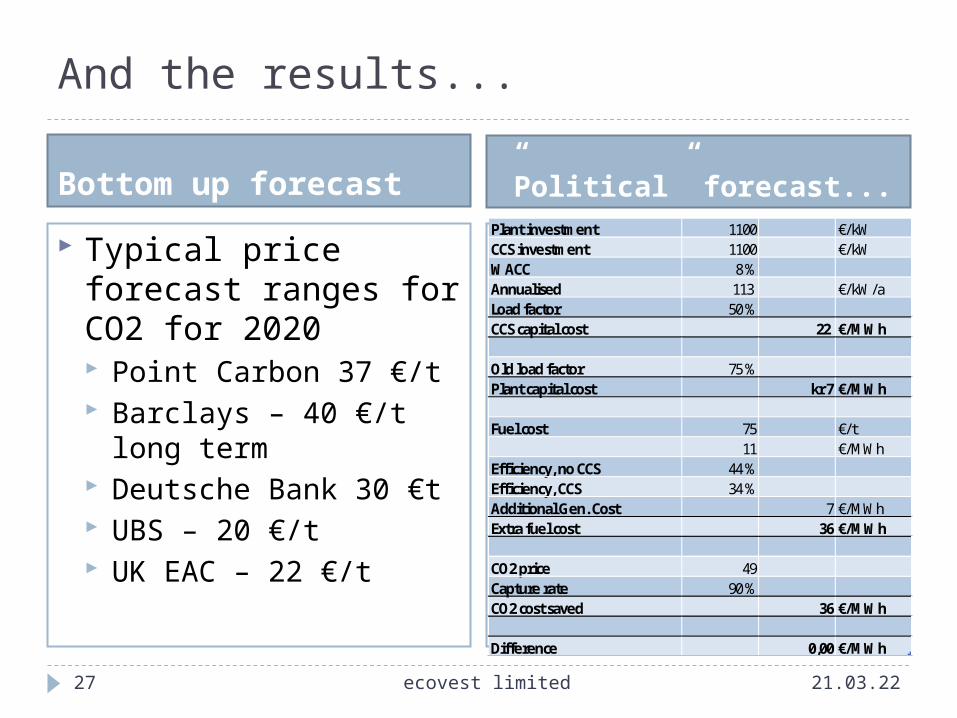
And the results...
Bottom up forecast ”Political” forecast...
27
Typical price forecast ranges for CO2 for 2020 Point Carbon 37 €/t Barclays – 40 €/t long
term Deutsche Bank 30 €t UBS – 20 €/t UK EAC – 22 €/t
The CCS approach (or renewables or whatever...) for, say, 2025 Additional capital cost Reduction in efficiency CO2 emissions saved + fuel cost assumptions
etc... Around 50 €/t (2025) Discounts to 35 €/t
(2020)
Plant investment 1100 €/kWCCS investment 1100 €/kWWACC 8 %Annualised 113 €/kW/aLoad factor 50 %CCS capital cost 22 €/MWh
Old load factor 75 %Plant capital cost kr 7 €/MWh
Fuel cost 75 €/t11 €/MWh
Efficiency, no CCS 44 %Efficiency, CCS 34 %Additional Gen. Cost 7 €/MWhExtra fuel cost 36 €/MWh
CO2 price 49Capture rate 90 %CO2 cost saved 36 €/MWh
Difference 0,00 €/MWh
ecovest limited 18.04.23

Summary
Summary
29
CO2 (via ETS) integral part of EU energy markets Investment Hedging Trading
Complex interactions between these markets Drive prices Significant and dynamic relationship between long
and short term dynamics And don’t forget it is a political process
Once there is an ETS, there’s a strong pressure for consistency and predictability
ecovest limited 18.04.23