Embed Size (px)
Citation preview
The European Foundation for the Improvement of Living and Working Conditions is a tripartite EU body, whose role is to provide key actors in social policymaking with findings, knowledge and advice drawn from comparative research. The Foundation was established in 1975 by Council Regulation EEC No 1365/75 of 26 May 1975.
4 5 TJ-30-09-207-EN-C
Second European Quality of Life Survey: Living conditions, social exclusion and m
ental well-being
Second European Quality of Life Survey
Living conditions, social exclusion and mental well-being
Over the past two decades, the concept of social exclusion has increasingly
replaced the concept of poverty within the EU policy discussion on social
vulnerability and disadvantage. It has been shown that unequal access to the
labour market and poor living conditions negatively affect social participation
and social contact, which in turn impact on the quality of life of Europe’s citizens
and lead to a sense of social exclusion. The second European Quality of Life
Survey (EQLS), conducted by Eurofound in 2007, offers a wide-ranging view of
the diverse social realities in Europe today. This report looks at the relationships
between living conditions, social exclusion and mental well-being. It draws on
the results of the EQLS to examine the factors that influence perceived social
exclusion and the impact that this has on mental well-being. The scope of the
findings – spanning 31 countries – offers an important insight into how social
exclusion and integration vary across Europe, given the different cultural and
historical contexts as well as recent social and economic experiences.
Second European Quality of Life Survey
Living conditions, social exclusion and mental well-being
Authors: Richard Layte and Bertrand Maître, Economic and Social Research Institute (ESRI), Dublin; Christopher T. Whelan, Department of Sociology, University College Dublin (UCD)
Research managers: Klára Foti and Branislav Mikulić
Research project: Monitoring quality of life in Europe
Second European Quality of Life Survey
Living conditions, social exclusion and mental well-being
Wyattville Road, Loughlinstown, Dublin 18, Ireland - Tel: (+353 1) 204 31 00 - Fax: (+353 1) 282 42 09 / 282 64 56
email: [email protected] - website: www.eurofound.europa.eu
Cataloguing data can be found at the end of this publication.
Luxembourg: Office for Official Publications of the European Communities, 2010
ISBN 978-92-897-0857-9
© European Foundation for the Improvement of Living and Working Conditions, 2010
For rights of translation or reproduction, applications should be made to the Director, European Foundation for the Improvement of Living and Working Conditions, Wyattville Road, Loughlinstown, Dublin 18, Ireland.
The European Foundation for the Improvement of Living and Working Conditions is an autonomous body of the European Union, created to assist in the formulation of future policy on social and work-related matters. Further information can be found on the Foundation website at www.eurofound.europa.eu.
European Foundation for the Improvement of Living and Working ConditionsWyattville RoadLoughlinstownDublin 18IrelandTelephone: (+353 1) 204 31 00Fax: (+353 1) 282 42 09 / 282 64 56Email: [email protected]
Printed in Denmark
The paper used in this book is chlorine-free and comes from managed forests in northern Europe. For every tree felled, at least one new tree is planted.
v
Foreword
The European Quality of Life Survey (EQLS) was conducted by the European Foundation for the Improvement of Living and Working Conditions (Eurofound) for the first time in 2003, covering 28 countries (the 15 EU Member States, 12 forthcoming Member States and Turkey). Eurofound’s second wave of the EQLS, which was carried out in 2007, offers a wide-ranging view of the diverse social realities in 31 countries – the current 27 EU Member States, along with Norway and the three candidate countries of Croatia, the Former Yugoslav Republic of Macedonia and Turkey.
Many of the questions posed in the first EQLS in 2003 were asked again, on issues such as employment, income, education, housing, family, health, work–life balance, life satisfaction and perceived quality of society. In 2008, Eurofound commissioned secondary analyses of the EQLS data around key policy themes. The selected themes for the first set of secondary analyses are the following: trends in quality of life in Europe 2003–2008; living conditions, social exclusion and mental well-being; family life and work; subjective well-being; and quality of society and public services.
This analytical report focuses on the theme of living conditions, social exclusion and mental well-being. It draws on the results of the EQLS to examine the factors that influence perceived social exclusion and the impact that this has on mental well-being. Such factors include labour market access, income and lifestyle standards, and access to social support. The scope of the findings – spanning 31 countries – offers an important insight into how social exclusion and integration vary across Europe, given the different cultural and historical contexts as well as recent social and economic experiences.
We hope that this report will inform policy debate on social exclusion across Europe, helping to identify ways in which to enhance the social integration of all citizens across the EU.
Jorma Karppinen Erika Mezger Director Deputy Director
vi
Country codes
EU15 15 EU Member States prior to enlargement in 2004 (Austria, Belgium, Denmark, Finland, France, Germany, Greece, Ireland, Italy, Luxembourg, the Netherlands, Portugal, Spain, Sweden and the United Kingdom)
NMS12 12 New Member States, 10 of which joined the EU in 2004 (Cyprus, the Czech Republic, Estonia, Hungary, Latvia, Lithuania, Malta, Poland, Slovakia and Slovenia) and the remaining two in 2007 (Bulgaria and Romania)
EU27 27 EU Member States
CC3 3 candidate countries – Croatia, the former Yugoslav Republic of Macedonia and Turkey
EU27
AT Austria LV Latvia
BE Belgium LT Lithuania
BG Bulgaria LU Luxembourg
CY Cyprus MT Malta
CZ Czech Republic NL Netherlands
DK Denmark PL Poland
EE Estonia PT Portugal
FI Finland RO Romania
FR France SK Slovakia
DE Germany SI Slovenia
EL Greece ES Spain
HU Hungary SE Sweden
IE Ireland UK United Kingdom
IT Italy
Candidate countries
HR Croatia
MK1 Former Yugoslav Republic of Macedonia
TR Turkey
Other
NO Norway
1 ISO code 3166: Provisional code which does not prejudge in any way the definitive nomenclature for this country, which will be agreed following the conclusion of negotiations currently taking place under the auspices of the United Nations (http://www.iso.org/iso/country_codes/iso_3166_code_lists.htm)
vii
Contents
Foreword v
Countrycodes vi
Executivesummary 1
Chapter1: Briefhistoryandconceptualoverview 5
Introduction 5
Key characteristics of social exclusion 5
Social exclusion, living conditions and quality of life 6
Perceived social exclusion and mental well-being 8
Data and analytical approach 8
Chapter2: Perceivedsocialexclusionandreportedsocialcontact 11
Measuring perceived social exclusion 11
Perceived social exclusion by household type 15
Perceived social exclusion and reported social contact 16
Conclusions 18
Chapter3: Impactofsocialconditionsonperceivedsocialexclusion 19
Macroeconomic environment and perceived social exclusion 19
Microeconomic predictors of perceived social exclusion 21
Conclusions 29
Chapter4: Socialsupport,livingconditionsandperceivedsocialexclusion 31
Introduction 31
Perceived availability of financial and moral support 31
Giving and receiving material support 34
Social contact and giving/receiving material support 38
Social support and social exclusion – the ‘buffer hypothesis’ 39
Conclusions 42
Chapter5: Impactoflivingconditionsandperceivedsocialexclusion
onmentalwell-being 43
Introduction 43
Measuring mental well-being 44
SecondEuropeanQualityofLifeSurvey–Livingconditions,socialexclusionandmentalwell-being
viii
Economic environment and mental well-being 45
Living conditions and mental well-being 46
Mental well-being, gender and marital status 48
Education, principal economic status and social class 50
Mental well-being and physical health 54
Pathways from living conditions to mental well-being 55
Conclusions 57
Chapter6: Conclusions 59
Bibliography 61
Annex1:Glossaryofterms 65
Annex2:Regressionanalysis:Coefficientsandsignificanceforsocialexclusion 67
Annex3:Regressioncoefficientsformodelsoflifestyledeprivation,perceivedsocial
exclusionandmentalwell-being 69
1
Executive summary
Introduction
Over the past two decades, there has been a major shift in the European debate regarding social progress and how it is measured. The concept of social exclusion has increasingly replaced the concept of poverty within the EU policy discussion on social vulnerability and disadvantage. Unfavourable labour market access and living conditions affect both social participation and social contact, which in turn impact on the quality of life of Europe’s citizens and influence their perception of social exclusion. The second European Quality of Life Survey (EQLS), conducted by the European Foundation for the Improvement of Living and Working Conditions (Eurofound) in 2007, offers a wide-ranging view of the diverse social realities in the 27 EU Member States, as well as covering Norway and the candidate countries of Croatia, the former Yugoslav Republic of Macedonia and Turkey.
This report looks at the relationships between living conditions, social exclusion and mental well-being. It draws on the results of the EQLS to examine the factors that influence perceived social exclusion and the impact that this has on mental well-being. Such factors include labour market access, income and lifestyle standards, and availability of social support.
Policycontext
A consequence of the EU’s enlargement to 27 Member States was the inclusion of a number of countries with considerably lower living standards than in the initial 15 Member States (EU15). Many of the 12 new Member States (NMS12) and the three candidate countries (CC3) have higher levels of unemployment, widespread poverty and a poor social welfare infrastructure. This situation has underlined the importance of EU policy development in the area of social exclusion and poverty.
Policymakers are responsible for promoting positive change to ease such stark differences in living standards, which could undermine cohesion in the EU – particularly if the reference groups for comparison are in other, wealthier Member States. Building a more inclusive Europe is therefore vital to achieving the EU’s goals of sustained economic growth, more and better jobs and greater social cohesion.
Keyfindings
Overallpatternsofsocialexclusion
A majority of European citizens feel socially integrated, with 86% of respondents scoring positively on the indicators for social integration. On the other hand, 14% of respondents report some level of social exclusion and 2% report strong exclusion. Levels of inclusion are higher in the EU15 Member States and lower in the CC3 and NMS12 countries. In particular, citizens from Bulgaria, Croatia, the former Yugoslav Republic of Macedonia and Romania report the highest levels of exclusion, while citizens of Denmark, Norway and Sweden show the lowest levels of social exclusion on average.
Impactofmacroenvironment
The average level of perceived social exclusion in a country is strongly related to its gross domestic product (GDP). However, this relationship is not fixed. Some countries, notably the Scandinavian countries, show lower than average levels of social exclusion than others, such as Austria, Belgium and France, while having the same level of GDP per capita. Similarly, some of the less affluent EU Member States, such as Malta, Portugal and Slovenia, record high levels of integration despite their lower GDP. A country’s unemployment rate and level of income poverty are also associated with social
SecondEuropeanQualityofLifeSurvey–Livingconditions,socialexclusionandmentalwell-being
2
exclusion, although some countries appear to be better at maintaining social integration in the face of higher unemployment.
Micro-levelindicatorsofexclusion
Higher levels of lifestyle deprivation and economic stress are indicative of an individual experiencing social exclusion. In the CC3 and NMS12 countries, higher levels of deprivation contribute significantly to a higher level of perceived social exclusion compared with the EU15. Nevertheless, citizens of the EU15 experience lower levels of perceived exclusion at the same level of deprivation.
Across countries, individuals who are unemployed are more likely to report higher levels of exclusion compared with all other employment status groups. Unemployment leads to similar levels of perceived exclusion across countries, although actual living conditions may vary significantly. Individuals in higher occupational and non-manual positions tend to report lower levels of exclusion.
Roleofsocialsupport
The perceived ability of European citizens to obtain financial support varies greatly between countries. Although almost 85% of respondents report that they could obtain financial support when needed in an emergency, this proportion tends to be lower in the CC3 and NMS12 countries than in the EU15. The perceived role of the family in providing financial support also varies between countries, with less than 60% citing the family as the main source of support in the CC3 and NMS12 countries compared with 70% in the EU15. Less divergence emerges between countries and country groups in relation to the perceived availability of moral support. The major source of this support is family, considered as the primary source by about two-thirds of European citizens in all country groups. Overall, at the same level of lifestyle deprivation, individuals who have access to financial or moral support tend to show lower levels of perceived social exclusion.
Mentalwell-being
Across countries, higher levels of wealth in the form of GDP are associated with higher levels of mental well-being. This may be one reason why citizens of the CC3 and NMS12 countries report significantly lower levels of mental well-being on average compared with those of the EU15. Nevertheless, respondents in the EU15 tended to indicate higher levels of mental well-being at any given level of deprivation when compared with the CC3 and NMS12.
Significant differences emerge between the country groups in the role of social exclusion regarding mental health. In the CC3, perceived social exclusion contributes only to a limited degree to poorer mental well-being, while the effect is five times as strong in the NMS12 and seven times as strong in the EU15. It appears that the direct effect of deprivation on mental health is far more significant than the indirect effect through social exclusion in all countries. The indirect effect is, however, relatively smaller in the poorer CC3 countries compared to the NMS12 or EU15.
3
Executivesummary
Policypointers
• Where possible, official indicators of social exclusion should be supplemented with subjective measures of perceived social exclusion, in order to determine which disadvantages have consequences for the quality of life of Europe’s citizens and the circumstances under which this varies.
• Increasing levels of education and skills, as well as the development of a dynamic and varied labour market in the CC3 and NMS12, would provide a basis on which inequalities in living conditions between current and future EU countries could be lessened.
• To ensure access to the labour market for those who can work, along with a guaranteed basic living standard for those who cannot, measures such as active labour market programmes and income transfer schemes need to be developed further in a coherent and mutually beneficial manner.
• Social support plays a crucial role in improving integration and mental well-being for all and in buffering mental well-being for those with poor living conditions. Looking at policy interventions to stimulate or sustain levels of social support should be a priority in EU and national policies.
• Mental health policy needs to recognise and target the broader sources of psychological stress associated with poorer living conditions, which can increase vulnerability to more serious mental health problems, with more costly consequences and treatments arising later on.
• Countries should seek to learn from good practice, given that some, notably the Scandinavian countries, are more successful in generating higher levels of inclusion at similar levels of aggregate wealth and the same nominal levels of individual deprivation and living standards.

5
1Brief history and conceptual overview
Introduction
In the past two decades, a transformation has occurred in the European debate concerning social progress and how to measure it. Until the early 1990s, European debate on welfare and well-being was carried out principally either within the Anglo-Saxon tradition of poverty research (Townsend, 1979) or the Swedish ‘level of living approach’ (Erikson and Aberg, 1987). The Maastricht Treaty of 1992 offered a definition of social exclusion and prioritised the fight against poverty and social exclusion for the coming decades. Today, policy debates routinely refer to social exclusion, although there is little agreement within the academic or policy community on how to define the concept or measure it. To many, social exclusion has become an indispensible concept, widening the measure of social progress beyond income and the labour market. Others deny its novelty and see it instead as a politically loaded term that pulls the focus away from the key issues. This chapter outlines the origins of the concept, along with its central characteristics, as well as its relationship to other concepts, such as quality of life, before setting out the aims of the report.
Keycharacteristicsofsocialexclusion
The notion of social exclusion has meaning only by implicit reference to normative ideas of what it means to be a member of and participate in society (Silver, 1994, 1996). The term arose from French political concerns of the 1960s relating to the emergence of groups who were excluded from the labour market and in danger of permanent detachment from the wider society. However, it came to prominence on the wider European stage in the 1980s, when high unemployment returned and threatened national modes of social integration (Kronauer, 1998). This context is reflected in the official justification set out by the European Commission for the increasing use of the term (European Commission, 1993). The term seeks to draw attention to the fact that, rather than one group living in permanent poverty as a consequence of changing employment and family structures, a variety of groups experience periods of sporadic or recurrent poverty.
Although there are many divergent views, some key characteristics of the concept of social exclusion have emerged (see, for example, Room, 1995, Atkinson, 1998 and Sen, 2000). A distinctive feature of the concept is the attempt to move beyond a narrow or one-dimensional view of the human experience towards a multifaceted and more encompassing view. Social exclusion is understood to be multidimensional, involving deprivation across a range of dimensions. The widespread adoption of the terms ‘social exclusion’ and ‘social inclusion’ in Europe reflects, among other things, the concern that focusing simply on income misses many important dimensions of the picture. There is now general acceptance that one should not focus solely on income:
If our paramount interest is in the lives that people can lead – then it cannot but be a mistake to concentrate exclusively only on one or other of the means to such freedom. We must look at impoverished lives and not just depleted wallets (Sen, 2000).2
A second key characteristic of the approach is its emphasis on dynamics.3 The work of Paugam (1995, 1996), for instance, talks of ‘spirals of precariousness’ – that is, a progressive rupturing of social relations through exposure to cumulative disadvantage. The concept of social exclusion thus incorporates notions of risk and vulnerability. Exclusion relates not only to the individual’s current economic circumstances, but also to their insecurity and exposure to risk and shock. It requires viewing
2 For treatment of the issue of multidimensionality, see Whelan and Maître (2005 and 2007).3 See Nolan and Whelan (2007) for a recent review of the literature.
SecondEuropeanQualityofLifeSurvey–Livingconditions,socialexclusionandmentalwell-being
6
social exclusion as a process rather than a state and necessitates an understanding of its underlying dynamics.
A third key feature of the concept is a concern with relative position in society rather than absolute deprivation. This emphasis is consistent with the following position expounded by the European Commission (2004):
An absolute notion is considered less relevant for the EU for two basic reasons. First, the challenge for Europe is to make the whole population share the benefits of high average prosperity and not to reach basic standards of living, as in less developed parts of the world. Secondly, what is regarded as minimal acceptable living standards depends largely on the general level of social and economic development, which tends to vary considerably across countries.
A fourth characteristic of the concept is the idea of ‘agency’. Understanding social exclusion involves the attribution of responsibility – whether individual or institutional – for exclusionary processes that go beyond the individual. Finally, social exclusion focuses attention on relational issues, that is, the rupturing of social relationships as reflected in inadequate social participation.
Together, the five characteristics of social exclusion – multidimensionality, dynamics, relative position in society, agency and relationality – provide a much richer conceptual backdrop against which to understand the processes of social vulnerability and their impact on quality of life. It is not possible to fully implement such a framework when relying on a cross-sectional survey of individuals, even where such data is complemented by additional information collected at other levels. However, the choices that are exercised in relation to data and the interpretation of the findings will be informed by this broader perspective.
Socialexclusion,livingconditionsandqualityoflife
The Anglo-Saxon tradition of poverty research concentrated primarily on income and wealth, although this was extended latterly to include non-monetary measures in the work of Townsend (1979) and Mack and Lansley (1985). The Swedish ‘level of living approach’ broadened this narrow approach somewhat to encompass access to resources in the form of knowledge, mental and physical energy and social relationships, as well as income and wealth (Erikson and Aberg, 1987). Although the framework outlined in the previous section requires going beyond the living conditions perspective, such conditions remain crucial to the ability of individuals to attain their goals. In Swedish welfare research, the individual resources, along with the arenas in which they are to be used, and essential conditions contribute to ‘level of living’ (see, for example, Erikson and Aberg, 1987). It is defined in terms of access to resources in the form of money, possessions, knowledge, mental and physical energy and social relationships – through which an individual can control and consciously direct their living conditions. This represents a substantial broadening of the quality of life concept beyond purely economic resources to include aspects such as health, knowledge and skills. It also goes beyond resources alone to include essential conditions.
This broader view of the role of living conditions recognises that the value of a given set of resources depends on the context in which it is used. Similarly, the characteristics of the arenas in which resources are used also affect individuals’ scope to direct their own lives. The core notion is that it is not simply outcomes that matter – because these can be affected by the different choices people make – but rather the capacity to affect these outcomes in a purposeful way. Therefore, living conditions – measured in
Briefhistoryandconceptualoverview
7
terms of outcomes across a variety of domains – certainly matter; however, if one is to understand both what produces differences in observed living conditions and what to read into these differences in terms of welfare, it is necessary to incorporate resources and, where possible, key contextual characteristics. Thus, the impact factors relating to both outcome and resources may be mediated by macro contexts, as reflected in aspects such as gross national product (GNP) and levels and patterns of social expenditure, along with micro characteristics such as family and friendship networks and neighbourhood facilities.
This nuanced development of the living conditions perspective has much in common with the thrust of Sen’s more recent, influential concept of ‘capabilities’. Sen (2000) defines ‘functionings’ as the various things a person manages to do or be in leading a life – such as being adequately nourished and in good health, having self-respect and being socially integrated. The ‘capability’ of a person, in turn, reflects the alternative combination of functionings that they can achieve. If resources are severely constrained, it may not, for example, be possible to both eat healthily enough and to have clothing decent enough to maintain dignity and self-respect (Sen, 2000; see Böhnke, 2005 for a more detailed discussion).
A further expansion of the Swedish living conditions approach is found in Allardt’s (1976, 1993) well-known triad of ‘having, loving and being’. ‘Having’ is related to material resources and living conditions – such as income, basic goods, housing, working conditions and the prerequisites needed to obtain them: in other words, aspects that generally refer to a basic standard of living and the environmental settings required to achieve this. The ‘loving’ dimension conceptualises the social needs of an individual with reference to social relationships, networks, emotional support and social integration in general. ‘Being’ refers to a sense of overall recognition, the need to integrate into society, possibilities for participating and feelings of belonging or alienation. A fourth pillar – ‘doing’ – is related to the active involvement of people in supporting others, political engagement and volunteering; it also captures control over the resource of time and opportunities for leisure activities.
Following Fahey et al (2003), the approach used in this report assumes that an adequate understanding of quality of life necessitates going beyond both living conditions and subjective evaluations to incorporate the person’s scope to direct their own lives. By this measure, a high quality of life is attained not when a predetermined lifestyle becomes universal, but rather when people’s scope to choose the lifestyle they wish for themselves is enhanced. This has, of course, to be achieved within the constraints imposed by economic sustainability and respect for the rights and needs of others. It also takes place in a particular institutional and policy setting and in the context of a community and a society. The lives of individuals are not ‘atomised’, but rather are intertwined with others in their household, community and beyond. The nature of these relationships, and the institutions and policies in place, are fundamental influences on quality of life.
The point to be emphasised here is that monitoring quality of life entails focusing not just on outcomes – which partly reflect the choices people make – and on subjective assessments – which partly reflect adaptation. It also requires a focus on resources – the factors that condition, facilitate and constrain such choices – and other constraints in the various arenas in which people operate. Central factors are the opportunities open to people, as well as the actual choices they make and the observed outcomes – both objective and subjective. It is the combination of these elements that makes up an individual’s quality of life, and this is what makes monitoring quality of life so challenging.
SecondEuropeanQualityofLifeSurvey–Livingconditions,socialexclusionandmentalwell-being
8
Perceivedsocialexclusionandmentalwell-being
A large and developed body of literature now exists on the relationship between social disadvantage and both physical and mental health. Research consistently shows that lower income, occupational position and education are all associated with higher levels of mortality and morbidity (Davey-Smith et al, 1994; Mackenbach and Bakker, 2002). It is thought that one significant way in which living conditions impact on health is through mental health and psychological stress (Brunner, 1997). Research shows that chronically low levels of resources create conflicts within a person’s life and a stress response that is harmful to health. The social distribution of psychological distress has been an important research question for at least four decades (Kohn and Schooler, 1969). Analysts have consistently found that those employed in manual, working-class occupations are more likely to exhibit higher levels of psychological distress compared with their middle-class peers. Subsequent work has broadened this analysis to show the contribution of different factors (Mirowsky and Ross, 2003). A great deal of research has been carried out on the contribution of unemployment to psychological distress (Ullah et al, 1985; Whelan et al, 1991; Schaufeli and Van Yperen, 1992). Whelan et al (1991) found that unemployed people were more likely to experience higher levels of psychological distress, a situation that is exacerbated by the experience of income poverty among this group.
Nonetheless, social exclusion can also impact on health through lack of social support and of perceived integration, as well as alienation. Social participation and belonging engender self-esteem and a sense of security, which have a powerful impact on mental and physical health. Higher levels of perceived alienation are associated with lower well-being, a greater risk of depression and higher levels of disability and chronic disease (Berkman and Syme, 1979; Oxman et al, 1992). As poor living conditions and social exclusion are often linked, this frequently means that the ill effects of both combine and interact to produce poorer outcomes.
While poor living conditions and social exclusion can increase the likelihood of mental health problems, the reverse is also true, with those experiencing mental health problems being at a much greater risk of also experiencing social exclusion. This is partly due to the impact of mental health problems on social relationships and one’s ability to work, but also because of the still widespread stigma that is associated with mental illness in Europe and elsewhere. Unfortunately, the data available for this project are cross-sectional, although the report examines the relationships between living conditions, social exclusion and mental health and well-being.
Dataandanalyticalapproach
The previous discussion underlines the inherent complexity of the social exclusion concept: that is, how it is strongly influenced by living conditions and objective social context, but how it also involves the experience of marginalisation and detachment. Although the experience of social exclusion is strongly influenced by an individual’s living conditions, it is clearly not completely defined by such conditions since the experience of low resources does not necessarily translate into the feeling of detachment from social participation and normative modes of behaviour. This suggests that the study of multidimensional disadvantage and participation should be accompanied by an analysis of the subjective experience of social exclusion. Until recently, a substantial gulf has existed between the conceptualisation of social exclusion, which has gained currency in policy development, and its operationalisation in empirical research. While some important exceptions to this have emerged (Paugam, 1996; Böhnke, 2004, 2005), even official EU attempts to develop a set of social indicators suitable for providing comparable information on social exclusion concentrates on income and
Briefhistoryandconceptualoverview
9
employment with some additional dimensions such as housing and employment (Atkinson et al, 2002). There are both practical and scientific reasons for taking this approach. For instance, there is good evidence that higher income and participation in the labour market significantly increase levels of social integration; however, the result of adopting these indicators alone is an emphasis on the objective predictors of social integration to the exclusion of the subjective. It should be highlighted that this is not an argument in favour of making social exclusion a relative concept, which is disconnected from politically modifiable objective circumstances. Rather, the argument is that taking subjective exclusion into account offers an opportunity to determine which disadvantages have consequences for quality of life and the circumstances under which this varies.
The European Quality of Life monitoring programme of the European Foundation for the Improvement of Living and Working Conditions (Eurofound) has incorporated both objective and subjective components in surveys on European quality of life (Böhnke, 2004, 2005). This study is fortunate to have access to Eurofound’s Second European Quality of Life Survey (EQLS), which includes measures of living conditions, social participation and support, as well as perceived social exclusion. The analyses begin from the position that three key processes promote social integration at the individual level: first, attachment or access to the labour market; second, the provision of basic essentials in terms of income and the ability to lead a lifestyle acceptable to the majority of people within a country; and third, social support and membership of a family unit or small group of some form. The analyses in this report examine the manner in which these processes interact to influence perceived social exclusion and the impact that this has on mental well-being.
The availability of information for 31 countries in the EQLS data – that is, the 27 Member States of the European Union (EU27), along with Norway and the three candidate countries (CC3) Croatia, the former Yugoslav Republic of Macedonia and Turkey – provides an important opportunity to assess how the processes described above vary across countries with very different cultural and historical contexts and recent social and economic experiences. This will enable a comparison between states that are EU candidate countries, those that have recently acceded to the EU and the 15 Member States that constituted the EU before the first enlargement in May 2004 (EU15). These three groups vary enormously in terms of living standards and social and economic development, which has major implications for social stability and cohesion within the EU. It is likely that substantial differences exist across countries and groups of countries in terms of the distribution of risk factors for social exclusion and their impact on perceived integration. Countries differ dramatically in terms of the structures available to mitigate vulnerability and increase integration, as well as the manner in which these interact with patterns of family life, contact and sociability. This report examines the following four key questions.
1. How is perceived social exclusion distributed across different countries? What is the relationship between perceived social exclusion and reported living arrangements, patterns of sociability and participation? Is perceived exclusion detached from such ‘objective’ measures of integration or are both measures interrelated? Does the relationship vary by country or group of countries?
2. To what extent is labour market integration and access associated with perceived social exclusion and are its effects moderated through the living conditions and resources available to individuals and households? Does the relationship between labour market status, living conditions and perceived social exclusion vary across countries and what implications does this have for possible interventions?
SecondEuropeanQualityofLifeSurvey–Livingconditions,socialexclusionandmentalwell-being
10
3. Is the impact of poor living conditions and labour market attachment on perceived social exclusion mediated by the availability of social support to individuals and the nature of their social networks? What role does family support and wider social networks play in mitigating the consequences of material disadvantage and promoting a sense of integration?
4. To what extent do poor labour market access, living conditions and perceived social exclusion impact on mental well-being and how does this process vary across different countries and circumstances? What role does social support play in mediating the impact of conditions and exclusion? Do living conditions impact on mental well-being through perceived social exclusion or is the relationship more direct?
These questions are tackled in the above order over the next four chapters.
11
2Perceived social exclusion and reported social contact
Measuringperceivedsocialexclusion
Chapter 1 showed that social exclusion is a complex concept, that is multidimensional in nature as well as relational and dynamic. Such complexity is difficult to measure in a social survey, and this difficulty is amplified when attempted on a cross-national basis. This chapter uses data from the second EQLS to construct a reliable and valid measure of perceived social exclusion that addresses several important dimensions of the underlying concept. This self-assessed measure brings a subjective element to the analysis – while this element is welcomed, it is important to examine the extent to which such a subjective measure is related to objective measures of social contact and participation. For example, the family is the primary context within which most people establish close social relationships, although this may not always be the case. On average, however, it can be assumed that those living in households with other people to whom they are related will have lower levels of social exclusion than those living alone or with unrelated individuals. Similarly, it can be expected that people who are regularly in contact with friends and family will experience higher levels of inclusion, on average, than those who are not.
The EQLS contained a series of statements that can be used to measure perceived social exclusion, as follows.
• ‘I feel left out of society.’
• ‘Life has become so complicated today that I almost can’t find my way.’
• ‘I don’t feel that the value of what I do is recognised by others.’
• ‘Some people look down on me because of my job situation or income.’
People responding to the survey were asked whether they agreed or disagreed with these statements and the extent of this agreement/disagreement (‘strongly agree/agree’ or ‘strongly disagree/disagree’). Respondents also had the option of stating that they ‘neither agreed nor disagreed’. The four statements include a basic indication of the sense of exclusion, as well as a question measuring perceived exclusion because of the ‘complexity of life’. This measures an individual’s sense of ‘normlessness’ due to changed social conditions or developments.
Two questions are included to gauge perceived economic evaluations of the individual. The previous chapter showed that studies of social inclusion have tended to rely on measures of a person’s living standards or available resources to estimate social inclusion, since economic circumstances are seen as crucial in determining whether a person or household will be able to participate in the wider society. Taken together, agreement with these statements would strongly suggest that the individual concerned did not feel integrated into the society in which they live or felt unable to participate in what they perceive as the accepted standard of living or activities.
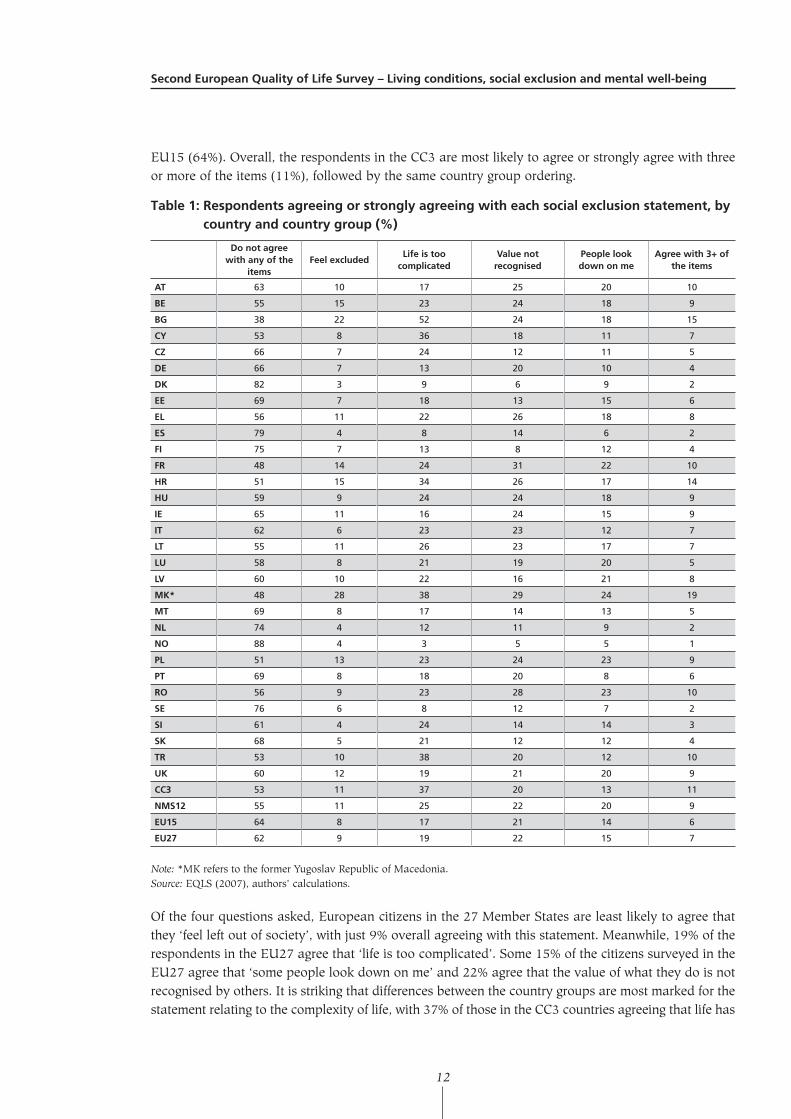
Table 1 shows the proportion of people in each country, and in the four country groupings, who agree or strongly agree with the previous statements, as well as the share agreeing with none of the statements or agreeing with three or more. Looking at the results for each country, it appears that a majority of European citizens see themselves as being integrated into their societies on the basis of their disagreement with all four of the items. Individuals in the CC3 – Croatia, the former Yugoslav Republic of Macedonia and Turkey – are the least likely (53%) to disagree with all of the statements; they are followed by the respondents in the 12 new Member States (NMS12) (55%), the EU27 (62%) and the
SecondEuropeanQualityofLifeSurvey–Livingconditions,socialexclusionandmentalwell-being
12
EU15 (64%). Overall, the respondents in the CC3 are most likely to agree or strongly agree with three or more of the items (11%), followed by the same country group ordering.
Table1:Respondentsagreeingorstronglyagreeingwitheachsocialexclusionstatement,bycountryandcountrygroup(%)
Donotagreewithanyofthe
itemsFeelexcluded
Lifeistoocomplicated
Valuenotrecognised
Peoplelookdownonme
Agreewith3+oftheitems
AT 63 10 17 25 20 10
BE 55 15 23 24 18 9
BG 38 22 52 24 18 15
CY 53 8 36 18 11 7
CZ 66 7 24 12 11 5
DE 66 7 13 20 10 4
DK 82 3 9 6 9 2
EE 69 7 18 13 15 6
EL 56 11 22 26 18 8
ES 79 4 8 14 6 2
FI 75 7 13 8 12 4
FR 48 14 24 31 22 10
HR 51 15 34 26 17 14
HU 59 9 24 24 18 9
IE 65 11 16 24 15 9
IT 62 6 23 23 12 7
LT 55 11 26 23 17 7
LU 58 8 21 19 20 5
LV 60 10 22 16 21 8
MK* 48 28 38 29 24 19
MT 69 8 17 14 13 5
NL 74 4 12 11 9 2
NO 88 4 3 5 5 1
PL 51 13 23 24 23 9
PT 69 8 18 20 8 6
RO 56 9 23 28 23 10
SE 76 6 8 12 7 2
SI 61 4 24 14 14 3
SK 68 5 21 12 12 4
TR 53 10 38 20 12 10
UK 60 12 19 21 20 9
CC3 53 11 37 20 13 11
NMS12 55 11 25 22 20 9
EU15 64 8 17 21 14 6
EU27 62 9 19 22 15 7
Note: *MK refers to the former Yugoslav Republic of Macedonia.Source: EQLS (2007), authors’ calculations.
Of the four questions asked, European citizens in the 27 Member States are least likely to agree that they ‘feel left out of society’, with just 9% overall agreeing with this statement. Meanwhile, 19% of the respondents in the EU27 agree that ‘life is too complicated’. Some 15% of the citizens surveyed in the EU27 agree that ‘some people look down on me’ and 22% agree that the value of what they do is not recognised by others. It is striking that differences between the country groups are most marked for the statement relating to the complexity of life, with 37% of those in the CC3 countries agreeing that life has
Perceivedsocialexclusionandreportedsocialcontact
13
become too complicated, compared with 17% of individuals in the EU15 countries. The country groups are substantially closer with regard to the other questions, particularly those referring to overall sense of inclusion, with just three percentage points differentiating the CC3 and EU15 countries. However, a larger degree of variation emerges between the individual countries. Regarding the overall sense of integration, 28% of respondents in the former Yugoslav Republic of Macedonia and 22% in Bulgaria agree with the statement that they feel excluded, compared with 3% of those in Denmark.
Two of the statements presented in Table 1 – that is, ‘I feel left out of society’ and ‘life has become so complicated’ – were also used as part of the First European Quality of Life Survey (2003) and analysed by Böhnke (2005). All of the countries, with the exception of Austria, Belgium and Luxembourg, show a decline in the proportion of respondents agreeing with the first of these statements between 2003 and 2007.4 The decline was particularly pronounced in Slovakia (–24 percentage points) and Slovenia (–23 points), followed by Bulgaria, Latvia (–16 points) and Turkey (–15 points). In the EU15 countries, the decrease in the proportion of respondents agreeing with this statement was smaller, falling by five percentage points or less in nine of the countries.
Aside from Austria, all of the countries experienced a decline between 2003 and 2007 in the proportion of respondents who agree that ‘life has become so complicated’. Once again, the drop was largest in the new Member States and candidate countries, particularly in Turkey (–36 percentage points), Slovakia (–32 points) and Lithuania (–30 points). A sizeable decline in this proportion was also evident in some of the EU15 countries, such as in Greece (–28 percentage points), Portugal (–25 points) and Sweden (–23 points). These changes may imply a significant improvement across a large proportion of European countries in perceived social exclusion, although it is hard to exclude the possibility that methodological differences between the EQLS surveys may also play a role.
The four statements presented in Table 1 measure different aspects of an underlying ‘latent’ dimension of social exclusion. Combining these statements into a single measure would not only make comparisons more practical, but could also provide a better overall measure since each of the statement is, in effect, an imperfect measure of the underlying latent concept. When combined, they may produce a valid and reliable measure. Analysis shows that the statements combine well to offer a reliable measure of social exclusion by simply taking the average of each respondent’s answers.5 For ease of interpretation, the scoring of the statements is reversed such that a high score indicates higher exclusion, with the scale running from 1 to 5.
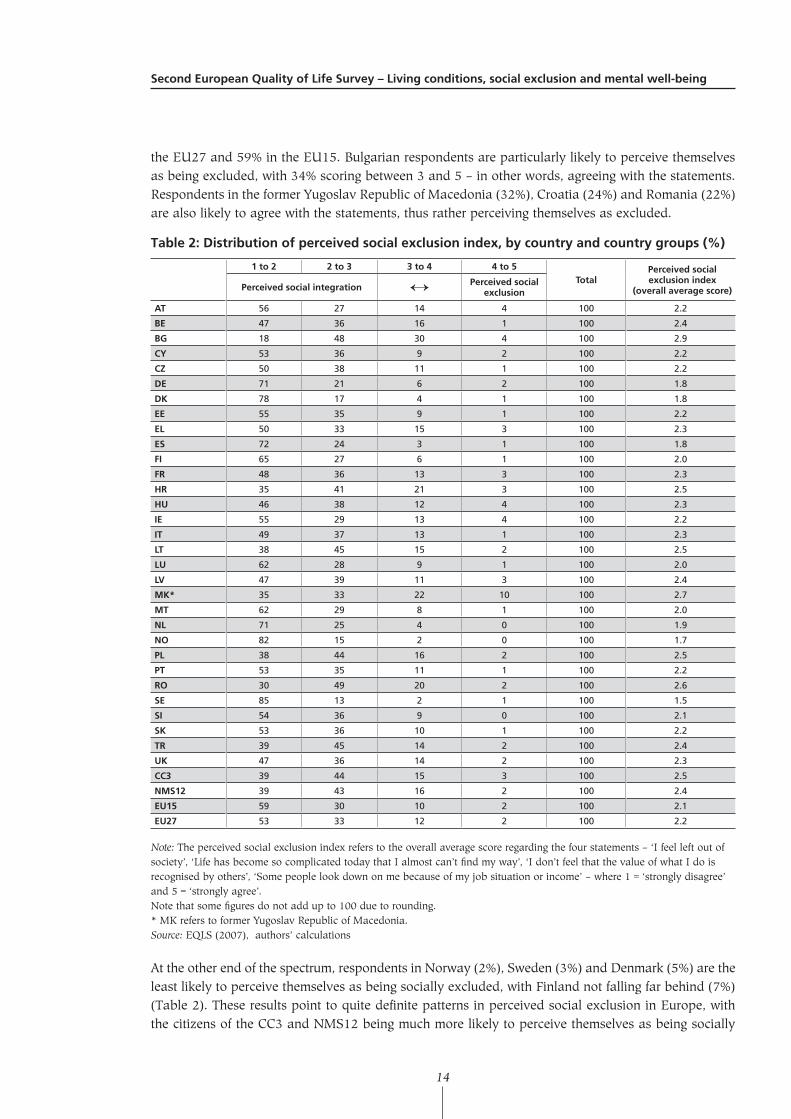
Table 2 shows the distribution of this scale across the different countries and country groups, once condensed into four groups. The overall average score regarding the four statements is referred to as the ‘Index of perceived social exclusion’. Accordingly, the scores run from 1 to 2, 2 to 3, 3 to 4 and 4 to 5 to facilitate presentation of the distribution of scores. The results in Table 2 show that, overall, a majority of European citizens feel socially integrated: more specifically, 86% of respondents reach a score of between 1 and 3, suggesting disagreement with the statements on average, while 52% attain a score of between 1 and 2, indicating strong disagreement. On the other hand, 14% agree to some extent, while an average of 2% agree strongly. Table 2 shows that individuals in the NMS12 and CC3 countries are the least likely to perceive themselves as being integrated: in both country groups, 39% score between 1 and 2, that is, disagreeing with the statements, compared with 55% of respondents in
4 The Austrian proportion of respondents feeling excluded from society increased by two percentage points, Belgium by a single point and Luxembourg remained at the same level.
5 The Cronbach’s Alpha for the four statements – an accepted measure of the internal reliability of the underlying scale – is 0.77. This is generally regarded as a very good level of reliability (Streiner and Norman, 1995).
SecondEuropeanQualityofLifeSurvey–Livingconditions,socialexclusionandmentalwell-being
14
the EU27 and 59% in the EU15. Bulgarian respondents are particularly likely to perceive themselves as being excluded, with 34% scoring between 3 and 5 – in other words, agreeing with the statements. Respondents in the former Yugoslav Republic of Macedonia (32%), Croatia (24%) and Romania (22%) are also likely to agree with the statements, thus rather perceiving themselves as excluded.
Table2:Distributionofperceivedsocialexclusionindex,bycountryandcountrygroups(%)
1to2 2to3 3to4 4to5Total
Perceivedsocialexclusionindex
(overallaveragescore)Perceivedsocialintegration ↔ Perceivedsocialexclusion
AT 56 27 14 4 100 2.2
BE 47 36 16 1 100 2.4
BG 18 48 30 4 100 2.9
CY 53 36 9 2 100 2.2
CZ 50 38 11 1 100 2.2
DE 71 21 6 2 100 1.8
DK 78 17 4 1 100 1.8
EE 55 35 9 1 100 2.2
EL 50 33 15 3 100 2.3
ES 72 24 3 1 100 1.8
FI 65 27 6 1 100 2.0
FR 48 36 13 3 100 2.3
HR 35 41 21 3 100 2.5
HU 46 38 12 4 100 2.3
IE 55 29 13 4 100 2.2
IT 49 37 13 1 100 2.3
LT 38 45 15 2 100 2.5
LU 62 28 9 1 100 2.0
LV 47 39 11 3 100 2.4
MK* 35 33 22 10 100 2.7
MT 62 29 8 1 100 2.0
NL 71 25 4 0 100 1.9
NO 82 15 2 0 100 1.7
PL 38 44 16 2 100 2.5
PT 53 35 11 1 100 2.2
RO 30 49 20 2 100 2.6
SE 85 13 2 1 100 1.5
SI 54 36 9 0 100 2.1
SK 53 36 10 1 100 2.2
TR 39 45 14 2 100 2.4
UK 47 36 14 2 100 2.3
CC3 39 44 15 3 100 2.5
NMS12 39 43 16 2 100 2.4
EU15 59 30 10 2 100 2.1
EU27 53 33 12 2 100 2.2
Note: The perceived social exclusion index refers to the overall average score regarding the four statements – ‘I feel left out of society’, ‘Life has become so complicated today that I almost can’t find my way’, ‘I don’t feel that the value of what I do is recognised by others’, ‘Some people look down on me because of my job situation or income’ – where 1 = ‘strongly disagree’ and 5 = ‘strongly agree’. Note that some figures do not add up to 100 due to rounding.* MK refers to former Yugoslav Republic of Macedonia.Source: EQLS (2007), authors’ calculations
At the other end of the spectrum, respondents in Norway (2%), Sweden (3%) and Denmark (5%) are the least likely to perceive themselves as being socially excluded, with Finland not falling far behind (7%) (Table 2). These results point to quite definite patterns in perceived social exclusion in Europe, with the citizens of the CC3 and NMS12 being much more likely to perceive themselves as being socially
Perceivedsocialexclusionandreportedsocialcontact
15
excluded compared with those in the more long-standing EU Member States. The extent of change between 2003 and 2007, however, does suggest that this situation may be changing rapidly.
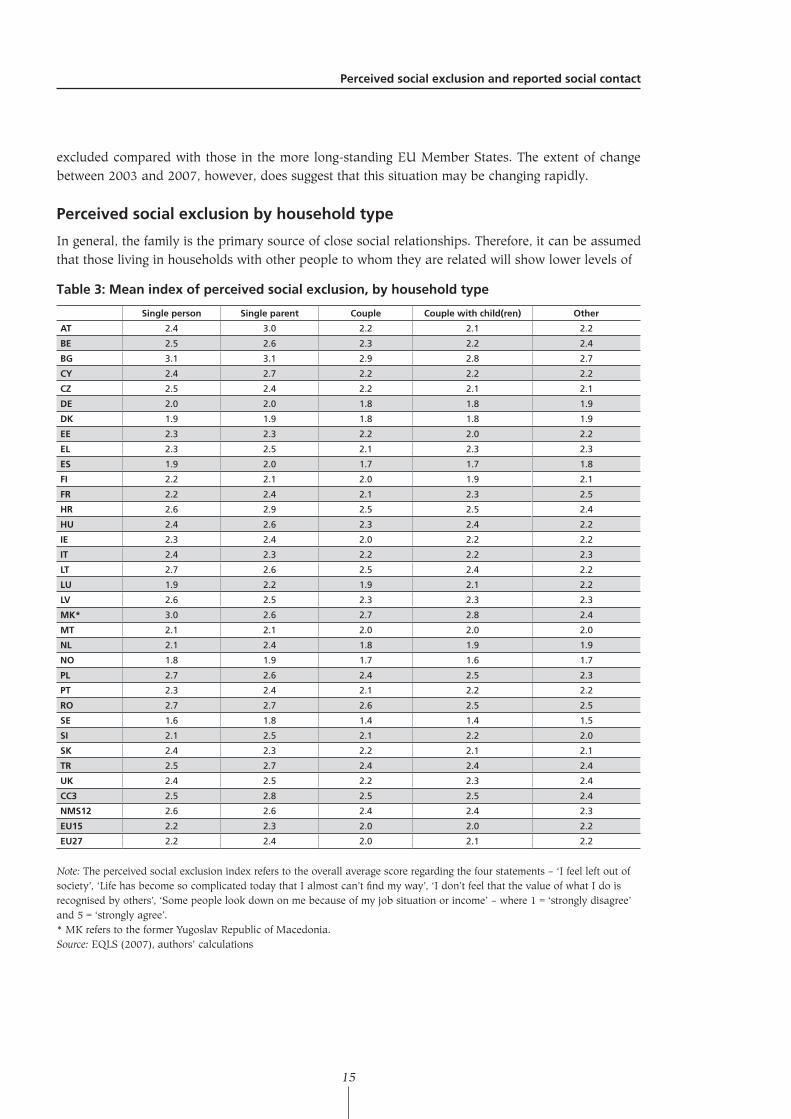
Perceivedsocialexclusionbyhouseholdtype
In general, the family is the primary source of close social relationships. Therefore, it can be assumed that those living in households with other people to whom they are related will show lower levels of
Table3:Meanindexofperceivedsocialexclusion,byhouseholdtype
Singleperson Singleparent Couple Couplewithchild(ren) Other
AT 2.4 3.0 2.2 2.1 2.2
BE 2.5 2.6 2.3 2.2 2.4
BG 3.1 3.1 2.9 2.8 2.7
CY 2.4 2.7 2.2 2.2 2.2
CZ 2.5 2.4 2.2 2.1 2.1
DE 2.0 2.0 1.8 1.8 1.9
DK 1.9 1.9 1.8 1.8 1.9
EE 2.3 2.3 2.2 2.0 2.2
EL 2.3 2.5 2.1 2.3 2.3
ES 1.9 2.0 1.7 1.7 1.8
FI 2.2 2.1 2.0 1.9 2.1
FR 2.2 2.4 2.1 2.3 2.5
HR 2.6 2.9 2.5 2.5 2.4
HU 2.4 2.6 2.3 2.4 2.2
IE 2.3 2.4 2.0 2.2 2.2
IT 2.4 2.3 2.2 2.2 2.3
LT 2.7 2.6 2.5 2.4 2.2
LU 1.9 2.2 1.9 2.1 2.2
LV 2.6 2.5 2.3 2.3 2.3
MK* 3.0 2.6 2.7 2.8 2.4
MT 2.1 2.1 2.0 2.0 2.0
NL 2.1 2.4 1.8 1.9 1.9
NO 1.8 1.9 1.7 1.6 1.7
PL 2.7 2.6 2.4 2.5 2.3
PT 2.3 2.4 2.1 2.2 2.2
RO 2.7 2.7 2.6 2.5 2.5
SE 1.6 1.8 1.4 1.4 1.5
SI 2.1 2.5 2.1 2.2 2.0
SK 2.4 2.3 2.2 2.1 2.1
TR 2.5 2.7 2.4 2.4 2.4
UK 2.4 2.5 2.2 2.3 2.4
CC3 2.5 2.8 2.5 2.5 2.4
NMS12 2.6 2.6 2.4 2.4 2.3
EU15 2.2 2.3 2.0 2.0 2.2
EU27 2.2 2.4 2.0 2.1 2.2
Note: The perceived social exclusion index refers to the overall average score regarding the four statements – ‘I feel left out of society’, ‘Life has become so complicated today that I almost can’t find my way’, ‘I don’t feel that the value of what I do is recognised by others’, ‘Some people look down on me because of my job situation or income’ – where 1 = ‘strongly disagree’ and 5 = ‘strongly agree’.* MK refers to the former Yugoslav Republic of Macedonia.Source: EQLS (2007), authors’ calculations
SecondEuropeanQualityofLifeSurvey–Livingconditions,socialexclusionandmentalwell-being
16
perceived social exclusion than those living alone or with unrelated individuals. It could be expected, for instance, that people living alone will experience more social exclusion on average than those living with others and that single parents will perceive themselves as being more excluded than those living as a couple with children. This does not mean that other factors will be insignificant. As suggested in Chapter 1, the standard of living conditions may be as significant, if not more significant, in determining perceived social exclusion than the level of social contact. Nonetheless, the latter should still remain crucial, other things being equal, if the measure of perceived social exclusion is to provide an analytical insight.
The results in Table 3 highlight that household type is significant across most of the countries, with couples and couples with children experiencing lower levels of social exclusion on average than either single people or single parents. On average, across the countries, single persons experience 3% more social exclusion than couples with children, while single parents experience 10% more. However, these figures mask differentials across age groups. If controlling for age and gender, the differentials for single persons increases up to 15% and for single parents up to 35% in terms of greater exclusion. Table 3 shows that the difference between the groups is, on average, highest in the CC3 countries, although the differentials between single parents and couples with children are particularly large in Austria (+44% higher), the Netherlands (+29%) and Sweden (+25%).
Perceivedsocialexclusionandreportedsocialcontact
The EQLS contains two sets of questions to determine the respondents’ frequency of contact with friends and family outside of their household. As with the respondents’ household type, it may be expected that those with lower levels of social contact will feel higher levels of social exclusion. One set of questions asks about face-to-face contact and the other about contact at a distance – that is, by phone, email or post. Each set of questions asks about contact with four groups: the person’s children, mother or father, brother, sister or other relative and any friends or neighbours. The response categories range from ‘more than once a day’ to ‘less than several times a year’. Each set of questions has been condensed into a scale by summing up the individual questions and calculating the average score. Higher scores in this instance indicate greater social contact in both scales.
Although countries and individuals reaching a high score on one scale are more likely to attain a high score on the other, the relationship is not straightforward, with an individual and country correlation of about 0.4 being recorded. The countries Cyprus, Italy, Slovenia and Hungary have the highest levels of face-to-face contact, while Finland, Sweden, Denmark and France have the lowest levels. In relation to contact at a distance, on the other hand, Sweden ranks sixth out of the 31 countries listed, while Denmark and Finland rank fourteenth and seventeenth respectively. In 24 of the 31 countries, the level of face-to-face contact is higher than contact at a distance. Interestingly, five of the seven countries where contact at a distance is higher than face-to-face contact are in Scandinavia. Personal characteristics also play a role: across the countries, being younger and female are associated with a higher level of both face-to-face contact and contact at a distance. The impact of gender and age are particularly pronounced in relation to contact at a distance.
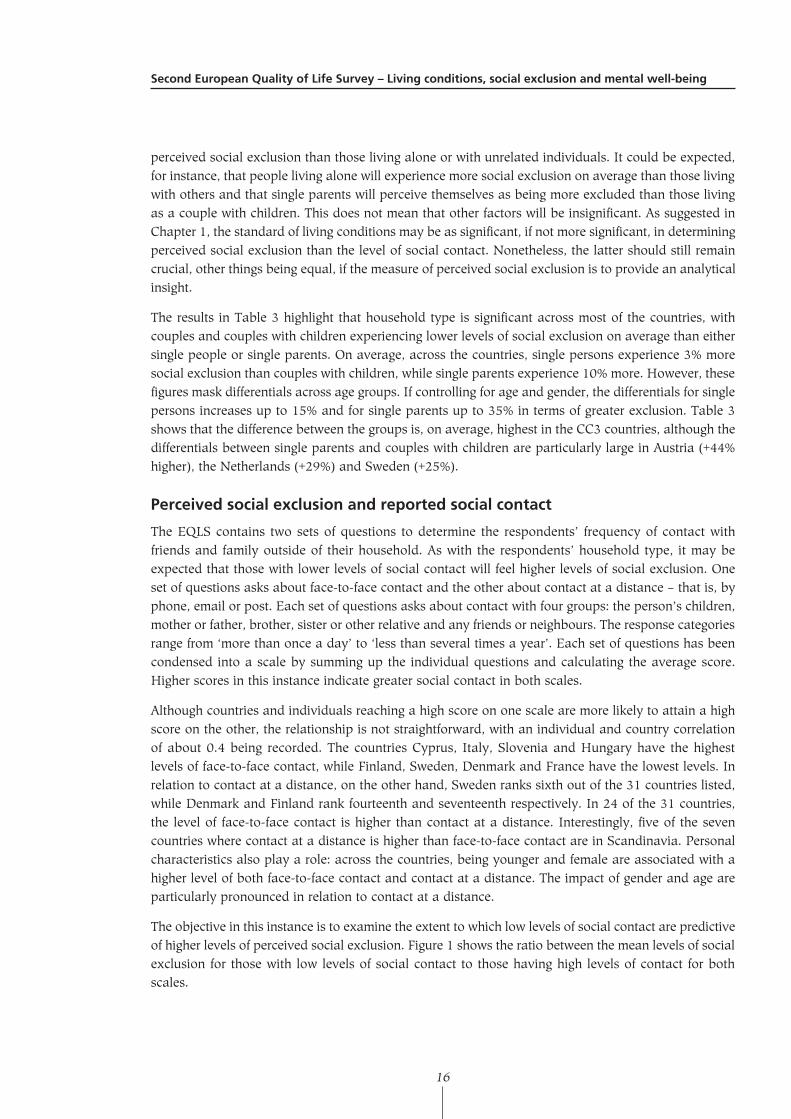
The objective in this instance is to examine the extent to which low levels of social contact are predictive of higher levels of perceived social exclusion. Figure 1 shows the ratio between the mean levels of social exclusion for those with low levels of social contact to those having high levels of contact for both scales.
Perceivedsocialexclusionandreportedsocialcontact
17
Figure1:Ratioofaverageindexofperceivedsocialexclusion,byrespondents’levelofcontact
1.35
1.3
1.25
1.2
1.15
1.1
1.05
1
0.95
0.9
Face to face At distance
DKFRIEUKNLFITRROELCC3PTLVPLEEEU27
EU15
BEITLUSKNMS12
SELTHUESBGNOCZDEMKHRCYATMTSI
Note: The social contact scales are grouped into tritiles to aid interpretation – that is, ranked by score and divided into three equally sized groups.MK refers to the former Yugoslav Republic of Macedonia.Source: EQLS (2007), authors’ calculations
If low contact is associated with social exclusion, the ratio between the groups should be greater than one – in other words, individuals with low contact will have higher levels of social exclusion than those with high levels of contact. Figure 1 shows that this is largely the case across the countries and country groups both in terms of face-to-face contact and contact at a distance, although the ratio between the scales differs significantly at the individual level. When ranking the ratio for face-to-face contact, it emerges that the NMS12 countries have the highest ratio between low and high social contact groups in terms of social exclusion; these countries are followed closely by the EU15 Member States.
Slovenia, Malta and Austria have the highest ratios for face-to-face contact; at the other end of the scale, Denmark, France and Ireland have the lowest ratios, with scores under one. This suggests a weak relationship between levels of social contact and perceived exclusion in these countries. Interestingly, while Denmark and France had low mean levels of contact compared with other countries, Ireland was in the top five countries on both scales. This shows that the weak relationship with social exclusion is not a function of low levels of social contact within the country overall.
In relation to contact at a distance, Sweden, Croatia, the former Yugoslav Republic of Macedonia and Latvia have particularly high ratios in terms of social exclusion. Looking at the five countries with the lowest ratio for contact at a distance, three are in southern Europe and four can be found in the higher rankings for average face-to-face contact; this could suggest that contact at a distance is not as important a dimension of social life in these countries, leading to lower impacts on perceived social exclusion.
SecondEuropeanQualityofLifeSurvey–Livingconditions,socialexclusionandmentalwell-being
18
Conclusions
Social exclusion is a complex, multidimensional concept that is influenced by objective social circumstances and living conditions. Nonetheless, it also retains a subjective element. This chapter has shown that a reliable measure of perceived social exclusion can be constructed from the EQLS database that is strongly related to indicators of social integration and self-reported measures of social contact. The analyses show that a clear majority of European citizens do not perceive themselves to be socially excluded to any degree, with 62% of respondents agreeing with none of the statements indicating exclusion. In contrast, only a small proportion of about 7% of European citizens agree with three or more of the statements on exclusion. Although this report examines social exclusion as an index, and will continue to do so, it is important to note that variability is highest in response to the statement that ‘life is too complicated’. A high proportion of respondents in the CC3 countries agree with this statement, followed by a significant proportion in the NMS12. These countries have experienced substantial social and economic change in recent decades, and this may be reflected in this particular dimension of perceived social exclusion.
Average levels of perceived exclusion vary across countries and country groups, with the EU15 countries having the lowest scores on average, followed by the NMS12 and CC3. As the next chapter will go on to show, it is hard not to draw an association with overall country wealth in this context – for instance, the Scandinavian countries fare particularly well – although this would be simplistic given the other major differences between countries in terms of social institutions and employment levels. These factors are, of course, not unrelated and will be examined in greater detail in the next chapter.
The concept of social exclusion has an important subjective dimension to it, in the sense that there must be an agent feeling the exclusion. However, it is hoped that the measure used in this report will reflect actual patterns of social contact to a significant extent and vary with characteristics indicative of integration. This does indeed seem to be the case. In most of the countries, perceived social exclusion was higher among those in smaller households or living alone without close family members, and this differential remained even controlling for a number of different social and economic characteristics. Similarly, those who had higher levels of face-to-face contact or contact at a distance perceived lower levels of exclusion. National patterns of sociability were clearly evident, with the Scandinavian countries being less likely to have frequent face-to-face contact, although these countries ranked significantly higher in terms of contact at a distance. However, in virtually all of the countries under examination, irrespective of the overall level of sociability, those with lower levels of contact were more likely to have higher levels of exclusion.
19
3Impact of social conditions on perceived social exclusion
Three key processes help to promote social integration at the individual level: first, attachment to or access to the labour market; second, the provision of basic essentials in terms of income and the ability to lead a lifestyle acceptable to the majority of people within a country; and third, social support and membership of a family unit or small group of some form. In this chapter, the impact of the first two processes on perceived social exclusion is examined, using the measure developed in the previous chapter. First to be examined is the association between a country’s macroeconomic environment in terms of gross domestic product (GDP) and level of unemployment and its average level of perceived social exclusion. The chapter then goes on to examine the role of labour market status and occupational class. Also analysed is the influence of specific measures of material resources on an individual’s perceived social exclusion. Finally, an attempt is made to identify the individual contribution of these factors to perceived social exclusion.
Macroeconomicenvironmentandperceivedsocialexclusion
GDPpercapita
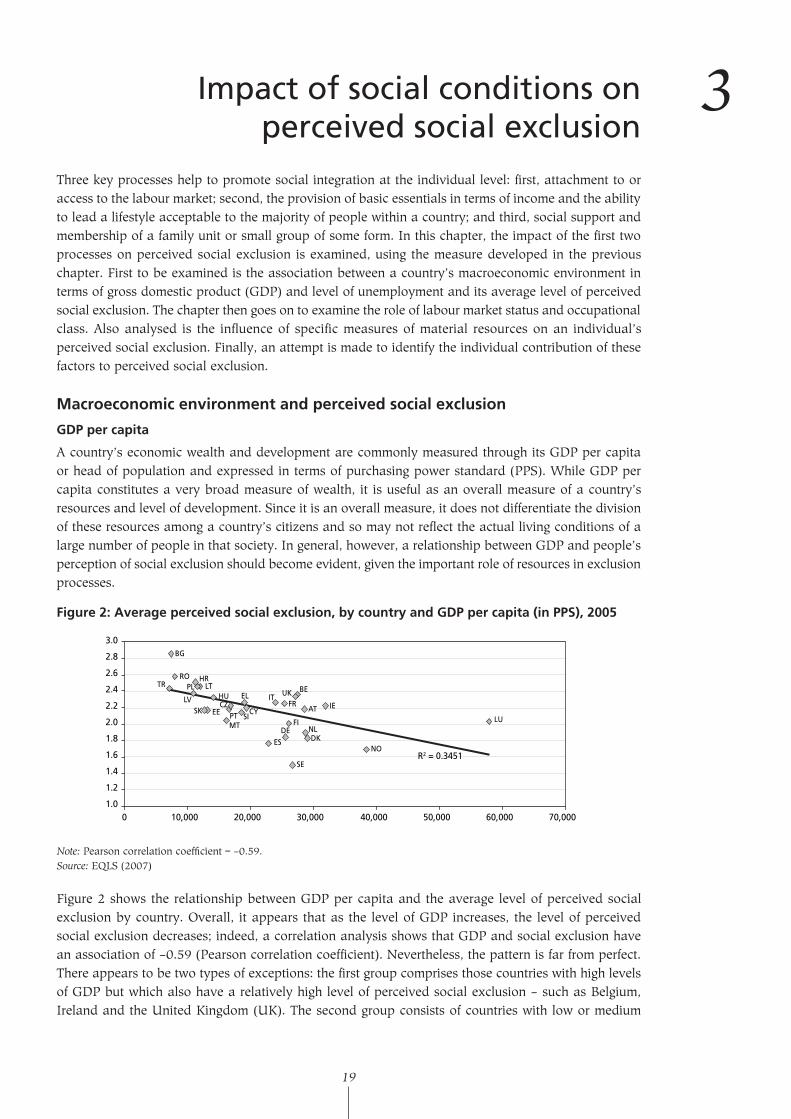
A country’s economic wealth and development are commonly measured through its GDP per capita or head of population and expressed in terms of purchasing power standard (PPS). While GDP per capita constitutes a very broad measure of wealth, it is useful as an overall measure of a country’s resources and level of development. Since it is an overall measure, it does not differentiate the division of these resources among a country’s citizens and so may not reflect the actual living conditions of a large number of people in that society. In general, however, a relationship between GDP and people’s perception of social exclusion should become evident, given the important role of resources in exclusion processes.
Figure2:Averageperceivedsocialexclusion,bycountryandGDPpercapita(inPPS),2005
3.0
2.8
2.6
2.4
2.2
2.0
1.8
1.6
1.4
1.2
1.00 10,000 20,000 30,000 40,000 50,000 60,000 70,000
R2 = 0.3451
BE
DKDE
ES
FI
FRIT
LUNL
PT
SE
UK
CYEE
MT
SK
NO
BG
ROTR
HR
LV
PL LTHU ELCZ
SIAT IE
Note: Pearson correlation coefficient = –0.59.Source: EQLS (2007)
Figure 2 shows the relationship between GDP per capita and the average level of perceived social exclusion by country. Overall, it appears that as the level of GDP increases, the level of perceived social exclusion decreases; indeed, a correlation analysis shows that GDP and social exclusion have an association of –0.59 (Pearson correlation coefficient). Nevertheless, the pattern is far from perfect. There appears to be two types of exceptions: the first group comprises those countries with high levels of GDP but which also have a relatively high level of perceived social exclusion – such as Belgium, Ireland and the United Kingdom (UK). The second group consists of countries with low or medium
SecondEuropeanQualityofLifeSurvey–Livingconditions,socialexclusionandmentalwell-being
20
levels of GDP but also with a relatively low level of perceived social exclusion – such as Estonia, Malta and Slovenia. Such contrasts underline the limitations of these general indicators for explaining complex variables such as social exclusion.
Unemployment
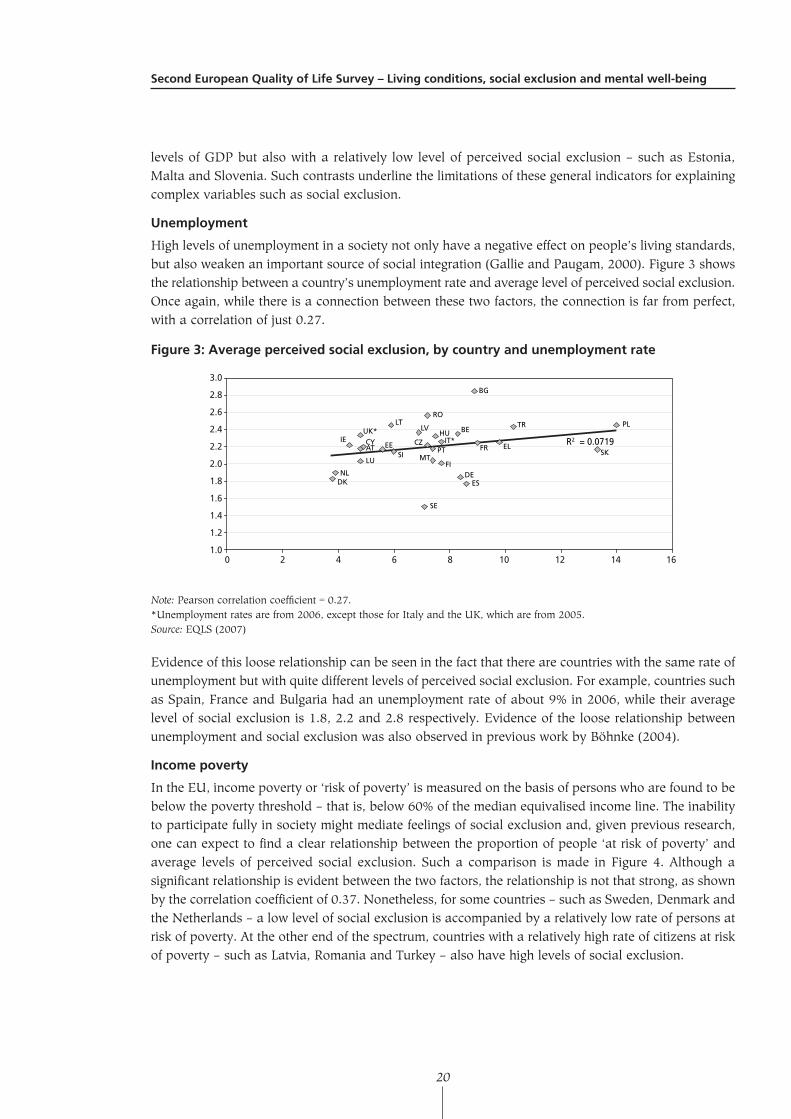
High levels of unemployment in a society not only have a negative effect on people’s living standards, but also weaken an important source of social integration (Gallie and Paugam, 2000). Figure 3 shows the relationship between a country’s unemployment rate and average level of perceived social exclusion. Once again, while there is a connection between these two factors, the connection is far from perfect, with a correlation of just 0.27.
Figure3:Averageperceivedsocialexclusion,bycountryandunemploymentrate
0 2 4 6 8 10 12 14 16
3.0
2.8
2.6
2.4
2.2
2.0
1.8
1.6
1.4
1.2
1.0
R2 = 0.0719BE
DKDE
EL
ES
FI
FRIE IT*
LU
NL
AT PT
SE
UK*
BG
CY CZEE
HULV
LT
MT
PLRO
SKSI
TR
Note: Pearson correlation coefficient = 0.27.*Unemployment rates are from 2006, except those for Italy and the UK, which are from 2005.Source: EQLS (2007)
Evidence of this loose relationship can be seen in the fact that there are countries with the same rate of unemployment but with quite different levels of perceived social exclusion. For example, countries such as Spain, France and Bulgaria had an unemployment rate of about 9% in 2006, while their average level of social exclusion is 1.8, 2.2 and 2.8 respectively. Evidence of the loose relationship between unemployment and social exclusion was also observed in previous work by Böhnke (2004).
Incomepoverty
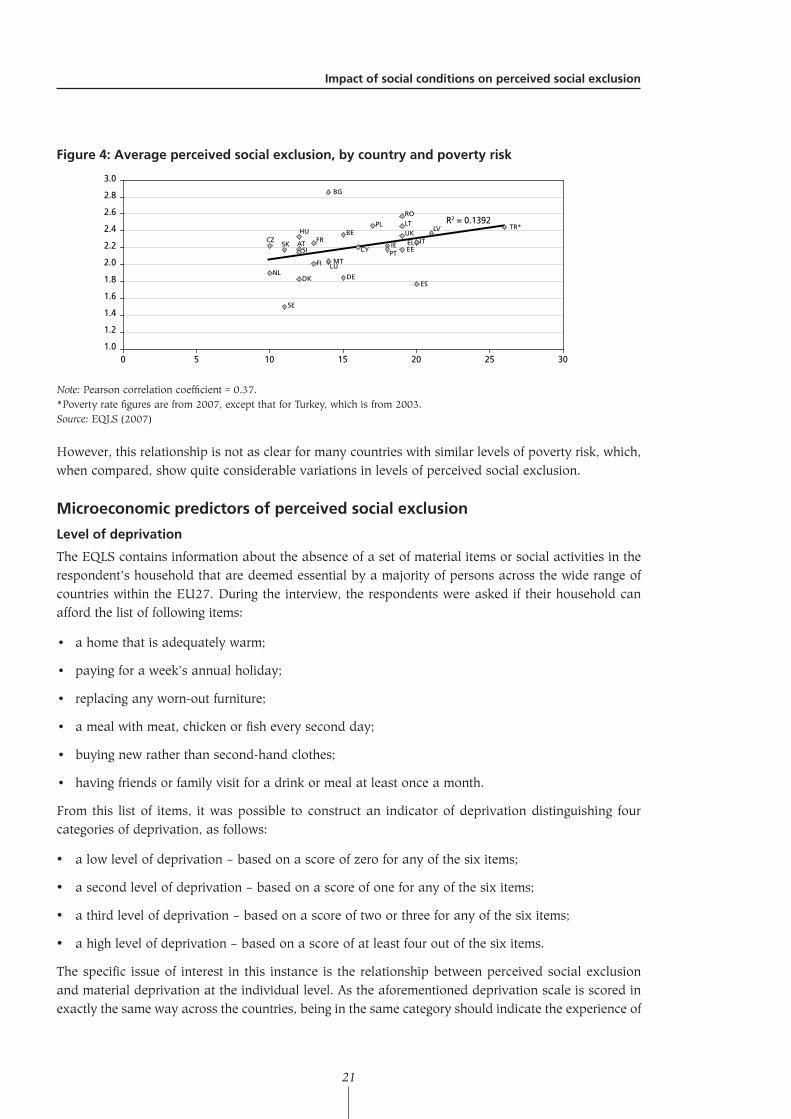
In the EU, income poverty or ‘risk of poverty’ is measured on the basis of persons who are found to be below the poverty threshold – that is, below 60% of the median equivalised income line. The inability to participate fully in society might mediate feelings of social exclusion and, given previous research, one can expect to find a clear relationship between the proportion of people ‘at risk of poverty’ and average levels of perceived social exclusion. Such a comparison is made in Figure 4. Although a significant relationship is evident between the two factors, the relationship is not that strong, as shown by the correlation coefficient of 0.37. Nonetheless, for some countries – such as Sweden, Denmark and the Netherlands – a low level of social exclusion is accompanied by a relatively low rate of persons at risk of poverty. At the other end of the spectrum, countries with a relatively high rate of citizens at risk of poverty – such as Latvia, Romania and Turkey – also have high levels of social exclusion.
Impactofsocialconditionsonperceivedsocialexclusion
21
Figure4:Averageperceivedsocialexclusion,bycountryandpovertyrisk
R2 = 0.1392
1.0
1.2
1.4
1.6
1.8
2.0
2.2
2.4
2.6
2.8
3.0
0 5 10 15 20 25 30
BE
DK DE
EL
ES
FI
FRIE IT
MT
NL
ATPT
SE
UK
BG
CYCZ
EE
HU LVLT
LU
PL
RO
SKSI
TR*
Note: Pearson correlation coefficient = 0.37.*Poverty rate figures are from 2007, except that for Turkey, which is from 2003.Source: EQLS (2007)
However, this relationship is not as clear for many countries with similar levels of poverty risk, which, when compared, show quite considerable variations in levels of perceived social exclusion.
Microeconomicpredictorsofperceivedsocialexclusion
Levelofdeprivation
The EQLS contains information about the absence of a set of material items or social activities in the respondent’s household that are deemed essential by a majority of persons across the wide range of countries within the EU27. During the interview, the respondents were asked if their household can afford the list of following items:
• a home that is adequately warm;
• paying for a week’s annual holiday;
• replacing any worn-out furniture;
• a meal with meat, chicken or fish every second day;
• buying new rather than second-hand clothes;
• having friends or family visit for a drink or meal at least once a month.
From this list of items, it was possible to construct an indicator of deprivation distinguishing four categories of deprivation, as follows:
• a low level of deprivation – based on a score of zero for any of the six items;
• a second level of deprivation – based on a score of one for any of the six items;
• a third level of deprivation – based on a score of two or three for any of the six items;
• a high level of deprivation – based on a score of at least four out of the six items.
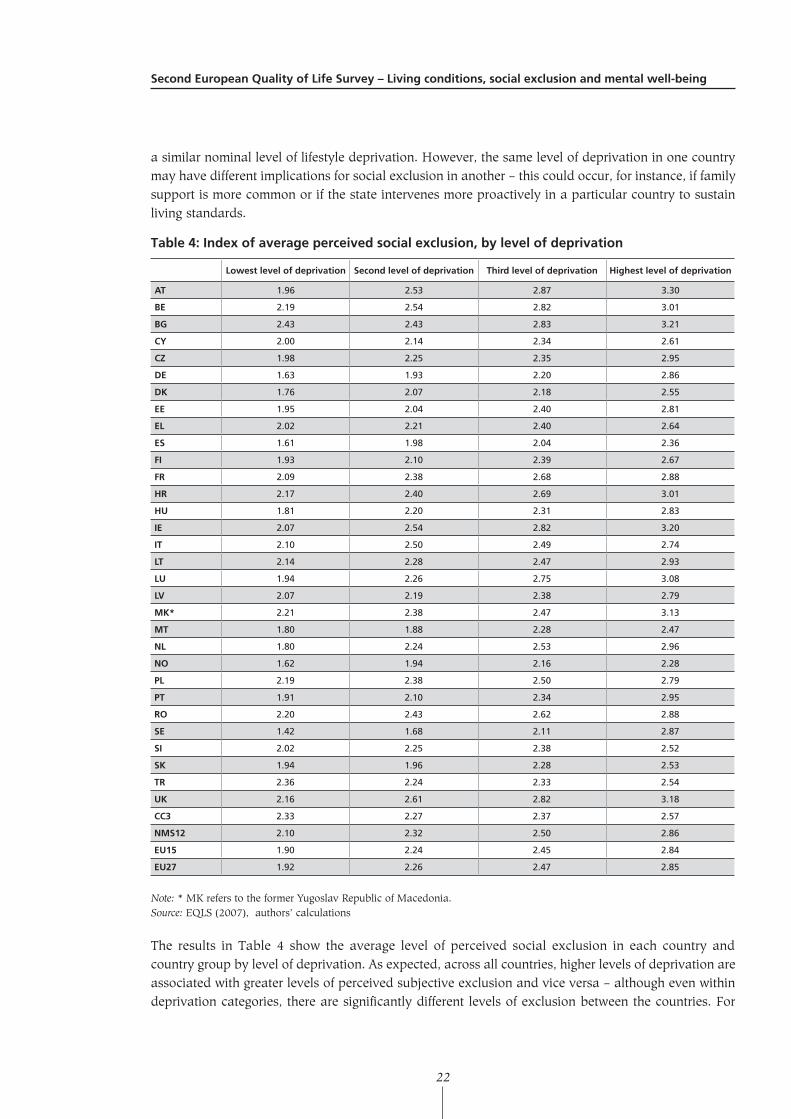
The specific issue of interest in this instance is the relationship between perceived social exclusion and material deprivation at the individual level. As the aforementioned deprivation scale is scored in exactly the same way across the countries, being in the same category should indicate the experience of
SecondEuropeanQualityofLifeSurvey–Livingconditions,socialexclusionandmentalwell-being
22
a similar nominal level of lifestyle deprivation. However, the same level of deprivation in one country may have different implications for social exclusion in another – this could occur, for instance, if family support is more common or if the state intervenes more proactively in a particular country to sustain living standards.
Table4:Indexofaverageperceivedsocialexclusion,bylevelofdeprivation
Lowestlevelofdeprivation Secondlevelofdeprivation Thirdlevelofdeprivation Highestlevelofdeprivation
AT 1.96 2.53 2.87 3.30
BE 2.19 2.54 2.82 3.01
BG 2.43 2.43 2.83 3.21
CY 2.00 2.14 2.34 2.61
CZ 1.98 2.25 2.35 2.95
DE 1.63 1.93 2.20 2.86
DK 1.76 2.07 2.18 2.55
EE 1.95 2.04 2.40 2.81
EL 2.02 2.21 2.40 2.64
ES 1.61 1.98 2.04 2.36
FI 1.93 2.10 2.39 2.67
FR 2.09 2.38 2.68 2.88
HR 2.17 2.40 2.69 3.01
HU 1.81 2.20 2.31 2.83
IE 2.07 2.54 2.82 3.20
IT 2.10 2.50 2.49 2.74
LT 2.14 2.28 2.47 2.93
LU 1.94 2.26 2.75 3.08
LV 2.07 2.19 2.38 2.79
MK* 2.21 2.38 2.47 3.13
MT 1.80 1.88 2.28 2.47
NL 1.80 2.24 2.53 2.96
NO 1.62 1.94 2.16 2.28
PL 2.19 2.38 2.50 2.79
PT 1.91 2.10 2.34 2.95
RO 2.20 2.43 2.62 2.88
SE 1.42 1.68 2.11 2.87
SI 2.02 2.25 2.38 2.52
SK 1.94 1.96 2.28 2.53
TR 2.36 2.24 2.33 2.54
UK 2.16 2.61 2.82 3.18
CC3 2.33 2.27 2.37 2.57
NMS12 2.10 2.32 2.50 2.86
EU15 1.90 2.24 2.45 2.84
EU27 1.92 2.26 2.47 2.85
Note: * MK refers to the former Yugoslav Republic of Macedonia.Source: EQLS (2007), authors’ calculations
The results in Table 4 show the average level of perceived social exclusion in each country and country group by level of deprivation. As expected, across all countries, higher levels of deprivation are associated with greater levels of perceived subjective exclusion and vice versa – although even within deprivation categories, there are significantly different levels of exclusion between the countries. For
Impactofsocialconditionsonperceivedsocialexclusion
23
example, at the lowest level of deprivation (a score of zero), EU15 countries such as Sweden (1.4), Spain (1.6) and Norway (1.6) experience lower levels of social exclusion compared with countries such as Turkey (2.4) and Bulgaria (2.4). Citizens of the CC3 countries have the highest level of social exclusion in the same category of deprivation. Meanwhile, the NMS12 countries, such as Slovenia (2.0) and Lithuania (2.1), have levels of social exclusion between those found in the EU15 and the CC3.
In relation to higher levels of deprivation, the pattern of social exclusion is more mixed between the EU15, NMS12 and CC3. In the lower social exclusion category, a mix can be found of EU15, NMS12 and CC3 countries, such as Norway (2.3), Slovenia (2.5) and Turkey (2.5). Within the group with the highest level of deprivation in each country, the CC3 country group appears to have the lowest level of perceived social exclusion, followed by the EU15 and NMS12 countries.
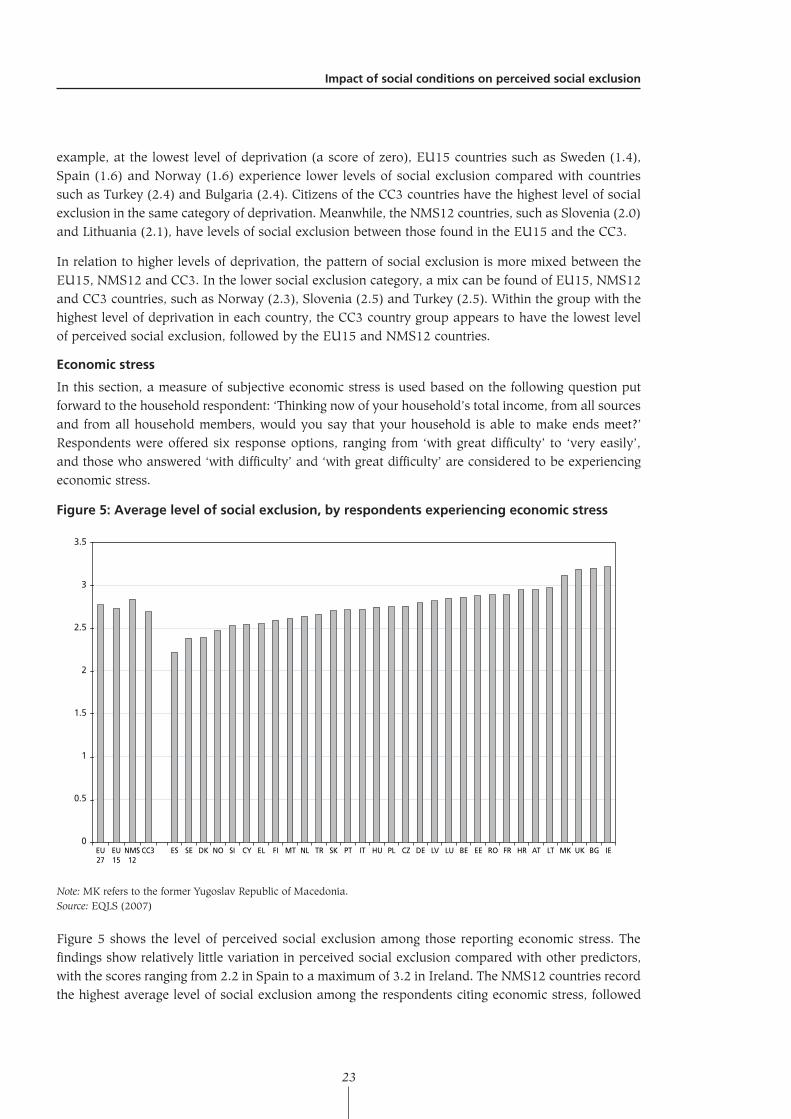
Economicstress
In this section, a measure of subjective economic stress is used based on the following question put forward to the household respondent: ‘Thinking now of your household’s total income, from all sources and from all household members, would you say that your household is able to make ends meet?’
Respondents were offered six response options, ranging from ‘with great difficulty’ to ‘very easily’, and those who answered ‘with difficulty’ and ‘with great difficulty’ are considered to be experiencing economic stress.
Figure5:Averagelevelofsocialexclusion,byrespondentsexperiencingeconomicstress
3.5
3
2.5
2
1.5
1
0.5
0IEBGUKMKLTATHRFRROEEBELULVDECZPLHUITPTSKTRNLMTFIELCYSINODKSEESCC3NMS
12EU15
EU27
Note: MK refers to the former Yugoslav Republic of Macedonia.Source: EQLS (2007)
Figure 5 shows the level of perceived social exclusion among those reporting economic stress. The findings show relatively little variation in perceived social exclusion compared with other predictors, with the scores ranging from 2.2 in Spain to a maximum of 3.2 in Ireland. The NMS12 countries record the highest average level of social exclusion among the respondents citing economic stress, followed
SecondEuropeanQualityofLifeSurvey–Livingconditions,socialexclusionandmentalwell-being
24
by the EU15 and CC3 countries. Nonetheless, the countries that make up the groupings are distributed quite evenly across the ranked countries in terms of economic stress.
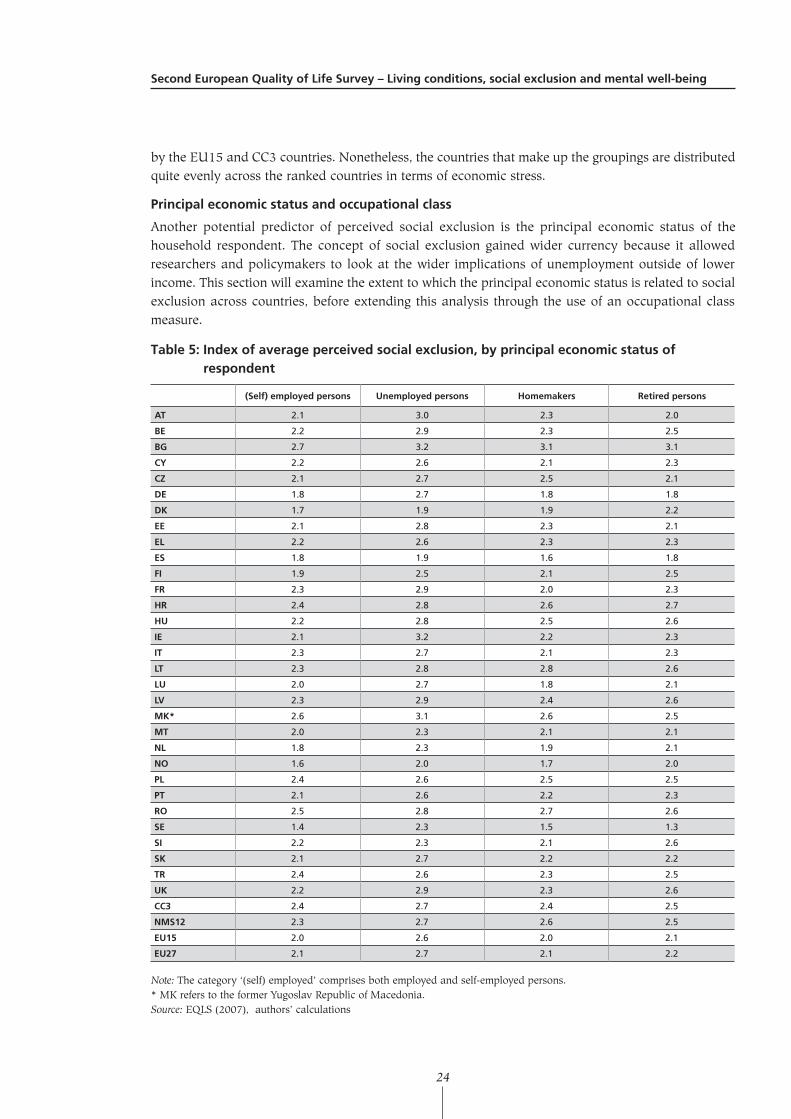
Principaleconomicstatusandoccupationalclass
Another potential predictor of perceived social exclusion is the principal economic status of the household respondent. The concept of social exclusion gained wider currency because it allowed researchers and policymakers to look at the wider implications of unemployment outside of lower income. This section will examine the extent to which the principal economic status is related to social exclusion across countries, before extending this analysis through the use of an occupational class measure.
Table5:Indexofaverageperceivedsocialexclusion,byprincipaleconomicstatusofrespondent
(Self)employedpersons Unemployedpersons Homemakers Retiredpersons
AT 2.1 3.0 2.3 2.0
BE 2.2 2.9 2.3 2.5
BG 2.7 3.2 3.1 3.1
CY 2.2 2.6 2.1 2.3
CZ 2.1 2.7 2.5 2.1
DE 1.8 2.7 1.8 1.8
DK 1.7 1.9 1.9 2.2
EE 2.1 2.8 2.3 2.1
EL 2.2 2.6 2.3 2.3
ES 1.8 1.9 1.6 1.8
FI 1.9 2.5 2.1 2.5
FR 2.3 2.9 2.0 2.3
HR 2.4 2.8 2.6 2.7
HU 2.2 2.8 2.5 2.6
IE 2.1 3.2 2.2 2.3
IT 2.3 2.7 2.1 2.3
LT 2.3 2.8 2.8 2.6
LU 2.0 2.7 1.8 2.1
LV 2.3 2.9 2.4 2.6
MK* 2.6 3.1 2.6 2.5
MT 2.0 2.3 2.1 2.1
NL 1.8 2.3 1.9 2.1
NO 1.6 2.0 1.7 2.0
PL 2.4 2.6 2.5 2.5
PT 2.1 2.6 2.2 2.3
RO 2.5 2.8 2.7 2.6
SE 1.4 2.3 1.5 1.3
SI 2.2 2.3 2.1 2.6
SK 2.1 2.7 2.2 2.2
TR 2.4 2.6 2.3 2.5
UK 2.2 2.9 2.3 2.6
CC3 2.4 2.7 2.4 2.5
NMS12 2.3 2.7 2.6 2.5
EU15 2.0 2.6 2.0 2.1
EU27 2.1 2.7 2.1 2.2
Note: The category ‘(self) employed’ comprises both employed and self-employed persons.* MK refers to the former Yugoslav Republic of Macedonia.Source: EQLS (2007), authors’ calculations
Impactofsocialconditionsonperceivedsocialexclusion
25
Table 5 shows the findings for the level of social exclusion by the principal economic status of the household respondent. Looking at the levels of social exclusion across the four categories of principal economic status and across all countries, it emerges that (self) employed people (encompassing both employed and self-employed persons) experience the lowest levels of social exclusion on average, while unemployed persons experience the highest. Homemakers and retired people are situated in between these two categories, showing similar levels of exclusion on average, although retired persons experience a slightly higher level of exclusion in a number of countries.
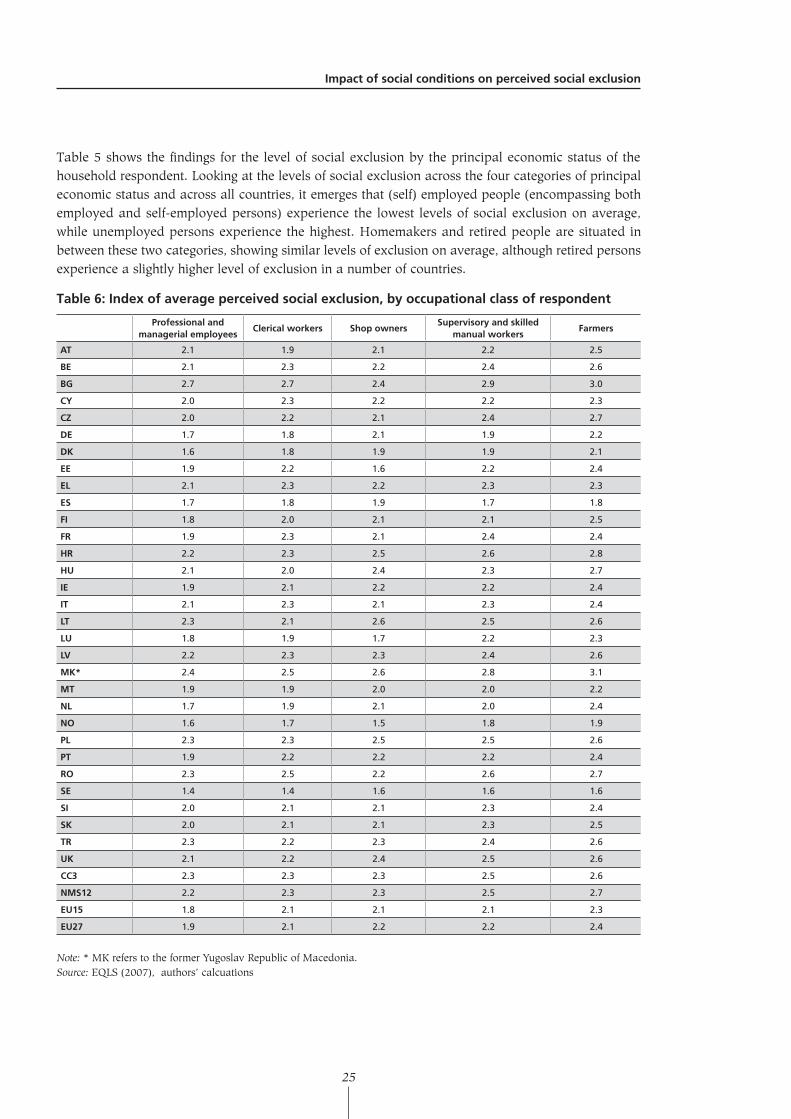
Table6:Indexofaverageperceivedsocialexclusion,byoccupationalclassofrespondent
Professionalandmanagerialemployees
Clericalworkers ShopownersSupervisoryandskilled
manualworkersFarmers
AT 2.1 1.9 2.1 2.2 2.5
BE 2.1 2.3 2.2 2.4 2.6
BG 2.7 2.7 2.4 2.9 3.0
CY 2.0 2.3 2.2 2.2 2.3
CZ 2.0 2.2 2.1 2.4 2.7
DE 1.7 1.8 2.1 1.9 2.2
DK 1.6 1.8 1.9 1.9 2.1
EE 1.9 2.2 1.6 2.2 2.4
EL 2.1 2.3 2.2 2.3 2.3
ES 1.7 1.8 1.9 1.7 1.8
FI 1.8 2.0 2.1 2.1 2.5
FR 1.9 2.3 2.1 2.4 2.4
HR 2.2 2.3 2.5 2.6 2.8
HU 2.1 2.0 2.4 2.3 2.7
IE 1.9 2.1 2.2 2.2 2.4
IT 2.1 2.3 2.1 2.3 2.4
LT 2.3 2.1 2.6 2.5 2.6
LU 1.8 1.9 1.7 2.2 2.3
LV 2.2 2.3 2.3 2.4 2.6
MK* 2.4 2.5 2.6 2.8 3.1
MT 1.9 1.9 2.0 2.0 2.2
NL 1.7 1.9 2.1 2.0 2.4
NO 1.6 1.7 1.5 1.8 1.9
PL 2.3 2.3 2.5 2.5 2.6
PT 1.9 2.2 2.2 2.2 2.4
RO 2.3 2.5 2.2 2.6 2.7
SE 1.4 1.4 1.6 1.6 1.6
SI 2.0 2.1 2.1 2.3 2.4
SK 2.0 2.1 2.1 2.3 2.5
TR 2.3 2.2 2.3 2.4 2.6
UK 2.1 2.2 2.4 2.5 2.6
CC3 2.3 2.3 2.3 2.5 2.6
NMS12 2.2 2.3 2.3 2.5 2.7
EU15 1.8 2.1 2.1 2.1 2.3
EU27 1.9 2.1 2.2 2.2 2.4
Note: * MK refers to the former Yugoslav Republic of Macedonia.Source: EQLS (2007), authors’ calcuations
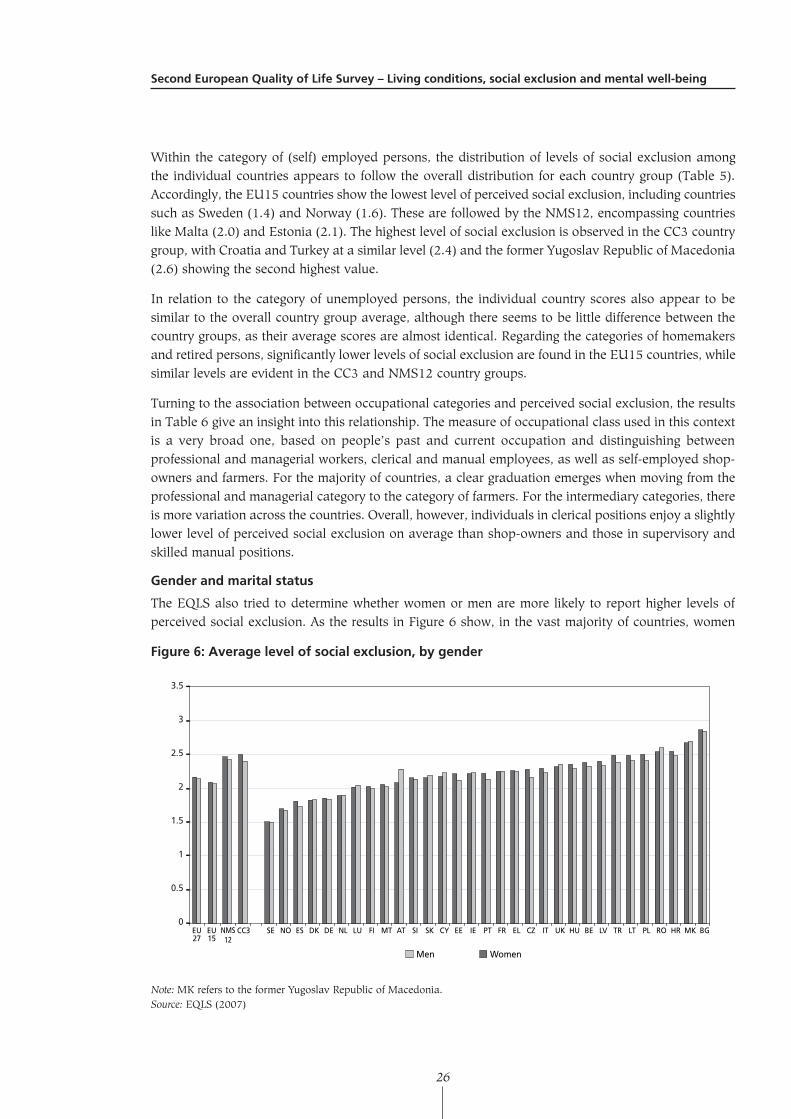
SecondEuropeanQualityofLifeSurvey–Livingconditions,socialexclusionandmentalwell-being
26
Within the category of (self) employed persons, the distribution of levels of social exclusion among the individual countries appears to follow the overall distribution for each country group (Table 5). Accordingly, the EU15 countries show the lowest level of perceived social exclusion, including countries such as Sweden (1.4) and Norway (1.6). These are followed by the NMS12, encompassing countries like Malta (2.0) and Estonia (2.1). The highest level of social exclusion is observed in the CC3 country group, with Croatia and Turkey at a similar level (2.4) and the former Yugoslav Republic of Macedonia (2.6) showing the second highest value.
In relation to the category of unemployed persons, the individual country scores also appear to be similar to the overall country group average, although there seems to be little difference between the country groups, as their average scores are almost identical. Regarding the categories of homemakers and retired persons, significantly lower levels of social exclusion are found in the EU15 countries, while similar levels are evident in the CC3 and NMS12 country groups.
Turning to the association between occupational categories and perceived social exclusion, the results in Table 6 give an insight into this relationship. The measure of occupational class used in this context is a very broad one, based on people’s past and current occupation and distinguishing between professional and managerial workers, clerical and manual employees, as well as self-employed shop-owners and farmers. For the majority of countries, a clear graduation emerges when moving from the professional and managerial category to the category of farmers. For the intermediary categories, there is more variation across the countries. Overall, however, individuals in clerical positions enjoy a slightly lower level of perceived social exclusion on average than shop-owners and those in supervisory and skilled manual positions.
Genderandmaritalstatus
The EQLS also tried to determine whether women or men are more likely to report higher levels of perceived social exclusion. As the results in Figure 6 show, in the vast majority of countries, women
Figure6:Averagelevelofsocialexclusion,bygender
3.5
3
2.5
2
1.5
1
0.5
0
R2 = 0.3451
Men Women
BGMKHRROPLLTTRLVBEHUUKITCZELFRPTIEEECYSKSIATMTFILUNLDEDKESNOSECC3NMS12
EU15
EU27
Note: MK refers to the former Yugoslav Republic of Macedonia.Source: EQLS (2007)
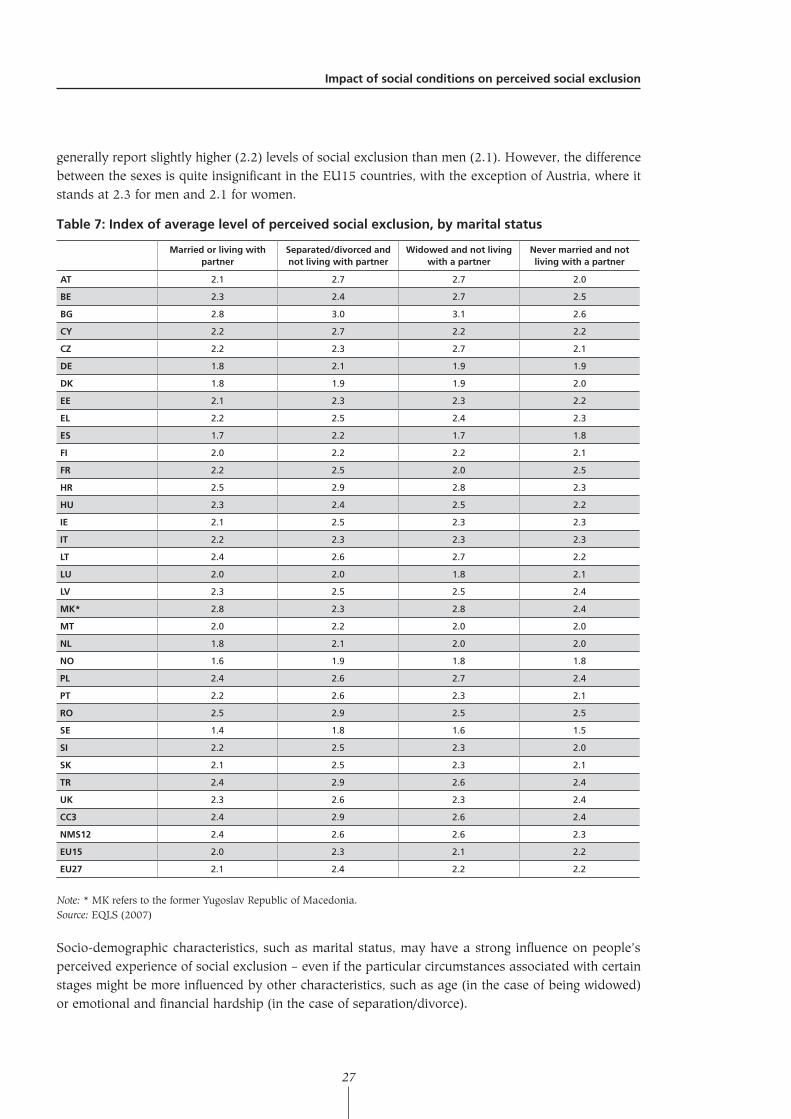
Impactofsocialconditionsonperceivedsocialexclusion
27
generally report slightly higher (2.2) levels of social exclusion than men (2.1). However, the difference between the sexes is quite insignificant in the EU15 countries, with the exception of Austria, where it stands at 2.3 for men and 2.1 for women.
Table7:Indexofaveragelevelofperceivedsocialexclusion,bymaritalstatus
Marriedorlivingwithpartner
Separated/divorcedandnotlivingwithpartner
Widowedandnotlivingwithapartner
Nevermarriedandnotlivingwithapartner
AT 2.1 2.7 2.7 2.0
BE 2.3 2.4 2.7 2.5
BG 2.8 3.0 3.1 2.6
CY 2.2 2.7 2.2 2.2
CZ 2.2 2.3 2.7 2.1
DE 1.8 2.1 1.9 1.9
DK 1.8 1.9 1.9 2.0
EE 2.1 2.3 2.3 2.2
EL 2.2 2.5 2.4 2.3
ES 1.7 2.2 1.7 1.8
FI 2.0 2.2 2.2 2.1
FR 2.2 2.5 2.0 2.5
HR 2.5 2.9 2.8 2.3
HU 2.3 2.4 2.5 2.2
IE 2.1 2.5 2.3 2.3
IT 2.2 2.3 2.3 2.3
LT 2.4 2.6 2.7 2.2
LU 2.0 2.0 1.8 2.1
LV 2.3 2.5 2.5 2.4
MK* 2.8 2.3 2.8 2.4
MT 2.0 2.2 2.0 2.0
NL 1.8 2.1 2.0 2.0
NO 1.6 1.9 1.8 1.8
PL 2.4 2.6 2.7 2.4
PT 2.2 2.6 2.3 2.1
RO 2.5 2.9 2.5 2.5
SE 1.4 1.8 1.6 1.5
SI 2.2 2.5 2.3 2.0
SK 2.1 2.5 2.3 2.1
TR 2.4 2.9 2.6 2.4
UK 2.3 2.6 2.3 2.4
CC3 2.4 2.9 2.6 2.4
NMS12 2.4 2.6 2.6 2.3
EU15 2.0 2.3 2.1 2.2
EU27 2.1 2.4 2.2 2.2
Note: * MK refers to the former Yugoslav Republic of Macedonia.Source: EQLS (2007)
Socio-demographic characteristics, such as marital status, may have a strong influence on people’s perceived experience of social exclusion – even if the particular circumstances associated with certain stages might be more influenced by other characteristics, such as age (in the case of being widowed) or emotional and financial hardship (in the case of separation/divorce).
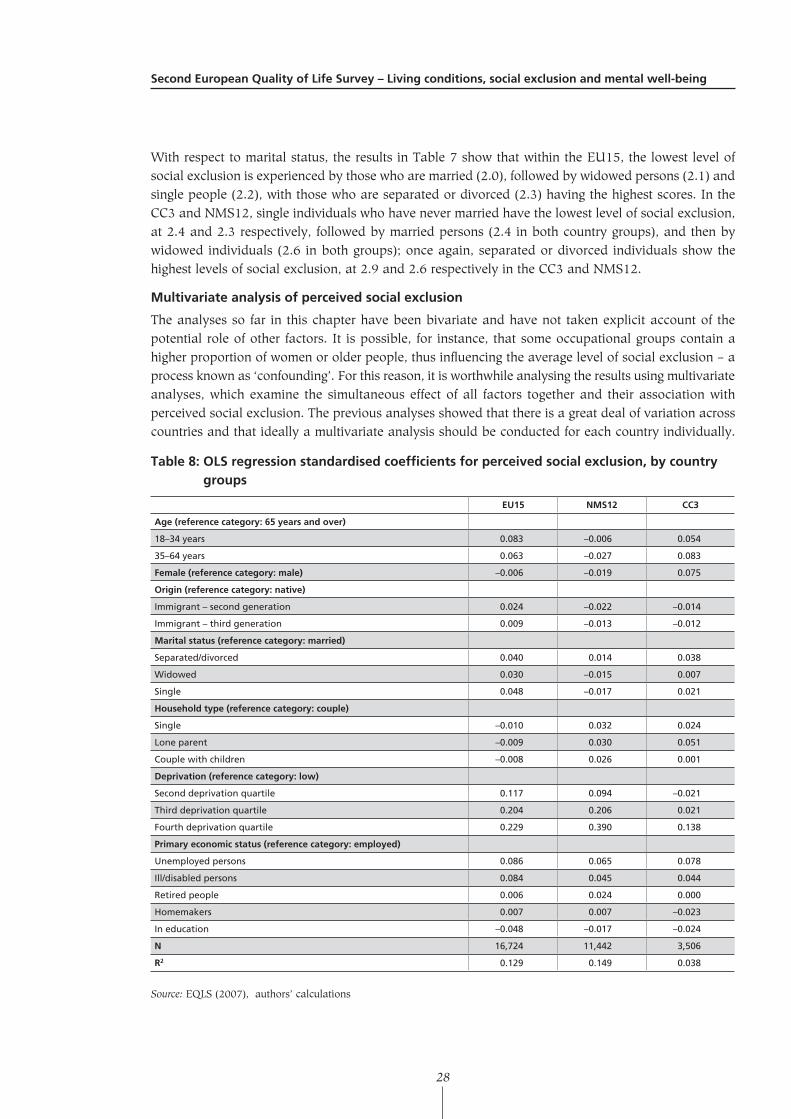
SecondEuropeanQualityofLifeSurvey–Livingconditions,socialexclusionandmentalwell-being
28
With respect to marital status, the results in Table 7 show that within the EU15, the lowest level of social exclusion is experienced by those who are married (2.0), followed by widowed persons (2.1) and single people (2.2), with those who are separated or divorced (2.3) having the highest scores. In the CC3 and NMS12, single individuals who have never married have the lowest level of social exclusion, at 2.4 and 2.3 respectively, followed by married persons (2.4 in both country groups), and then by widowed individuals (2.6 in both groups); once again, separated or divorced individuals show the highest levels of social exclusion, at 2.9 and 2.6 respectively in the CC3 and NMS12.
Multivariateanalysisofperceivedsocialexclusion
The analyses so far in this chapter have been bivariate and have not taken explicit account of the potential role of other factors. It is possible, for instance, that some occupational groups contain a higher proportion of women or older people, thus influencing the average level of social exclusion – a process known as ‘confounding’. For this reason, it is worthwhile analysing the results using multivariate analyses, which examine the simultaneous effect of all factors together and their association with perceived social exclusion. The previous analyses showed that there is a great deal of variation across countries and that ideally a multivariate analysis should be conducted for each country individually.
Table8:OLSregressionstandardisedcoefficientsforperceivedsocialexclusion,bycountrygroups
EU15 NMS12 CC3
Age(referencecategory:65yearsandover)
18–34 years 0.083 –0.006 0.054
35–64 years 0.063 –0.027 0.083
Female(referencecategory:male) –0.006 –0.019 0.075
Origin(referencecategory:native)
Immigrant – second generation 0.024 –0.022 –0.014
Immigrant – third generation 0.009 –0.013 –0.012
Maritalstatus(referencecategory:married)
Separated/divorced 0.040 0.014 0.038
Widowed 0.030 –0.015 0.007
Single 0.048 –0.017 0.021
Householdtype(referencecategory:couple)
Single –0.010 0.032 0.024
Lone parent –0.009 0.030 0.051
Couple with children –0.008 0.026 0.001
Deprivation(referencecategory:low)
Second deprivation quartile 0.117 0.094 –0.021
Third deprivation quartile 0.204 0.206 0.021
Fourth deprivation quartile 0.229 0.390 0.138
Primaryeconomicstatus(referencecategory:employed)
Unemployed persons 0.086 0.065 0.078
Ill/disabled persons 0.084 0.045 0.044
Retired people 0.006 0.024 0.000
Homemakers 0.007 0.007 –0.023
In education –0.048 –0.017 –0.024
N 16,724 11,442 3,506
R2 0.129 0.149 0.038
Source: EQLS (2007), authors’ calculations
Impactofsocialconditionsonperceivedsocialexclusion
29
However, given the large number of countries in the EQLS, this would be very difficult to present. For this reason, this analysis is restricted to the EU15, NMS12 and CC3 country groups. Table 8 presents the results from these three OLS (ordinary least squares) regressions as standardised coefficients. In this case, the dependent variable is the perception of social exclusion, while the independent variables are the individual socio-demographic and socioeconomic characteristics.
Across the country groups, the results show that the experience of deprivation has a powerful influence. In other words, those with higher levels of deprivation also show higher levels of perceived social exclusion, even controlling for other factors such as gender and age. The effect of deprivation varies across country groups; however, the level of deprivation is weakest in the CC3 countries, although the experience of deprivation is more common in these countries. These two facts may well be linked, with deprivation being a less pronounced determinant of exclusion where it is more common.
Turning to the effect of principal economic status, being unemployed or ill/disabled is associated with higher levels of social exclusion across the country groups. The effect of unemployment is quite similar across groups, whereas being ill/disabled has a far greater impact in the EU15 than in the CC3 or NMS12. Once controlling for age and gender, retirement and full-time caring have substantially lower effects.
The results also show that respondents in the two oldest age groups are more likely to experience social exclusion than those in the youngest age group, albeit not in the NMS12 countries. The difference for NMS12 citizens is repeated with respect to marital status. In the EU15 and CC3, separated/divorced, widowed and single people experience higher levels of social exclusion, whereas in the NMS12 those who are widowed or single report a lower level of exclusion. These effects are rather small. As seen in the descriptive results, there are no gender differences in the explanation of social exclusion.
Conclusions
This chapter has examined one of the main determinants of social integration – the person’s or household’s level of economic resources and living conditions. This factor was examined using both macro and micro-level analysis. The results firstly showed that a global economic environment with favourable macroeconomic indicators – such as a high GDP, low unemployment and a low rate of citizens being at risk of poverty – contribute to lower average levels of perceived social exclusion in a society, although there were clearly many other factors involved. The impact of individual characteristics was also examined, with a particular focus in this chapter on people’s social conditions.
Looking firstly at material conditions and their influence on perceived social exclusion, it was found that higher levels of lifestyle deprivation tended to be associated with higher levels of perceived social exclusion. Nonetheless, within any given level of deprivation, countries from the EU15 – such as Denmark, Spain and Sweden – had lower perceived social exclusion than the NMS12 and CC3 countries. This is likely to reflect the fact that these countries have compensating institutions or structures that tend to mitigate the impact of deprivation.
Across all the other measures of living conditions examined, similar patterns are found, with those in less advantaged positions experiencing higher levels of perceived social exclusion. However, the determinants of social integration are not purely financial, and it was clear that a person’s economic status and occupational class had a major bearing. A common feature across all the countries was
SecondEuropeanQualityofLifeSurvey–Livingconditions,socialexclusionandmentalwell-being
30
that employed or self-employed persons reported lower levels of social exclusion compared with unemployed people – a difference that remains even controlling for the level of lifestyle deprivation. This would suggest, as found in a range of studies, that unemployment tends to increase social exclusion and participation in society as a whole, as well as lowering levels of resources.
31
4Social support, living conditions and perceived social exclusion
Introduction
The previous chapter presented a large amount of evidence from the EQLS on the relationship between living conditions and perceived social exclusion. Across the 31 countries under consideration, people who report experiencing lifestyle deprivation – that is, the inability to afford everyday items or activities – are also more likely to report higher levels of social exclusion. In the EU15, people experiencing the highest level of deprivation show levels of social exclusion that are 50% greater than those in the lowest deprivation category. However, the link between poor living conditions and social exclusion may not be direct. Research has shown, for instance, that other factors can intervene to moderate the relationship. Perhaps the most important of these factors is social support, which is the subject of this chapter.
The concept of social support has been used extensively in sociology and psychology. Often, it is of interest in its own right as a measure of the function and quality of social relationships within which the individual is embedded. However, it also forms a crucial part of the ‘buffer’ hypothesis (Whelan, 1992), whereby social support moderates the relationship between stressful life events, such as low income and deprivation, and their impact on the social, physical or psychological well-being of the individual. Although there is no agreed definition of social support within academic literature, it is often taken to refer to the resources provided by others – either in the form of coping assistance or as an exchange of resources (Pichler and Wallace, 2007). The level of social support available to individuals has been shown to vary systematically by individual characteristics such as age and sex. Moreover, low income and detachment from the labour force can also decrease the level of support available (Gallie and Paugam, 2000). Social support may thus moderate the impact of poor living conditions, but it can also be damaged by them. The average level of social support also varies across countries and groups of countries. Pichler and Wallace (2007), for example, show that social support in terms of the proportion of people getting or giving moral and financial support is highest in the Nordic and north-west European countries and lowest in the southern and Baltic countries.
The EQLS survey provides data on two different dimensions of social support, namely the:
• individual’s expectations about the availability of support from different sources in different circumstances (Q.35a–e);
• concrete experience of giving or receiving material support (Q.62 and Q.63).
Perceivedavailabilityoffinancialandmoralsupport
The first set of questions in the EQLS asks respondents the following: ‘from whom would you get support in each of the following situations?’ Two of the options given were: ‘if you were feeling a bit depressed or wanted someone to talk to’ or ‘if you needed to urgently raise €1,000 to face an emergency’. These questions clearly seek to gauge the core dimensions of social support – that is, the availability of moral or coping assistance or the provision of resources. The response categories allow the respondents to choose from a range of groups, including close family members (partner or other family member), work colleagues or friends; an additional category of ‘no one’ is also provided. The differentiation between family, colleagues and the wider circle of friends is important as an indicator of the social exchange in people’s lives – in particular, the sets of expectations they have about different people in their social network and the extent that these can or should be called upon in different circumstances. The last category – ‘no one’ – is important as an indicator of very poor availability of social support.
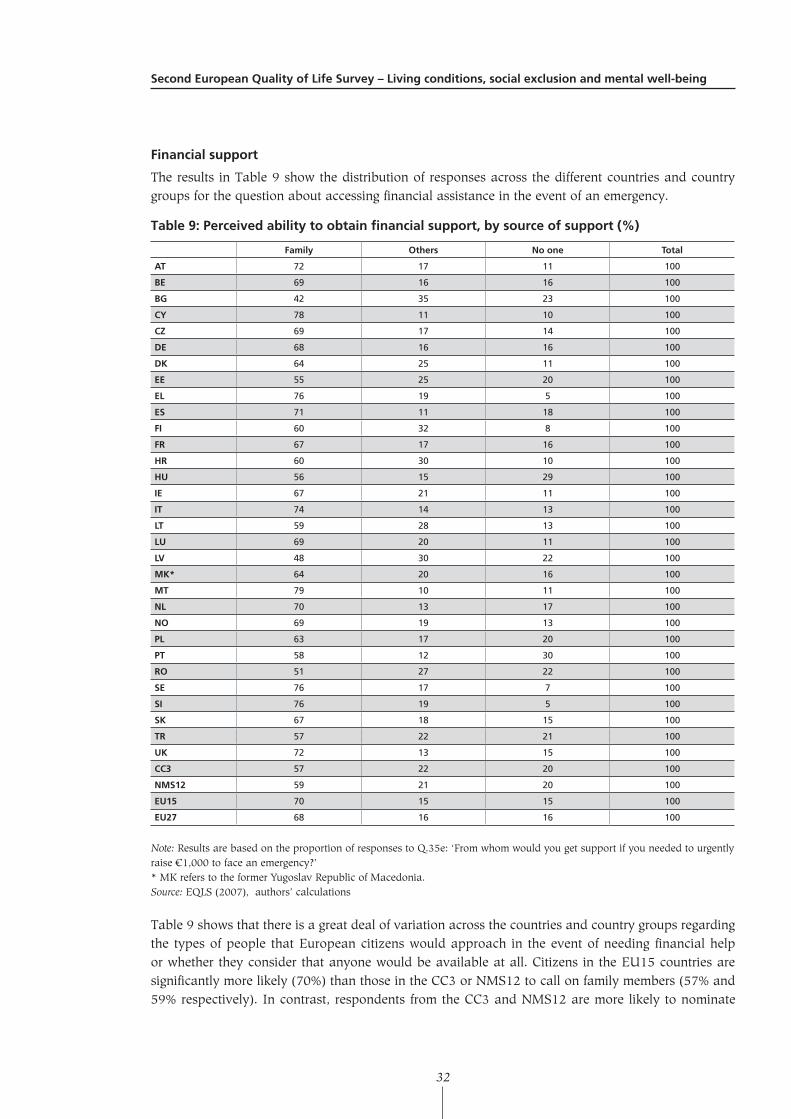
SecondEuropeanQualityofLifeSurvey–Livingconditions,socialexclusionandmentalwell-being
32
Financialsupport
The results in Table 9 show the distribution of responses across the different countries and country groups for the question about accessing financial assistance in the event of an emergency.
Table9:Perceivedabilitytoobtainfinancialsupport,bysourceofsupport(%)
Family Others Noone Total
AT 72 17 11 100
BE 69 16 16 100
BG 42 35 23 100
CY 78 11 10 100
CZ 69 17 14 100
DE 68 16 16 100
DK 64 25 11 100
EE 55 25 20 100
EL 76 19 5 100
ES 71 11 18 100
FI 60 32 8 100
FR 67 17 16 100
HR 60 30 10 100
HU 56 15 29 100
IE 67 21 11 100
IT 74 14 13 100
LT 59 28 13 100
LU 69 20 11 100
LV 48 30 22 100
MK* 64 20 16 100
MT 79 10 11 100
NL 70 13 17 100
NO 69 19 13 100
PL 63 17 20 100
PT 58 12 30 100
RO 51 27 22 100
SE 76 17 7 100
SI 76 19 5 100
SK 67 18 15 100
TR 57 22 21 100
UK 72 13 15 100
CC3 57 22 20 100
NMS12 59 21 20 100
EU15 70 15 15 100
EU27 68 16 16 100
Note: Results are based on the proportion of responses to Q.35e: ‘From whom would you get support if you needed to urgently raise €1,000 to face an emergency?’ * MK refers to the former Yugoslav Republic of Macedonia.Source: EQLS (2007), authors’ calculations
Table 9 shows that there is a great deal of variation across the countries and country groups regarding the types of people that European citizens would approach in the event of needing financial help or whether they consider that anyone would be available at all. Citizens in the EU15 countries are significantly more likely (70%) than those in the CC3 or NMS12 to call on family members (57% and 59% respectively). In contrast, respondents from the CC3 and NMS12 are more likely to nominate
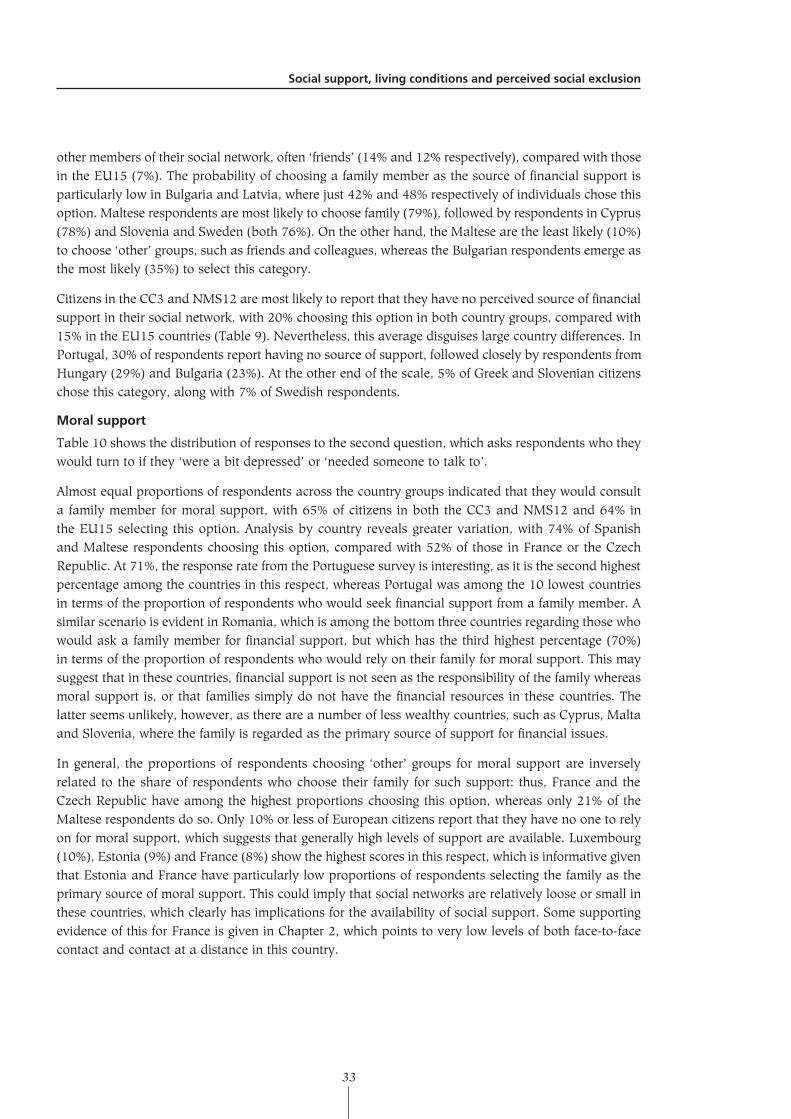
Socialsupport,livingconditionsandperceivedsocialexclusion
33
other members of their social network, often ‘friends’ (14% and 12% respectively), compared with those in the EU15 (7%). The probability of choosing a family member as the source of financial support is particularly low in Bulgaria and Latvia, where just 42% and 48% respectively of individuals chose this option. Maltese respondents are most likely to choose family (79%), followed by respondents in Cyprus (78%) and Slovenia and Sweden (both 76%). On the other hand, the Maltese are the least likely (10%) to choose ‘other’ groups, such as friends and colleagues, whereas the Bulgarian respondents emerge as the most likely (35%) to select this category.
Citizens in the CC3 and NMS12 are most likely to report that they have no perceived source of financial support in their social network, with 20% choosing this option in both country groups, compared with 15% in the EU15 countries (Table 9). Nevertheless, this average disguises large country differences. In Portugal, 30% of respondents report having no source of support, followed closely by respondents from Hungary (29%) and Bulgaria (23%). At the other end of the scale, 5% of Greek and Slovenian citizens chose this category, along with 7% of Swedish respondents.
Moralsupport
Table 10 shows the distribution of responses to the second question, which asks respondents who they would turn to if they ‘were a bit depressed’ or ‘needed someone to talk to’.
Almost equal proportions of respondents across the country groups indicated that they would consult a family member for moral support, with 65% of citizens in both the CC3 and NMS12 and 64% in the EU15 selecting this option. Analysis by country reveals greater variation, with 74% of Spanish and Maltese respondents choosing this option, compared with 52% of those in France or the Czech Republic. At 71%, the response rate from the Portuguese survey is interesting, as it is the second highest percentage among the countries in this respect, whereas Portugal was among the 10 lowest countries in terms of the proportion of respondents who would seek financial support from a family member. A similar scenario is evident in Romania, which is among the bottom three countries regarding those who would ask a family member for financial support, but which has the third highest percentage (70%) in terms of the proportion of respondents who would rely on their family for moral support. This may suggest that in these countries, financial support is not seen as the responsibility of the family whereas moral support is, or that families simply do not have the financial resources in these countries. The latter seems unlikely, however, as there are a number of less wealthy countries, such as Cyprus, Malta and Slovenia, where the family is regarded as the primary source of support for financial issues.
In general, the proportions of respondents choosing ‘other’ groups for moral support are inversely related to the share of respondents who choose their family for such support: thus, France and the Czech Republic have among the highest proportions choosing this option, whereas only 21% of the Maltese respondents do so. Only 10% or less of European citizens report that they have no one to rely on for moral support, which suggests that generally high levels of support are available. Luxembourg (10%), Estonia (9%) and France (8%) show the highest scores in this respect, which is informative given that Estonia and France have particularly low proportions of respondents selecting the family as the primary source of moral support. This could imply that social networks are relatively loose or small in these countries, which clearly has implications for the availability of social support. Some supporting evidence of this for France is given in Chapter 2, which points to very low levels of both face-to-face contact and contact at a distance in this country.
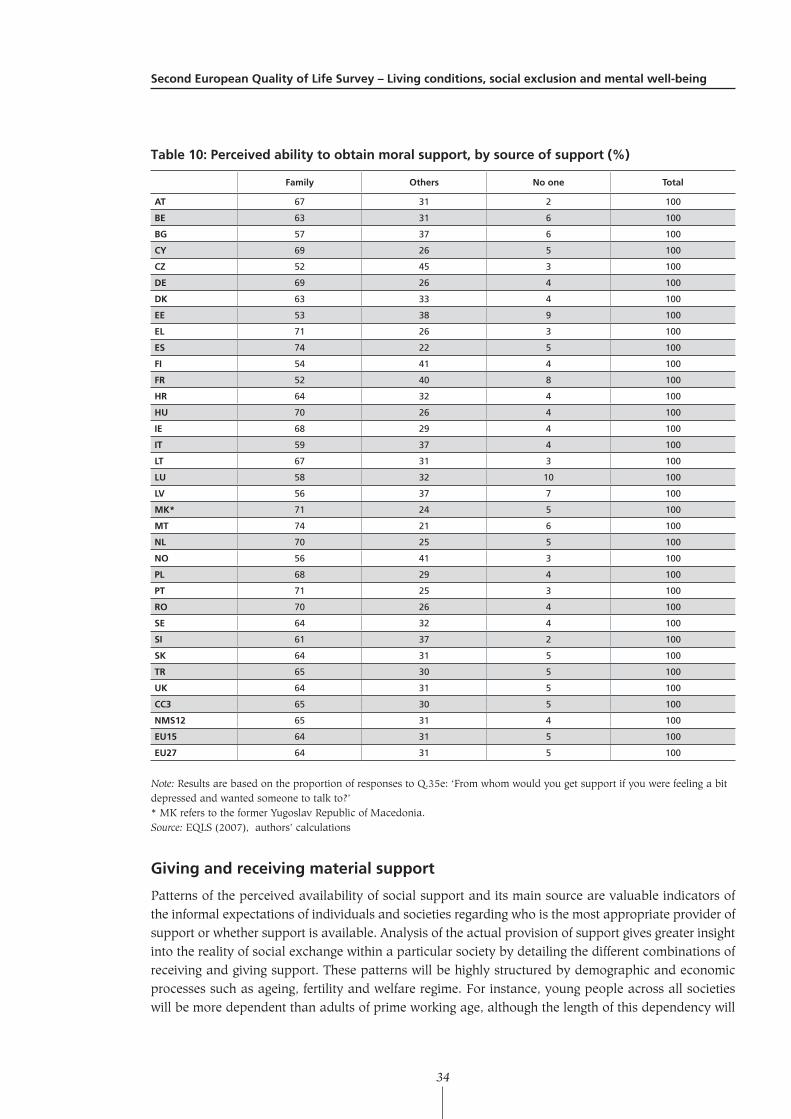
SecondEuropeanQualityofLifeSurvey–Livingconditions,socialexclusionandmentalwell-being
34
Table10:Perceivedabilitytoobtainmoralsupport,bysourceofsupport(%)
Family Others Noone Total
AT 67 31 2 100
BE 63 31 6 100
BG 57 37 6 100
CY 69 26 5 100
CZ 52 45 3 100
DE 69 26 4 100
DK 63 33 4 100
EE 53 38 9 100
EL 71 26 3 100
ES 74 22 5 100
FI 54 41 4 100
FR 52 40 8 100
HR 64 32 4 100
HU 70 26 4 100
IE 68 29 4 100
IT 59 37 4 100
LT 67 31 3 100
LU 58 32 10 100
LV 56 37 7 100
MK* 71 24 5 100
MT 74 21 6 100
NL 70 25 5 100
NO 56 41 3 100
PL 68 29 4 100
PT 71 25 3 100
RO 70 26 4 100
SE 64 32 4 100
SI 61 37 2 100
SK 64 31 5 100
TR 65 30 5 100
UK 64 31 5 100
CC3 65 30 5 100
NMS12 65 31 4 100
EU15 64 31 5 100
EU27 64 31 5 100
Note: Results are based on the proportion of responses to Q.35e: ‘From whom would you get support if you were feeling a bit depressed and wanted someone to talk to?’* MK refers to the former Yugoslav Republic of Macedonia.Source: EQLS (2007), authors’ calculations
Givingandreceivingmaterialsupport
Patterns of the perceived availability of social support and its main source are valuable indicators of the informal expectations of individuals and societies regarding who is the most appropriate provider of support or whether support is available. Analysis of the actual provision of support gives greater insight into the reality of social exchange within a particular society by detailing the different combinations of receiving and giving support. These patterns will be highly structured by demographic and economic processes such as ageing, fertility and welfare regime. For instance, young people across all societies will be more dependent than adults of prime working age, although the length of this dependency will
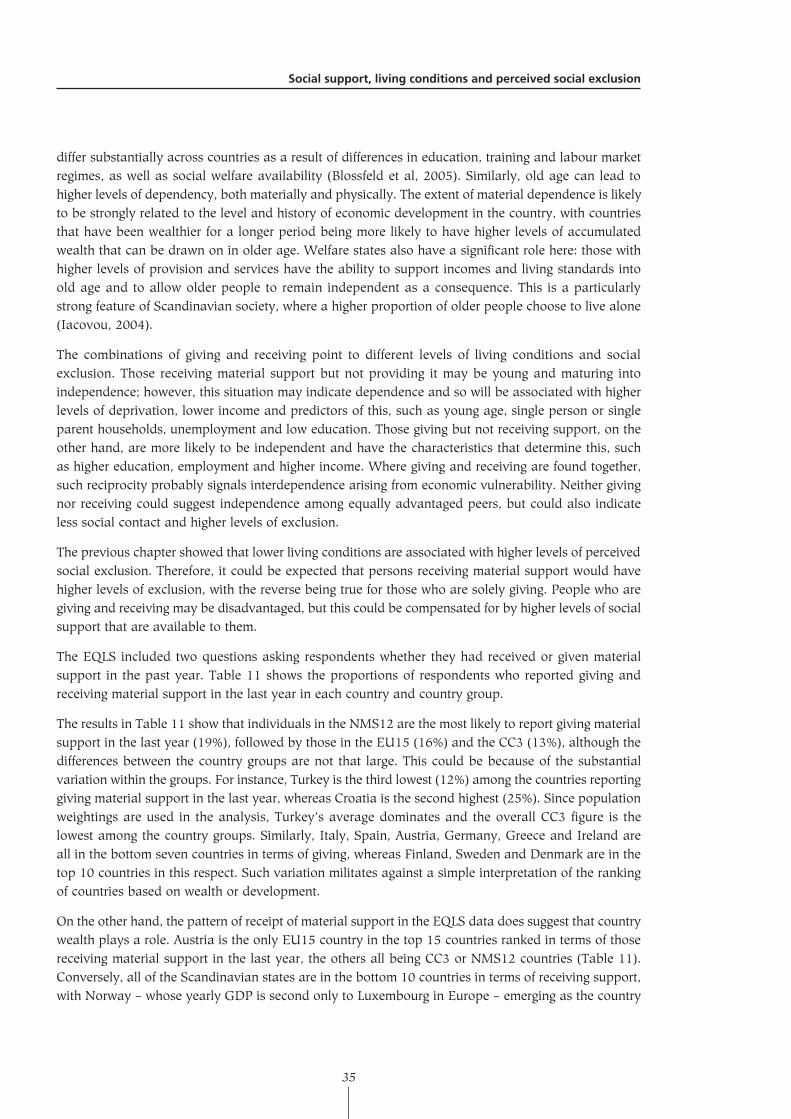
Socialsupport,livingconditionsandperceivedsocialexclusion
35
differ substantially across countries as a result of differences in education, training and labour market regimes, as well as social welfare availability (Blossfeld et al, 2005). Similarly, old age can lead to higher levels of dependency, both materially and physically. The extent of material dependence is likely to be strongly related to the level and history of economic development in the country, with countries that have been wealthier for a longer period being more likely to have higher levels of accumulated wealth that can be drawn on in older age. Welfare states also have a significant role here: those with higher levels of provision and services have the ability to support incomes and living standards into old age and to allow older people to remain independent as a consequence. This is a particularly strong feature of Scandinavian society, where a higher proportion of older people choose to live alone (Iacovou, 2004).
The combinations of giving and receiving point to different levels of living conditions and social exclusion. Those receiving material support but not providing it may be young and maturing into independence; however, this situation may indicate dependence and so will be associated with higher levels of deprivation, lower income and predictors of this, such as young age, single person or single parent households, unemployment and low education. Those giving but not receiving support, on the other hand, are more likely to be independent and have the characteristics that determine this, such as higher education, employment and higher income. Where giving and receiving are found together, such reciprocity probably signals interdependence arising from economic vulnerability. Neither giving nor receiving could suggest independence among equally advantaged peers, but could also indicate less social contact and higher levels of exclusion.
The previous chapter showed that lower living conditions are associated with higher levels of perceived social exclusion. Therefore, it could be expected that persons receiving material support would have higher levels of exclusion, with the reverse being true for those who are solely giving. People who are giving and receiving may be disadvantaged, but this could be compensated for by higher levels of social support that are available to them.
The EQLS included two questions asking respondents whether they had received or given material support in the past year. Table 11 shows the proportions of respondents who reported giving and receiving material support in the last year in each country and country group.
The results in Table 11 show that individuals in the NMS12 are the most likely to report giving material support in the last year (19%), followed by those in the EU15 (16%) and the CC3 (13%), although the differences between the country groups are not that large. This could be because of the substantial variation within the groups. For instance, Turkey is the third lowest (12%) among the countries reporting giving material support in the last year, whereas Croatia is the second highest (25%). Since population weightings are used in the analysis, Turkey’s average dominates and the overall CC3 figure is the lowest among the country groups. Similarly, Italy, Spain, Austria, Germany, Greece and Ireland are all in the bottom seven countries in terms of giving, whereas Finland, Sweden and Denmark are in the top 10 countries in this respect. Such variation militates against a simple interpretation of the ranking of countries based on wealth or development.
On the other hand, the pattern of receipt of material support in the EQLS data does suggest that country wealth plays a role. Austria is the only EU15 country in the top 15 countries ranked in terms of those receiving material support in the last year, the others all being CC3 or NMS12 countries (Table 11). Conversely, all of the Scandinavian states are in the bottom 10 countries in terms of receiving support, with Norway – whose yearly GDP is second only to Luxembourg in Europe – emerging as the country
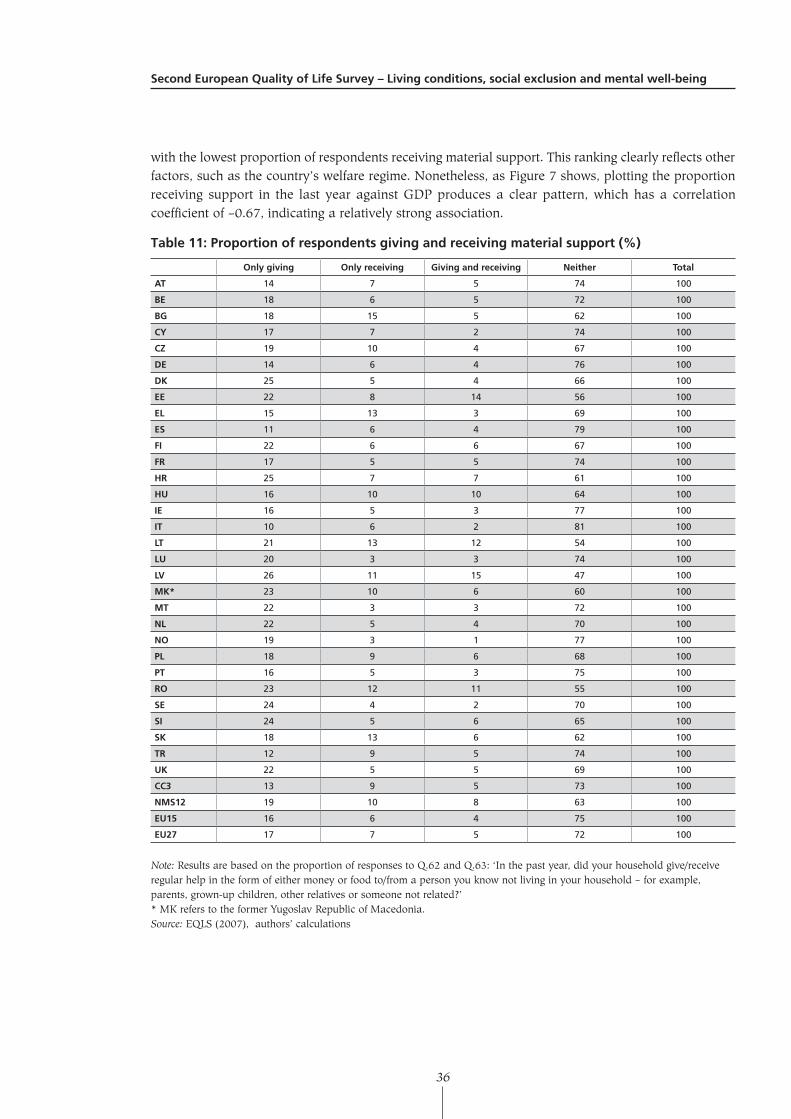
SecondEuropeanQualityofLifeSurvey–Livingconditions,socialexclusionandmentalwell-being
36
with the lowest proportion of respondents receiving material support. This ranking clearly reflects other factors, such as the country’s welfare regime. Nonetheless, as Figure 7 shows, plotting the proportion receiving support in the last year against GDP produces a clear pattern, which has a correlation coefficient of –0.67, indicating a relatively strong association.
Table11:Proportionofrespondentsgivingandreceivingmaterialsupport(%)
Onlygiving Onlyreceiving Givingandreceiving Neither Total
AT 14 7 5 74 100
BE 18 6 5 72 100
BG 18 15 5 62 100
CY 17 7 2 74 100
CZ 19 10 4 67 100
DE 14 6 4 76 100
DK 25 5 4 66 100
EE 22 8 14 56 100
EL 15 13 3 69 100
ES 11 6 4 79 100
FI 22 6 6 67 100
FR 17 5 5 74 100
HR 25 7 7 61 100
HU 16 10 10 64 100
IE 16 5 3 77 100
IT 10 6 2 81 100
LT 21 13 12 54 100
LU 20 3 3 74 100
LV 26 11 15 47 100
MK* 23 10 6 60 100
MT 22 3 3 72 100
NL 22 5 4 70 100
NO 19 3 1 77 100
PL 18 9 6 68 100
PT 16 5 3 75 100
RO 23 12 11 55 100
SE 24 4 2 70 100
SI 24 5 6 65 100
SK 18 13 6 62 100
TR 12 9 5 74 100
UK 22 5 5 69 100
CC3 13 9 5 73 100
NMS12 19 10 8 63 100
EU15 16 6 4 75 100
EU27 17 7 5 72 100
Note: Results are based on the proportion of responses to Q.62 and Q.63: ‘In the past year, did your household give/receive regular help in the form of either money or food to/from a person you know not living in your household – for example, parents, grown-up children, other relatives or someone not related?’ * MK refers to the former Yugoslav Republic of Macedonia.Source: EQLS (2007), authors’ calculations
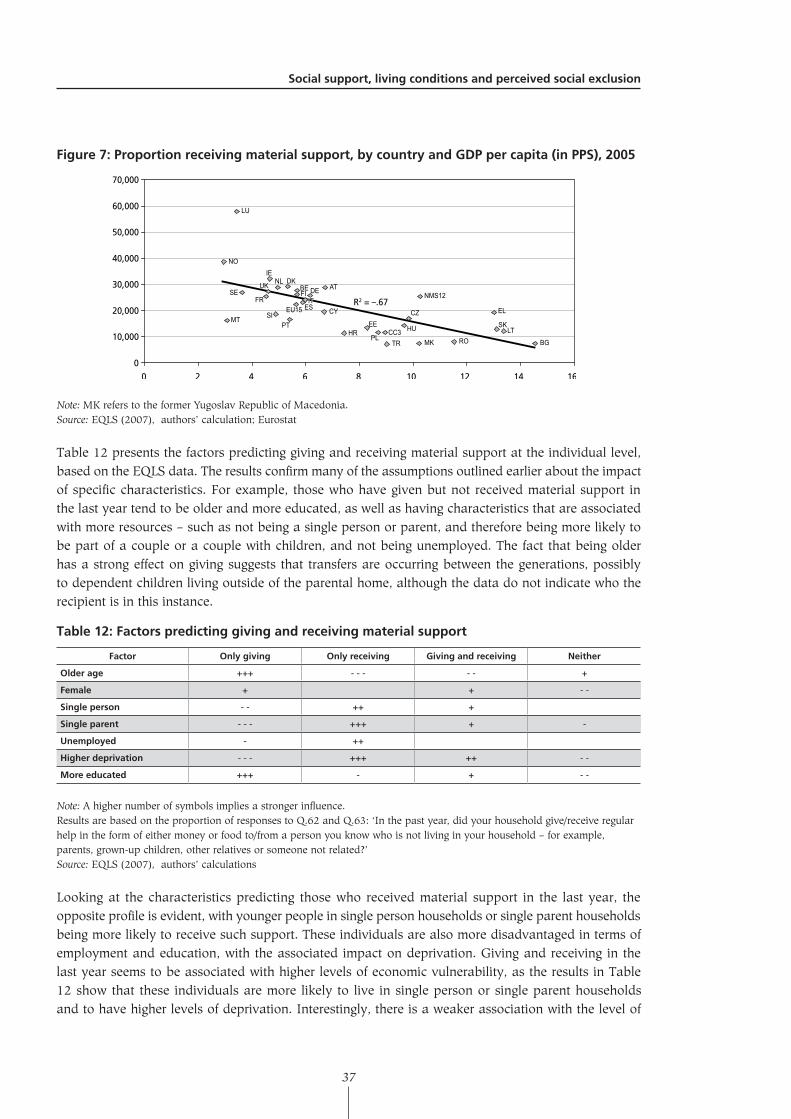
Socialsupport,livingconditionsandperceivedsocialexclusion
37
Figure7:Proportionreceivingmaterialsupport,bycountryandGDPpercapita(inPPS),2005
0
10,000
20,000
30,000
40,000
50,000
60,000
70,000
0 2 4 6 8 10 12 14 16
R2 = –.67ITITES
TR
CC3
ATDE
EL
IE
EU15
PT HU
FR
CY
PL
BE
BG
SK
NO
CZ
NMS12
LU
LTEE
NLUK
FI
MT
ROMK
SE
SI
HR
DK
Note: MK refers to the former Yugoslav Republic of Macedonia.Source: EQLS (2007), authors’ calculation; Eurostat
Table 12 presents the factors predicting giving and receiving material support at the individual level, based on the EQLS data. The results confirm many of the assumptions outlined earlier about the impact of specific characteristics. For example, those who have given but not received material support in the last year tend to be older and more educated, as well as having characteristics that are associated with more resources – such as not being a single person or parent, and therefore being more likely to be part of a couple or a couple with children, and not being unemployed. The fact that being older has a strong effect on giving suggests that transfers are occurring between the generations, possibly to dependent children living outside of the parental home, although the data do not indicate who the recipient is in this instance.
Table12:Factorspredictinggivingandreceivingmaterialsupport
Factor Onlygiving Onlyreceiving Givingandreceiving Neither
Olderage +++ - - - - - +
Female + + - -
Singleperson - - ++ +
Singleparent - - - +++ + -
Unemployed - ++
Higherdeprivation - - - +++ ++ - -
Moreeducated +++ - + - -
Note: A higher number of symbols implies a stronger influence. Results are based on the proportion of responses to Q.62 and Q.63: ‘In the past year, did your household give/receive regular help in the form of either money or food to/from a person you know who is not living in your household – for example, parents, grown-up children, other relatives or someone not related?’ Source: EQLS (2007), authors’ calculations
Looking at the characteristics predicting those who received material support in the last year, the opposite profile is evident, with younger people in single person households or single parent households being more likely to receive such support. These individuals are also more disadvantaged in terms of employment and education, with the associated impact on deprivation. Giving and receiving in the last year seems to be associated with higher levels of economic vulnerability, as the results in Table 12 show that these individuals are more likely to live in single person or single parent households and to have higher levels of deprivation. Interestingly, there is a weaker association with the level of
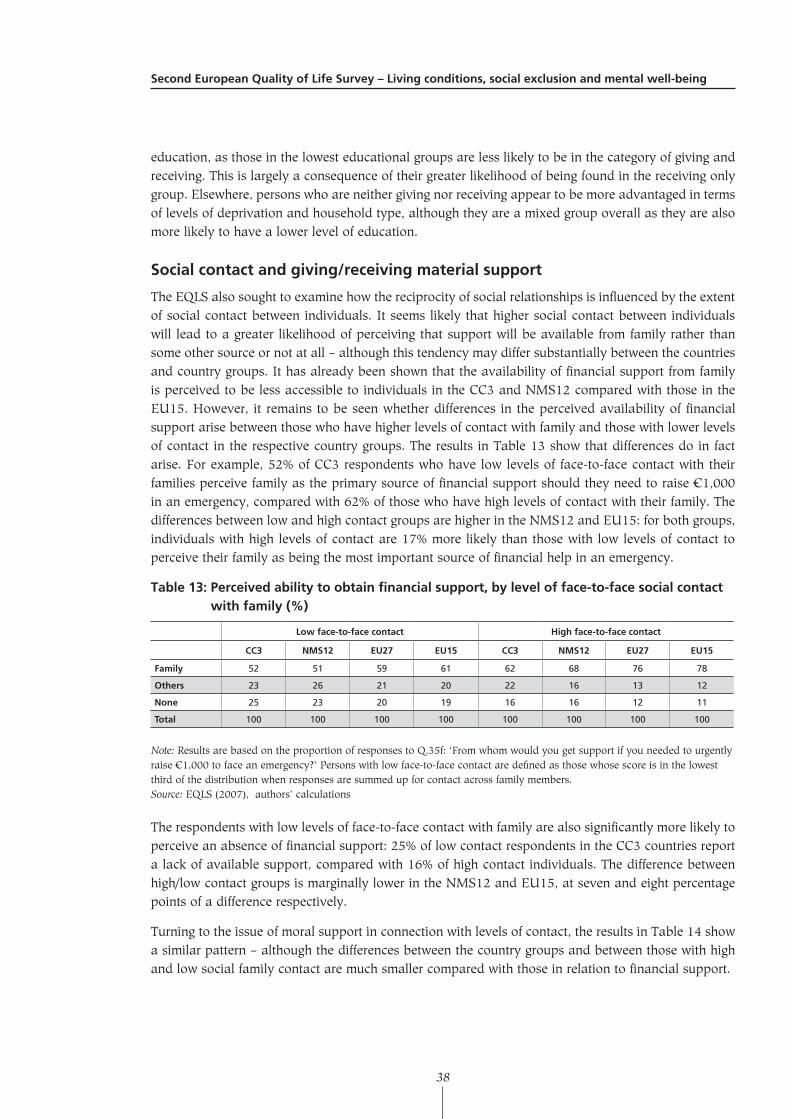
SecondEuropeanQualityofLifeSurvey–Livingconditions,socialexclusionandmentalwell-being
38
education, as those in the lowest educational groups are less likely to be in the category of giving and receiving. This is largely a consequence of their greater likelihood of being found in the receiving only group. Elsewhere, persons who are neither giving nor receiving appear to be more advantaged in terms of levels of deprivation and household type, although they are a mixed group overall as they are also more likely to have a lower level of education.
Socialcontactandgiving/receivingmaterialsupport
The EQLS also sought to examine how the reciprocity of social relationships is influenced by the extent of social contact between individuals. It seems likely that higher social contact between individuals will lead to a greater likelihood of perceiving that support will be available from family rather than some other source or not at all – although this tendency may differ substantially between the countries and country groups. It has already been shown that the availability of financial support from family is perceived to be less accessible to individuals in the CC3 and NMS12 compared with those in the EU15. However, it remains to be seen whether differences in the perceived availability of financial support arise between those who have higher levels of contact with family and those with lower levels of contact in the respective country groups. The results in Table 13 show that differences do in fact arise. For example, 52% of CC3 respondents who have low levels of face-to-face contact with their families perceive family as the primary source of financial support should they need to raise €1,000 in an emergency, compared with 62% of those who have high levels of contact with their family. The differences between low and high contact groups are higher in the NMS12 and EU15: for both groups, individuals with high levels of contact are 17% more likely than those with low levels of contact to perceive their family as being the most important source of financial help in an emergency.
Table13:Perceivedabilitytoobtainfinancialsupport,bylevelofface-to-facesocialcontactwithfamily(%)
Lowface-to-facecontact Highface-to-facecontact
CC3 NMS12 EU27 EU15 CC3 NMS12 EU27 EU15
Family 52 51 59 61 62 68 76 78
Others 23 26 21 20 22 16 13 12
None 25 23 20 19 16 16 12 11
Total 100 100 100 100 100 100 100 100
Note: Results are based on the proportion of responses to Q.35f: ‘From whom would you get support if you needed to urgently raise €1,000 to face an emergency?’ Persons with low face-to-face contact are defined as those whose score is in the lowest third of the distribution when responses are summed up for contact across family members. Source: EQLS (2007), authors’ calculations
The respondents with low levels of face-to-face contact with family are also significantly more likely to perceive an absence of financial support: 25% of low contact respondents in the CC3 countries report a lack of available support, compared with 16% of high contact individuals. The difference between high/low contact groups is marginally lower in the NMS12 and EU15, at seven and eight percentage points of a difference respectively.
Turning to the issue of moral support in connection with levels of contact, the results in Table 14 show a similar pattern – although the differences between the country groups and between those with high and low social family contact are much smaller compared with those in relation to financial support.
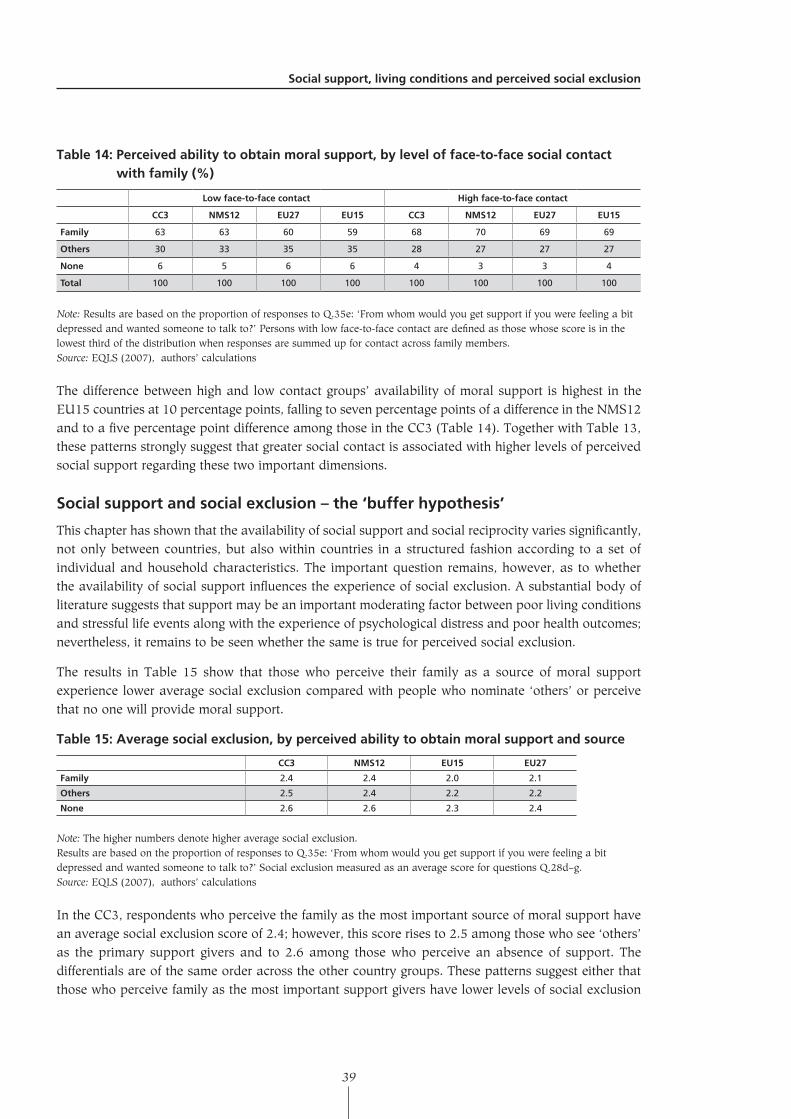
Socialsupport,livingconditionsandperceivedsocialexclusion
39
Table14:Perceivedabilitytoobtainmoralsupport,bylevelofface-to-facesocialcontactwithfamily(%)
Lowface-to-facecontact Highface-to-facecontact
CC3 NMS12 EU27 EU15 CC3 NMS12 EU27 EU15
Family 63 63 60 59 68 70 69 69
Others 30 33 35 35 28 27 27 27
None 6 5 6 6 4 3 3 4
Total 100 100 100 100 100 100 100 100
Note: Results are based on the proportion of responses to Q.35e: ‘From whom would you get support if you were feeling a bit depressed and wanted someone to talk to?’ Persons with low face-to-face contact are defined as those whose score is in the lowest third of the distribution when responses are summed up for contact across family members.Source: EQLS (2007), authors’ calculations
The difference between high and low contact groups’ availability of moral support is highest in the EU15 countries at 10 percentage points, falling to seven percentage points of a difference in the NMS12 and to a five percentage point difference among those in the CC3 (Table 14). Together with Table 13, these patterns strongly suggest that greater social contact is associated with higher levels of perceived social support regarding these two important dimensions.
Socialsupportandsocialexclusion–the‘bufferhypothesis’
This chapter has shown that the availability of social support and social reciprocity varies significantly, not only between countries, but also within countries in a structured fashion according to a set of individual and household characteristics. The important question remains, however, as to whether the availability of social support influences the experience of social exclusion. A substantial body of literature suggests that support may be an important moderating factor between poor living conditions and stressful life events along with the experience of psychological distress and poor health outcomes; nevertheless, it remains to be seen whether the same is true for perceived social exclusion.
The results in Table 15 show that those who perceive their family as a source of moral support experience lower average social exclusion compared with people who nominate ‘others’ or perceive that no one will provide moral support.
Table15:Averagesocialexclusion,byperceivedabilitytoobtainmoralsupportandsource
CC3 NMS12 EU15 EU27
Family 2.4 2.4 2.0 2.1
Others 2.5 2.4 2.2 2.2
None 2.6 2.6 2.3 2.4
Note: The higher numbers denote higher average social exclusion.Results are based on the proportion of responses to Q.35e: ‘From whom would you get support if you were feeling a bit depressed and wanted someone to talk to?’ Social exclusion measured as an average score for questions Q.28d–g.Source: EQLS (2007), authors’ calculations
In the CC3, respondents who perceive the family as the most important source of moral support have an average social exclusion score of 2.4; however, this score rises to 2.5 among those who see ‘others’ as the primary support givers and to 2.6 among those who perceive an absence of support. The differentials are of the same order across the other country groups. These patterns suggest either that those who perceive family as the most important support givers have lower levels of social exclusion
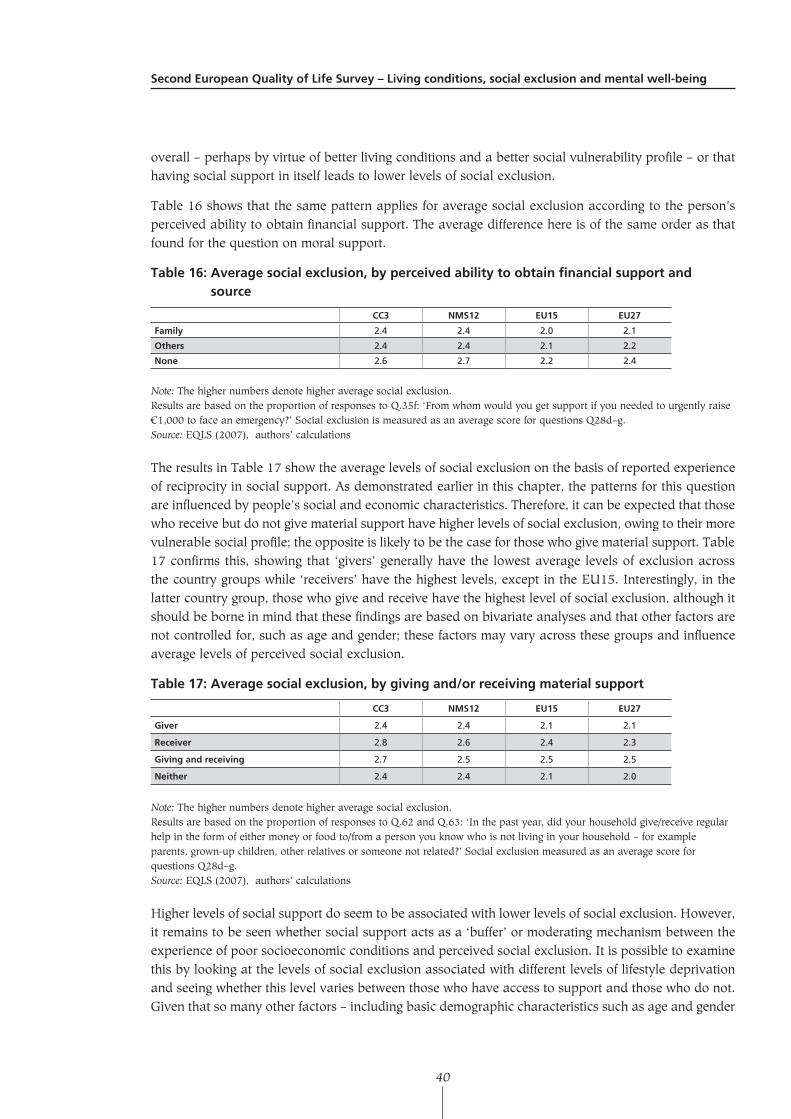
SecondEuropeanQualityofLifeSurvey–Livingconditions,socialexclusionandmentalwell-being
40
overall – perhaps by virtue of better living conditions and a better social vulnerability profile – or that having social support in itself leads to lower levels of social exclusion.
Table 16 shows that the same pattern applies for average social exclusion according to the person’s perceived ability to obtain financial support. The average difference here is of the same order as that found for the question on moral support.
Table16:Averagesocialexclusion,byperceivedabilitytoobtainfinancialsupportandsource
CC3 NMS12 EU15 EU27
Family 2.4 2.4 2.0 2.1
Others 2.4 2.4 2.1 2.2
None 2.6 2.7 2.2 2.4
Note: The higher numbers denote higher average social exclusion.Results are based on the proportion of responses to Q.35f: ‘From whom would you get support if you needed to urgently raise €1,000 to face an emergency?’ Social exclusion is measured as an average score for questions Q28d–g.Source: EQLS (2007), authors’ calculations
The results in Table 17 show the average levels of social exclusion on the basis of reported experience of reciprocity in social support. As demonstrated earlier in this chapter, the patterns for this question are influenced by people’s social and economic characteristics. Therefore, it can be expected that those who receive but do not give material support have higher levels of social exclusion, owing to their more vulnerable social profile; the opposite is likely to be the case for those who give material support. Table 17 confirms this, showing that ‘givers’ generally have the lowest average levels of exclusion across the country groups while ‘receivers’ have the highest levels, except in the EU15. Interestingly, in the latter country group, those who give and receive have the highest level of social exclusion, although it should be borne in mind that these findings are based on bivariate analyses and that other factors are not controlled for, such as age and gender; these factors may vary across these groups and influence average levels of perceived social exclusion.
Table17:Averagesocialexclusion,bygivingand/orreceivingmaterialsupport
CC3 NMS12 EU15 EU27
Giver 2.4 2.4 2.1 2.1
Receiver 2.8 2.6 2.4 2.3
Givingandreceiving 2.7 2.5 2.5 2.5
Neither 2.4 2.4 2.1 2.0
Note: The higher numbers denote higher average social exclusion.Results are based on the proportion of responses to Q.62 and Q.63: ‘In the past year, did your household give/receive regular help in the form of either money or food to/from a person you know who is not living in your household – for example parents, grown-up children, other relatives or someone not related?’ Social exclusion measured as an average score for questions Q28d–g.Source: EQLS (2007), authors’ calculations
Higher levels of social support do seem to be associated with lower levels of social exclusion. However, it remains to be seen whether social support acts as a ‘buffer’ or moderating mechanism between the experience of poor socioeconomic conditions and perceived social exclusion. It is possible to examine this by looking at the levels of social exclusion associated with different levels of lifestyle deprivation and seeing whether this level varies between those who have access to support and those who do not. Given that so many other factors – including basic demographic characteristics such as age and gender
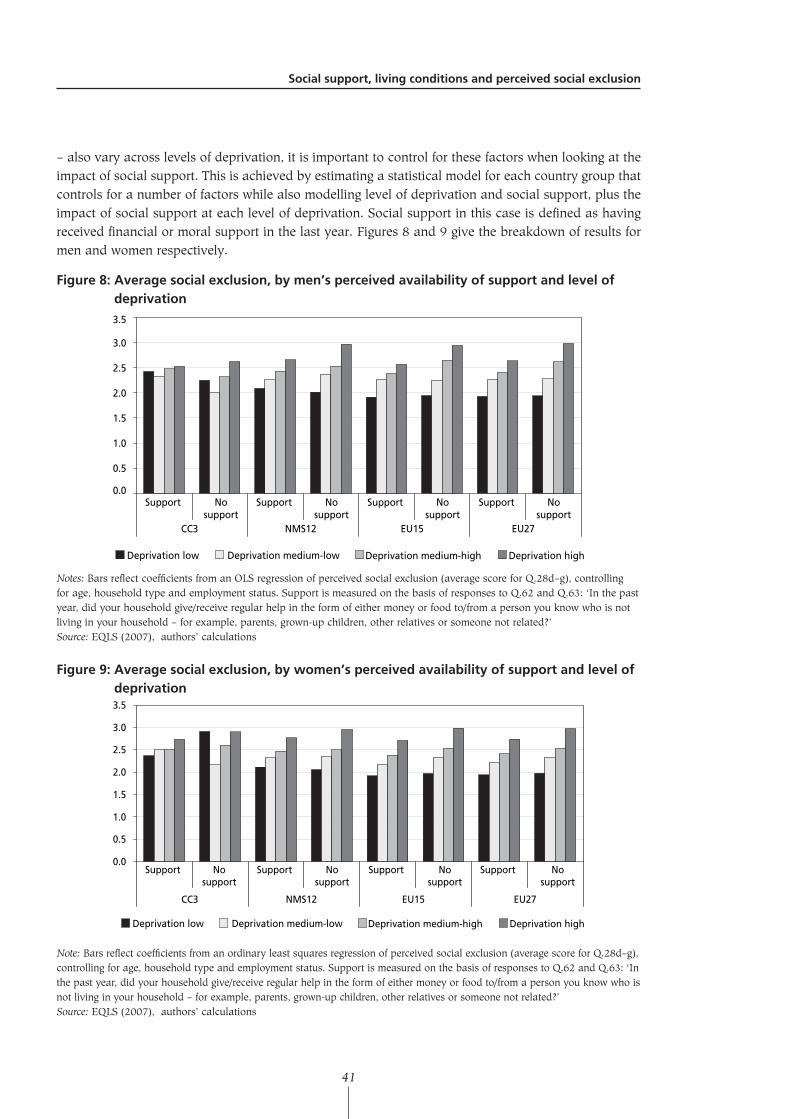
Socialsupport,livingconditionsandperceivedsocialexclusion
41
– also vary across levels of deprivation, it is important to control for these factors when looking at the impact of social support. This is achieved by estimating a statistical model for each country group that controls for a number of factors while also modelling level of deprivation and social support, plus the impact of social support at each level of deprivation. Social support in this case is defined as having received financial or moral support in the last year. Figures 8 and 9 give the breakdown of results for men and women respectively.
Figure8:Averagesocialexclusion,bymen’sperceivedavailabilityofsupportandlevelofdeprivation
0.0
0.5
1.0
1.5
2.0
2.5
3.0
3.5
Support Nosupport
Support Nosupport
Support Nosupport
Support Nosupport
CC3 NMS12 EU15 EU27
Deprivation low Deprivation medium-low Deprivation medium-high Deprivation high
Notes: Bars reflect coefficients from an OLS regression of perceived social exclusion (average score for Q.28d–g), controlling for age, household type and employment status. Support is measured on the basis of responses to Q.62 and Q.63: ‘In the past year, did your household give/receive regular help in the form of either money or food to/from a person you know who is not living in your household – for example, parents, grown-up children, other relatives or someone not related?’ Source: EQLS (2007), authors’ calculations
Figure9:Averagesocialexclusion,bywomen’sperceivedavailabilityofsupportandlevelofdeprivation
0.0
0.5
1.0
1.5
2.0
2.5
3.0
3.5
Support Nosupport
Nosupport
Nosupport
Nosupport
Support Support Support
CC3 NMS12 EU15 EU27
Deprivation low Deprivation medium-low Deprivation medium-high Deprivation high
Note: Bars reflect coefficients from an ordinary least squares regression of perceived social exclusion (average score for Q.28d–g), controlling for age, household type and employment status. Support is measured on the basis of responses to Q.62 and Q.63: ‘In the past year, did your household give/receive regular help in the form of either money or food to/from a person you know who is not living in your household – for example, parents, grown-up children, other relatives or someone not related?’ Source: EQLS (2007), authors’ calculations
SecondEuropeanQualityofLifeSurvey–Livingconditions,socialexclusionandmentalwell-being
42
The results show that across the country groups, those who are experiencing higher levels of deprivation also experience higher levels of social exclusion. Interestingly, if the individual or household has received social support in the last year, they have a significantly lower level of perceived social exclusion than those who did not receive support but who are experiencing the same level of deprivation (see Annex 1 for full models for these figures). The exception to this trend appears to be men in the CC3 countries, where such a pattern only seems to emerge for men in the highest deprivation category (Figure 8). However, Chapter 2 showed that the relationship between deprivation and social exclusion was not as straightforward in the CC3 countries, so the patterning with social support may be a consequence of this.
Conclusions
The study of social support has an extensive history across the social and health sciences. The perceived availability of support and its source, along with the actual experience of social support, are all important indicators of the web of social connections within which individuals are located. More importantly, in the context of this report, social support has also been shown to be very important in moderating the impact of deprivation and poor living conditions on different dimensions of personal well-being.
The research literature identifies two main dimensions of social support – coping assistance and the provision of material resources – both of which are analysed in this chapter. The results show wide variation between the countries in terms of the perceived ability of European citizens to obtain financial support. Although almost 85% of survey respondents report that they could get financial support from somewhere in an emergency, this proportion falls to 70% in Hungary and Portugal and tends to be higher in the CC3 and NMS12 countries overall. There is also wide variation in the perceived role of the family in offering financial support, with less than 60% of respondents seeing the family as the main means of support in the CC3 and NMS12 countries, compared with 70% in the EU15.
Rather less divergence is evident between the countries and country groups in terms of the perceived availability of moral support and the major source of this support, with the family being seen as the primary source by about two-thirds of European citizens in all country groups. However, this proportion is not uniform across countries, and France and the Czech Republic stand out as countries where relatively fewer respondents perceive the family as a source of moral support. These patterns do not lend themselves to easy explanation via country wealth, political or institutional structure. Instead, they are more suggestive of different cultural histories and structures, alongside different expectations of the role of family and others in providing support.
Analysis of actual experience of material support in the last year, on the other hand, showed that it is structured primarily by country wealth and institutional form with wealthier countries: for instance, those with universalist and developed welfare structures have a lower proportion of individuals receiving support. The pattern of social exchange across countries was also strongly influenced by individual and household characteristics. As might be expected, more advantaged households were more likely to have given material support in the last year, while less advantaged households were more likely to have received such support. Interestingly, it also emerged that those giving and receiving in the last year were more likely to be in a vulnerable socioeconomic position, suggesting that this may be associated with higher levels of social exchange and support. If so, this is an encouraging finding, as the last analysis of the chapter showed that support played a significant role in moderating the impact of social deprivation on perceived social exclusion.
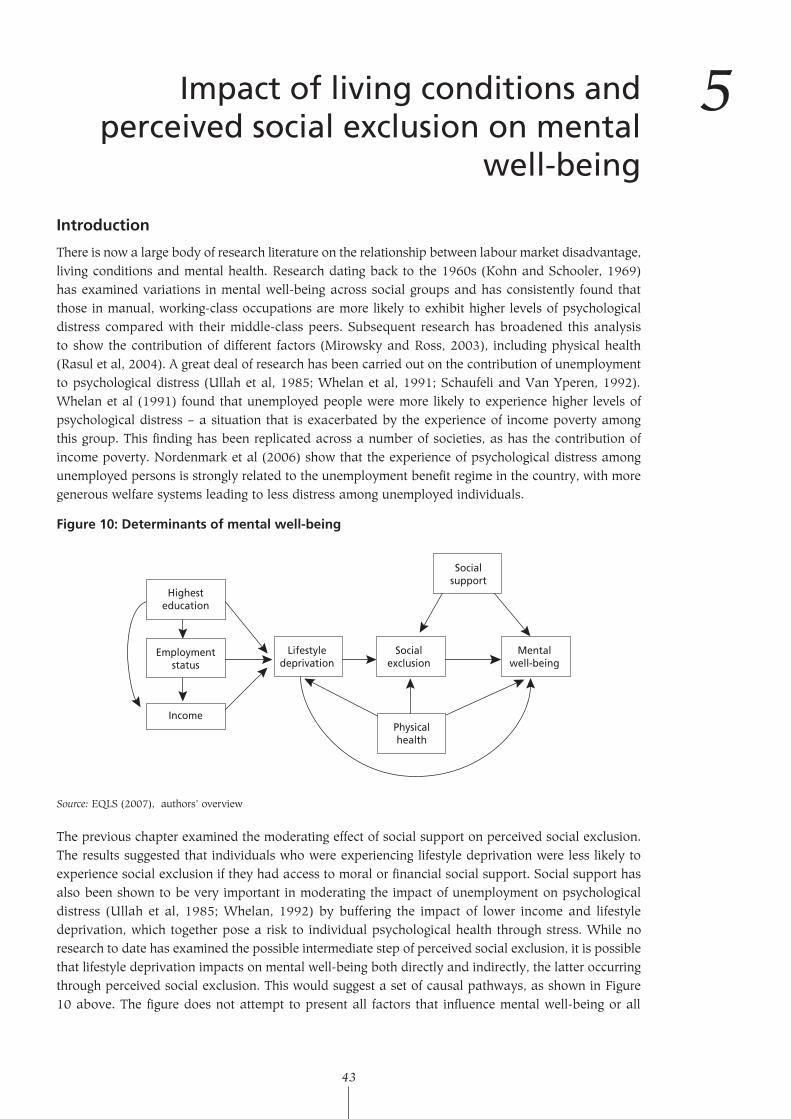
43
5Impact of living conditions and perceived social exclusion on mental
well-being
Introduction
There is now a large body of research literature on the relationship between labour market disadvantage, living conditions and mental health. Research dating back to the 1960s (Kohn and Schooler, 1969) has examined variations in mental well-being across social groups and has consistently found that those in manual, working-class occupations are more likely to exhibit higher levels of psychological distress compared with their middle-class peers. Subsequent research has broadened this analysis to show the contribution of different factors (Mirowsky and Ross, 2003), including physical health (Rasul et al, 2004). A great deal of research has been carried out on the contribution of unemployment to psychological distress (Ullah et al, 1985; Whelan et al, 1991; Schaufeli and Van Yperen, 1992). Whelan et al (1991) found that unemployed people were more likely to experience higher levels of psychological distress – a situation that is exacerbated by the experience of income poverty among this group. This finding has been replicated across a number of societies, as has the contribution of income poverty. Nordenmark et al (2006) show that the experience of psychological distress among unemployed persons is strongly related to the unemployment benefit regime in the country, with more generous welfare systems leading to less distress among unemployed individuals.
Figure10:Determinantsofmentalwell-being
Highesteducation
Employmentstatus
Lifestyledeprivation
Socialexclusion
Mentalwell-being
Socialsupport
Physicalhealth
Income
Source: EQLS (2007), authors’ overview
The previous chapter examined the moderating effect of social support on perceived social exclusion. The results suggested that individuals who were experiencing lifestyle deprivation were less likely to experience social exclusion if they had access to moral or financial social support. Social support has also been shown to be very important in moderating the impact of unemployment on psychological distress (Ullah et al, 1985; Whelan, 1992) by buffering the impact of lower income and lifestyle deprivation, which together pose a risk to individual psychological health through stress. While no research to date has examined the possible intermediate step of perceived social exclusion, it is possible that lifestyle deprivation impacts on mental well-being both directly and indirectly, the latter occurring through perceived social exclusion. This would suggest a set of causal pathways, as shown in Figure 10 above. The figure does not attempt to present all factors that influence mental well-being or all
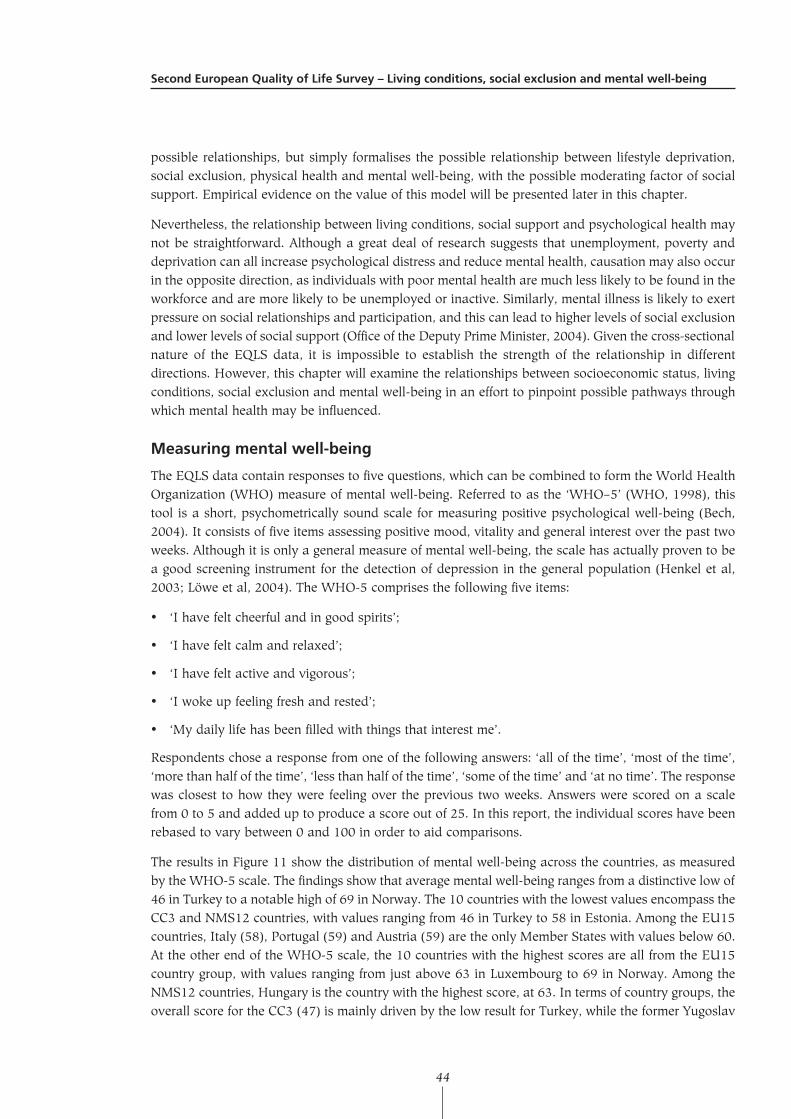
SecondEuropeanQualityofLifeSurvey–Livingconditions,socialexclusionandmentalwell-being
44
possible relationships, but simply formalises the possible relationship between lifestyle deprivation, social exclusion, physical health and mental well-being, with the possible moderating factor of social support. Empirical evidence on the value of this model will be presented later in this chapter.
Nevertheless, the relationship between living conditions, social support and psychological health may not be straightforward. Although a great deal of research suggests that unemployment, poverty and deprivation can all increase psychological distress and reduce mental health, causation may also occur in the opposite direction, as individuals with poor mental health are much less likely to be found in the workforce and are more likely to be unemployed or inactive. Similarly, mental illness is likely to exert pressure on social relationships and participation, and this can lead to higher levels of social exclusion and lower levels of social support (Office of the Deputy Prime Minister, 2004). Given the cross-sectional nature of the EQLS data, it is impossible to establish the strength of the relationship in different directions. However, this chapter will examine the relationships between socioeconomic status, living conditions, social exclusion and mental well-being in an effort to pinpoint possible pathways through which mental health may be influenced.
Measuringmentalwell-being
The EQLS data contain responses to five questions, which can be combined to form the World Health Organization (WHO) measure of mental well-being. Referred to as the ‘WHO–5’ (WHO, 1998), this tool is a short, psychometrically sound scale for measuring positive psychological well-being (Bech, 2004). It consists of five items assessing positive mood, vitality and general interest over the past two weeks. Although it is only a general measure of mental well-being, the scale has actually proven to be a good screening instrument for the detection of depression in the general population (Henkel et al, 2003; Löwe et al, 2004). The WHO-5 comprises the following five items:
• ‘I have felt cheerful and in good spirits’;
• ‘I have felt calm and relaxed’;
• ‘I have felt active and vigorous’;
• ‘I woke up feeling fresh and rested’;
• ‘My daily life has been filled with things that interest me’.
Respondents chose a response from one of the following answers: ‘all of the time’, ‘most of the time’, ‘more than half of the time’, ‘less than half of the time’, ‘some of the time’ and ‘at no time’. The response was closest to how they were feeling over the previous two weeks. Answers were scored on a scale from 0 to 5 and added up to produce a score out of 25. In this report, the individual scores have been rebased to vary between 0 and 100 in order to aid comparisons.
The results in Figure 11 show the distribution of mental well-being across the countries, as measured by the WHO-5 scale. The findings show that average mental well-being ranges from a distinctive low of 46 in Turkey to a notable high of 69 in Norway. The 10 countries with the lowest values encompass the CC3 and NMS12 countries, with values ranging from 46 in Turkey to 58 in Estonia. Among the EU15 countries, Italy (58), Portugal (59) and Austria (59) are the only Member States with values below 60. At the other end of the WHO-5 scale, the 10 countries with the highest scores are all from the EU15 country group, with values ranging from just above 63 in Luxembourg to 69 in Norway. Among the NMS12 countries, Hungary is the country with the highest score, at 63. In terms of country groups, the overall score for the CC3 (47) is mainly driven by the low result for Turkey, while the former Yugoslav
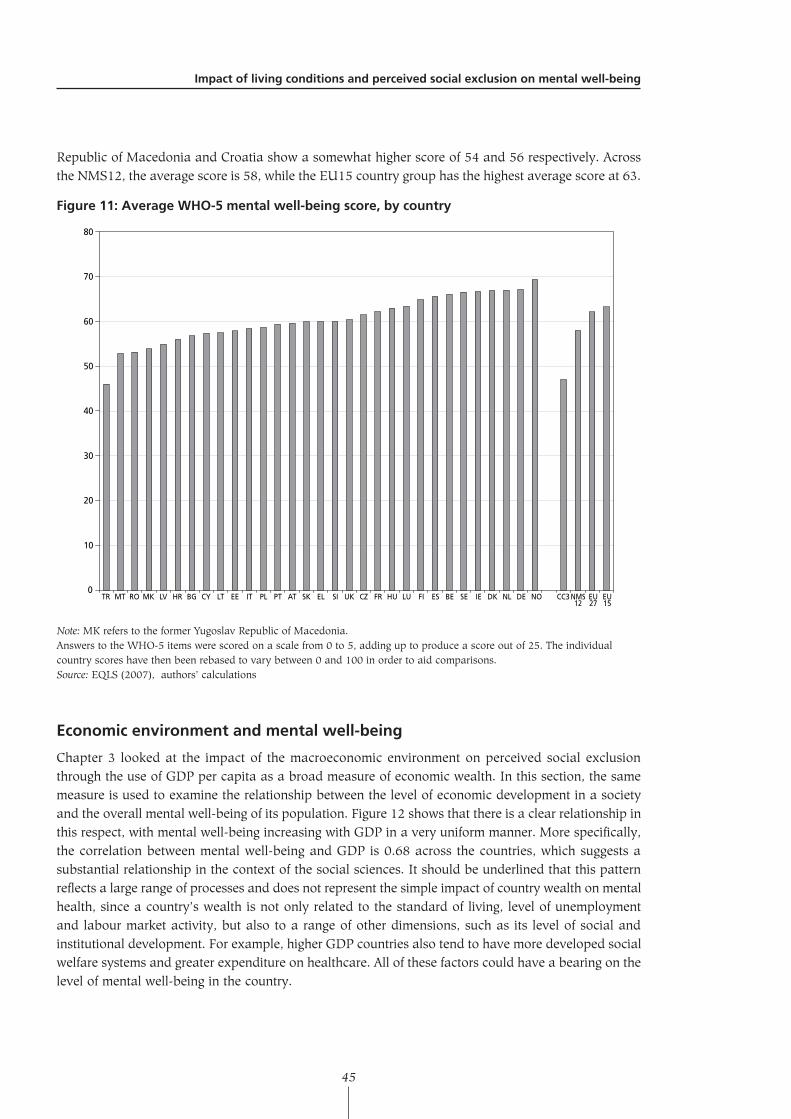
Impactoflivingconditionsandperceivedsocialexclusiononmentalwell-being
45
Republic of Macedonia and Croatia show a somewhat higher score of 54 and 56 respectively. Across the NMS12, the average score is 58, while the EU15 country group has the highest average score at 63.
Figure11:AverageWHO-5mentalwell-beingscore,bycountry
0
10
20
30
40
50
60
70
80
EU15
EU27
NMS12
CC3NODENLDKIESEBEESFILUHUFRCZUKSIELSKATPTPLITEELTCYBGHRLVMKROMTTR
Note: MK refers to the former Yugoslav Republic of Macedonia.Answers to the WHO-5 items were scored on a scale from 0 to 5, adding up to produce a score out of 25. The individual country scores have then been rebased to vary between 0 and 100 in order to aid comparisons.Source: EQLS (2007), authors’ calculations
Economicenvironmentandmentalwell-being
Chapter 3 looked at the impact of the macroeconomic environment on perceived social exclusion through the use of GDP per capita as a broad measure of economic wealth. In this section, the same measure is used to examine the relationship between the level of economic development in a society and the overall mental well-being of its population. Figure 12 shows that there is a clear relationship in this respect, with mental well-being increasing with GDP in a very uniform manner. More specifically, the correlation between mental well-being and GDP is 0.68 across the countries, which suggests a substantial relationship in the context of the social sciences. It should be underlined that this pattern reflects a large range of processes and does not represent the simple impact of country wealth on mental health, since a country’s wealth is not only related to the standard of living, level of unemployment and labour market activity, but also to a range of other dimensions, such as its level of social and institutional development. For example, higher GDP countries also tend to have more developed social welfare systems and greater expenditure on healthcare. All of these factors could have a bearing on the level of mental well-being in the country.
SecondEuropeanQualityofLifeSurvey–Livingconditions,socialexclusionandmentalwell-being
46
Figure12:AverageWHO-5mentalwell-beingscore,bycountryandGDPpercapita(inPPS),2005
30
40
50
60
70
80
0 10,000 20,000 30,000 40,000 50,000 60,000 70,000
BE DKDE
EL
ES
FI
FR
IE
IT
LU
NL
ATPT
SE
GBBGCY
CZ
EE
HU
LV
LT
MT
PL
RO
SK SI
TR
HR
NO
Note: Pearson correlation coefficient = 0.68.Source: EQLS (2007), authors’ calculations
Livingconditionsandmentalwell-being
This section examines the relationship between current income and mental health at the micro level, by looking at how the level of income and material deprivation are related to mental well-being at the individual level. Figure 13 shows the average WHO-5 score by income quartile across the different countries and country groups. Two main features stand out. Firstly, as expected, across all countries a higher income is associated with a higher score on the WHO-5 scale. Secondly, moving from the less prosperous countries to the wealthiest, the gap between those at the bottom of the income distribution scale and those at the top becomes narrower. This last point can be illustrated by the fact that the ratio of the average value of the top to the bottom income quartiles is 1.1 for the EU15, 1.2 for the NMS12 and 1.4 for the CC3. Across the country groups, it also emerges that respondents in the bottom income quartile in the EU15 countries still enjoy a higher WHO-5 score than those in the middle income quartile in the NMS12 and than respondents in the top income quartile in the CC3.
At the bottom end of the income distribution scale, six countries – namely, Turkey and five of the NSM12 countries – have an average WHO-5 score of lower than 50. Among the EU15 countries, Portugal and Austria have the lowest average WHO-5 score for their bottom income groups, with a value of about 51. Most of the EU15 countries have values of between 56 (Greece) and 67 (Norway), with 11 of the EU15 Member States showing values of above 60. Hungary is the only NMS12 country whose bottom income quartile score is in the same range as that of the EU15 countries, with a value of 58. The pattern for the middle income quartiles is similar to that for the bottom income quartiles across the countries under consideration, the main exception being Austria, which enjoys a higher ranking. Finally, looking at the top income quartile, Turkey has the lowest score at 53, while Norway has the highest score at 72.
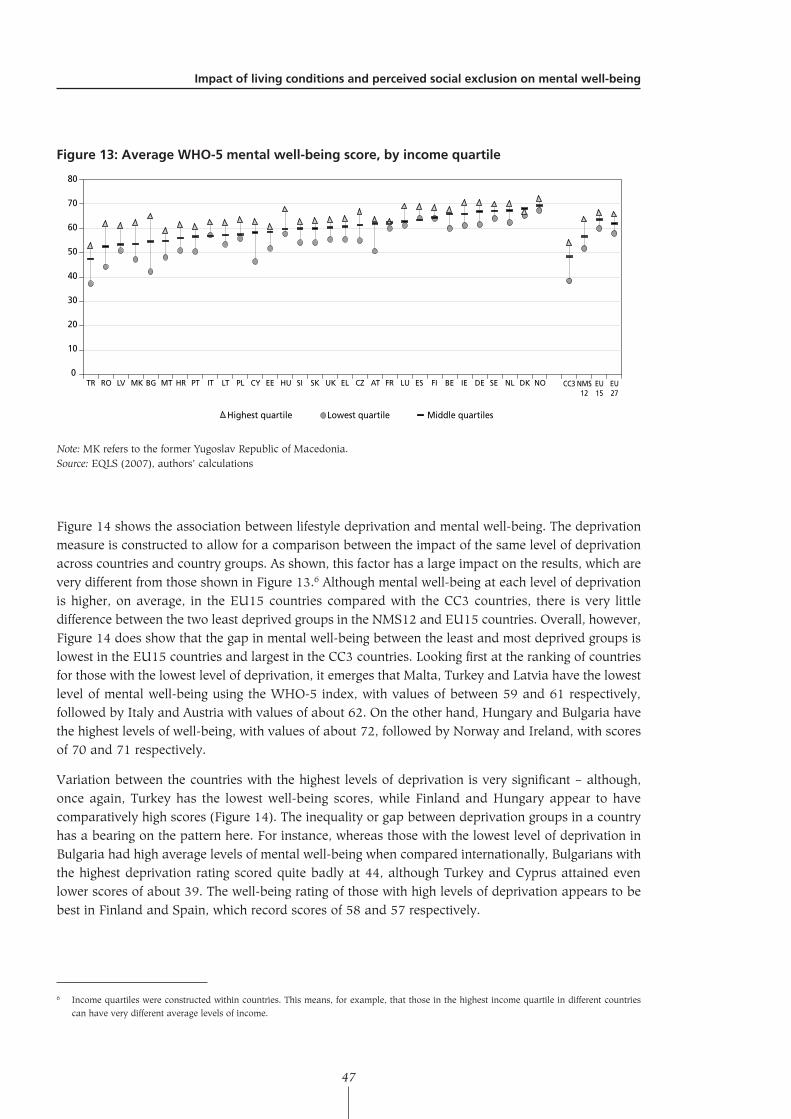
Impactoflivingconditionsandperceivedsocialexclusiononmentalwell-being
47
Figure13:AverageWHO-5mentalwell-beingscore,byincomequartile
0
10
20
30
40
50
60
70
80
Highest quartile Lowest quartile Middle quartiles
TR RO LV MK BG MT HR PT IT LT PL CY EE HU SI SK UK EL CZ AT FR LU ES FI BE IE DE SE NL DK NO CC3 NMS12
EU15
EU27
Note: MK refers to the former Yugoslav Republic of Macedonia.Source: EQLS (2007), authors’ calculations
Figure 14 shows the association between lifestyle deprivation and mental well-being. The deprivation measure is constructed to allow for a comparison between the impact of the same level of deprivation across countries and country groups. As shown, this factor has a large impact on the results, which are very different from those shown in Figure 13.6 Although mental well-being at each level of deprivation is higher, on average, in the EU15 countries compared with the CC3 countries, there is very little difference between the two least deprived groups in the NMS12 and EU15 countries. Overall, however, Figure 14 does show that the gap in mental well-being between the least and most deprived groups is lowest in the EU15 countries and largest in the CC3 countries. Looking first at the ranking of countries for those with the lowest level of deprivation, it emerges that Malta, Turkey and Latvia have the lowest level of mental well-being using the WHO-5 index, with values of between 59 and 61 respectively, followed by Italy and Austria with values of about 62. On the other hand, Hungary and Bulgaria have the highest levels of well-being, with values of about 72, followed by Norway and Ireland, with scores of 70 and 71 respectively.
Variation between the countries with the highest levels of deprivation is very significant – although, once again, Turkey has the lowest well-being scores, while Finland and Hungary appear to have comparatively high scores (Figure 14). The inequality or gap between deprivation groups in a country has a bearing on the pattern here. For instance, whereas those with the lowest level of deprivation in Bulgaria had high average levels of mental well-being when compared internationally, Bulgarians with the highest deprivation rating scored quite badly at 44, although Turkey and Cyprus attained even lower scores of about 39. The well-being rating of those with high levels of deprivation appears to be best in Finland and Spain, which record scores of 58 and 57 respectively.
6 Income quartiles were constructed within countries. This means, for example, that those in the highest income quartile in different countries can have very different average levels of income.
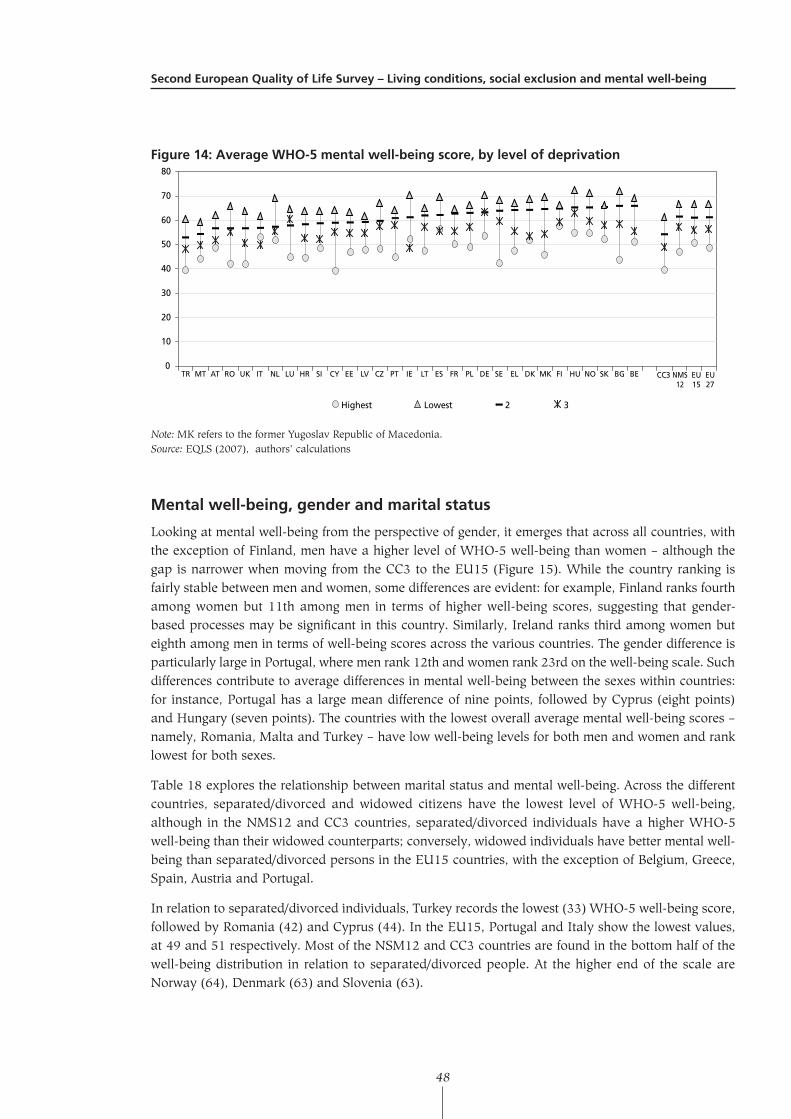
SecondEuropeanQualityofLifeSurvey–Livingconditions,socialexclusionandmentalwell-being
48
Figure14:AverageWHO-5mentalwell-beingscore,bylevelofdeprivation
CC3 NMS12
EU15
EU27
TR MT AT RO UK IT NL LU HR SI CY EE LV CZ PT IE LT ES FR PL DE SE EL DK MK FI HU NO SK BG BE
Highest Lowest 2 3
0
10
20
30
40
50
60
70
80
Note: MK refers to the former Yugoslav Republic of Macedonia.Source: EQLS (2007), authors’ calculations
Mentalwell-being,genderandmaritalstatus
Looking at mental well-being from the perspective of gender, it emerges that across all countries, with the exception of Finland, men have a higher level of WHO-5 well-being than women – although the gap is narrower when moving from the CC3 to the EU15 (Figure 15). While the country ranking is fairly stable between men and women, some differences are evident: for example, Finland ranks fourth among women but 11th among men in terms of higher well-being scores, suggesting that gender-based processes may be significant in this country. Similarly, Ireland ranks third among women but eighth among men in terms of well-being scores across the various countries. The gender difference is particularly large in Portugal, where men rank 12th and women rank 23rd on the well-being scale. Such differences contribute to average differences in mental well-being between the sexes within countries: for instance, Portugal has a large mean difference of nine points, followed by Cyprus (eight points) and Hungary (seven points). The countries with the lowest overall average mental well-being scores – namely, Romania, Malta and Turkey – have low well-being levels for both men and women and rank lowest for both sexes.
Table 18 explores the relationship between marital status and mental well-being. Across the different countries, separated/divorced and widowed citizens have the lowest level of WHO-5 well-being, although in the NMS12 and CC3 countries, separated/divorced individuals have a higher WHO-5 well-being than their widowed counterparts; conversely, widowed individuals have better mental well-being than separated/divorced persons in the EU15 countries, with the exception of Belgium, Greece, Spain, Austria and Portugal.
In relation to separated/divorced individuals, Turkey records the lowest (33) WHO-5 well-being score, followed by Romania (42) and Cyprus (44). In the EU15, Portugal and Italy show the lowest values, at 49 and 51 respectively. Most of the NSM12 and CC3 countries are found in the bottom half of the well-being distribution in relation to separated/divorced people. At the higher end of the scale are Norway (64), Denmark (63) and Slovenia (63).
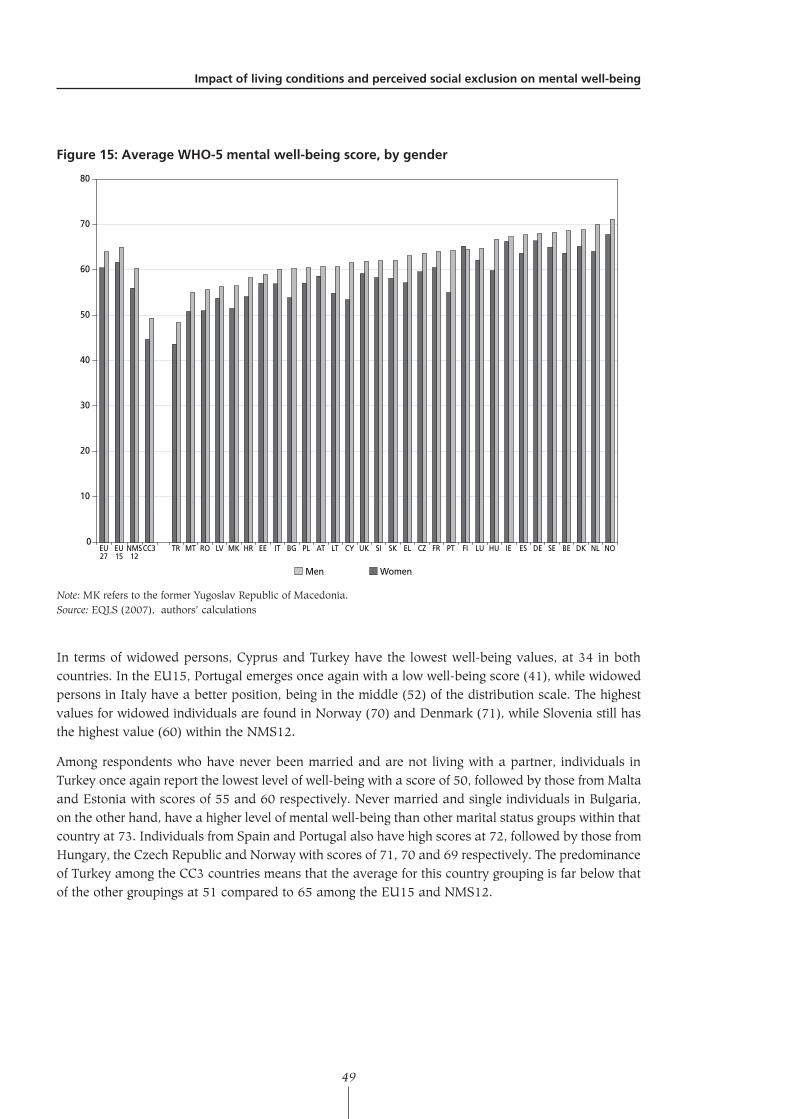
Impactoflivingconditionsandperceivedsocialexclusiononmentalwell-being
49
Figure15:AverageWHO-5mentalwell-beingscore,bygender
NONLDKBESEDEESIEHULUFIPTFRCZELSKSIUKCYLTATPLBGITEEHRMKLVROMTTRCC3NMS12
EU15
EU27
0
10
20
30
40
50
60
70
80
Men Women
Note: MK refers to the former Yugoslav Republic of Macedonia.Source: EQLS (2007), authors’ calculations
In terms of widowed persons, Cyprus and Turkey have the lowest well-being values, at 34 in both countries. In the EU15, Portugal emerges once again with a low well-being score (41), while widowed persons in Italy have a better position, being in the middle (52) of the distribution scale. The highest values for widowed individuals are found in Norway (70) and Denmark (71), while Slovenia still has the highest value (60) within the NMS12.
Among respondents who have never been married and are not living with a partner, individuals in Turkey once again report the lowest level of well-being with a score of 50, followed by those from Malta and Estonia with scores of 55 and 60 respectively. Never married and single individuals in Bulgaria, on the other hand, have a higher level of mental well-being than other marital status groups within that country at 73. Individuals from Spain and Portugal also have high scores at 72, followed by those from Hungary, the Czech Republic and Norway with scores of 71, 70 and 69 respectively. The predominance of Turkey among the CC3 countries means that the average for this country grouping is far below that of the other groupings at 51 compared to 65 among the EU15 and NMS12.
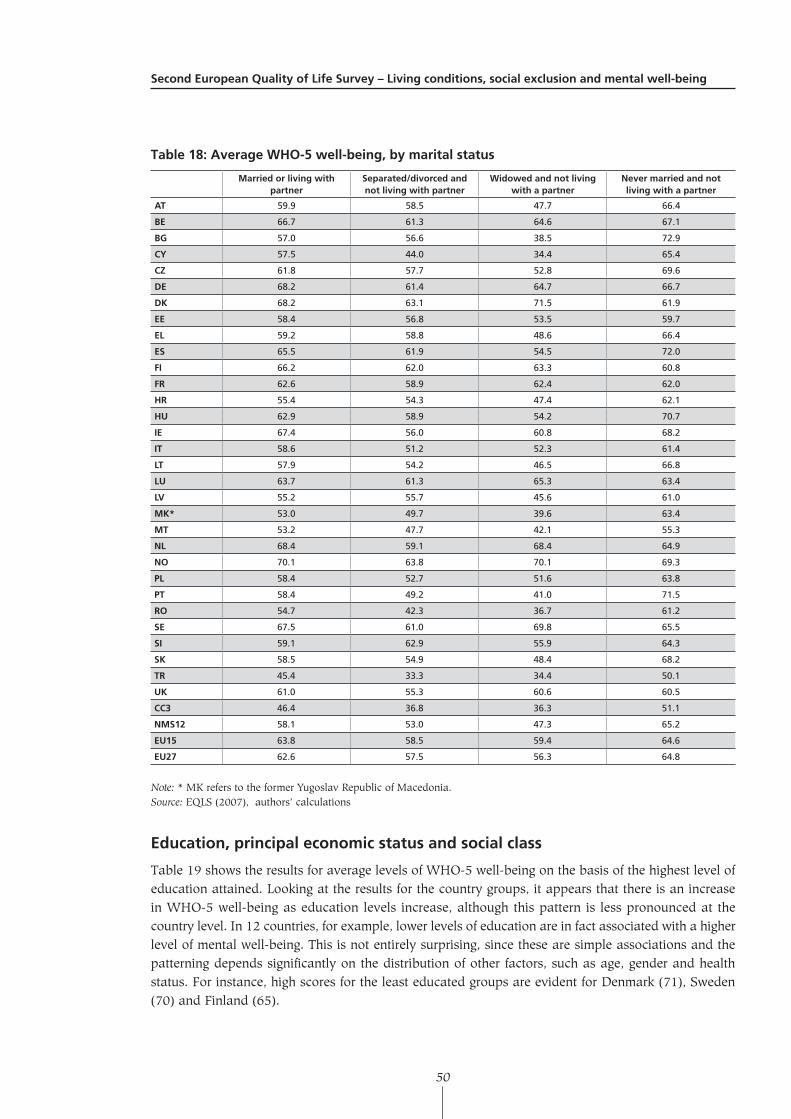
SecondEuropeanQualityofLifeSurvey–Livingconditions,socialexclusionandmentalwell-being
50
Table18:AverageWHO-5well-being,bymaritalstatus
Marriedorlivingwithpartner
Separated/divorcedandnotlivingwithpartner
Widowedandnotlivingwithapartner
Nevermarriedandnotlivingwithapartner
AT 59.9 58.5 47.7 66.4
BE 66.7 61.3 64.6 67.1
BG 57.0 56.6 38.5 72.9
CY 57.5 44.0 34.4 65.4
CZ 61.8 57.7 52.8 69.6
DE 68.2 61.4 64.7 66.7
DK 68.2 63.1 71.5 61.9
EE 58.4 56.8 53.5 59.7
EL 59.2 58.8 48.6 66.4
ES 65.5 61.9 54.5 72.0
FI 66.2 62.0 63.3 60.8
FR 62.6 58.9 62.4 62.0
HR 55.4 54.3 47.4 62.1
HU 62.9 58.9 54.2 70.7
IE 67.4 56.0 60.8 68.2
IT 58.6 51.2 52.3 61.4
LT 57.9 54.2 46.5 66.8
LU 63.7 61.3 65.3 63.4
LV 55.2 55.7 45.6 61.0
MK* 53.0 49.7 39.6 63.4
MT 53.2 47.7 42.1 55.3
NL 68.4 59.1 68.4 64.9
NO 70.1 63.8 70.1 69.3
PL 58.4 52.7 51.6 63.8
PT 58.4 49.2 41.0 71.5
RO 54.7 42.3 36.7 61.2
SE 67.5 61.0 69.8 65.5
SI 59.1 62.9 55.9 64.3
SK 58.5 54.9 48.4 68.2
TR 45.4 33.3 34.4 50.1
UK 61.0 55.3 60.6 60.5
CC3 46.4 36.8 36.3 51.1
NMS12 58.1 53.0 47.3 65.2
EU15 63.8 58.5 59.4 64.6
EU27 62.6 57.5 56.3 64.8
Note: * MK refers to the former Yugoslav Republic of Macedonia.Source: EQLS (2007), authors’ calculations
Education,principaleconomicstatusandsocialclass
Table 19 shows the results for average levels of WHO-5 well-being on the basis of the highest level of education attained. Looking at the results for the country groups, it appears that there is an increase in WHO-5 well-being as education levels increase, although this pattern is less pronounced at the country level. In 12 countries, for example, lower levels of education are in fact associated with a higher level of mental well-being. This is not entirely surprising, since these are simple associations and the patterning depends significantly on the distribution of other factors, such as age, gender and health status. For instance, high scores for the least educated groups are evident for Denmark (71), Sweden (70) and Finland (65).
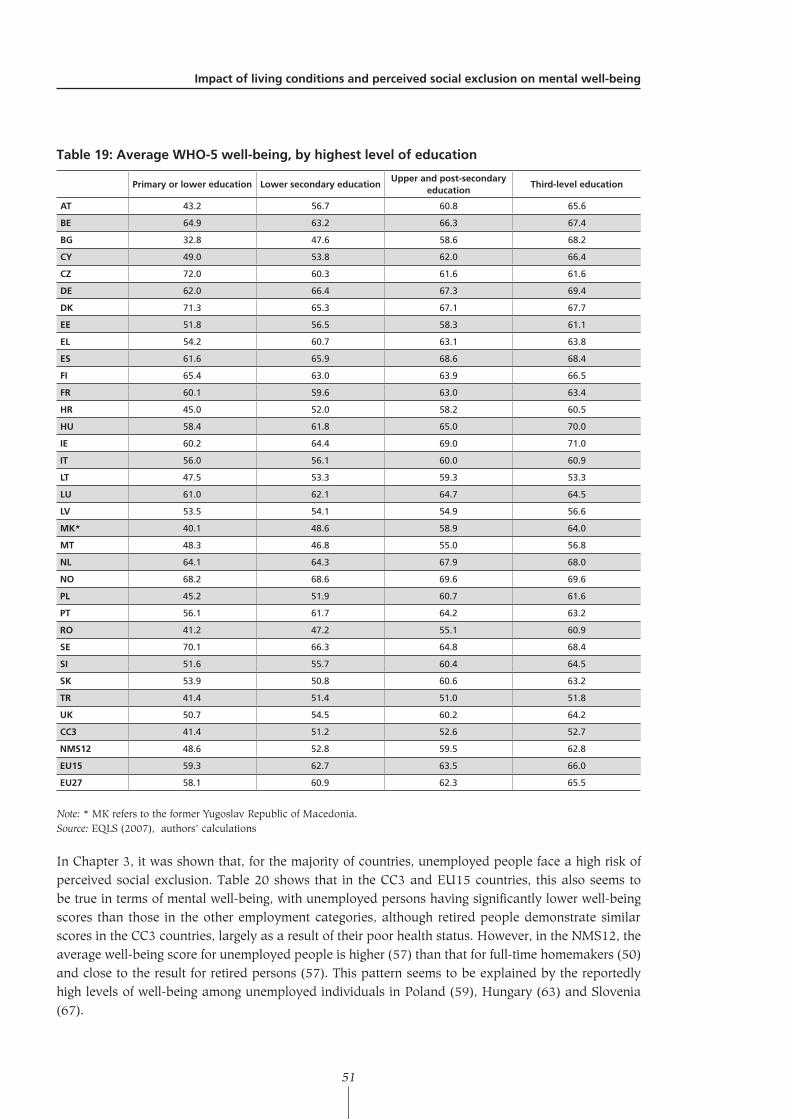
Impactoflivingconditionsandperceivedsocialexclusiononmentalwell-being
51
Table19:AverageWHO-5well-being,byhighestlevelofeducation
Primaryorlowereducation LowersecondaryeducationUpperandpost-secondary
educationThird-leveleducation
AT 43.2 56.7 60.8 65.6
BE 64.9 63.2 66.3 67.4
BG 32.8 47.6 58.6 68.2
CY 49.0 53.8 62.0 66.4
CZ 72.0 60.3 61.6 61.6
DE 62.0 66.4 67.3 69.4
DK 71.3 65.3 67.1 67.7
EE 51.8 56.5 58.3 61.1
EL 54.2 60.7 63.1 63.8
ES 61.6 65.9 68.6 68.4
FI 65.4 63.0 63.9 66.5
FR 60.1 59.6 63.0 63.4
HR 45.0 52.0 58.2 60.5
HU 58.4 61.8 65.0 70.0
IE 60.2 64.4 69.0 71.0
IT 56.0 56.1 60.0 60.9
LT 47.5 53.3 59.3 53.3
LU 61.0 62.1 64.7 64.5
LV 53.5 54.1 54.9 56.6
MK* 40.1 48.6 58.9 64.0
MT 48.3 46.8 55.0 56.8
NL 64.1 64.3 67.9 68.0
NO 68.2 68.6 69.6 69.6
PL 45.2 51.9 60.7 61.6
PT 56.1 61.7 64.2 63.2
RO 41.2 47.2 55.1 60.9
SE 70.1 66.3 64.8 68.4
SI 51.6 55.7 60.4 64.5
SK 53.9 50.8 60.6 63.2
TR 41.4 51.4 51.0 51.8
UK 50.7 54.5 60.2 64.2
CC3 41.4 51.2 52.6 52.7
NMS12 48.6 52.8 59.5 62.8
EU15 59.3 62.7 63.5 66.0
EU27 58.1 60.9 62.3 65.5
Note: * MK refers to the former Yugoslav Republic of Macedonia.Source: EQLS (2007), authors’ calculations
In Chapter 3, it was shown that, for the majority of countries, unemployed people face a high risk of perceived social exclusion. Table 20 shows that in the CC3 and EU15 countries, this also seems to be true in terms of mental well-being, with unemployed persons having significantly lower well-being scores than those in the other employment categories, although retired people demonstrate similar scores in the CC3 countries, largely as a result of their poor health status. However, in the NMS12, the average well-being score for unemployed people is higher (57) than that for full-time homemakers (50) and close to the result for retired persons (57). This pattern seems to be explained by the reportedly high levels of well-being among unemployed individuals in Poland (59), Hungary (63) and Slovenia (67).
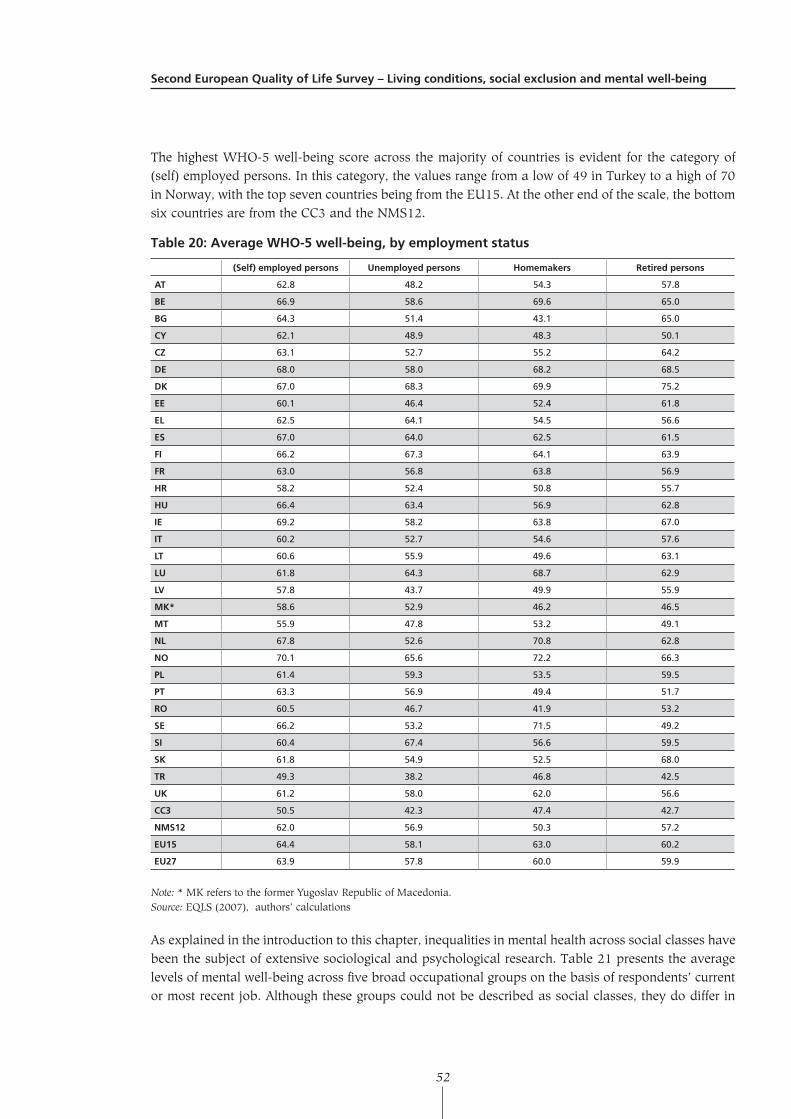
SecondEuropeanQualityofLifeSurvey–Livingconditions,socialexclusionandmentalwell-being
52
The highest WHO-5 well-being score across the majority of countries is evident for the category of (self) employed persons. In this category, the values range from a low of 49 in Turkey to a high of 70 in Norway, with the top seven countries being from the EU15. At the other end of the scale, the bottom six countries are from the CC3 and the NMS12.
Table20:AverageWHO-5well-being,byemploymentstatus
(Self)employedpersons Unemployedpersons Homemakers Retiredpersons
AT 62.8 48.2 54.3 57.8
BE 66.9 58.6 69.6 65.0
BG 64.3 51.4 43.1 65.0
CY 62.1 48.9 48.3 50.1
CZ 63.1 52.7 55.2 64.2
DE 68.0 58.0 68.2 68.5
DK 67.0 68.3 69.9 75.2
EE 60.1 46.4 52.4 61.8
EL 62.5 64.1 54.5 56.6
ES 67.0 64.0 62.5 61.5
FI 66.2 67.3 64.1 63.9
FR 63.0 56.8 63.8 56.9
HR 58.2 52.4 50.8 55.7
HU 66.4 63.4 56.9 62.8
IE 69.2 58.2 63.8 67.0
IT 60.2 52.7 54.6 57.6
LT 60.6 55.9 49.6 63.1
LU 61.8 64.3 68.7 62.9
LV 57.8 43.7 49.9 55.9
MK* 58.6 52.9 46.2 46.5
MT 55.9 47.8 53.2 49.1
NL 67.8 52.6 70.8 62.8
NO 70.1 65.6 72.2 66.3
PL 61.4 59.3 53.5 59.5
PT 63.3 56.9 49.4 51.7
RO 60.5 46.7 41.9 53.2
SE 66.2 53.2 71.5 49.2
SI 60.4 67.4 56.6 59.5
SK 61.8 54.9 52.5 68.0
TR 49.3 38.2 46.8 42.5
UK 61.2 58.0 62.0 56.6
CC3 50.5 42.3 47.4 42.7
NMS12 62.0 56.9 50.3 57.2
EU15 64.4 58.1 63.0 60.2
EU27 63.9 57.8 60.0 59.9
Note: * MK refers to the former Yugoslav Republic of Macedonia.Source: EQLS (2007), authors’ calculations
As explained in the introduction to this chapter, inequalities in mental health across social classes have been the subject of extensive sociological and psychological research. Table 21 presents the average levels of mental well-being across five broad occupational groups on the basis of respondents’ current or most recent job. Although these groups could not be described as social classes, they do differ in
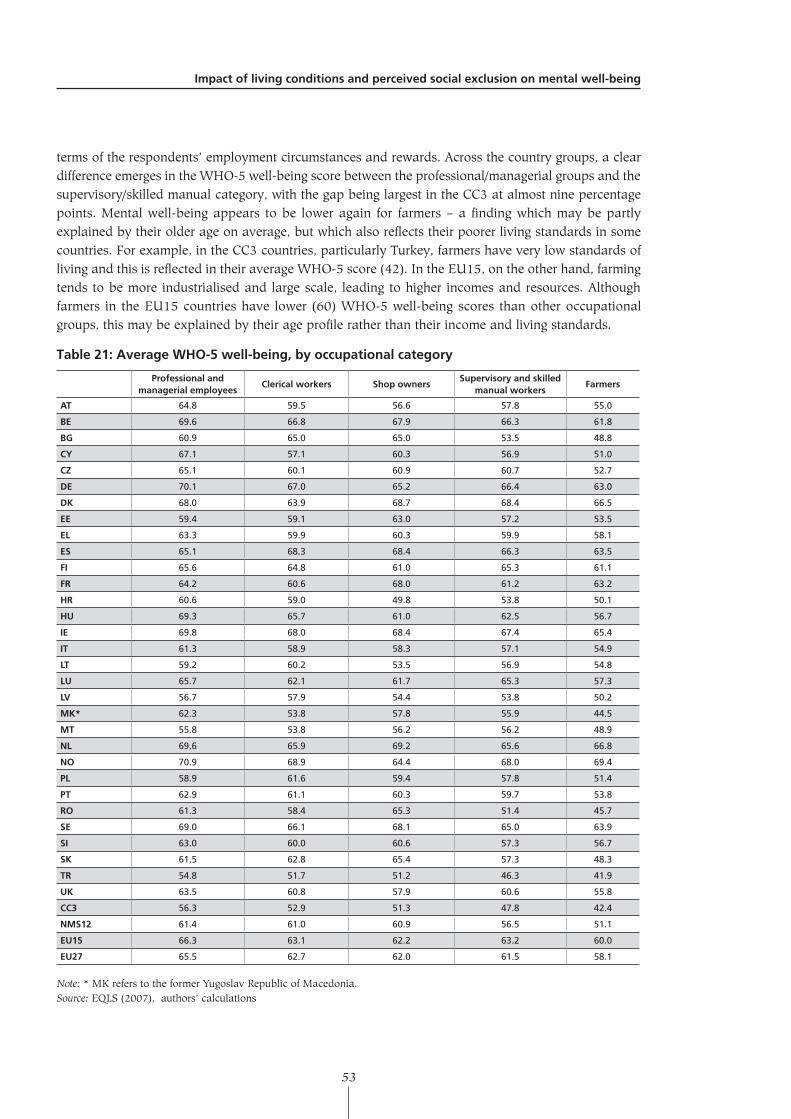
Impactoflivingconditionsandperceivedsocialexclusiononmentalwell-being
53
terms of the respondents’ employment circumstances and rewards. Across the country groups, a clear difference emerges in the WHO-5 well-being score between the professional/managerial groups and the supervisory/skilled manual category, with the gap being largest in the CC3 at almost nine percentage points. Mental well-being appears to be lower again for farmers – a finding which may be partly explained by their older age on average, but which also reflects their poorer living standards in some countries. For example, in the CC3 countries, particularly Turkey, farmers have very low standards of living and this is reflected in their average WHO-5 score (42). In the EU15, on the other hand, farming tends to be more industrialised and large scale, leading to higher incomes and resources. Although farmers in the EU15 countries have lower (60) WHO-5 well-being scores than other occupational groups, this may be explained by their age profile rather than their income and living standards.
Table21:AverageWHO-5well-being,byoccupationalcategory
Professionalandmanagerialemployees
Clericalworkers ShopownersSupervisoryandskilled
manualworkersFarmers
AT 64.8 59.5 56.6 57.8 55.0
BE 69.6 66.8 67.9 66.3 61.8
BG 60.9 65.0 65.0 53.5 48.8
CY 67.1 57.1 60.3 56.9 51.0
CZ 65.1 60.1 60.9 60.7 52.7
DE 70.1 67.0 65.2 66.4 63.0
DK 68.0 63.9 68.7 68.4 66.5
EE 59.4 59.1 63.0 57.2 53.5
EL 63.3 59.9 60.3 59.9 58.1
ES 65.1 68.3 68.4 66.3 63.5
FI 65.6 64.8 61.0 65.3 61.1
FR 64.2 60.6 68.0 61.2 63.2
HR 60.6 59.0 49.8 53.8 50.1
HU 69.3 65.7 61.0 62.5 56.7
IE 69.8 68.0 68.4 67.4 65.4
IT 61.3 58.9 58.3 57.1 54.9
LT 59.2 60.2 53.5 56.9 54.8
LU 65.7 62.1 61.7 65.3 57.3
LV 56.7 57.9 54.4 53.8 50.2
MK* 62.3 53.8 57.8 55.9 44.5
MT 55.8 53.8 56.2 56.2 48.9
NL 69.6 65.9 69.2 65.6 66.8
NO 70.9 68.9 64.4 68.0 69.4
PL 58.9 61.6 59.4 57.8 51.4
PT 62.9 61.1 60.3 59.7 53.8
RO 61.3 58.4 65.3 51.4 45.7
SE 69.0 66.1 68.1 65.0 63.9
SI 63.0 60.0 60.6 57.3 56.7
SK 61.5 62.8 65.4 57.3 48.3
TR 54.8 51.7 51.2 46.3 41.9
UK 63.5 60.8 57.9 60.6 55.8
CC3 56.3 52.9 51.3 47.8 42.4
NMS12 61.4 61.0 60.9 56.5 51.1
EU15 66.3 63.1 62.2 63.2 60.0
EU27 65.5 62.7 62.0 61.5 58.1
Note: * MK refers to the former Yugoslav Republic of Macedonia.Source: EQLS (2007), authors’ calculations
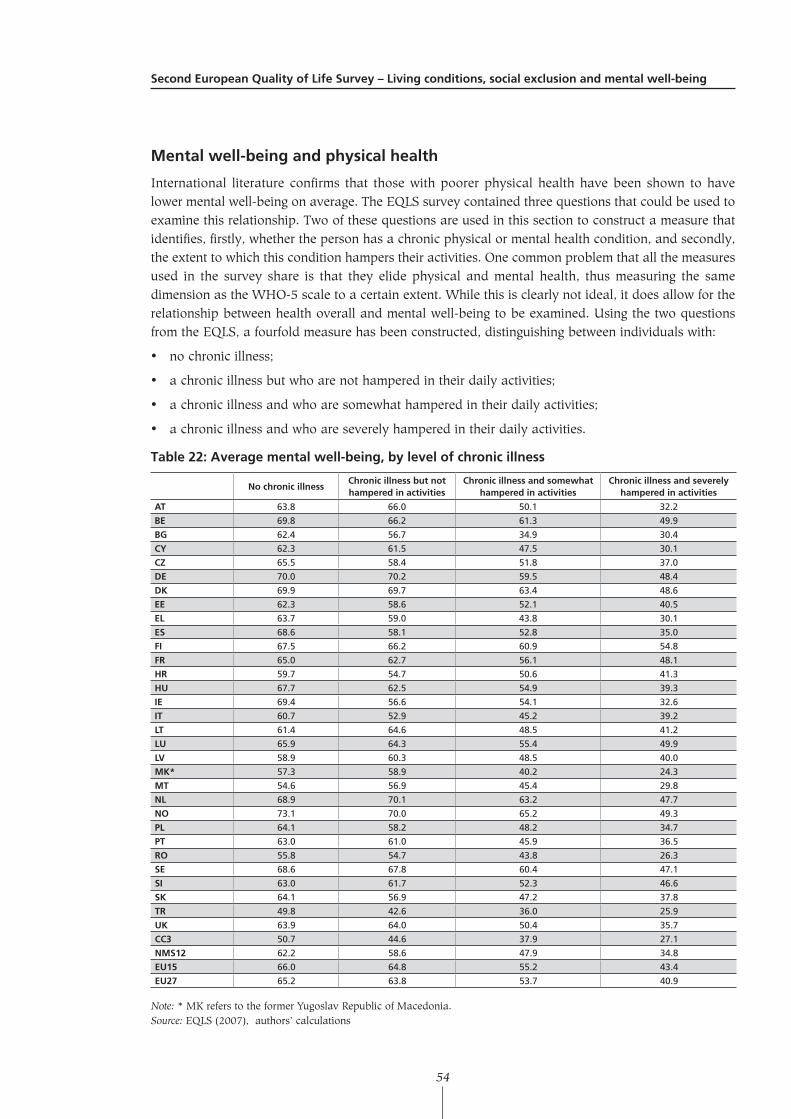
SecondEuropeanQualityofLifeSurvey–Livingconditions,socialexclusionandmentalwell-being
54
Mentalwell-beingandphysicalhealth
International literature confirms that those with poorer physical health have been shown to have lower mental well-being on average. The EQLS survey contained three questions that could be used to examine this relationship. Two of these questions are used in this section to construct a measure that identifies, firstly, whether the person has a chronic physical or mental health condition, and secondly, the extent to which this condition hampers their activities. One common problem that all the measures used in the survey share is that they elide physical and mental health, thus measuring the same dimension as the WHO-5 scale to a certain extent. While this is clearly not ideal, it does allow for the relationship between health overall and mental well-being to be examined. Using the two questions from the EQLS, a fourfold measure has been constructed, distinguishing between individuals with:
• no chronic illness;
• a chronic illness but who are not hampered in their daily activities;
• a chronic illness and who are somewhat hampered in their daily activities;
• a chronic illness and who are severely hampered in their daily activities.
Table22:Averagementalwell-being,bylevelofchronicillness
NochronicillnessChronicillnessbutnothamperedinactivities
Chronicillnessandsomewhathamperedinactivities
Chronicillnessandseverelyhamperedinactivities
AT 63.8 66.0 50.1 32.2
BE 69.8 66.2 61.3 49.9
BG 62.4 56.7 34.9 30.4
CY 62.3 61.5 47.5 30.1
CZ 65.5 58.4 51.8 37.0
DE 70.0 70.2 59.5 48.4
DK 69.9 69.7 63.4 48.6
EE 62.3 58.6 52.1 40.5
EL 63.7 59.0 43.8 30.1
ES 68.6 58.1 52.8 35.0
FI 67.5 66.2 60.9 54.8
FR 65.0 62.7 56.1 48.1
HR 59.7 54.7 50.6 41.3
HU 67.7 62.5 54.9 39.3
IE 69.4 56.6 54.1 32.6
IT 60.7 52.9 45.2 39.2
LT 61.4 64.6 48.5 41.2
LU 65.9 64.3 55.4 49.9
LV 58.9 60.3 48.5 40.0
MK* 57.3 58.9 40.2 24.3
MT 54.6 56.9 45.4 29.8
NL 68.9 70.1 63.2 47.7
NO 73.1 70.0 65.2 49.3
PL 64.1 58.2 48.2 34.7
PT 63.0 61.0 45.9 36.5
RO 55.8 54.7 43.8 26.3
SE 68.6 67.8 60.4 47.1
SI 63.0 61.7 52.3 46.6
SK 64.1 56.9 47.2 37.8
TR 49.8 42.6 36.0 25.9
UK 63.9 64.0 50.4 35.7
CC3 50.7 44.6 37.9 27.1
NMS12 62.2 58.6 47.9 34.8
EU15 66.0 64.8 55.2 43.4
EU27 65.2 63.8 53.7 40.9
Note: * MK refers to the former Yugoslav Republic of Macedonia.Source: EQLS (2007), authors’ calculations
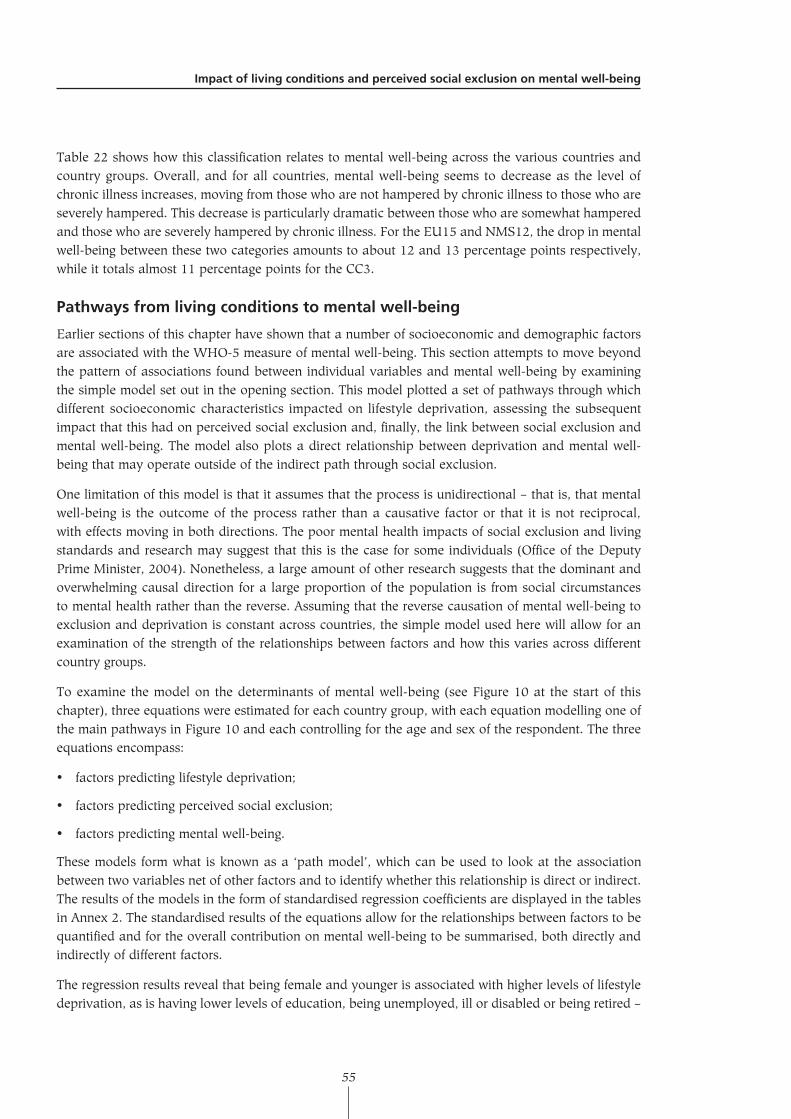
Impactoflivingconditionsandperceivedsocialexclusiononmentalwell-being
55
Table 22 shows how this classification relates to mental well-being across the various countries and country groups. Overall, and for all countries, mental well-being seems to decrease as the level of chronic illness increases, moving from those who are not hampered by chronic illness to those who are severely hampered. This decrease is particularly dramatic between those who are somewhat hampered and those who are severely hampered by chronic illness. For the EU15 and NMS12, the drop in mental well-being between these two categories amounts to about 12 and 13 percentage points respectively, while it totals almost 11 percentage points for the CC3.
Pathwaysfromlivingconditionstomentalwell-being
Earlier sections of this chapter have shown that a number of socioeconomic and demographic factors are associated with the WHO-5 measure of mental well-being. This section attempts to move beyond the pattern of associations found between individual variables and mental well-being by examining the simple model set out in the opening section. This model plotted a set of pathways through which different socioeconomic characteristics impacted on lifestyle deprivation, assessing the subsequent impact that this had on perceived social exclusion and, finally, the link between social exclusion and mental well-being. The model also plots a direct relationship between deprivation and mental well-being that may operate outside of the indirect path through social exclusion.
One limitation of this model is that it assumes that the process is unidirectional – that is, that mental well-being is the outcome of the process rather than a causative factor or that it is not reciprocal, with effects moving in both directions. The poor mental health impacts of social exclusion and living standards and research may suggest that this is the case for some individuals (Office of the Deputy Prime Minister, 2004). Nonetheless, a large amount of other research suggests that the dominant and overwhelming causal direction for a large proportion of the population is from social circumstances to mental health rather than the reverse. Assuming that the reverse causation of mental well-being to exclusion and deprivation is constant across countries, the simple model used here will allow for an examination of the strength of the relationships between factors and how this varies across different country groups.
To examine the model on the determinants of mental well-being (see Figure 10 at the start of this chapter), three equations were estimated for each country group, with each equation modelling one of the main pathways in Figure 10 and each controlling for the age and sex of the respondent. The three equations encompass:
• factors predicting lifestyle deprivation;
• factors predicting perceived social exclusion;
• factors predicting mental well-being.
These models form what is known as a ‘path model’, which can be used to look at the association between two variables net of other factors and to identify whether this relationship is direct or indirect. The results of the models in the form of standardised regression coefficients are displayed in the tables in Annex 2. The standardised results of the equations allow for the relationships between factors to be quantified and for the overall contribution on mental well-being to be summarised, both directly and indirectly of different factors.
The regression results reveal that being female and younger is associated with higher levels of lifestyle deprivation, as is having lower levels of education, being unemployed, ill or disabled or being retired –
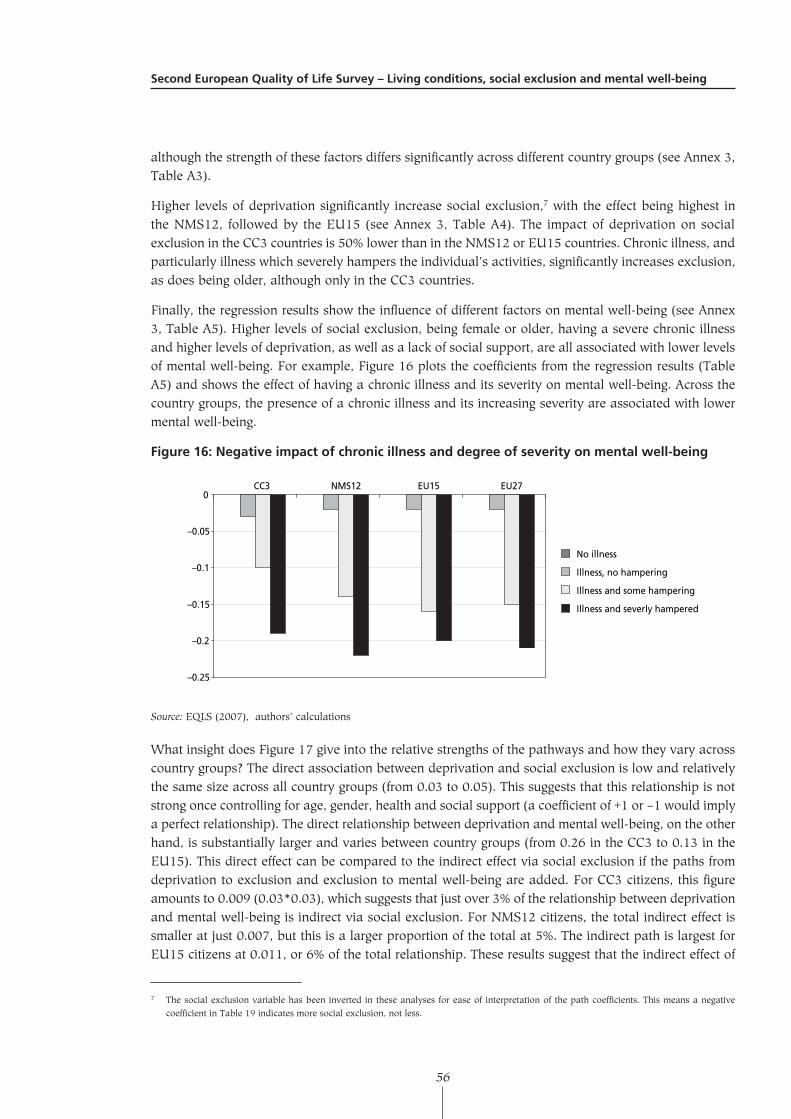
SecondEuropeanQualityofLifeSurvey–Livingconditions,socialexclusionandmentalwell-being
56
although the strength of these factors differs significantly across different country groups (see Annex 3, Table A3).
Higher levels of deprivation significantly increase social exclusion,7 with the effect being highest in the NMS12, followed by the EU15 (see Annex 3, Table A4). The impact of deprivation on social exclusion in the CC3 countries is 50% lower than in the NMS12 or EU15 countries. Chronic illness, and particularly illness which severely hampers the individual’s activities, significantly increases exclusion, as does being older, although only in the CC3 countries.
Finally, the regression results show the influence of different factors on mental well-being (see Annex 3, Table A5). Higher levels of social exclusion, being female or older, having a severe chronic illness and higher levels of deprivation, as well as a lack of social support, are all associated with lower levels of mental well-being. For example, Figure 16 plots the coefficients from the regression results (Table A5) and shows the effect of having a chronic illness and its severity on mental well-being. Across the country groups, the presence of a chronic illness and its increasing severity are associated with lower mental well-being.
Figure16:Negativeimpactofchronicillnessanddegreeofseverityonmentalwell-being
–0.25
–0.2
–0.15
–0.1
–0.05
0CC3 NMS12 EU15 EU27
No illness
Illness, no hampering
Illness and some hampering
Illness and severly hampered
Source: EQLS (2007), authors’ calculations
What insight does Figure 17 give into the relative strengths of the pathways and how they vary across country groups? The direct association between deprivation and social exclusion is low and relatively the same size across all country groups (from 0.03 to 0.05). This suggests that this relationship is not strong once controlling for age, gender, health and social support (a coefficient of +1 or –1 would imply a perfect relationship). The direct relationship between deprivation and mental well-being, on the other hand, is substantially larger and varies between country groups (from 0.26 in the CC3 to 0.13 in the EU15). This direct effect can be compared to the indirect effect via social exclusion if the paths from deprivation to exclusion and exclusion to mental well-being are added. For CC3 citizens, this figure amounts to 0.009 (0.03*0.03), which suggests that just over 3% of the relationship between deprivation and mental well-being is indirect via social exclusion. For NMS12 citizens, the total indirect effect is smaller at just 0.007, but this is a larger proportion of the total at 5%. The indirect path is largest for EU15 citizens at 0.011, or 6% of the total relationship. These results suggest that the indirect effect of
7 The social exclusion variable has been inverted in these analyses for ease of interpretation of the path coefficients. This means a negative coefficient in Table 19 indicates more social exclusion, not less.
Impactoflivingconditionsandperceivedsocialexclusiononmentalwell-being
57
deprivation via social exclusion is relatively unimportant in determining mental well-being, whereas the direct effect is significant.
Figure17:Determinantsofmentalwell-being–pathcoefficients
CC3: .03EU15: .22
Highesteducation
Employmentstatus
Lifestyledeprivation
Socialexclusion
Mentalwell-being
Socialsupport
Physicalhealth
Income
CC3.03EU15: .05
CC3: .26EU15: .13
Source: EQLS (2007), authors’ overview
Interestingly, Figure 17 confirms that the direct effect of social exclusion varies significantly in importance across the country groups. In the CC3, the coefficient is 0.03, compared with 0.17 in the NMS12 and 0.22 in the EU15. Taken together with the results for deprivation, this could suggest that low levels of material resources are the main issue in the CC3 and, to a lesser extent, in the NMS12; in the EU15, on the other hand, perceived social exclusion and social participation appear to be relatively more important.
Conclusions
This chapter has examined the patterning of mental well-being in the EQLS survey. The social structuring of psychological distress has been the subject of a substantial body of literature and the results outlined in this report confirm the importance of demographic variables, such as gender, and socioeconomic differences, such as income and lifestyle deprivation. There is a clear gradient across social groups, with the more disadvantaged individuals reporting lower levels of mental well-being – although the relative impact of disadvantage varies significantly between countries and country groups.
Although the reciprocal relationship between mental health, social exclusion and socioeconomic conditions cannot be ignored, it is useful to examine the relationship between the variables and to try to infer the importance of the direct effects of living conditions on mental health relative to the indirect effects via perceived social exclusion. Analyses using path analysis show that the direct association between lifestyle deprivation and mental well-being is more important than the indirect path through perceived social exclusion, although this varies significantly by country group. Across all country groups, the direct association is strongest, although a strong indirect association is also evident in the EU15. Since these countries tend to be wealthier, with less unemployment and deprivation and with more developed welfare systems, this could suggest that social integration becomes more important as country wealth increases.

59
6Conclusions
The past two decades have witnessed a transformation in the European debate regarding social progress and how it is measured. In particular, the concept of social exclusion has increasingly displaced the concept of poverty within academic debate and EU policy discussion on social vulnerability and disadvantage. Unlike the concept of poverty, social exclusion has to be seen as both an objective and subjective phenomenon. Therefore, the analyses in this report examine processes leading to a sense of exclusion, along with factors mediating these processes and the impact of perceived social exclusion on well-being. The measure of perceived social exclusion used in the analyses is a composite measure constructed from four different items that explore different aspects of social exclusion. The analyses begin from the position that three key processes promote social integration at the individual level: firstly, attachment to or access to the labour market; secondly, the provision of basic essentials in terms of income and the ability to lead a lifestyle acceptable to the majority of people within a country; and thirdly, social support and membership of a family unit or small group of some form.
Overall, the results show that a majority of European citizens feel socially integrated, with about 86% of respondents showing scores that indicate social integration. Levels of perceived exclusion vary significantly between the countries and country groups under examination, and it is clear that citizens of the NMS12 and CC3 are less likely than the EU15 respondents to perceive themselves as being integrated. Bulgarian respondents are particularly likely to view themselves as being excluded, as are respondents from Croatia, the former Yugoslav Republic of Macedonian and Romania, although to a lesser degree. At the other end of the scale, respondents from Denmark, Norway and Sweden are the least likely to perceive themselves as being socially excluded, with Finland not falling far behind.
The fact that the average perceived integration was highest in the Scandinavian states is not accidental, as analyses in Chapter 3 clearly show that a lower GDP per head of population as well as higher unemployment and more widespread poverty in a country are associated with a higher level of perceived social exclusion. However, the relationship between a country’s wealth and perceived social exclusion is by no means deterministic and some countries are clearly more successful at fostering integration at a given level of wealth than others. For example, although Finland, the Netherlands and Sweden are comparatively wealthy countries, their level of GDP is reasonably close to countries such as Austria, Belgium, France and the UK; nonetheless, the latter set of countries have significantly higher average levels of exclusion. The same patterns can be observed for the overall rate of unemployment, where, once again, the former countries manage to have higher levels of unemployment with greater integration. The reasons for this are likely to be complex and may be related to historical processes; however, it is also interesting that these countries have lower levels of income inequality and more generous and inclusive social welfare systems.
Analyses at the individual level confirm the strong association between living conditions and perceived social exclusion. Perceived social exclusion increases at the individual level if the person has a lower income, is unemployed or experiencing economic strain, regardless of the particular country. The person’s level of lifestyle deprivation is also crucial and appeared to be one of the most powerful predictors of lower integration. Since factors such as being in an unskilled manual occupation, having low levels of education or being retired or ill/disabled strongly influence income and deprivation level, it is not surprising that these factors are also strongly predictive. These results confirm those of previous academic research and EU policy documentation, underlining the need to promote education and skills learning, to increase access to employment and to support living standards for those who cannot work.
However, living conditions are not the only determinants of perceived social exclusion. Chapter 4 examined the role that social support systems play in buffering the impact of poor living conditions.
SecondEuropeanQualityofLifeSurvey–Livingconditions,socialexclusionandmentalwell-being
60
The results reveal wide variation between the countries examined in this study in terms of the perceived ability of European citizens to obtain financial support. Although almost 85% of respondents report that they could get financial support in an emergency, this proportion tends to be lower in the CC3 and NMS12 countries compared with the EU15 countries. There is also wide variation in the perceived role of the family in providing financial support, with less than 60% of respondents viewing the family as the main source of support in the CC3 and NMS12 countries compared with 70% of citizens in the EU15.
There is rather less divergence between countries and country groups in terms of the perceived availability of moral support and the major source of this support, with the family being seen as the primary source by around two-thirds of European citizens in all country groups. This is not uniform across the countries: for instance, France and the Czech Republic stand out as countries where relatively fewer respondents perceive the family as a source of moral support. These patterns do not lend themselves to easy explanations based on country wealth and political or institutional structures. Instead, they are more indicative of different cultural histories and structures, which operate alongside different expectations of the role of family and others in providing support.
In terms of the notion of social support as a buffering process, the results show that individuals who have access to financial or moral support tend to have lower levels of perceived social exclusion, even at the same levels of lifestyle deprivation. This underlines the importance of social networks and support in generating social cohesion and better individual well-being. At the same time, it suggests that policy development should focus on the factors that promote social support as well as dealing with the processes that create poorer living conditions.
The final chapter of the report examines the link between living conditions, social exclusion and mental well-being. As the analysis of social exclusion in Chapter 3 demonstrates, higher levels of wealth in the form of GDP are associated with higher levels of mental well-being at the aggregate level across the countries. This association also appears to be strong at the individual level, with higher income being associated with better mental well-being. The strong association between mental well-being and resources and wealth means that citizens of the CC3 and NMS12 have significantly lower levels of mental well-being, on average, compared with those in the EU15. However, the results also point to higher levels of mental well-being at any given level of deprivation among respondents in the EU15 compared with those in the CC3 and NMS12. This suggests that other factors are at play in the EU15 countries. The report has provided evidence of one such factor in the form of social support, which was more likely to be available to citizens in the EU15. Nevertheless, it is also possible that the institutional environment in these countries is more conducive to better outcomes.
61
Bibliography
Allardt, E., ‘Dimensions of welfare in a comparative Scandinavian study’, Acta Sociologica, Vol. 19, No. 3, 1976, pp. 227–39.
Allardt, E., ‘Having, loving, being: An alternative to the Swedish model of welfare research’, in Nussbaum, M. and Sen, A. (eds.), The quality of life, Oxford, Clarendon Press, 1993, pp. 88–94.
Atkinson, A.B., ‘Social exclusion, poverty and unemployment’, in Atkinson, A.B. and Hills, J. (eds.), Exclusion, employment and opportunity, Centre for Analysis of Social Exclusion (CASE) Paper 4, London, London School of Economics, 1998.
Atkinson, A.B., Cantillon, B., Marlier, E. and Nolan, B., Social indicators: The EU and social inclusion, Oxford, Oxford University Press, 2002.
Bech, P., ‘Measuring the dimensions of psychological general well-being by the WHO-5’, Quality of Life Newsletter, No. 32, 2004, pp. 15–16.
Berger-Schmitt, R. and Noll, H.H., Conceptual framework and structure of a European system of social indicators, EuReporting Working Paper No. 9, Mannheim, Leibniz Institute for the Social Sciences, Social Monitoring and Social Change, 2000.
Berkman, L.F. and Syme, S.L., ‘Social networks, host resistance and mortality: A nine-year follow-up of Alameda County residents’, American Journal of Epidemiology, Vol. 109, No. 2, 1979, pp. 186–204.
Blossfeld, H.P., Klijing, E., Mills, M. and Kurz, K., Globalisation, uncertainty and youth in society, London, Routledge, 2005.
Böhnke, P., European Foundation for the Improvement of Living and Working Conditions (Eurofound), Perceptions of social integration and exclusion in an enlarged Europe, Luxembourg, Office for Official Publications of the European Communities, 2004, available online at: http://www.eurofound.europa.eu/publications/htmlfiles/ef03106.htm.
Böhnke, P., Eurofound, First European Quality of Life Survey: Life satisfaction, happiness and sense of belonging, Luxembourg, Office for Official Publications of the European Communities, 2005, available online at: http://www.eurofound.europa.eu/publications/htmlfiles/ef0591.htm.
Böhnke, P., Feeling left out: Patterns of social integration and exclusion, in Alber, J., Fahey, T. and Saraceno, C. (eds.), Handbook of quality of life in the enlarged European Union, London, Routledge, 2007.
Böhnke, P., ‘Are the poor socially integrated? The link between poverty and social support in different welfare regimes’, Journal of European Social Policy, Vol. 18, No. 2, 2008, pp. 133–50.
Brunner, E.J., ‘Stress and the biology of inequality’, British Medical Journal, Vol. 314, 1997, pp. 1472–6.
Chiesi, A.M., ‘Social cohesion and related concepts’, in Genov, N. (ed.), Advances in sociological knowledge, Paris, International Social Science Council, 2002.
Davey-Smith, G., Blane, D. and Bartley, M., ‘Explanations for socioeconomic differentials in mortality: Evidence from Britain and elsewhere’, European Journal of Public Health, Vol. 4, No. 2, 1994, pp. 131–44.
SecondEuropeanQualityofLifeSurvey–Livingconditions,socialexclusionandmentalwell-being
62
Erikson, R. and Aberg, R. (eds.), Welfare in transition: Living conditions in Sweden 1968–1981, Oxford, Clarendon Press, 1987.
European Commission, Medium-term action programme to combat social exclusion and promote solidarity. Report on the implementation of the Community programme for the social and economic integration of the least privileged groups, COM (93) 435 final, Brussels, September 1993.
European Commission, A new partnership for cohesion: Convergence, competitiveness, cooperation. Third report on economic and social cohesion, Luxembourg, Office for Official Publications of the European Communities, 2004, available online at: http://ec.europa.eu/regional_policy/sources/docoffic/official/reports/cohesion3/cohesion3_en.htm.
Fahey, T., Nolan, B. and Whelan, C.T., Eurofound, Monitoring quality of life in Europe, Luxembourg, Office for Official Publications of the European Communities, 2003, available online at: http://www.eurofound.europa.eu/publications/htmlfiles/ef02108.htm.
Friedkin, N.E., ‘Social cohesion’, Annual Review of Sociology, Vol. 30, No. 1, 2004, pp. 409–25.
Gallie, D. and Paugam, S. (eds.), Welfare regimes and the experience of unemployment in Europe, Oxford, Oxford University Press, 2000.
Henkel, V., Mergl, R., Kohnen, R., Maier, W., Möller, H.-J. and Hegerl, U., ‘Identifying depression in primary care: A comparison of different methods in a prospective cohort study’, British Medical Journal, Vol. 326, 2003, pp. 200–201.
Hills, J., ‘Social exclusion, income dynamics and public policy’, Annual Sir Charles Carter Lecture, Belfast, Northern Ireland Economic Development Office, 1999.
Iacovou, M. and Berthoud, R., Social Europe: Living standards and welfare states, London, Edward Elgar Publishing, 2004.
Kawachi, I. and Berkman, L., ‘Social cohesion, social capital and health’, in Kawachi, I. and Berkman, L. (eds.), Social epidemiology, Milton Keynes, Open University Press, 2000, pp. 174–90.
Kleinman, M., Include me out? The new politics of place and poverty, CASE Paper 11, London, London School of Economics, 1998.
Kohn, M. and Schooler, C., ‘Class, occupation and orientation’, American Sociological Review, Vol. 34, 1969, pp. 659–78.
Kronauer, M., ‘“Social exclusion” and “underclass” – New concepts for the analysis of poverty’, in Andreß, H.-J. (ed.), Empirical poverty research in a comparative perspective, Aldershot, Ashgate, 1998.
Layte, R. and Whelan, C.T., ‘Explaining social class inequalities in smoking: The role of education, self-efficacy and deprivation’, European Sociological Review, Vol. 24, 2008.
Lockwood, D., ‘Social integration and system integration’, in Zollschan, G.K. and Hirsch, W. (eds.), Explorations in social change, London, Routledge, 1964, pp. 244–57.
Lockwood, D., ‘Civic integration and social cohesion’, in Gough, I. and Olofsson, G. (eds.), Capitalism and social cohesion: Essays on exclusion and integration, London, Macmillan Press, 1999, pp. 63–84.
Bibliography
63
Löwe, B., Spitzer, R.L., Grafe, K., Kroenke, K., Quenter, A., Zipfel, S., Bucholz, C., Witte, S. and Herzog, W., ‘Comparative validity of three screening questionnaires for DSM-IV depressive disorders and physicians’ diagnoses’, Journal of Affective Disorders, Vol. 78, No. 2, 2004, pp. 131–40.
Mack, J. and Lansley, S., Poor Britain, London, Allen and Unwin, 1985.
Mackenbach, J. and Bakker, M., Reducing inequalities in health: A European perspective, London, Routledge, 2002.
Mirowsky, J. and Ross, C.E., Social causes of psychological distress, New Jersey, Aldine Transaction, 2003.
Nolan, B. and Whelan, C.T., ‘On the multidimensionality of poverty and social exclusion’, in Micklewright, J. and Jenkins, S. (eds.), Poverty and inequality: New directions, Oxford, Oxford University Press, 2007.
Nordenmark, M., Strandh, M. and Layte, R., ‘The impact of unemployment benefit system on the mental well-being of the unemployed in Sweden, Ireland and Great Britain’, European Societies, Vol. 8, No. 1, 2006, pp. 83–110.
Office of the Deputy Prime Minister, Mental health and social exclusion: Social exclusion unit report, London, Social Exclusion Unit, June 2004.
Oxman, T.E., Berkman, L.F., Kasl, S. and Freeman, D.H., ‘Social support and depressive symptoms in the elderly’, American Journal of Epidemiology, Vol. 135, No. 4, 1992, pp. 356–68.
Paugam, S., ‘The spiral of precariousness: A multi-dimensional approach to the process of social disqualification in France’, in Room, G.J. (ed.), Beyond the threshold, Bristol, The Policy Press, 1995.
Paugam, S., ‘Poverty and social disqualification: A comparative analysis of cumulative social disadvantage in Europe’, in Journal of European Social Policy, Vol. 6, No. 4, 1996, pp. 287–303.
Pichler, F. and Wallace, C., ‘Patterns of formal and informal social capital in Europe’, European Sociological Review, Vol. 23, No. 2, 2007, pp. 423–35.
Putnam, R.D., Bowling alone: The decline and revival of American community, New York, Simon and Schuster, 2000.
Rasul, F., Stansfeld, S., Hart, C., Gillis, C. and Smith, G., ‘Psychological distress, physical illness and mortality risk’, Journal of Psychosomatic Research, Vol. 57, No. 3, 2004, pp. 231–6.
Room, G.J., ‘Poverty and social exclusion: The new European agenda for policy and research’, in Room, G.J. (ed.), Beyond the threshold, Bristol, The Policy Press, 1995.
Schaufeli, W.B. and Van Yperen, N.W., ‘Unemployment and psychological distress among graduates: A longitudinal study’, Journal of Occupational and Organizational Psychology, Vol. 65, No. 4, 1992, pp. 291–305.
Sen, A., Social exclusion: Concept, application and scrutiny, Social Development Papers No. 1, Manila, Office of Environment and Social Development, Asian Development Bank, 2000.
Silver, H., ‘Social exclusion and social solidarity: Three paradigms’, International Labour Review, Vol. 133, No. 5–6, 1994, pp. 531–78.
SecondEuropeanQualityofLifeSurvey–Livingconditions,socialexclusionandmentalwell-being
64
Silver, H., ‘Reconceptualizing social disadvantage: Three paradigms of social exclusion’, in Rodgers, G., Gore, C. and Figuieredo, J.B. (eds.), Social exclusion: Rhetoric, reality, responses, Geneva, International Institute for Labour Studies (IILS), International Labour Organization, 1996.
Streiner, D.L. and Norman, G.R., Health measurement scales: A practical guide to their development and use, Oxford, Oxford University Press, 1995.
Townsend, P., Poverty in the United Kingdom, Harmondsworth, Penguin, 1979.
Ullah, P., Banks, M. and Warr, P., ‘Social support, social pressures and psychological distress during unemployment’, Psychological Medicine, Vol. 15, No. 2, 1985, pp. 283–95.
Whelan, C.T., ‘The role of sense of control and social support in mediating the impact of psychological distress: A test of the hypothesis of functional substitution’, The Economic and Social Review, Vol. 23, No. 2, 1992, pp. 167–82.
Whelan, C.T., ‘The role of social support in mediating the psychological consequences of economic stress’, Sociology of Health and Illness, Vol. 15, No. 1, 1993, pp. 86–101.
Whelan, C.T., Hannan, D.F. and Creighton, S., ‘Unemployment, poverty and psychological distress’, General Research Series, Paper No. 150, Dublin, Economic and Social Research Institute, 1991.
Whelan, C.T., Layte, R., Maître, B. and Nolan, B., ‘Income, deprivation and economic strain: An analysis of the European Community Household Panel Survey’, European Sociological Review, Vol. 17, No. 4, 2001, pp. 357–72.
Whelan, C.T. and Maître, B., ‘Economic vulnerability, multi-dimensional deprivation and social cohesion in an enlarged European Union’, International Journal of Comparative Sociology, Vol. 46, No. 3, 2005, pp. 215–39.
Whelan, C.T. and Maître, B., ‘Income, deprivation and economic stress in an enlarged European Union’, Social Indicators Research, Vol. 83, No. 2, 2007, pp. 309–329.
Wilkinson, R., Unhealthy societies, London, Routledge, 1996.
Wilkinson, R. and Pickett, K., The spirit level: Why more equal societies almost always do better, London, Allen Lane, 2009.
World Health Organization (WHO), Use of well-being measures in primary healthcare – The DepCare Project Health for All, Target 12, Geneva, WHO, 1998.
65
Annex 1: Glossary of terms
‘Atriskofincomepoverty’
A person is at risk of income poverty when their net household income is below a poverty line set at 60% of the median equivalised income across individuals in their society.
Economicstress
An individual is said to be experiencing economic stress if they are experiencing difficulty or great difficulty making ends meet on the household’s total income from all sources.
EQLS
The European Quality of Life Survey carried out by the European Foundation for the Improvement of Living and Working Conditions (Eurofound).
Lifestyledeprivation
A person is experiencing lifestyle deprivation if they do not own specific items or carry out specific activities that are seen as essential by a majority of individuals across their society because they cannot afford them. In this report, the following items are used:
• an adequately warm home;
• paying for a week’s annual holiday;
• replacing any worn-out furniture;
• a meal with meat, chicken or fish every second day;
• buying new rather than second-hand clothes;
• having friends or family for a drink or meal at least once a month.
Mentalwell-being
A generalised measure of an individual’s mood, vitality and general interest over a specific time period. It is measured in this report using the World Health Organization’s five-item measure, which uses the following items:
1. ‘I have felt cheerful and in good spirits’
2. ‘I have felt calm and relaxed’
3. ‘I have felt active and vigorous’
4. ‘I woke up feeling fresh and rested’
5. ‘My daily life has been filled with things that interest me’
Multivariatemodel
A statistical technique for establishing the impact of one factor (e.g. age) controlling for another (e.g. sex).
Pathmodel
A theoretical model that describes the ‘paths’ or processes through which factors (e.g. deprivation) influence an outcome (e.g. mental well-being) either directly, or indirectly via another factor (e.g. perceived social exclusion). The explanatory value of the theoretical model can be tested by specifying the relationships in a statistical model.
SecondEuropeanQualityofLifeSurvey–Livingconditions,socialexclusionandmentalwell-being
66
Perceivedsocialexclusion
The respondent’s evaluation that they are excluded from the normal life of society. This is measured by level of agreement with the following statements:
• ‘I feel left out of society’
• ‘Life has become so complicated today that I almost can’t find my way’
• ‘I don’t feel that the value of what I do is recognised by others’
• ‘Some people look down on me because of my job situation or income’
Principaleconomicstatus
An individual’s principal economic status is their main perceived economic status, that is, whether they are employed, self-employed, unemployed, a full-time carer in the home or retired.
Regressioncoefficient
The amount by which an individual or household characteristic (e.g. perceived social exclusion) increases or decreases given the effect of another characteristic (e.g. the person’s sex), controlling for other factors (e.g country of residence).
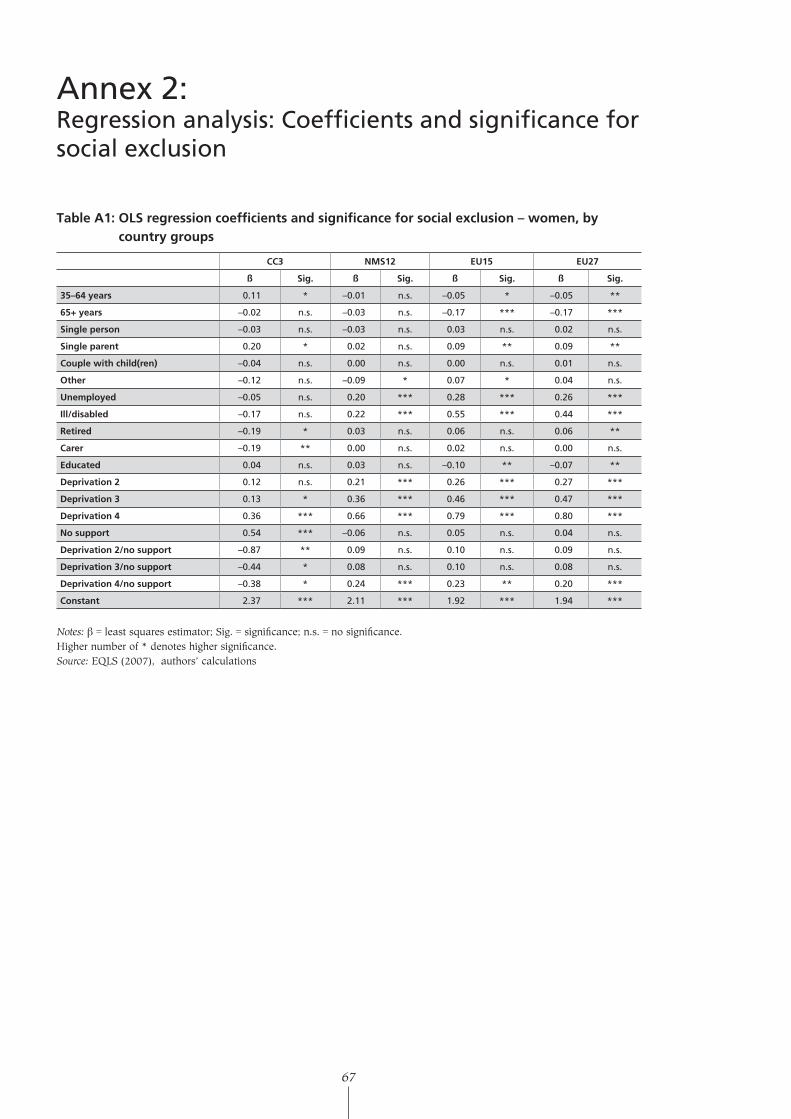
67
Annex 2: Regression analysis: Coefficients and significance for social exclusion
TableA1:OLSregressioncoefficientsandsignificanceforsocialexclusion–women,bycountrygroups
CC3 NMS12 EU15 EU27
ß Sig. ß Sig. ß Sig. ß Sig.
35–64years 0.11 * –0.01 n.s. –0.05 * –0.05 **
65+years –0.02 n.s. –0.03 n.s. –0.17 *** –0.17 ***
Singleperson –0.03 n.s. –0.03 n.s. 0.03 n.s. 0.02 n.s.
Singleparent 0.20 * 0.02 n.s. 0.09 ** 0.09 **
Couplewithchild(ren) –0.04 n.s. 0.00 n.s. 0.00 n.s. 0.01 n.s.
Other –0.12 n.s. –0.09 * 0.07 * 0.04 n.s.
Unemployed –0.05 n.s. 0.20 *** 0.28 *** 0.26 ***
Ill/disabled –0.17 n.s. 0.22 *** 0.55 *** 0.44 ***
Retired –0.19 * 0.03 n.s. 0.06 n.s. 0.06 **
Carer –0.19 ** 0.00 n.s. 0.02 n.s. 0.00 n.s.
Educated 0.04 n.s. 0.03 n.s. –0.10 ** –0.07 **
Deprivation2 0.12 n.s. 0.21 *** 0.26 *** 0.27 ***
Deprivation3 0.13 * 0.36 *** 0.46 *** 0.47 ***
Deprivation4 0.36 *** 0.66 *** 0.79 *** 0.80 ***
Nosupport 0.54 *** –0.06 n.s. 0.05 n.s. 0.04 n.s.
Deprivation2/nosupport –0.87 ** 0.09 n.s. 0.10 n.s. 0.09 n.s.
Deprivation3/nosupport –0.44 * 0.08 n.s. 0.10 n.s. 0.08 n.s.
Deprivation4/nosupport –0.38 * 0.24 *** 0.23 ** 0.20 ***
Constant 2.37 *** 2.11 *** 1.92 *** 1.94 ***
Notes: β = least squares estimator; Sig. = significance; n.s. = no significance.Higher number of * denotes higher significance.Source: EQLS (2007), authors’ calculations
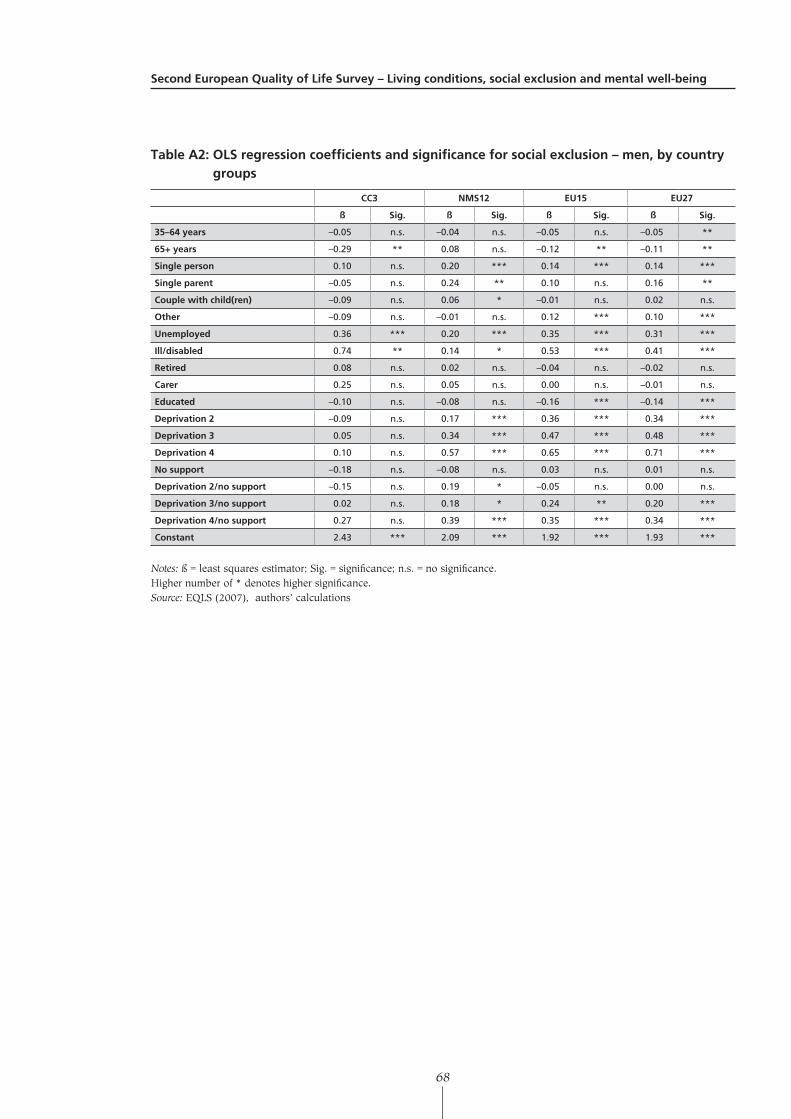
SecondEuropeanQualityofLifeSurvey–Livingconditions,socialexclusionandmentalwell-being
68
TableA2:OLSregressioncoefficientsandsignificanceforsocialexclusion–men,bycountrygroups
CC3 NMS12 EU15 EU27
ß Sig. ß Sig. ß Sig. ß Sig.
35–64years –0.05 n.s. –0.04 n.s. –0.05 n.s. –0.05 **
65+years –0.29 ** 0.08 n.s. –0.12 ** –0.11 **
Singleperson 0.10 n.s. 0.20 *** 0.14 *** 0.14 ***
Singleparent –0.05 n.s. 0.24 ** 0.10 n.s. 0.16 **
Couplewithchild(ren) –0.09 n.s. 0.06 * –0.01 n.s. 0.02 n.s.
Other –0.09 n.s. –0.01 n.s. 0.12 *** 0.10 ***
Unemployed 0.36 *** 0.20 *** 0.35 *** 0.31 ***
Ill/disabled 0.74 ** 0.14 * 0.53 *** 0.41 ***
Retired 0.08 n.s. 0.02 n.s. –0.04 n.s. –0.02 n.s.
Carer 0.25 n.s. 0.05 n.s. 0.00 n.s. –0.01 n.s.
Educated –0.10 n.s. –0.08 n.s. –0.16 *** –0.14 ***
Deprivation2 –0.09 n.s. 0.17 *** 0.36 *** 0.34 ***
Deprivation3 0.05 n.s. 0.34 *** 0.47 *** 0.48 ***
Deprivation4 0.10 n.s. 0.57 *** 0.65 *** 0.71 ***
Nosupport –0.18 n.s. –0.08 n.s. 0.03 n.s. 0.01 n.s.
Deprivation2/nosupport –0.15 n.s. 0.19 * –0.05 n.s. 0.00 n.s.
Deprivation3/nosupport 0.02 n.s. 0.18 * 0.24 ** 0.20 ***
Deprivation4/nosupport 0.27 n.s. 0.39 *** 0.35 *** 0.34 ***
Constant 2.43 *** 2.09 *** 1.92 *** 1.93 ***
Notes: ß = least squares estimator; Sig. = significance; n.s. = no significance.Higher number of * denotes higher significance.Source: EQLS (2007), authors’ calculations
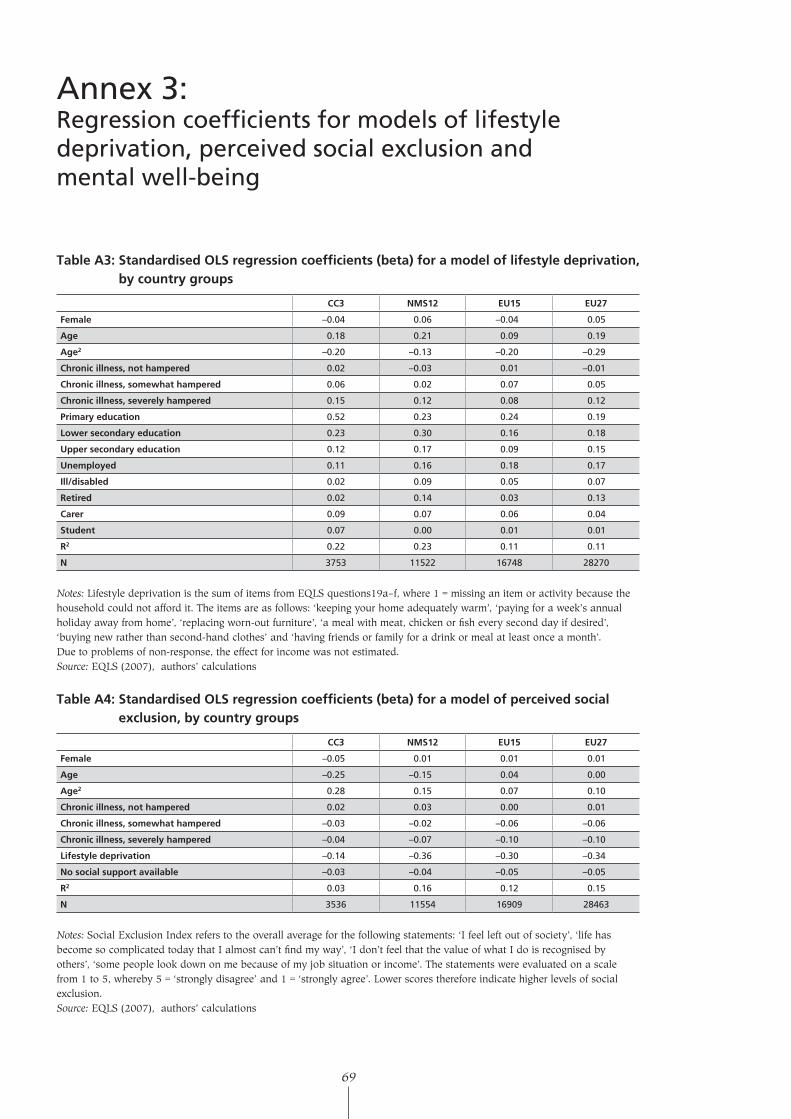
69
Annex 3: Regression coefficients for models of lifestyle deprivation, perceived social exclusion and mental well-being
TableA3:StandardisedOLSregressioncoefficients(beta)foramodeloflifestyledeprivation,bycountrygroups
CC3 NMS12 EU15 EU27
Female –0.04 0.06 –0.04 0.05
Age 0.18 0.21 0.09 0.19
Age2 –0.20 –0.13 –0.20 –0.29
Chronicillness,nothampered 0.02 –0.03 0.01 –0.01
Chronicillness,somewhathampered 0.06 0.02 0.07 0.05
Chronicillness,severelyhampered 0.15 0.12 0.08 0.12
Primaryeducation 0.52 0.23 0.24 0.19
Lowersecondaryeducation 0.23 0.30 0.16 0.18
Uppersecondaryeducation 0.12 0.17 0.09 0.15
Unemployed 0.11 0.16 0.18 0.17
Ill/disabled 0.02 0.09 0.05 0.07
Retired 0.02 0.14 0.03 0.13
Carer 0.09 0.07 0.06 0.04
Student 0.07 0.00 0.01 0.01
R2 0.22 0.23 0.11 0.11
N 3753 11522 16748 28270
Notes: Lifestyle deprivation is the sum of items from EQLS questions19a–f, where 1 = missing an item or activity because the household could not afford it. The items are as follows: ‘keeping your home adequately warm’, ‘paying for a week’s annual holiday away from home’, ‘replacing worn-out furniture’, ‘a meal with meat, chicken or fish every second day if desired’, ‘buying new rather than second-hand clothes’ and ‘having friends or family for a drink or meal at least once a month’.Due to problems of non-response, the effect for income was not estimated.Source: EQLS (2007), authors’ calculations
TableA4:StandardisedOLSregressioncoefficients(beta)foramodelofperceivedsocialexclusion,bycountrygroups
CC3 NMS12 EU15 EU27
Female –0.05 0.01 0.01 0.01
Age –0.25 –0.15 0.04 0.00
Age2 0.28 0.15 0.07 0.10
Chronicillness,nothampered 0.02 0.03 0.00 0.01
Chronicillness,somewhathampered –0.03 –0.02 –0.06 –0.06
Chronicillness,severelyhampered –0.04 –0.07 –0.10 –0.10
Lifestyledeprivation –0.14 –0.36 –0.30 –0.34
Nosocialsupportavailable –0.03 –0.04 –0.05 –0.05
R2 0.03 0.16 0.12 0.15
N 3536 11554 16909 28463
Notes: Social Exclusion Index refers to the overall average for the following statements: ‘I feel left out of society’, ‘life has become so complicated today that I almost can’t find my way’, ‘I don’t feel that the value of what I do is recognised by others’, ‘some people look down on me because of my job situation or income’. The statements were evaluated on a scale from 1 to 5, whereby 5 = ‘strongly disagree’ and 1 = ‘strongly agree’. Lower scores therefore indicate higher levels of social exclusion. Source: EQLS (2007), authors’ calculations
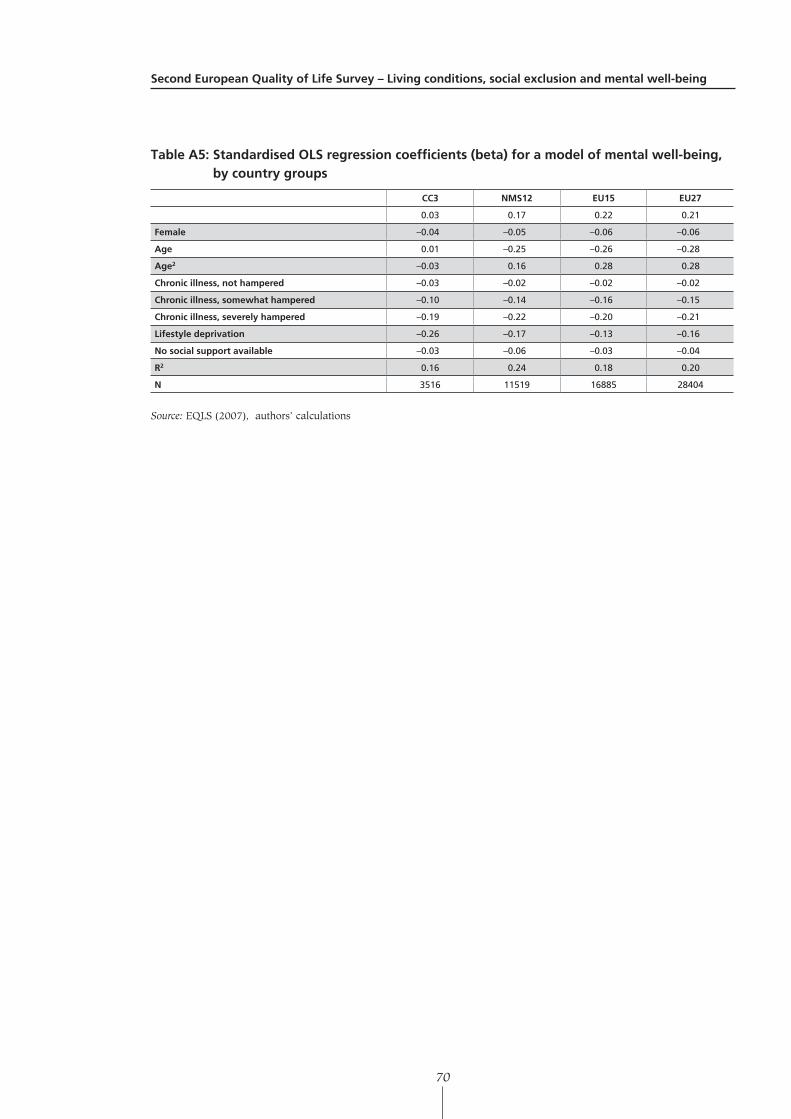
SecondEuropeanQualityofLifeSurvey–Livingconditions,socialexclusionandmentalwell-being
70
TableA5:StandardisedOLSregressioncoefficients(beta)foramodelofmentalwell-being,bycountrygroups
CC3 NMS12 EU15 EU27
0.03 0.17 0.22 0.21
Female –0.04 –0.05 –0.06 –0.06
Age 0.01 –0.25 –0.26 –0.28
Age2 –0.03 0.16 0.28 0.28
Chronicillness,nothampered –0.03 –0.02 –0.02 –0.02
Chronicillness,somewhathampered –0.10 –0.14 –0.16 –0.15
Chronicillness,severelyhampered –0.19 –0.22 –0.20 –0.21
Lifestyledeprivation –0.26 –0.17 –0.13 –0.16
Nosocialsupportavailable –0.03 –0.06 –0.03 –0.04
R2 0.16 0.24 0.18 0.20
N 3516 11519 16885 28404
Source: EQLS (2007), authors’ calculations
European Foundation for the Improvement of Living and Working Conditions
Second European Quality of Life Survey: Living conditions, social exclusion and mental well-being
Luxembourg: Office for Official Publications of the European Communities
2010 – VIII, 70 p. – 21 x 29.7 cm
ISBN 978-92-897-0857-9

EF/09/88/EN
SALES AND SUBSCRIPTIONS
Publications for sale produced by the Office for Official Publications of the European Communities are available from our sales agents throughout the world.
How do I set about obtaining a publication?
Once you have obtained the list of sales agents, contact the sales agent of your choice and place your order.
How do I obtain the list of sales agents?
• Go to the Publications Office website http://publications.eu.int/
• Or apply for a paper copy by fax (352) 2929 42758
The European Foundation for the Improvement of Living and Working Conditions is a tripartite EU body, whose role is to provide key actors in social policymaking with findings, knowledge and advice drawn from comparative research. The Foundation was established in 1975 by Council Regulation EEC No 1365/75 of 26 May 1975.
4 5 TJ-30-09-207-EN-C
Second European Quality of Life Survey: Living conditions, social exclusion and m
ental well-being
Second European Quality of Life Survey
Living conditions, social exclusion and mental well-being
Over the past two decades, the concept of social exclusion has increasingly
replaced the concept of poverty within the EU policy discussion on social
vulnerability and disadvantage. It has been shown that unequal access to the
labour market and poor living conditions negatively affect social participation
and social contact, which in turn impact on the quality of life of Europe’s citizens
and lead to a sense of social exclusion. The second European Quality of Life
Survey (EQLS), conducted by Eurofound in 2007, offers a wide-ranging view of
the diverse social realities in Europe today. This report looks at the relationships
between living conditions, social exclusion and mental well-being. It draws on
the results of the EQLS to examine the factors that influence perceived social
exclusion and the impact that this has on mental well-being. The scope of the
findings – spanning 31 countries – offers an important insight into how social
exclusion and integration vary across Europe, given the different cultural and
historical contexts as well as recent social and economic experiences.