1
Living Arrangements of the Elderly in India: Who Lives Alone and What are the Patterns of Familial Support? Elderly women face a triple vulnerability: They belong to a - nancial independence. Coupled with the fact that they were married at a time when large spousal age gaps were the norm, thus they outlive their husbands on the whole. There is a large cohort of women that depend on their families for social support, since governemntal old age support is in the nascent stage. Given that demographic shifts are leading to a de- parture from traditional household structures, it is evident that more needs to be done to build support systems for elderly, par- ticularly women. - - mentation, and create new targeted interventions aimed at this population. Conclusions By the year 2050, 20% of all Indians are projected to be above age 60. Current demographic shifts will manifest in a larger elder population than previously expected: Increasing survivorship at older ages due to medical advance- ment, fewer children to take care of increasing numbers of el- derly due to declining fertility, and increasing migration of youth for emplyment leading to shifting household structures. With weak public pension and social security systems coupled with changing household structures, planning for the elderly es- pecially in terms of living arrangements is critical. The UNFPA in collaboration with partners ISEC and IEG has cre- ated a comprehensive survey on aging in India: The Building a Knowledge Base on Population Aging in India (BKBPAI) includes 9,852 men and women aged 60 and above spread throughout seven states with the highest proportion of elderly in the coun- try: Himachal Pradesh, Punjab, West Bengal, Orissa, Maharashtra, Kerala, and Tamil Nadu. Background (1) What are the current living arrangements of elderly above age 60, and reasons for that arrangement (2) What are the patterns of care- in kind or instrumental- received by elderly from their non-co-residing children? (3) What are the main determinants of living alone for elderly above age 60 in India. Main Research Questions The main focus of this paper is on understanding the family structure, hosuehold composition, and living arrangements of the elderly across various important categories: age, sex, marital status, educational level, and wealth quintile. The results presented here are descriptive, in order to assay the situation of the elderly in the sample. These demographic charac- teristics are then used to determine which elderly are more likely to live alone using logit regression analysis. Next, information on interactions between the elderly and their children is used to de- less likely to receive certain kinds of support from their children. Data Apoorva Jadhav University of Pennsylvania KM Sathyanarayana, Sanjay Kumar UNFPA India K.S. James ISEC India Demography 1. Elderly women are 2.5 times more likely to live alone than their male counterparts. 2. Urban residents are 1.5 times more likely to live alone than rural residents. 3. Marital status is a critical determinant of living alone, with widows most likely to live alone, and not co-reside with children. 4. Those with more education are more likely to live alone, as were those currently in the workforce. 5. Elderly who live alone are 2 times more likely to receive money, and Mulsims are about 1.6 times more likely to do so than Hindu elderly. 6. Elderly with more education and higher up in the wealth index are more likely to receive frequent communication with their children. Key Regression Results 13.2 22.7 15.3 6.3 38.3 27.6 11.3 10.2 11.6 17.5 3.3 7.2 Men Women Main Reason for Change in Living Arrangement age 60 Death of spouse Migra on of Children Marriage of Children Economic Dependency Family Conict Other 2.9 3.5 1.5 1.5 1.0 1.6 4.6 2.4 7.3 3.5 10.9 5.1 8.6 5.0 25.3 9.5 18.9 12.1 13.9 16.2 16.3 18.7 41.3 19.7 11.1 11.3 5.0 9.5 9.8 7.6 15.5 10.0 57.2 60.3 60.5 61.6 65.8 59.3 41.8 58.1 30.0 38.1 17.3 30.6 26.1 21.7 10.0 24.7 12.4 15.6 10.2 17.8 12.3 8.3 8.7 12.4 42.3 39.8 52.4 49.3 46.4 53.6 44.6 47.0 8.6 8.6 13.9 3.0 4.6 12.2 3.6 7.5 9.3 7.2 14.3 5.6 9.0 12.0 4.7 8.8 Himachal Pradesh Punjab West Bengal Orissa Maharashtra Kerala Tamil Nadu Total Himachal Pradesh Punjab West Bengal Orissa Maharashtra Kerala Tamil Nadu Total Men Women Type of Living Arrangement by State Alone Spouse only Spouse, children, grandchildren Children and grandchildren Others Overall, about 10% of women and 3% of men live alone. More surprisingly, about 20% of men and women do not co-reside with children, thus indicating changing household structures. There is much inter-state variation, with states in the South demonstrating a larger proportion of women living alone- with Tamil Nadu at 25%. The main reason for a change in living ar- rangement was the death of a spouse for women, and marriage of children- pointing to a nuclearization of families post-marriage of children- a departure from traditional arrangements. 32.4 41.6 1.2 8.8 29.3 30.5 10.1 10.9 16.6 18.2 7.8 6.1 17.6 24.5 6.6 6.1 34.7 30.2 7.8 6.0 Men Women Men Women Children to Elders Elders to Children Monetary Transfers between Elderly and Non-Co-Residing Children Alone Spouse only Spouse, children, grandchildren Children and grandchildren Others - 21.1 19.0 37.4 30.9 9.5 12.2 17.7 24.0 8.2 8.3 16.2 17.0 11.0 11.2 22.7 27.1 4.2 8.0 11.6 18.1 Men Women Men Women By Children By Elderly No Communica on between Elderly and Non-Co-Residing Children Alone Spouse only Spouse, children and grandchildren Children and grandchildren Others

Living Arrangements of the Elderly in India 2013... · Living Arrangements of the Elderly in India: Who Lives Alone and What are the Patterns of Familial Support? Elderly women face

  • Upload
    others

  • View
    2

  • Download
    0

Embed Size (px)

Citation preview

Living Arrangements of the Elderly in India: Who Lives Alone and What are the Patterns of Familial Support?

Elderly women face a triple vulnerability: They belong to a -

nancial independence. Coupled with the fact that they were married at a time when large spousal age gaps were the norm, thus they outlive their husbands on the whole.

There is a large cohort of women that depend on their families for social support, since governemntal old age support is in the nascent stage. Given that demographic shifts are leading to a de-parture from traditional household structures, it is evident that more needs to be done to build support systems for elderly, par-ticularly women.

--

mentation, and create new targeted interventions aimed at this population.

Conclusions

By the year 2050, 20% of all Indians are projected to be above age 60. Current demographic shifts will manifest in a larger elder population than previously expected:

Increasing survivorship at older ages due to medical advance-ment, fewer children to take care of increasing numbers of el-derly due to declining fertility, and increasing migration of youth for emplyment leading to shifting household structures.

With weak public pension and social security systems coupled with changing household structures, planning for the elderly es-pecially in terms of living arrangements is critical.

The UNFPA in collaboration with partners ISEC and IEG has cre-ated a comprehensive survey on aging in India: The Building a Knowledge Base on Population Aging in India (BKBPAI) includes9,852 men and women aged 60 and above spread throughout seven states with the highest proportion of elderly in the coun-try: Himachal Pradesh, Punjab, West Bengal, Orissa, Maharashtra, Kerala, and Tamil Nadu.

Background

(1) What are the current living arrangements of elderly above age 60, and reasons for that arrangement

(2) What are the patterns of care- in kind or instrumental- received by elderly from their non-co-residing children?

(3) What are the main determinants of living alone for elderly above age 60 in India.

Main Research Questions

The main focus of this paper is on understanding the family structure, hosuehold composition, and living arrangements of the elderly across various important categories: age, sex, marital status, educational level, and wealth quintile.

The results presented here are descriptive, in order to assay the situation of the elderly in the sample. These demographic charac-teristics are then used to determine which elderly are more likely to live alone using logit regression analysis. Next, information on interactions between the elderly and their children is used to de-

less likely to receive certain kinds of support from their children.

Data

Apoorva Jadhav University of Pennsylvania KM Sathyanarayana, Sanjay Kumar UNFPA India K.S. James ISEC India

Demography

1. Elderly women are 2.5 times more likely to live alone than their male counterparts.

2. Urban residents are 1.5 times more likely to live alone than rural residents.

3. Marital status is a critical determinant of living alone, with widows most likely to live alone, and not co-reside with children.

4. Those with more education are more likely to live alone, as were those currently in the workforce.

5. Elderly who live alone are 2 times more likely to receive money, and Mulsims are about 1.6 times more likely to do so than Hindu elderly.

6. Elderly with more education and higher up in the wealth index are more likely to receive frequent communication with their children.

Key Regression Results

13.222.7

15.36.3

38.327.6

11.3

10.2

11.6

17.5

3.37.2

Men Women

Main Reason for Change in Living Arrangement age 60Death of spouse Migra on of Children Marriage of Children Economic Dependency Family Conflict Other

2.9

3.5

1.5

1.5

1.0

1.6

4.6

2.4

7.3

3.5

10.9

5.1

8.6

5.0

25.3

9.5

18.9

12.1

13.9

16.2

16.3

18.7

41.3

19.7

11.1

11.3

5.0

9.5

9.8

7.6

15.5

10.0

57.2

60.3

60.5

61.6

65.8

59.3

41.8

58.1

30.0

38.1

17.3

30.6

26.1

21.7

10.0

24.7

12.4

15.6

10.2

17.8

12.3

8.3

8.7

12.4

42.3

39.8

52.4

49.3

46.4

53.6

44.6

47.0

8.6

8.6

13.9

3.0

4.6

12.2

3.6

7.5

9.3

7.2

14.3

5.6

9.0

12.0

4.7

8.8

Himachal Pradesh

Punjab

West Bengal

Orissa

Maharashtra

Kerala

Tamil Nadu

Total

Himachal Pradesh

Punjab

West Bengal

Orissa

Maharashtra

Kerala

Tamil Nadu

Total

Me

nW

om

en

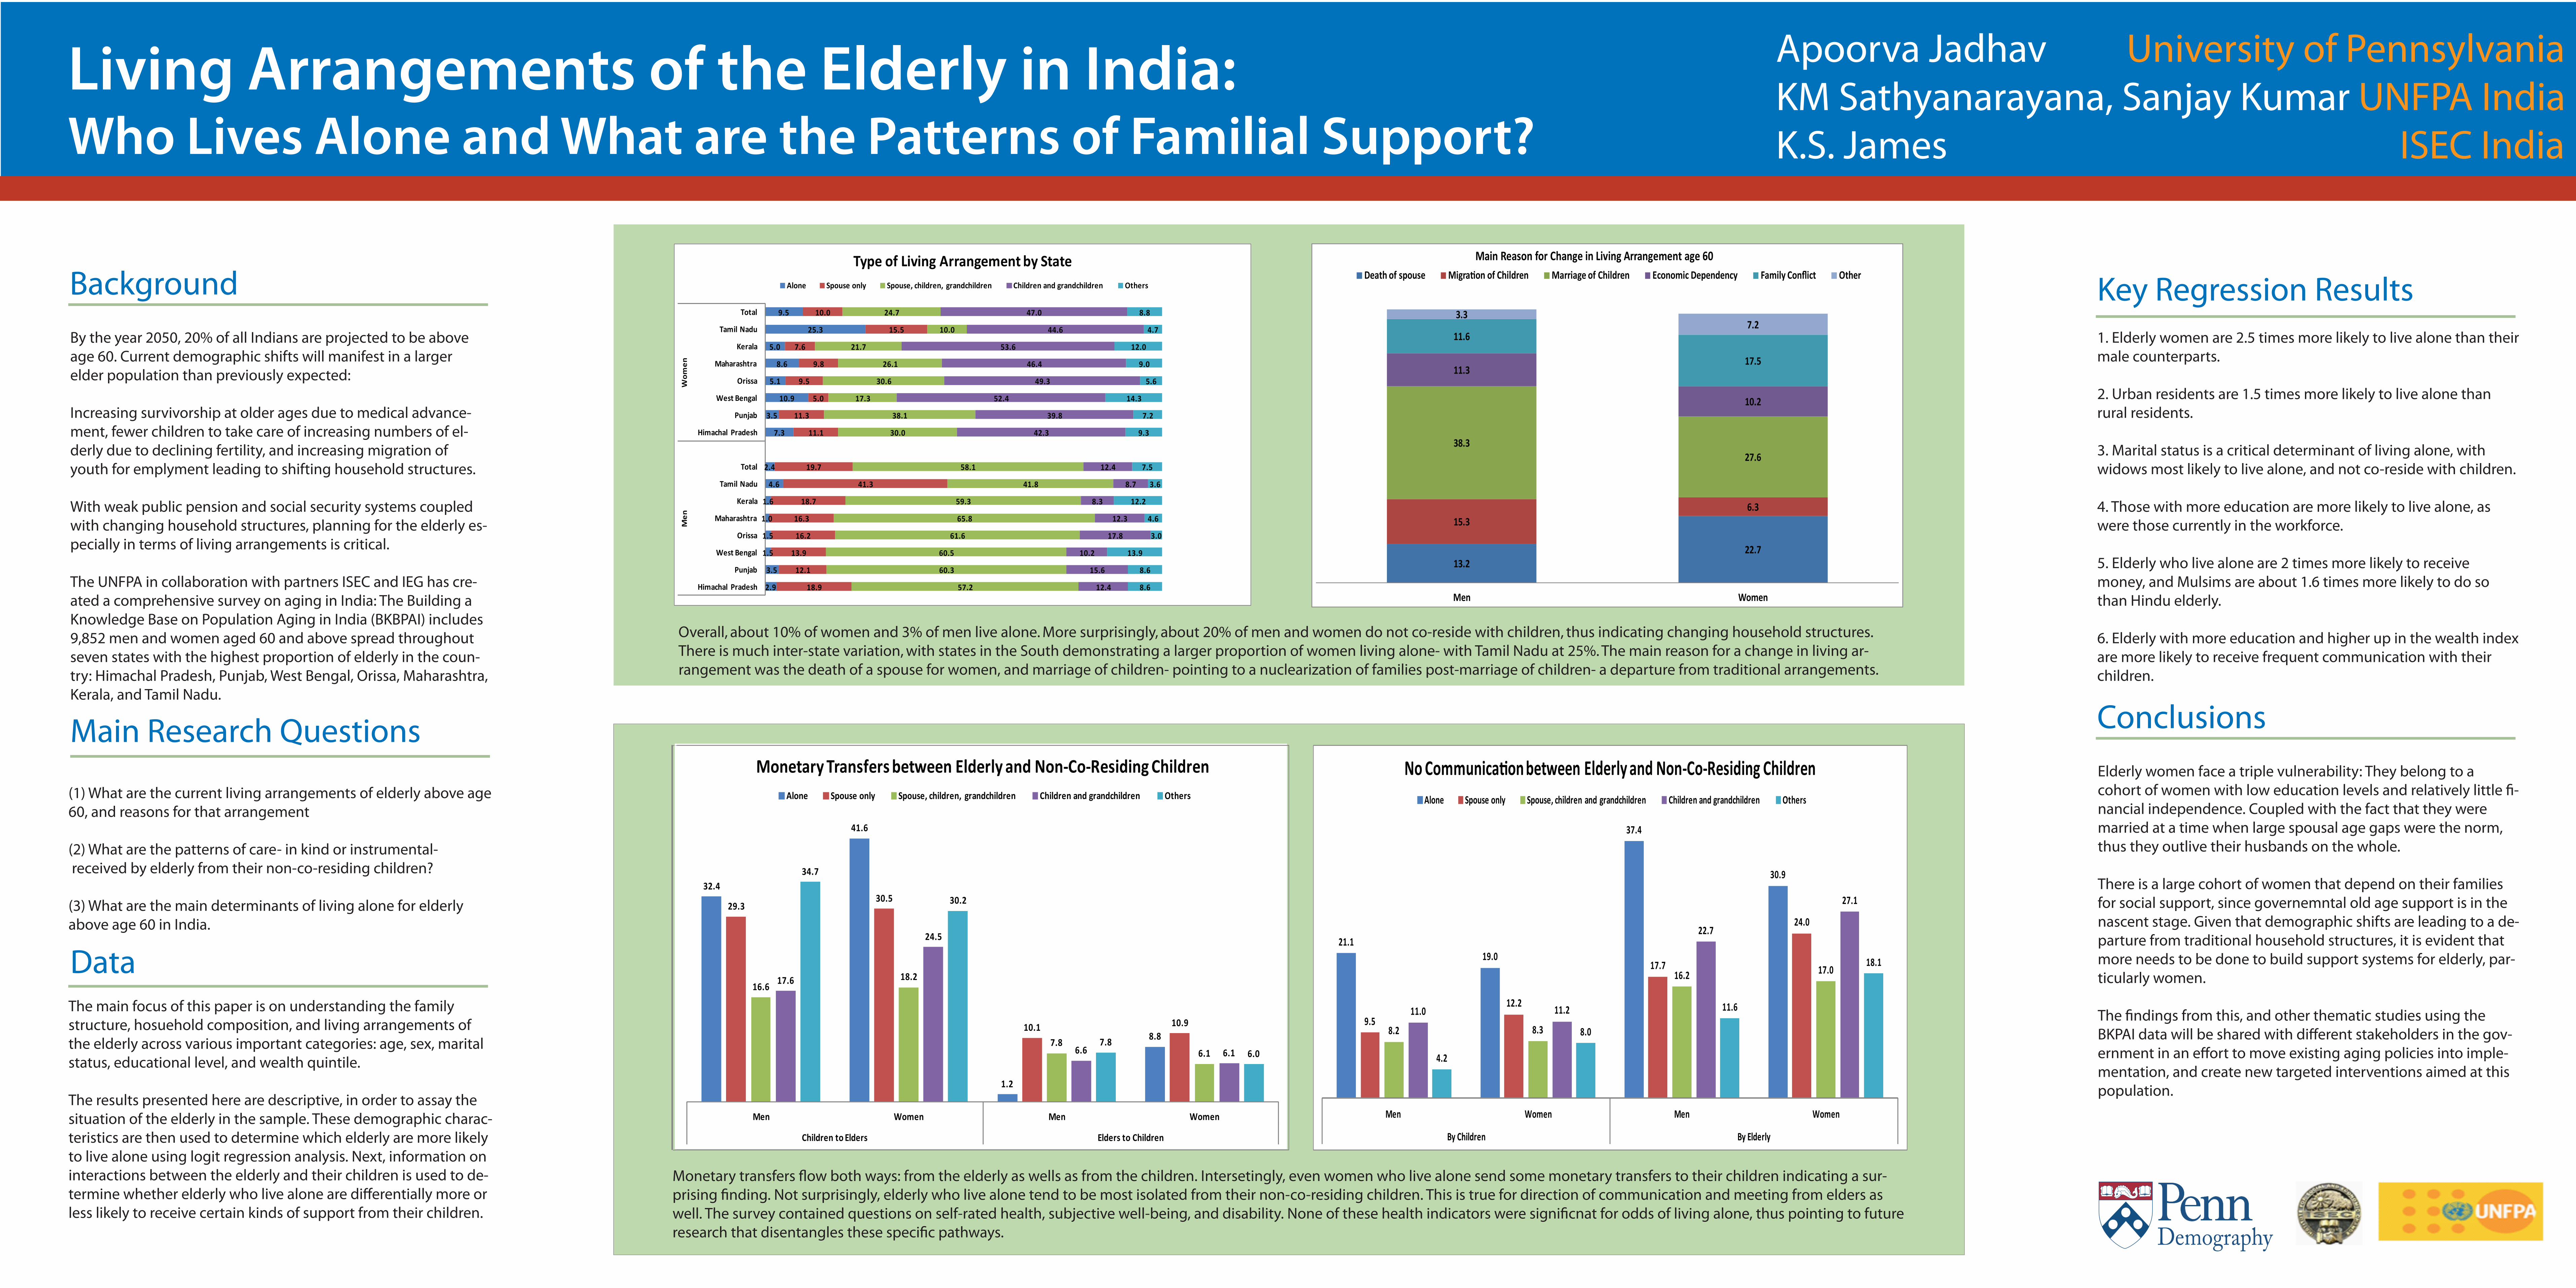
Type of Living Arrangement by StateAlone Spouse only Spouse, children, grandchildren Children and grandchildren Others

Overall, about 10% of women and 3% of men live alone. More surprisingly, about 20% of men and women do not co-reside with children, thus indicating changing household structures. There is much inter-state variation, with states in the South demonstrating a larger proportion of women living alone- with Tamil Nadu at 25%. The main reason for a change in living ar-rangement was the death of a spouse for women, and marriage of children- pointing to a nuclearization of families post-marriage of children- a departure from traditional arrangements.

32.4

41.6

1.2

8.8

29.330.5

10.1 10.9

16.618.2

7.86.1

17.6

24.5

6.6 6.1

34.7

30.2

7.86.0

Men Women Men Women

Children to Elders Elders to Children

Monetary Transfers between Elderly and Non-Co-Residing ChildrenAlone Spouse only Spouse, children, grandchildren Children and grandchildren Others

-

21.119.0

37.4

30.9

9.5

12.2

17.7

24.0

8.2 8.3

16.2 17.0

11.0 11.2

22.7

27.1

4.2

8.0

11.6

18.1

Men Women Men Women

By Children By Elderly

No Communica on between Elderly and Non-Co-Residing ChildrenAlone Spouse only Spouse, children and grandchildren Children and grandchildren Others