Embed Size (px)
Citation preview


LiveWire 2 – User’s Manual
The Professional’s Data Analysis and Visualization Tool
Table of Contents 1 Introduction ............................................................................................... 4
1.1 What is LiveWire?.................................................................................. 4 2.0 Installation and Setup ............................................................................... 5
2.1 System Requirements ............................................................................ 5 2.2 Installation Procedures........................................................................... 5 2.3 Starting LiveWire .................................................................................. 7 2.4 Uninstalling LiveWire ............................................................................. 7
3.0 Application Overview................................................................................. 8 3.1 LiveWire Environment ............................................................................ 8
3.1.1 Title Bar, Menu Bar, and Tool Bars ..................................................... 8 3.1.2 Workspace ....................................................................................10 3.1.3 Worksheet.....................................................................................14 3.1.4 Tab Window ..................................................................................20 3.1.5 Annotations...................................................................................20 3.1.6 Printing.........................................................................................25
Final Print .................................................................................................30 3.1.7 Multiple Selection of Graphs and Formatting.......................................33
3.2 Data Manipulation ................................................................................36 3.2.1 Importing Data Files .......................................................................36 3.2.2 Exporting Data Files........................................................................38 3.2.3 Copy/Paste Data ............................................................................40 3.2.4 Data Generation.............................................................................44 3.2.5 Synchronization of Data ..................................................................49 3.2.6 Attaching Data to Graphs and Plots...................................................51 3.2.7 Moving Groups of Data into a Graph..................................................52 3.2.8 Sorting Data Alphabetically..............................................................53 3.2.9 Data Properties ..............................................................................54
4.0 LiveWire Graphs and Plots ........................................................................56 4.1 Creating Simple Graphs.........................................................................56
4.1.1 Creating an Analog Graph................................................................56 4.1.2 Creating a Digital Graph ..................................................................57 4.1.3 Creating a Bar Graph ......................................................................57
4.2 Creating Advanced Graphs.....................................................................59 4.2.1 Creating an Analog Graph................................................................59 4.2.2 Creating a Digital Graph ..................................................................60 4.2.3 Creating a Bar Graph ......................................................................60
4.3 Creating Plots ......................................................................................61 4.3.1 Creating an X-Y Plot .......................................................................61 4.3.2 Creating a Polar Plot .......................................................................62
4.4 Creating Graph Frames .........................................................................64 4.4.1 How to Create a Graph Frame without Vertical Scrolling.......................65 4.4.2 How to Create a Graph Frame with Vertical Scrolling ...........................66
4.5 Graph Features ....................................................................................67 4.5.1 How to Zoom Data .........................................................................67 4.5.2 How to Use Markers........................................................................74 4.5.3 How to Adjust Axis .........................................................................78 4.5.4 How to Pan Data ............................................................................80 4.5.5 How to Offset Active Curves.............................................................81 4.5.6 How to use the Cross Hairs ..............................................................82 4.5.7 How to Set General Display Preferences ............................................83 4.5.8 Graph Toolbar................................................................................84
Copyright © 2004 Z Systems, Inc. All Rights Reserved. 2

LiveWire 2 – User’s Manual
The Professional’s Data Analysis and Visualization Tool
4.5.9 Manual Graph Sizing.......................................................................85
4.6 Plot Features .......................................................................................87 4.6.1 How to Zoom Data .........................................................................87 4.6.2 How to Use Markers........................................................................88 4.6.3 How to Adjust Trace Options............................................................90 4.6.4 How to Pan Data ............................................................................91
4.7 Graph Frame Features ..........................................................................91 4.7.1 How to Add Graphs.........................................................................92 4.7.2 How to Move Graphs within a Graph Frame........................................92 4.7.3 Minimize and Maximize graphs .........................................................93
5.0 Harmonic Analysis Component ..................................................................94 5.1 Creating Harmonic Components .............................................................94
5.1.1 How to Create a Harmonic Component ..............................................94 5.2 Attaching Data to Harmonic Components .................................................95
5.2.1 How to Add a Curve to a Graph ........................................................95 5.3 Harmonic Component Features...............................................................96
5.3.1 How to Perform Analysis..................................................................96 5.3.2 Enabling/Disabling the Positive-Negative-Zero Sequence Transform.......97 5.3.3 How to Toggle Between Magnitude and Phase Plots ...........................100
6.0 Keyboard Shortcuts ...............................................................................103 6.1 General Components ..........................................................................103 6.2 Graph Components.............................................................................103 6.3 Axis Components ...............................................................................103 6.4 Frequency Plots..................................................................................104 6.5 Harmonic Analysis Component .............................................................104
7.0 Technical Support..................................................................................105 8.0 Example Workspaces .............................................................................106
8.1 Simple Analog Graph ..........................................................................106 8.2 Simple Graphs ...................................................................................106 8.3 Advanced Analog Graph ......................................................................106 8.4 Advanced Graphs ...............................................................................106 8.5 X-Y Plot ............................................................................................106 8.6 Graph Frame .....................................................................................106 8.7 Graph Frame with Vertical Scrolling ......................................................106 8.8 Harmonic Component*........................................................................106
9.0 LiveWire Licence Agreement....................................................................107 10.0 Copyright ...........................................................................................108
Copyright © 2004 Z Systems, Inc. All Rights Reserved. 3
LiveWire 2 – User’s Manual
The Professional’s Data Analysis and Visualization Tool
1 Introduction Z Systems, Inc. specializes in developing data analysis, acquisition and visualization software and software technologies that provide a complete solution for scientists, engineers, and OEM software developers. LiveWire, which was developed using Z Systems’ software technologies, is the best data visualization and analysis software packages available today.
1.1 What is LiveWire? LiveWire is a simple, yet powerful software tool designed to visualize and present time-based data. This application uses a single window split pane user interface. It supports the importation and exportation of industry standard data file formats, such as COMTRADE1 and EMTDC2. It also provides users with the ability to import and export general data formats such as comma separated variable files (*.csv) and text files (*.txt). LiveWire even provides the means to generate data from user-defined equations and import/export data from other applications using the clipboard.
LiveWire has a very wide range of advanced features not available in similar software packages. Features like smart axis and dynamic aperture controls in both the graphs and plots allow the user to easily navigate through their data. Other features like enhanced tool tips present the user with thumbnail views of data sets. The ability to save and restore LiveWire workspaces (*.lww) provide the user with a sense of comfort and security that their worksheets and imported data files will not have to be regenerated, like many other data analysis packages. The capability to generate Bitmap images on a frame-by-frame basis, allow the user to add results and visual depiction to their reports quickly and effortlessly, without using additional software.
Z Systems LiveWire provides the user with a very intuitive, very robust software environment. Along with the wide array of features and Z Systems’ imbedded technology, it is obvious why LiveWire is the only choice for data analysis software.
1 Common Transient Data Exchange (COMTRADE) IEEE-C37.111 is fully supported for years 1991, 1996(draft), 1997(draft) and 1999 in both ASCII and BINARY and Multi-File spanning.
2 Electromagnetic Transients for DC (EMTDC). This format uses information files and multi-file spanning to support up to 200 channels.
Copyright © 2004 Z Systems, Inc. All Rights Reserved. 4
LiveWire 2 – User’s Manual
The Professional’s Data Analysis and Visualization Tool
2.0 Installation and Setup LiveWire is currently supported on PC’s running Microsoft Windows 9x, ME, NT, XP, and 2000 operating systems.
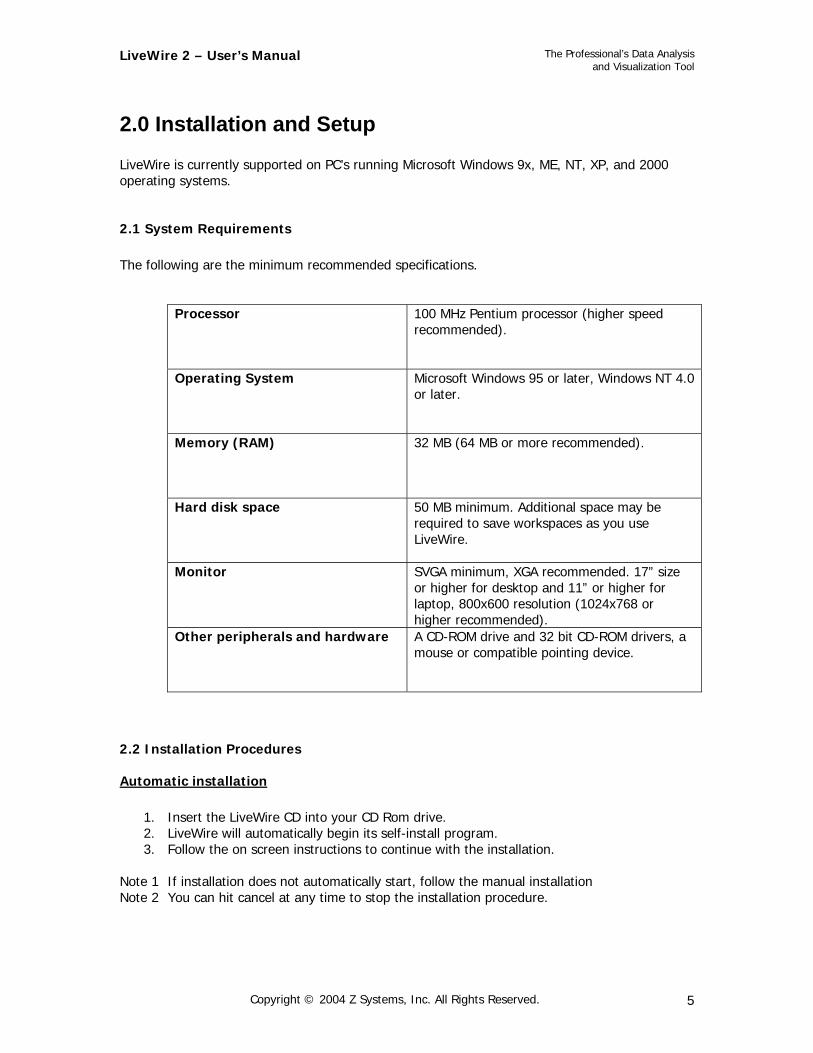
2.1 System Requirements The following are the minimum recommended specifications.
Processor 100 MHz Pentium processor (higher speed recommended).
Operating System Microsoft Windows 95 or later, Windows NT 4.0 or later.
Memory (RAM) 32 MB (64 MB or more recommended).
Hard disk space 50 MB minimum. Additional space may be required to save workspaces as you use LiveWire.
Monitor SVGA minimum, XGA recommended. 17” size or higher for desktop and 11” or higher for laptop, 800x600 resolution (1024x768 or higher recommended).
Other peripherals and hardware A CD-ROM drive and 32 bit CD-ROM drivers, a mouse or compatible pointing device.
2.2 Installation Procedures
Automatic installation
1. Insert the LiveWire CD into your CD Rom drive. 2. LiveWire will automatically begin its self-install program. 3. Follow the on screen instructions to continue with the installation.
Note 1 If installation does not automatically start, follow the manual installation Note 2 You can hit cancel at any time to stop the installation procedure.
Copyright © 2004 Z Systems, Inc. All Rights Reserved. 5
LiveWire 2 – User’s Manual
The Professional’s Data Analysis and Visualization Tool
Manual installation
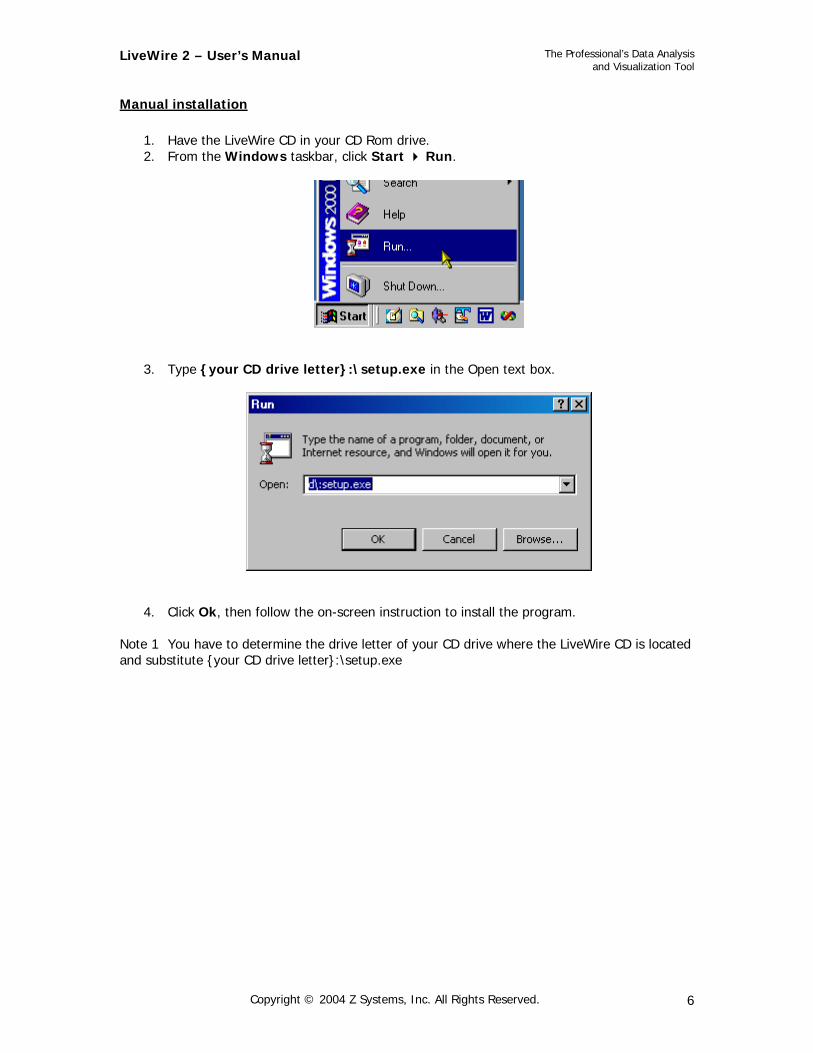
1. Have the LiveWire CD in your CD Rom drive. 2. From the Windows taskbar, click Start Run.
3. Type {your CD drive letter}:\setup.exe in the Open text box.
4. Click Ok, then follow the on-screen instruction to install the program. Note 1 You have to determine the drive letter of your CD drive where the LiveWire CD is located and substitute {your CD drive letter}:\setup.exe
Copyright © 2004 Z Systems, Inc. All Rights Reserved. 6

LiveWire 2 – User’s Manual
The Professional’s Data Analysis and Visualization Tool
2.3 Starting LiveWire From the Windows taskbar, click Start Programs LiveWire LiveWire. Note: The first time you execute LiveWire you will be prompted for a registration key. This key will be located upon the Z System LiveWire CD. If you do not enter a registration key, LiveWire will go into evaluation mode and allow you to demo the application for 30 days before disabling itself. If you do not have the registration key, contact Z Systems, Inc, and they will provide you with one.
2.4 Uninstalling LiveWire If uninstalling from Microsoft Windows, use the standard uninstall procedure. From the Windows taskbar, click Start Settings Control Panel Add/Remove Programs. If you are not familiar with this procedure, ask for assistance from your system administrator to avoid unintentional deletion of some other program or module, or use the Microsoft Windows help.
Copyright © 2004 Z Systems, Inc. All Rights Reserved. 7
LiveWire 2 – User’s Manual
The Professional’s Data Analysis and Visualization Tool
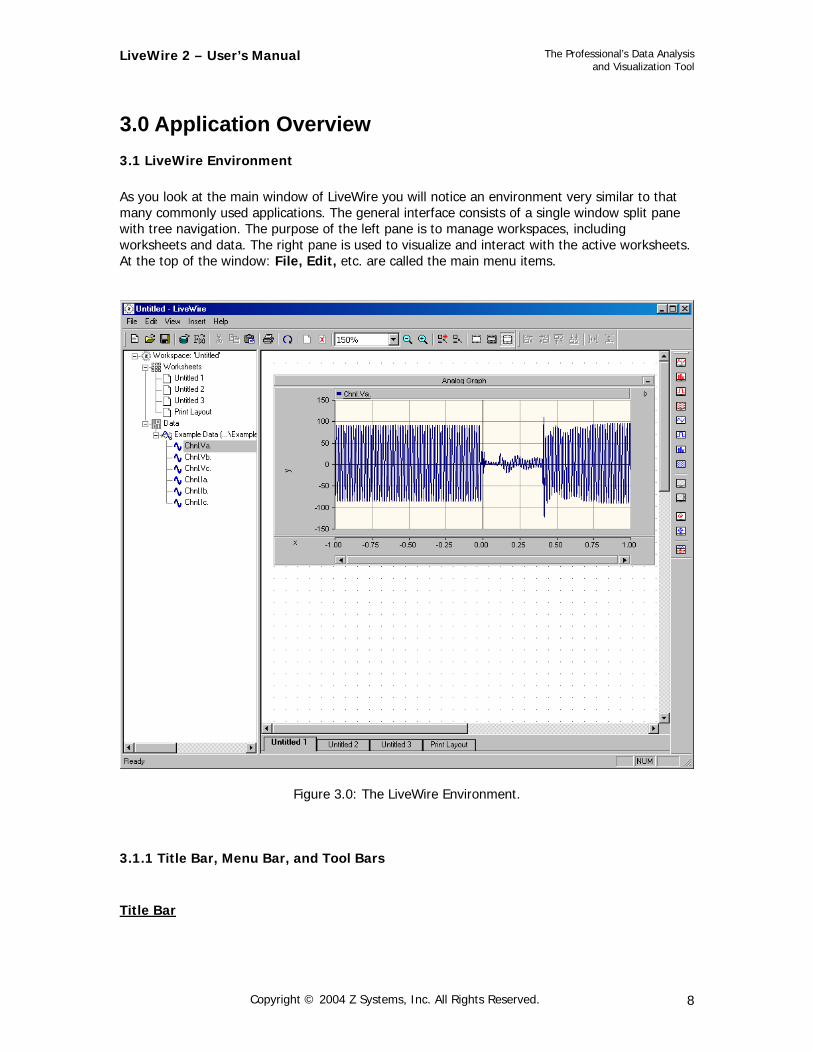
3.0 Application Overview 3.1 LiveWire Environment As you look at the main window of LiveWire you will notice an environment very similar to that many commonly used applications. The general interface consists of a single window split pane with tree navigation. The purpose of the left pane is to manage workspaces, including worksheets and data. The right pane is used to visualize and interact with the active worksheets. At the top of the window: File, Edit, etc. are called the main menu items.
Figure 3.0: The LiveWire Environment.
3.1.1 Title Bar, Menu Bar, and Tool Bars
Title Bar
Copyright © 2004 Z Systems, Inc. All Rights Reserved. 8
LiveWire 2 – User’s Manual
The Professional’s Data Analysis and Visualization Tool
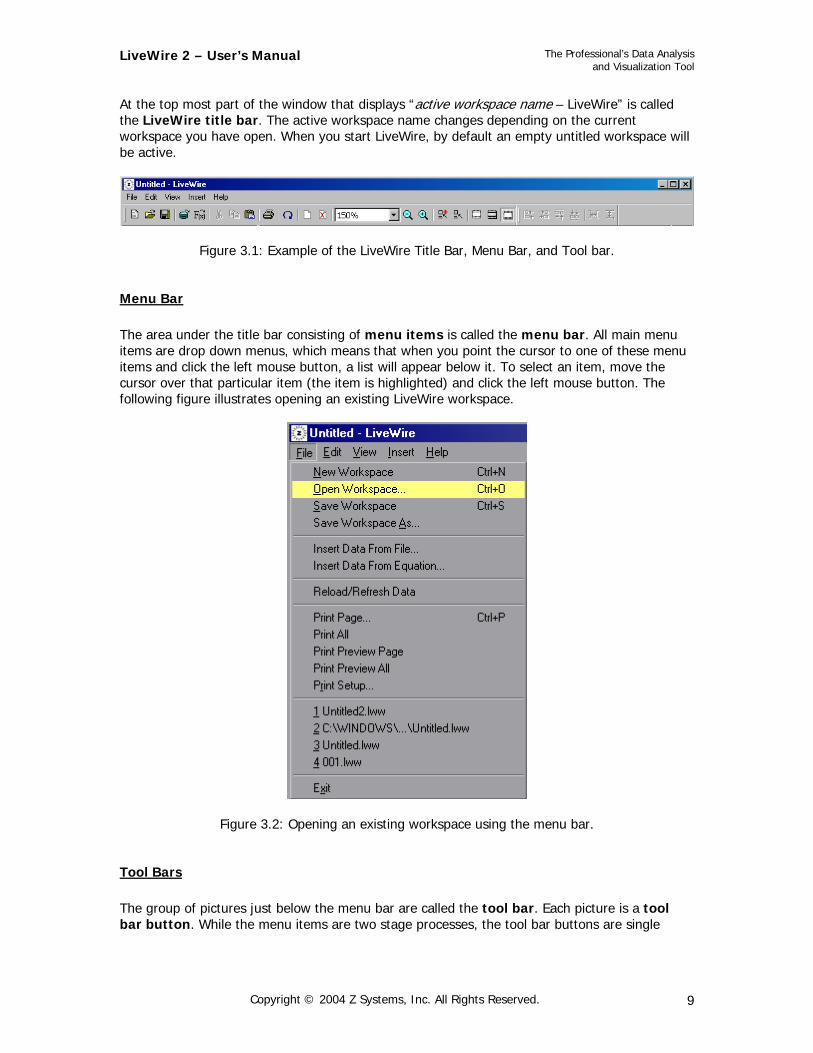
At the top most part of the window that displays “active workspace name – LiveWire” is called the LiveWire title bar. The active workspace name changes depending on the current workspace you have open. When you start LiveWire, by default an empty untitled workspace will be active.
Figure 3.1: Example of the LiveWire Title Bar, Menu Bar, and Tool bar.
Menu Bar The area under the title bar consisting of menu items is called the menu bar. All main menu items are drop down menus, which means that when you point the cursor to one of these menu items and click the left mouse button, a list will appear below it. To select an item, move the cursor over that particular item (the item is highlighted) and click the left mouse button. The following figure illustrates opening an existing LiveWire workspace.
Figure 3.2: Opening an existing workspace using the menu bar.
Tool Bars The group of pictures just below the menu bar are called the tool bar. Each picture is a tool bar button. While the menu items are two stage processes, the tool bar buttons are single
Copyright © 2004 Z Systems, Inc. All Rights Reserved. 9
LiveWire 2 – User’s Manual
The Professional’s Data Analysis and Visualization Tool
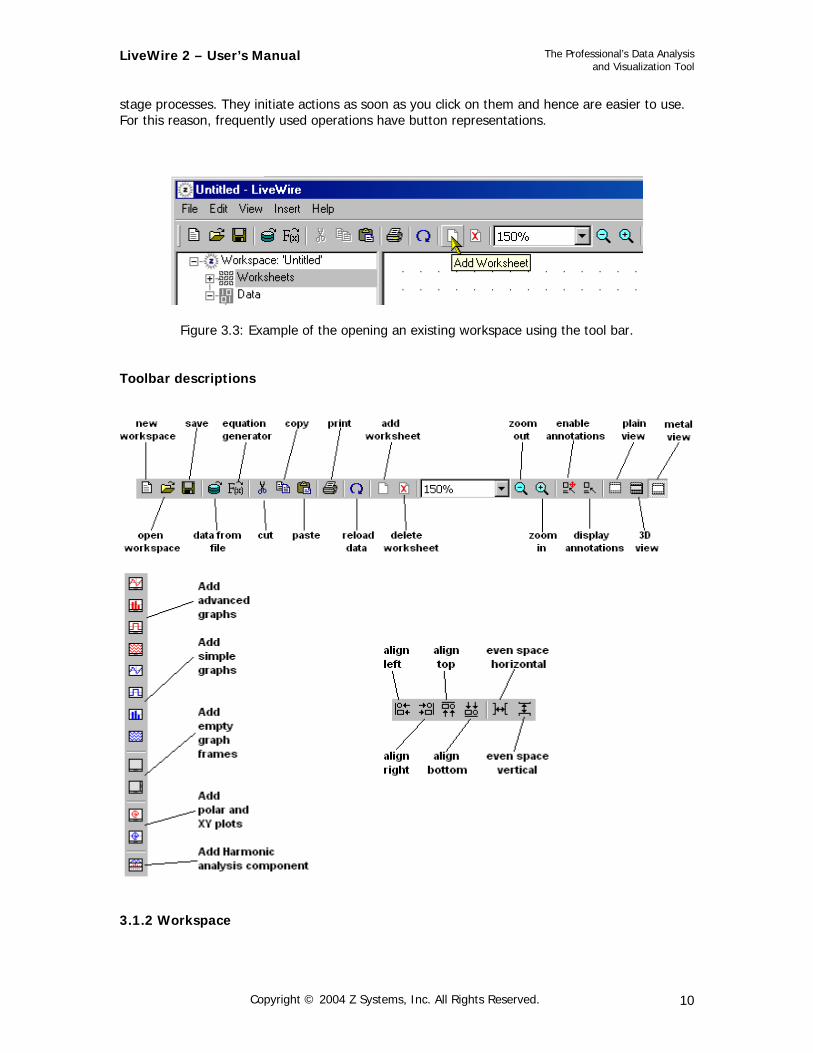
stage processes. They initiate actions as soon as you click on them and hence are easier to use. For this reason, frequently used operations have button representations.
Figure 3.3: Example of the opening an existing workspace using the tool bar. Toolbar descriptions
3.1.2 Workspace
Copyright © 2004 Z Systems, Inc. All Rights Reserved. 10
LiveWire 2 – User’s Manual
The Professional’s Data Analysis and Visualization Tool
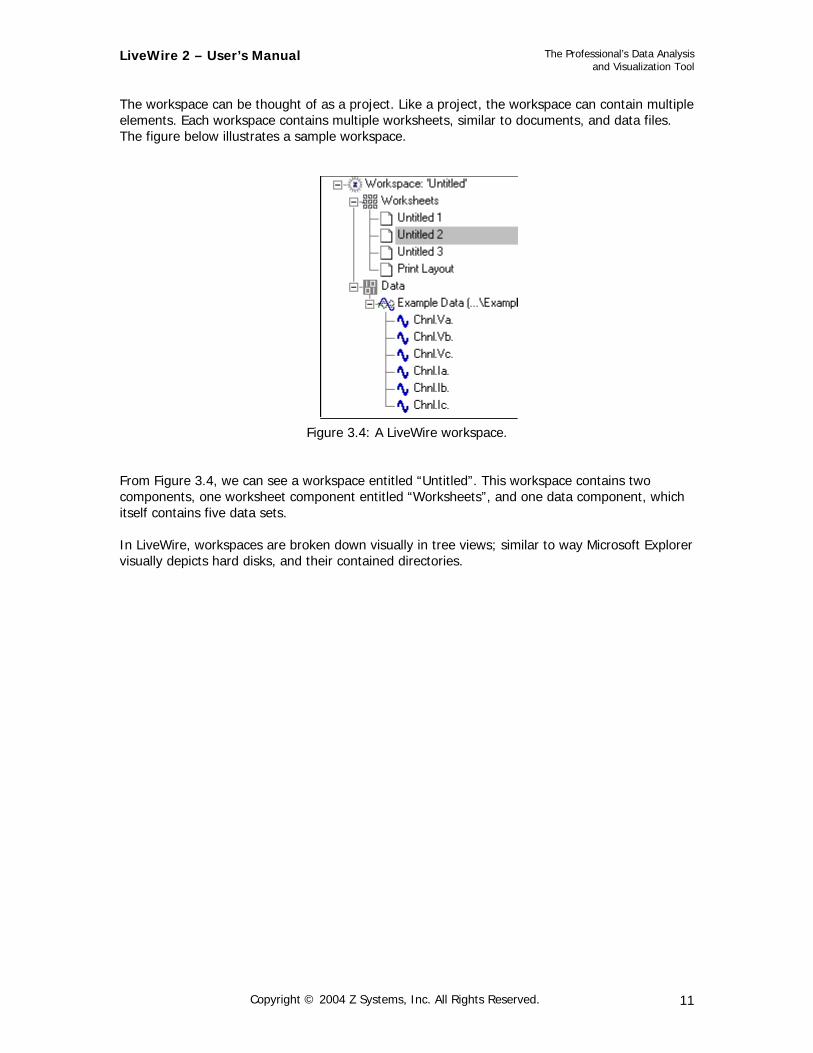
The workspace can be thought of as a project. Like a project, the workspace can contain multiple elements. Each workspace contains multiple worksheets, similar to documents, and data files. The figure below illustrates a sample workspace.
Figure 3.4: A LiveWire workspace.
From Figure 3.4, we can see a workspace entitled “Untitled”. This workspace contains two components, one worksheet component entitled “Worksheets”, and one data component, which itself contains five data sets. In LiveWire, workspaces are broken down visually in tree views; similar to way Microsoft Explorer visually depicts hard disks, and their contained directories.
Copyright © 2004 Z Systems, Inc. All Rights Reserved. 11
LiveWire 2 – User’s Manual
The Professional’s Data Analysis and Visualization Tool
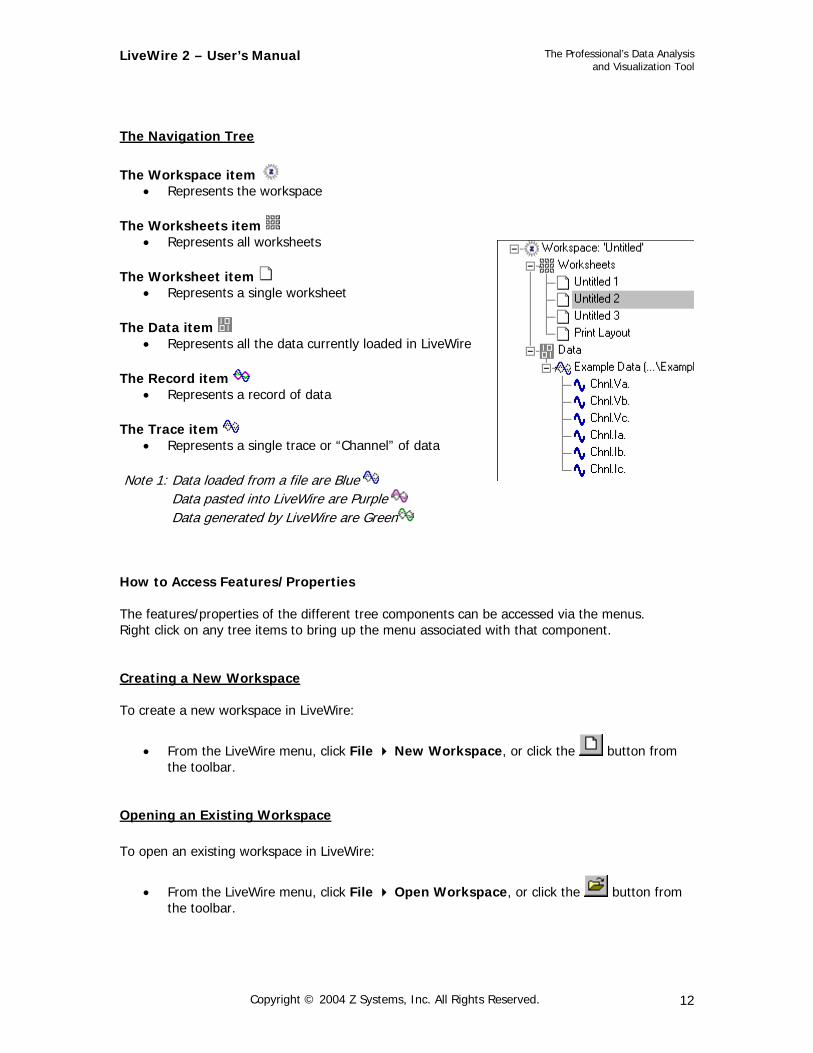
The Navigation Tree The Workspace item
• Represents the workspace The Worksheets item
• Represents all worksheets The Worksheet item
• Represents a single worksheet The Data item
• Represents all the data currently loaded in LiveWire The Record item
• Represents a record of data The Trace item
• Represents a single trace or “Channel” of data Note 1: Data loaded from a file are Blue Data pasted into LiveWire are Purple Data generated by LiveWire are Green
How to Access Features/Properties The features/properties of the different tree components can be accessed via the menus. Right click on any tree items to bring up the menu associated with that component. Creating a New Workspace To create a new workspace in LiveWire:
• From the LiveWire menu, click File New Workspace, or click the button from the toolbar.
Opening an Existing Workspace To open an existing workspace in LiveWire:
• From the LiveWire menu, click File Open Workspace, or click the button from the toolbar.
Copyright © 2004 Z Systems, Inc. All Rights Reserved. 12
LiveWire 2 – User’s Manual
The Professional’s Data Analysis and Visualization Tool
Saving a Workspace To save an existing workspace in LiveWire:
• From the LiveWire menu, click File Save Workspace, or click the button from the toolbar.
•
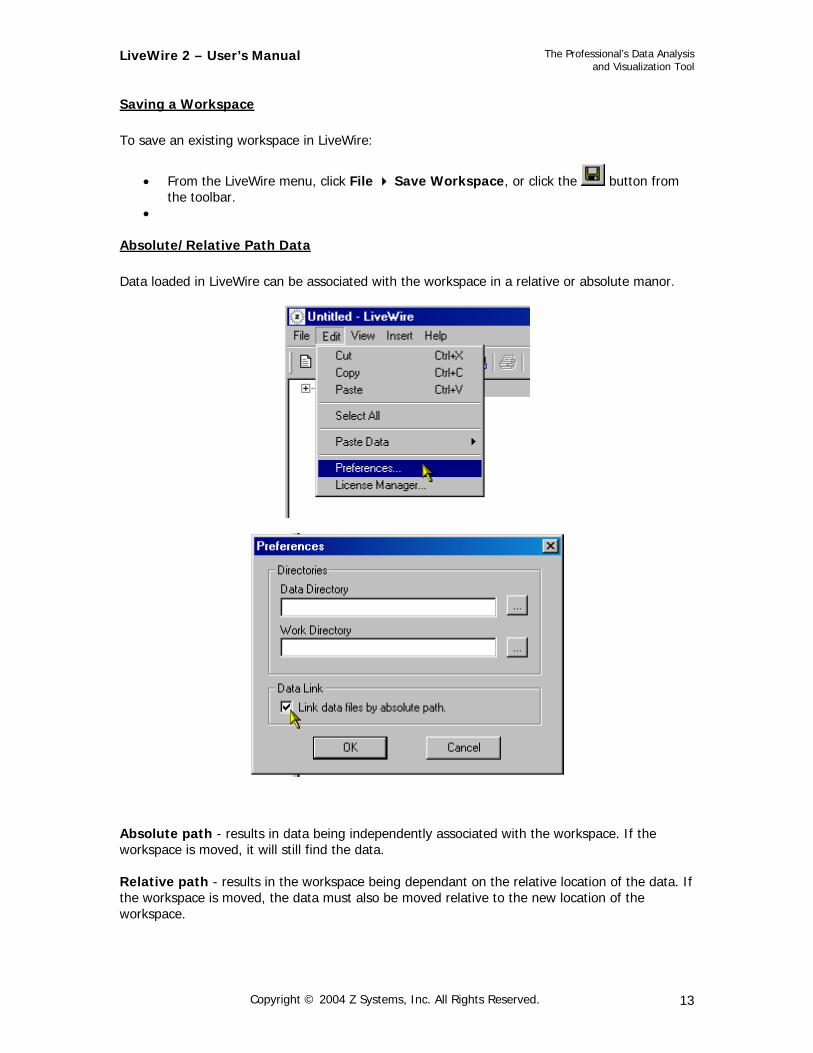
Absolute/Relative Path Data Data loaded in LiveWire can be associated with the workspace in a relative or absolute manor.
Absolute path - results in data being independently associated with the workspace. If the workspace is moved, it will still find the data. Relative path - results in the workspace being dependant on the relative location of the data. If the workspace is moved, the data must also be moved relative to the new location of the workspace.
Copyright © 2004 Z Systems, Inc. All Rights Reserved. 13
LiveWire 2 – User’s Manual
The Professional’s Data Analysis and Visualization Tool
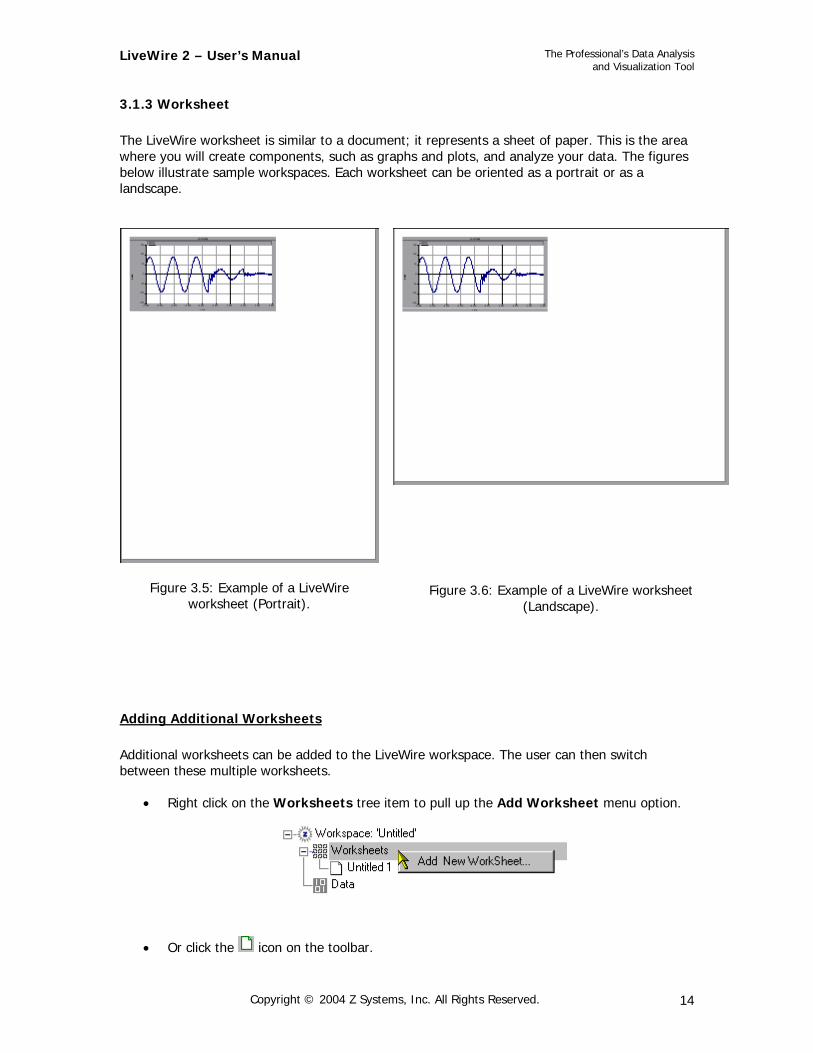
3.1.3 Worksheet The LiveWire worksheet is similar to a document; it represents a sheet of paper. This is the area where you will create components, such as graphs and plots, and analyze your data. The figures below illustrate sample workspaces. Each worksheet can be oriented as a portrait or as a landscape.
Figure 3.5: Example of a LiveWire
worksheet (Portrait).
Figure 3.6: Example of a LiveWire worksheet (Landscape).
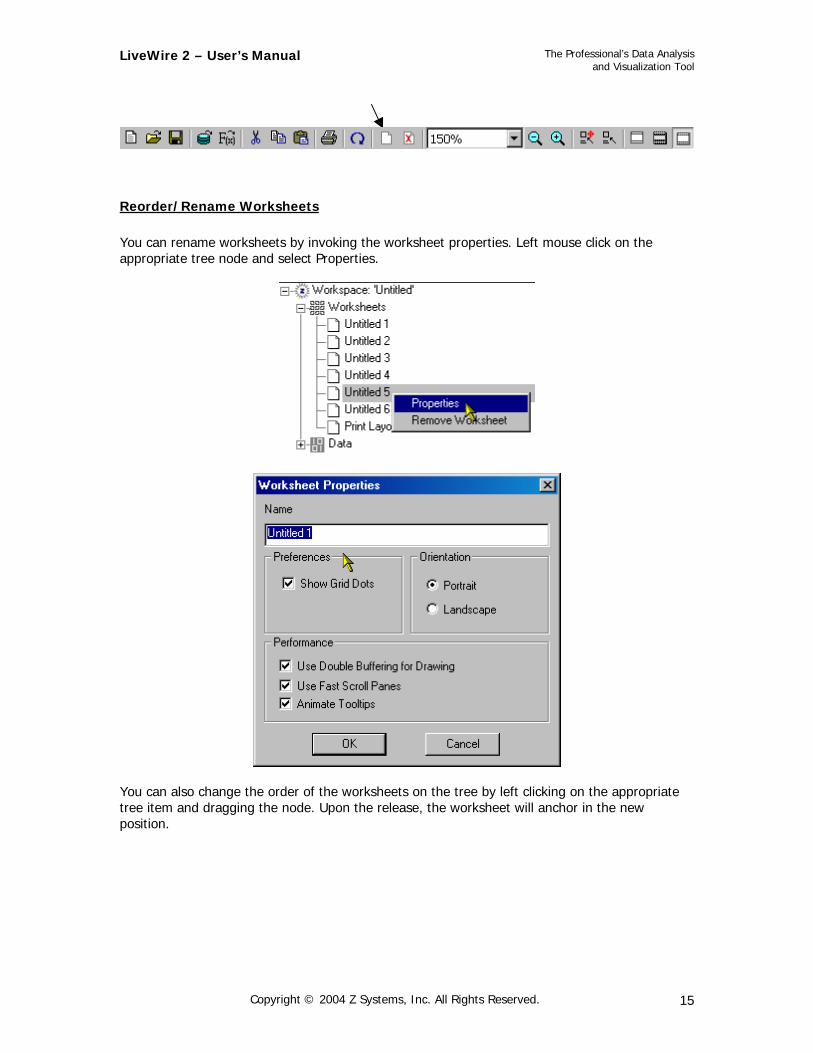
Adding Additional Worksheets Additional worksheets can be added to the LiveWire workspace. The user can then switch between these multiple worksheets.
• Right click on the Worksheets tree item to pull up the Add Worksheet menu option.
• Or click the icon on the toolbar.
Copyright © 2004 Z Systems, Inc. All Rights Reserved. 14
LiveWire 2 – User’s Manual
The Professional’s Data Analysis and Visualization Tool
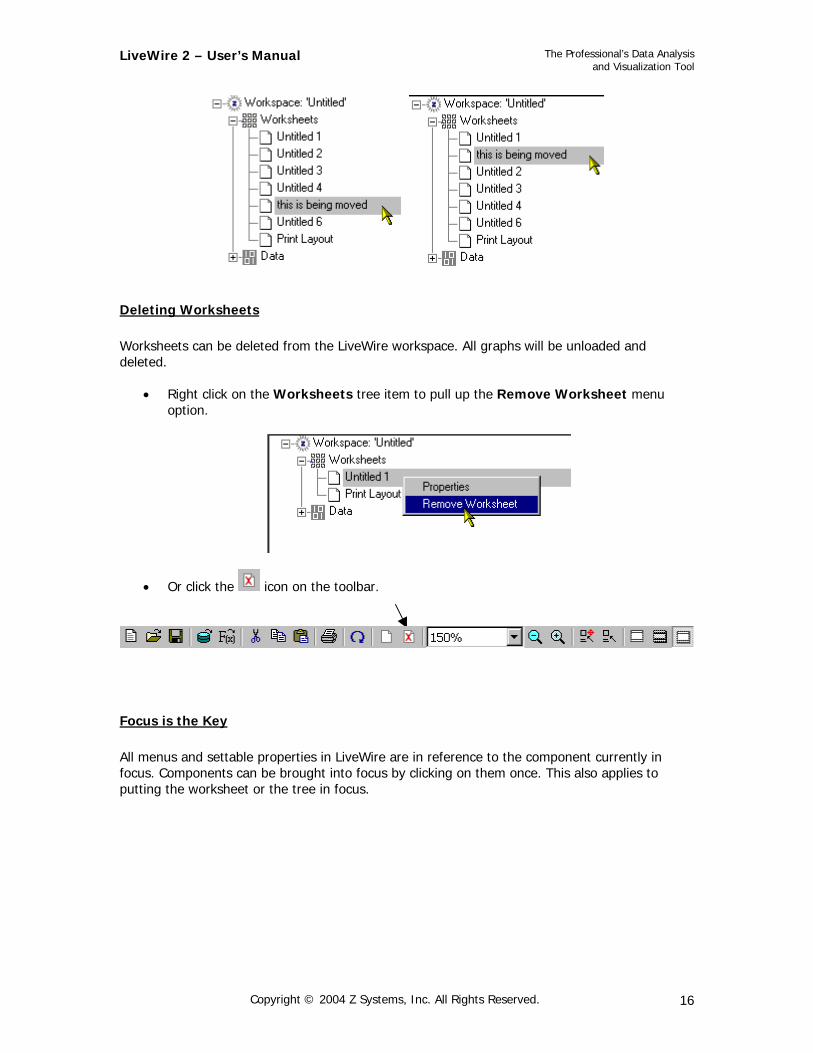
Reorder/Rename Worksheets You can rename worksheets by invoking the worksheet properties. Left mouse click on the appropriate tree node and select Properties.
You can also change the order of the worksheets on the tree by left clicking on the appropriate tree item and dragging the node. Upon the release, the worksheet will anchor in the new position.
Copyright © 2004 Z Systems, Inc. All Rights Reserved. 15
LiveWire 2 – User’s Manual
The Professional’s Data Analysis and Visualization Tool
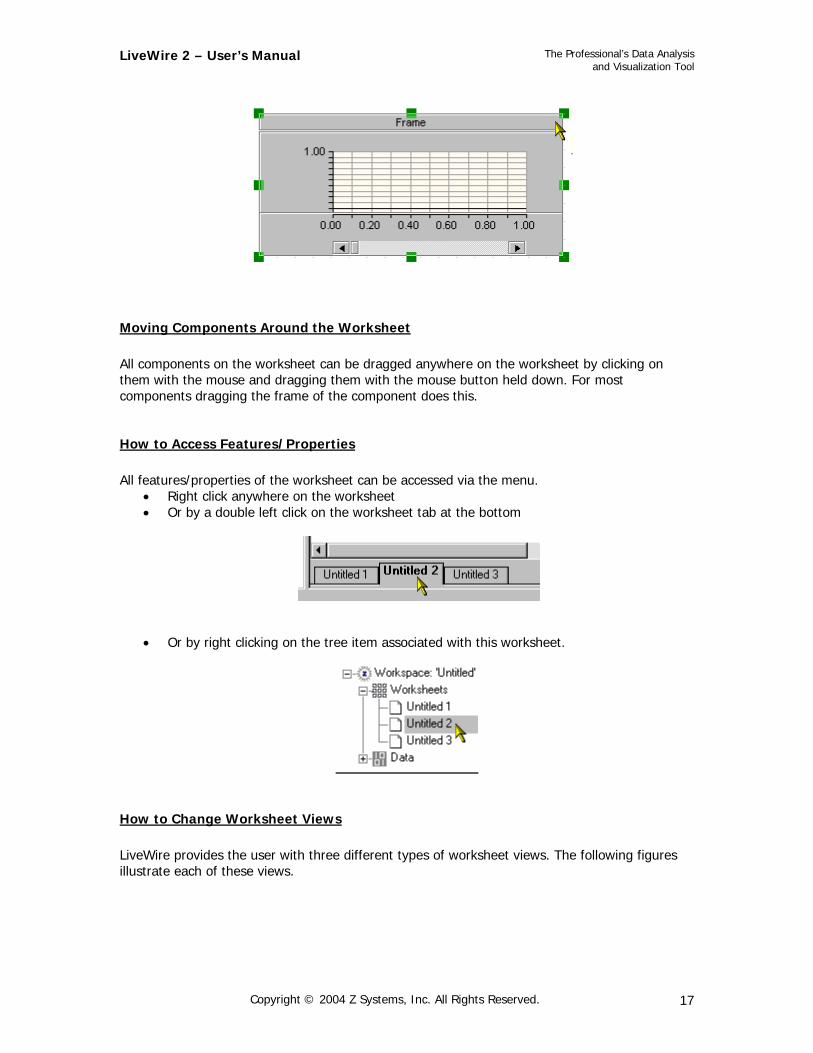
Deleting Worksheets Worksheets can be deleted from the LiveWire workspace. All graphs will be unloaded and deleted.
• Right click on the Worksheets tree item to pull up the Remove Worksheet menu option.
• Or click the icon on the toolbar.
Focus is the Key All menus and settable properties in LiveWire are in reference to the component currently in focus. Components can be brought into focus by clicking on them once. This also applies to putting the worksheet or the tree in focus.
Copyright © 2004 Z Systems, Inc. All Rights Reserved. 16
LiveWire 2 – User’s Manual
The Professional’s Data Analysis and Visualization Tool
Moving Components Around the Worksheet All components on the worksheet can be dragged anywhere on the worksheet by clicking on them with the mouse and dragging them with the mouse button held down. For most components dragging the frame of the component does this.
How to Access Features/Properties All features/properties of the worksheet can be accessed via the menu.
• Right click anywhere on the worksheet • Or by a double left click on the worksheet tab at the bottom
• Or by right clicking on the tree item associated with this worksheet.
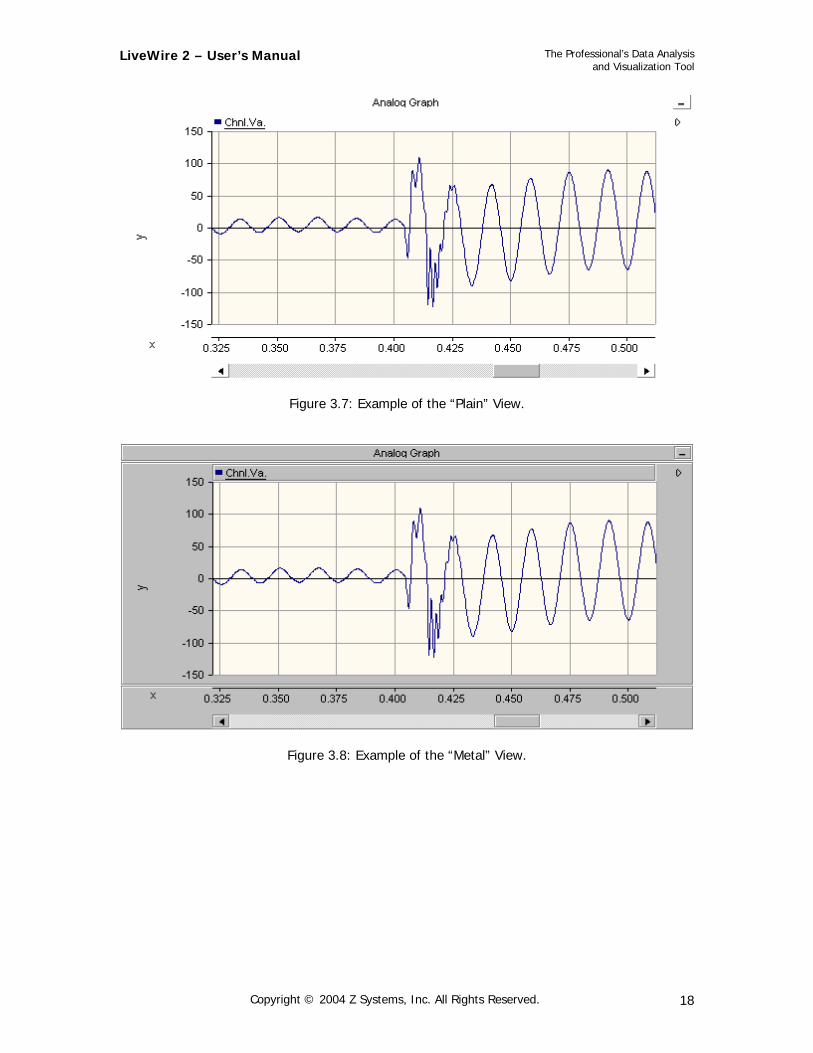
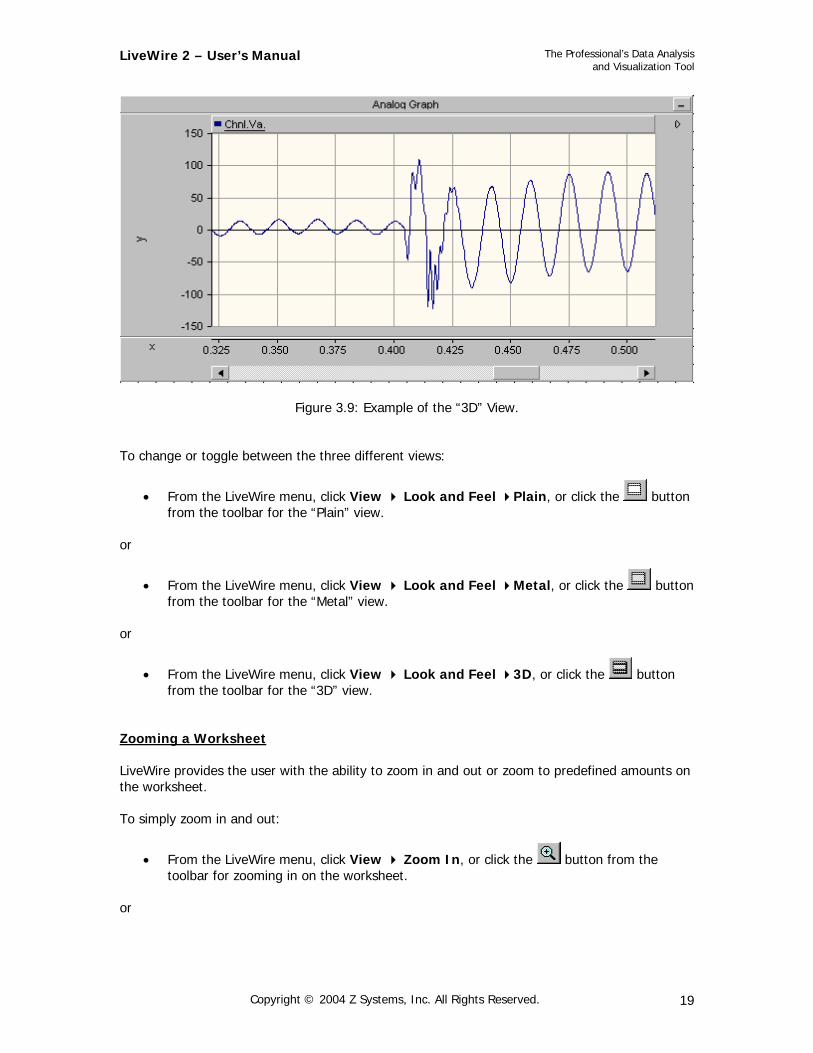
How to Change Worksheet Views LiveWire provides the user with three different types of worksheet views. The following figures illustrate each of these views.
Copyright © 2004 Z Systems, Inc. All Rights Reserved. 17
LiveWire 2 – User’s Manual
The Professional’s Data Analysis and Visualization Tool
Figure 3.7: Example of the “Plain” View.
Figure 3.8: Example of the “Metal” View.
Copyright © 2004 Z Systems, Inc. All Rights Reserved. 18
LiveWire 2 – User’s Manual
The Professional’s Data Analysis and Visualization Tool
Figure 3.9: Example of the “3D” View.
To change or toggle between the three different views:
• From the LiveWire menu, click View Look and Feel Plain, or click the button from the toolbar for the “Plain” view.
or
• From the LiveWire menu, click View Look and Feel Metal, or click the button from the toolbar for the “Metal” view.
or
• From the LiveWire menu, click View Look and Feel 3D, or click the button from the toolbar for the “3D” view.
Zooming a Worksheet LiveWire provides the user with the ability to zoom in and out or zoom to predefined amounts on the worksheet. To simply zoom in and out:
• From the LiveWire menu, click View Zoom In, or click the button from the toolbar for zooming in on the worksheet.
or
Copyright © 2004 Z Systems, Inc. All Rights Reserved. 19
LiveWire 2 – User’s Manual
The Professional’s Data Analysis and Visualization Tool
• From the LiveWire menu, click View Zoom Out, or click the button from the toolbar for zooming out on the worksheet.
To zoom to a predefined amount:
• From the LiveWire menu, click View Zoom To zoom percentage, or select a zoom percentage from the combo box that is located on the toolbar.
Printing a Worksheet When printing workspaces, only the active workspace can be printed or viewed in the print preview. LiveWire uses special features that check printer configurations and adjust displays so that the presentation is never sacrificed. To print a work space:
• From the LiveWire menu, click File Print, or click the button from the toolbar.
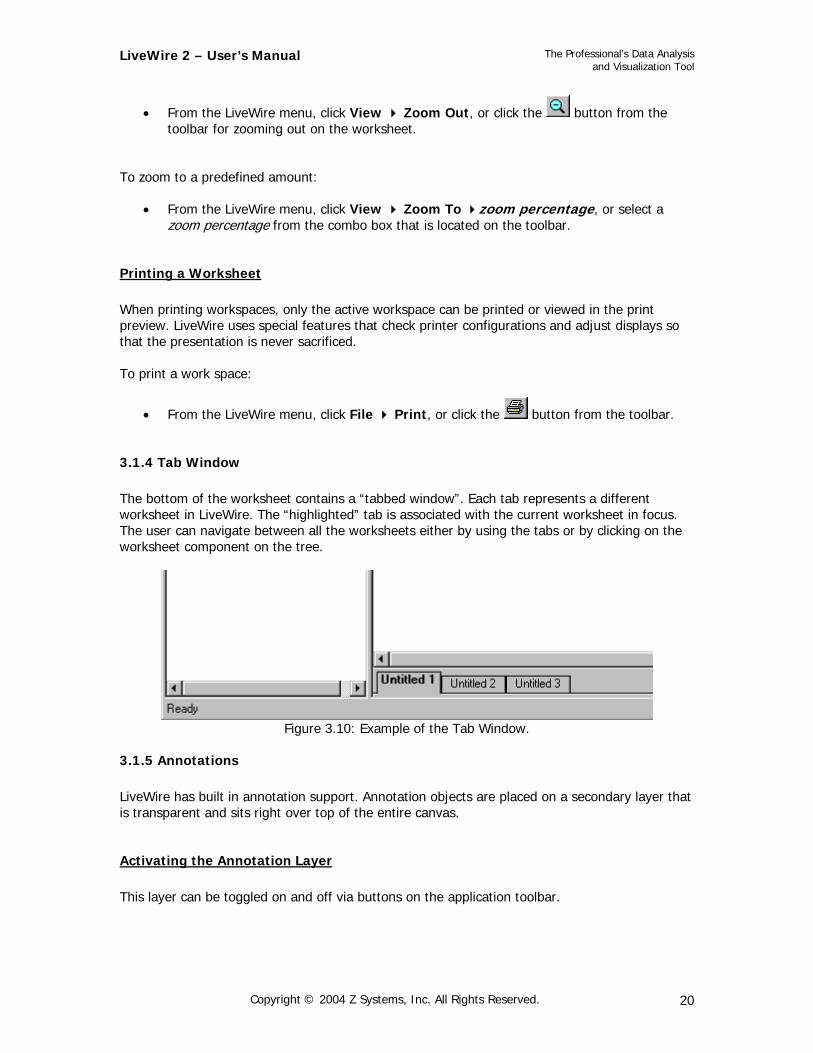
3.1.4 Tab Window The bottom of the worksheet contains a “tabbed window”. Each tab represents a different worksheet in LiveWire. The “highlighted” tab is associated with the current worksheet in focus. The user can navigate between all the worksheets either by using the tabs or by clicking on the worksheet component on the tree.
Figure 3.10: Example of the Tab Window.
3.1.5 Annotations LiveWire has built in annotation support. Annotation objects are placed on a secondary layer that is transparent and sits right over top of the entire canvas.
Activating the Annotation Layer This layer can be toggled on and off via buttons on the application toolbar.
Copyright © 2004 Z Systems, Inc. All Rights Reserved. 20
LiveWire 2 – User’s Manual
The Professional’s Data Analysis and Visualization Tool
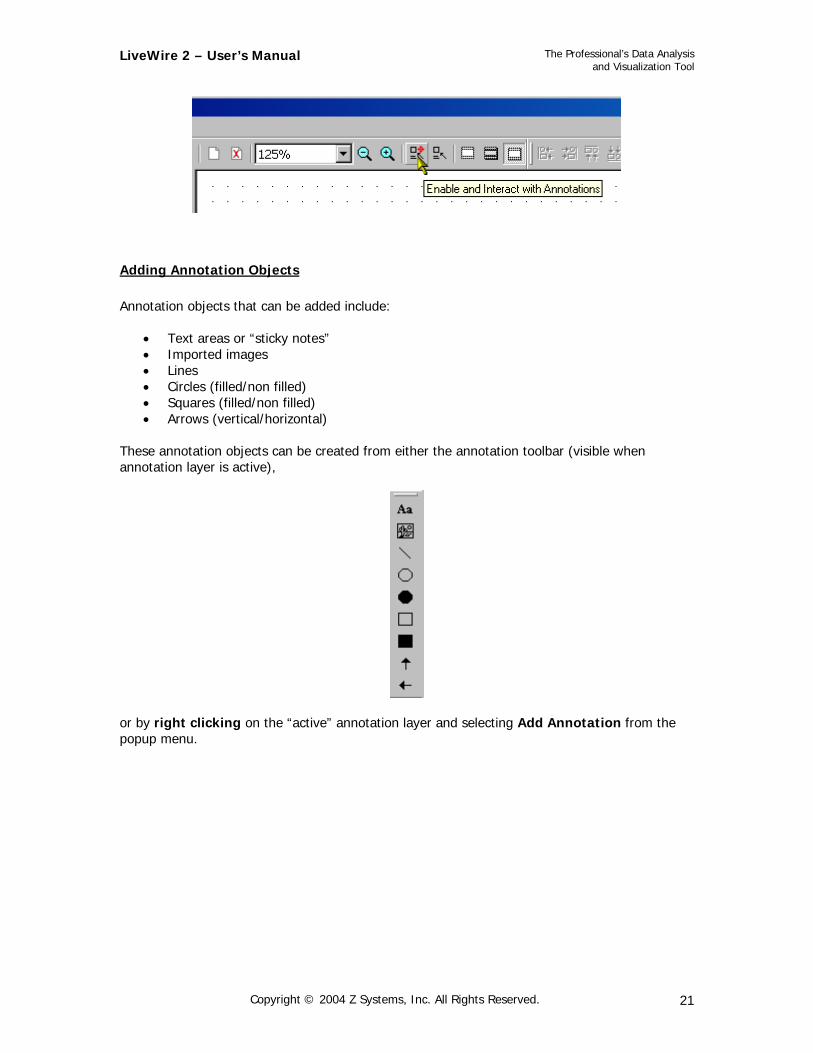
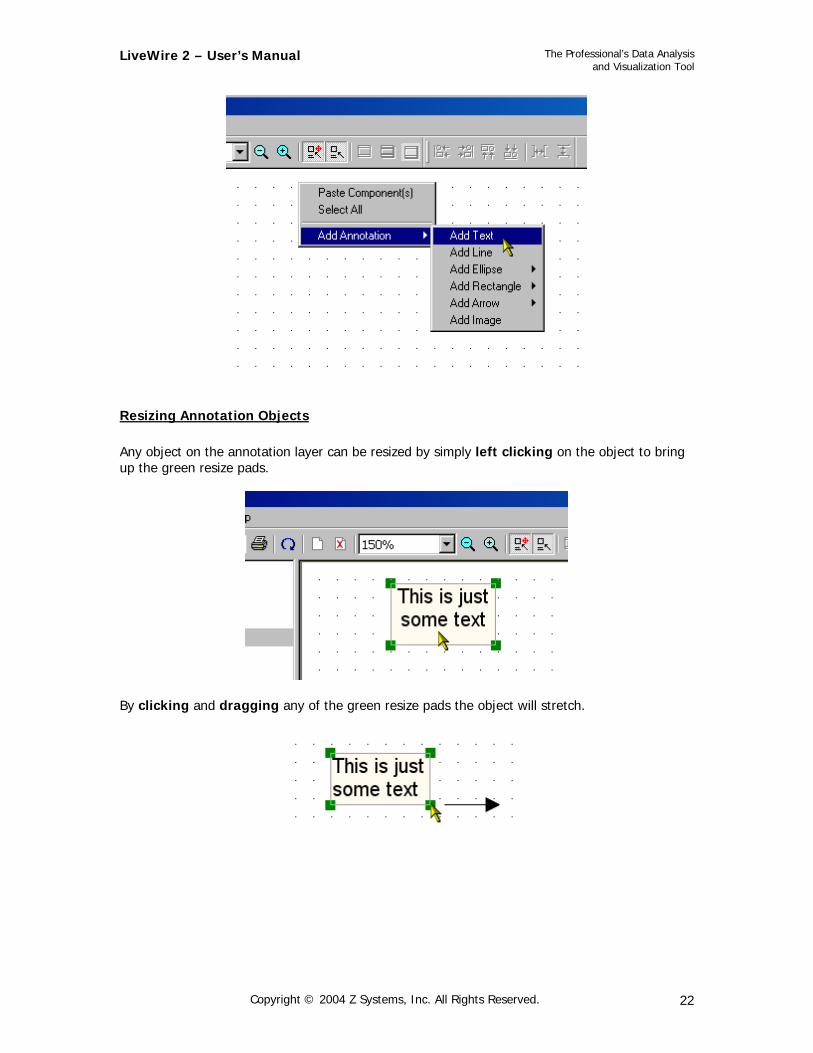
Adding Annotation Objects Annotation objects that can be added include:
• Text areas or “sticky notes” • Imported images • Lines • Circles (filled/non filled) • Squares (filled/non filled) • Arrows (vertical/horizontal)
These annotation objects can be created from either the annotation toolbar (visible when annotation layer is active),
or by right clicking on the “active” annotation layer and selecting Add Annotation from the popup menu.
Copyright © 2004 Z Systems, Inc. All Rights Reserved. 21
LiveWire 2 – User’s Manual
The Professional’s Data Analysis and Visualization Tool
Resizing Annotation Objects Any object on the annotation layer can be resized by simply left clicking on the object to bring up the green resize pads.
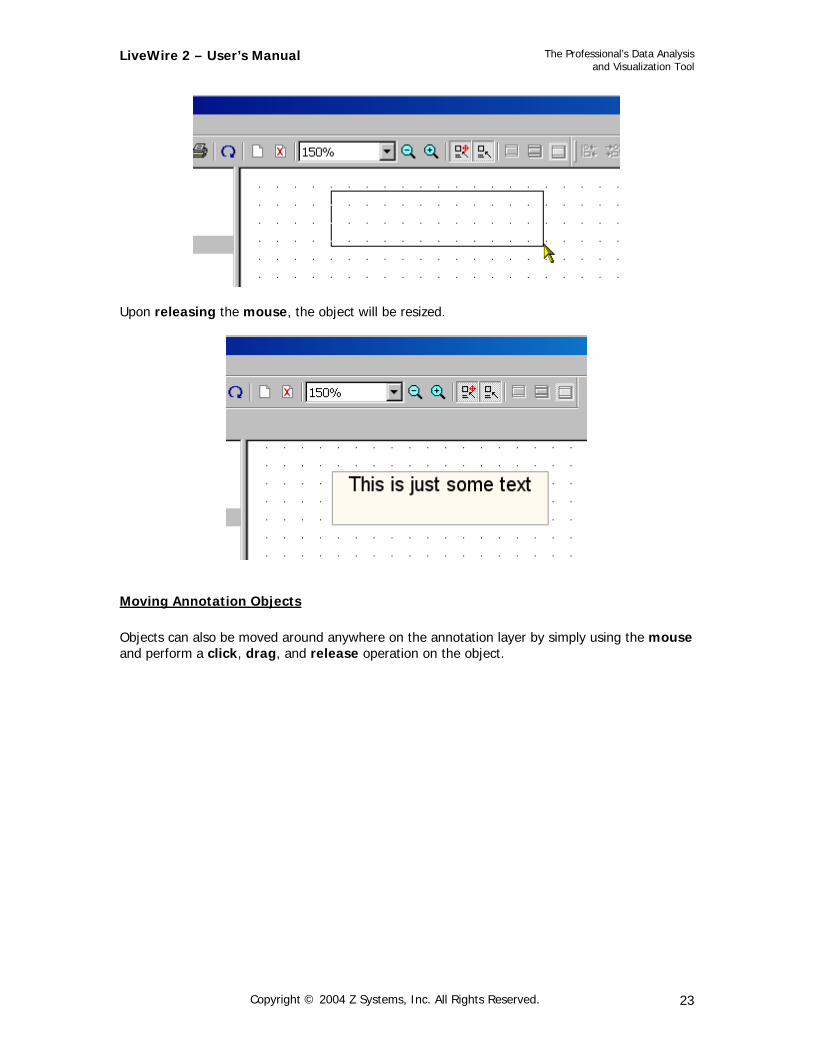
By clicking and dragging any of the green resize pads the object will stretch.
Copyright © 2004 Z Systems, Inc. All Rights Reserved. 22
LiveWire 2 – User’s Manual
The Professional’s Data Analysis and Visualization Tool
Upon releasing the mouse, the object will be resized.
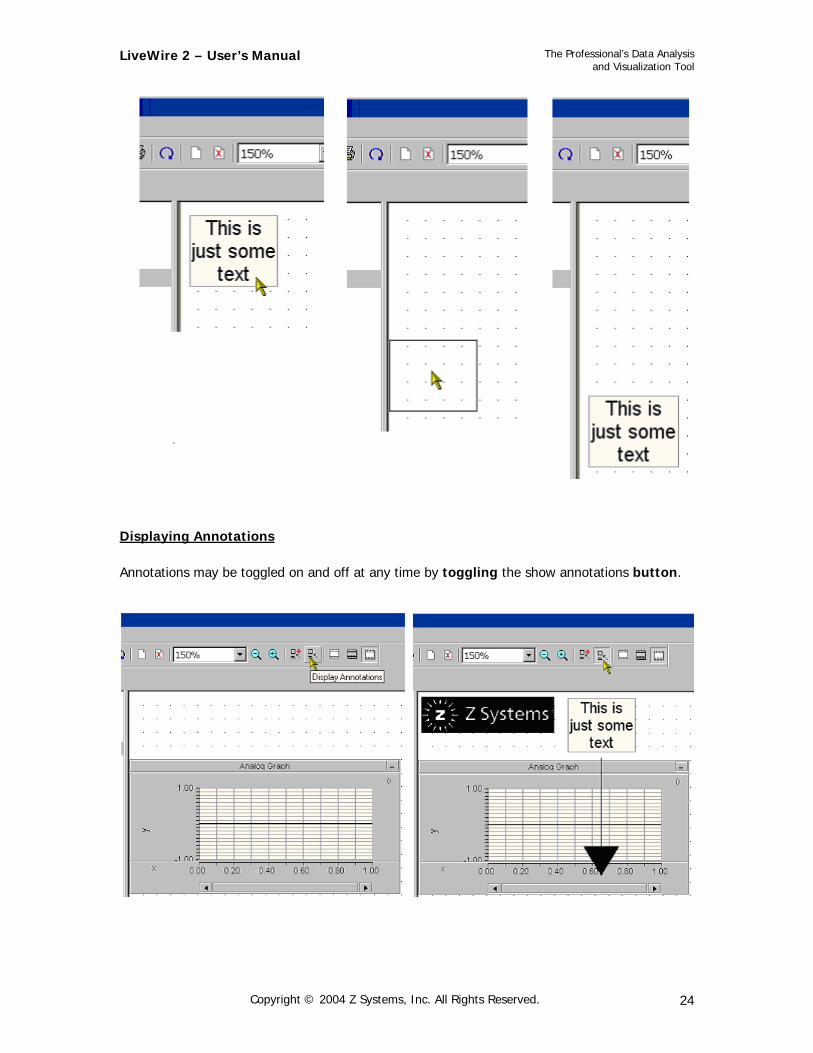
Moving Annotation Objects Objects can also be moved around anywhere on the annotation layer by simply using the mouse and perform a click, drag, and release operation on the object.
Copyright © 2004 Z Systems, Inc. All Rights Reserved. 23
LiveWire 2 – User’s Manual
The Professional’s Data Analysis and Visualization Tool
Displaying Annotations Annotations may be toggled on and off at any time by toggling the show annotations button.
Copyright © 2004 Z Systems, Inc. All Rights Reserved. 24
LiveWire 2 – User’s Manual
The Professional’s Data Analysis and Visualization Tool
3.1.6 Printing
Introduction LiveWire allows the user to customize a printing template that is used to print all pages during a print job. Elements such as margins, page numbers, and images can be added in just a few minutes. LiveWire makes custom printing easy by breaking down the process into 3 easy steps.
• Set your margins • Add custom printing elements • Print!
The customizable printing template is used for all printed pages and is saved along with the workspace and all worksheets. It can be accessed via the tree and the Print Layout node.
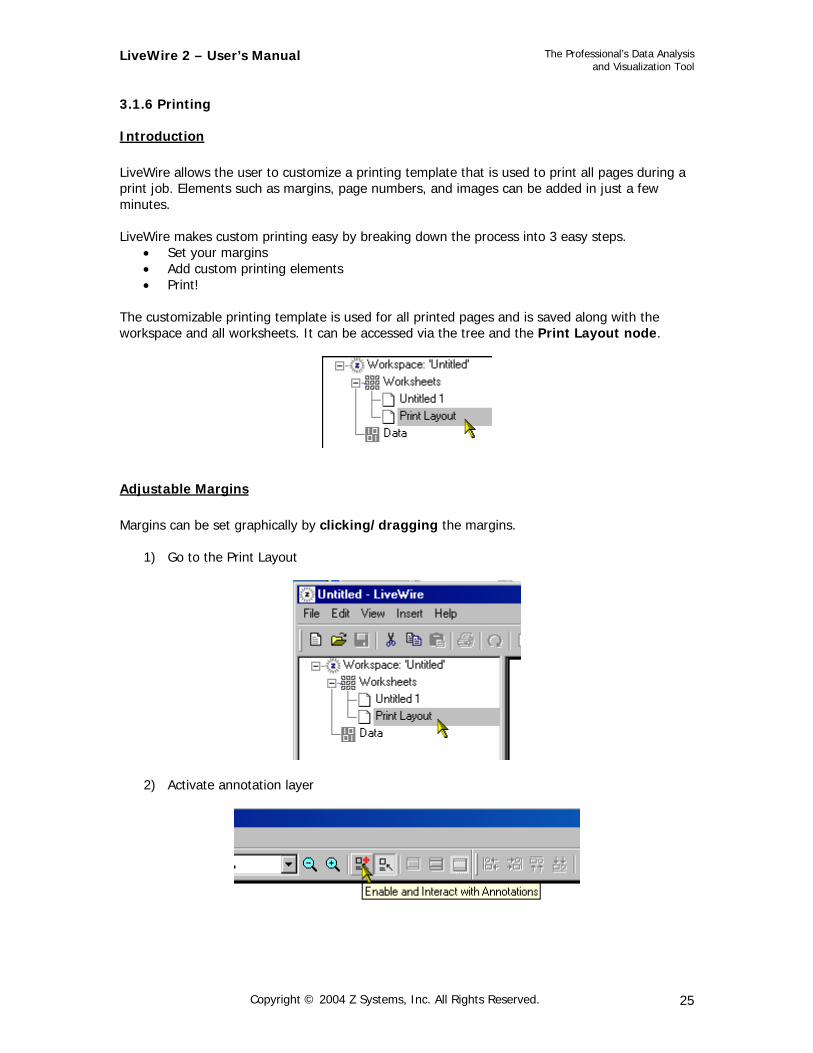
Adjustable Margins Margins can be set graphically by clicking/dragging the margins.
1) Go to the Print Layout
2) Activate annotation layer
Copyright © 2004 Z Systems, Inc. All Rights Reserved. 25
LiveWire 2 – User’s Manual
The Professional’s Data Analysis and Visualization Tool
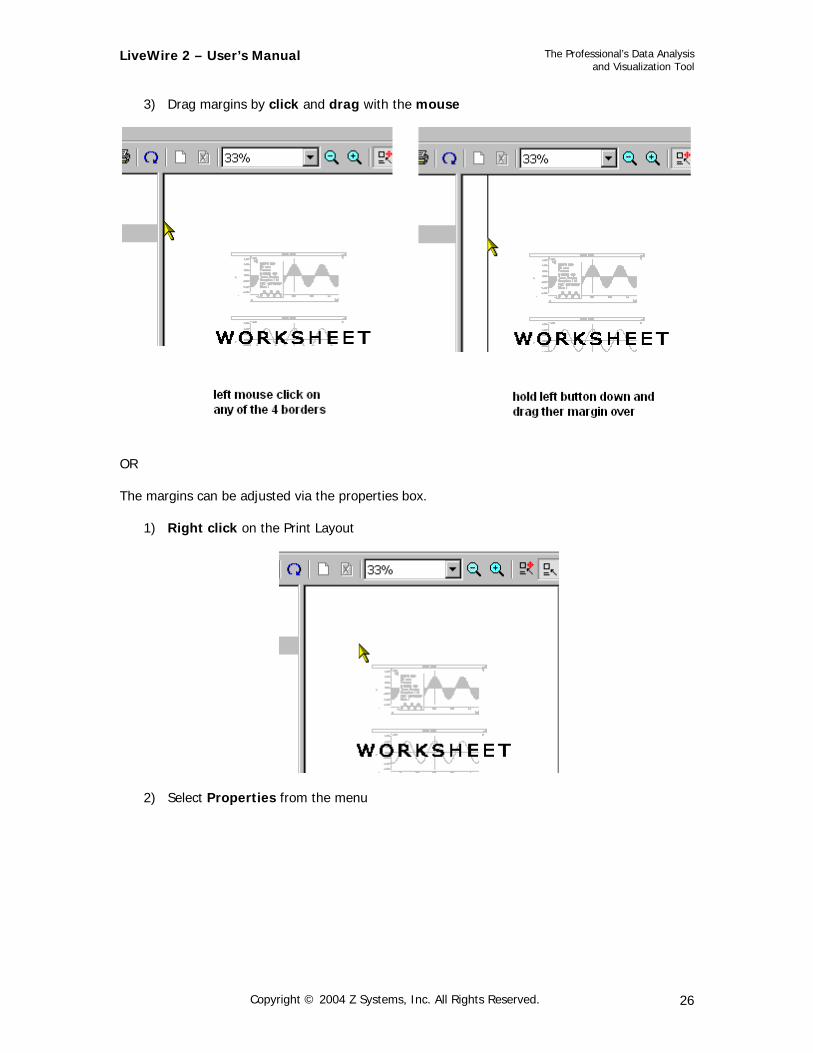
3) Drag margins by click and drag with the mouse
OR The margins can be adjusted via the properties box.
1) Right click on the Print Layout
2) Select Properties from the menu
Copyright © 2004 Z Systems, Inc. All Rights Reserved. 26
LiveWire 2 – User’s Manual
The Professional’s Data Analysis and Visualization Tool
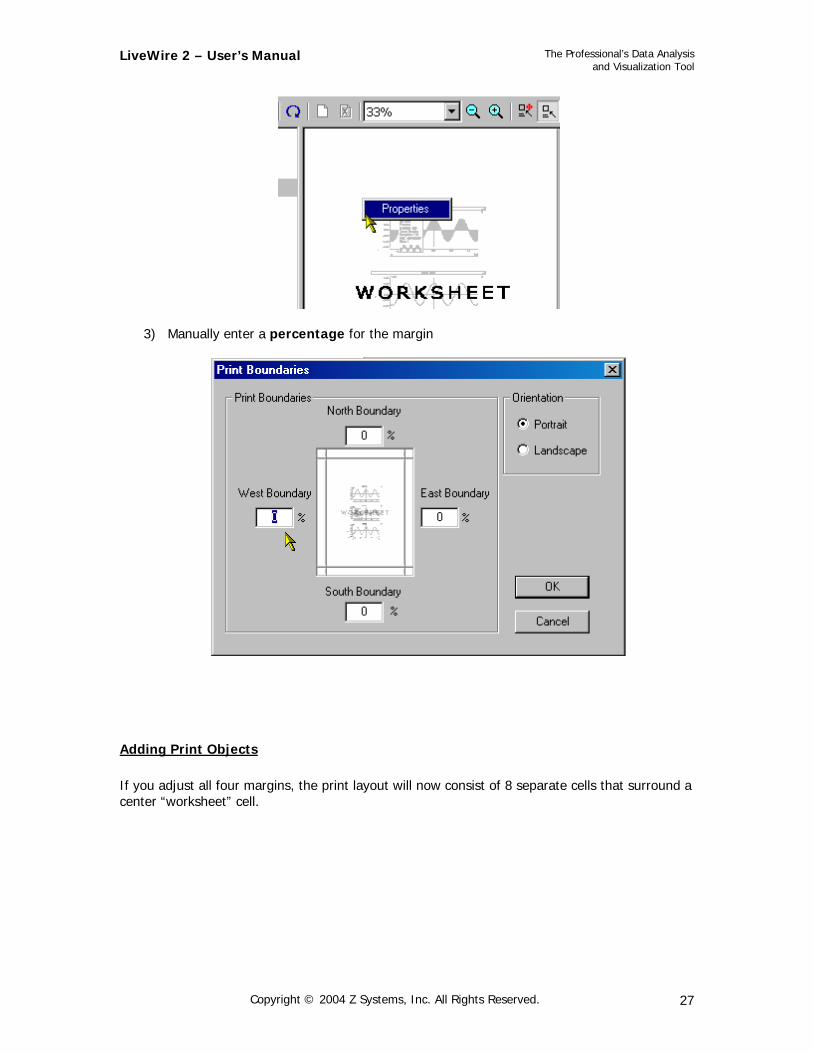
3) Manually enter a percentage for the margin
Adding Print Objects If you adjust all four margins, the print layout will now consist of 8 separate cells that surround a center “worksheet” cell.
Copyright © 2004 Z Systems, Inc. All Rights Reserved. 27
LiveWire 2 – User’s Manual
The Professional’s Data Analysis and Visualization Tool
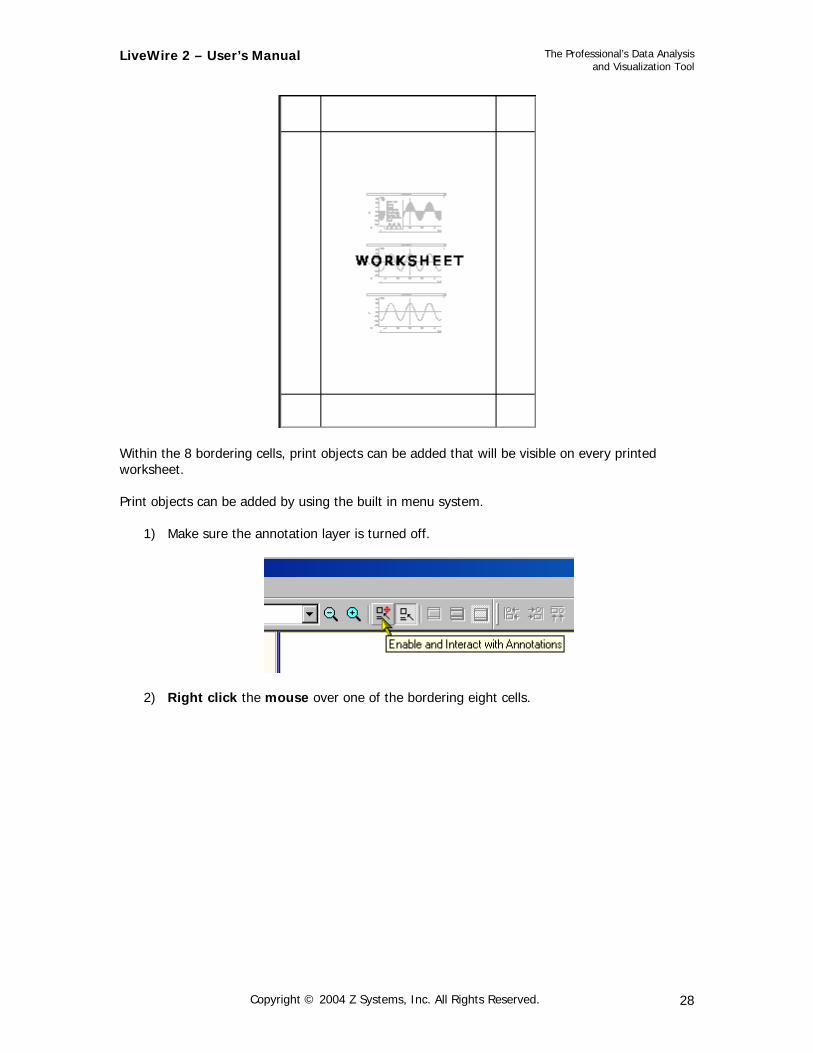
Within the 8 bordering cells, print objects can be added that will be visible on every printed worksheet. Print objects can be added by using the built in menu system.
1) Make sure the annotation layer is turned off.
2) Right click the mouse over one of the bordering eight cells.
Copyright © 2004 Z Systems, Inc. All Rights Reserved. 28
LiveWire 2 – User’s Manual
The Professional’s Data Analysis and Visualization Tool
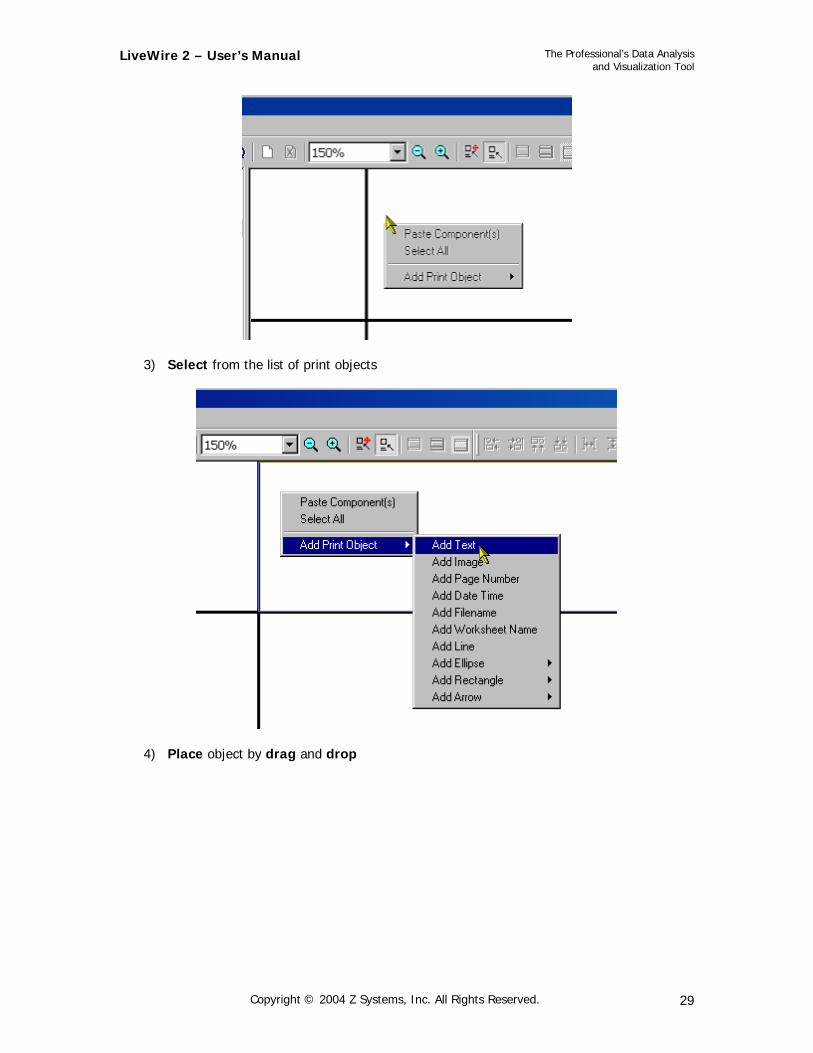
3) Select from the list of print objects
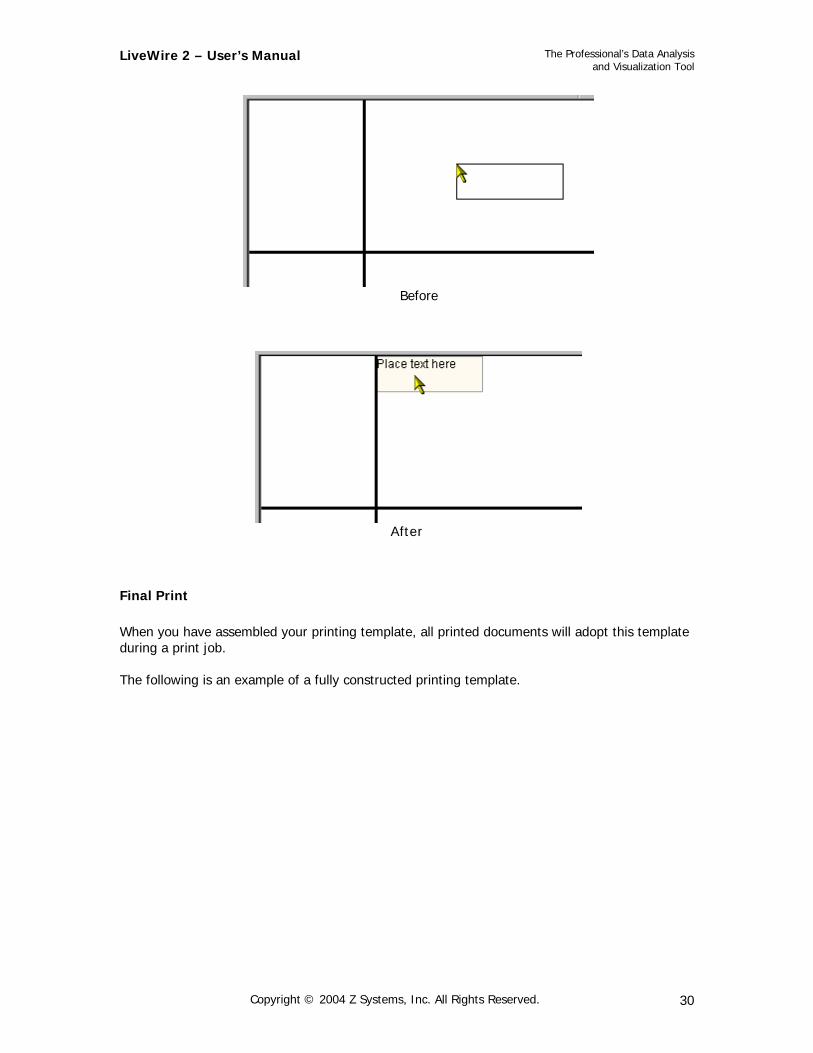
4) Place object by drag and drop
Copyright © 2004 Z Systems, Inc. All Rights Reserved. 29
LiveWire 2 – User’s Manual
The Professional’s Data Analysis and Visualization Tool
Before
After
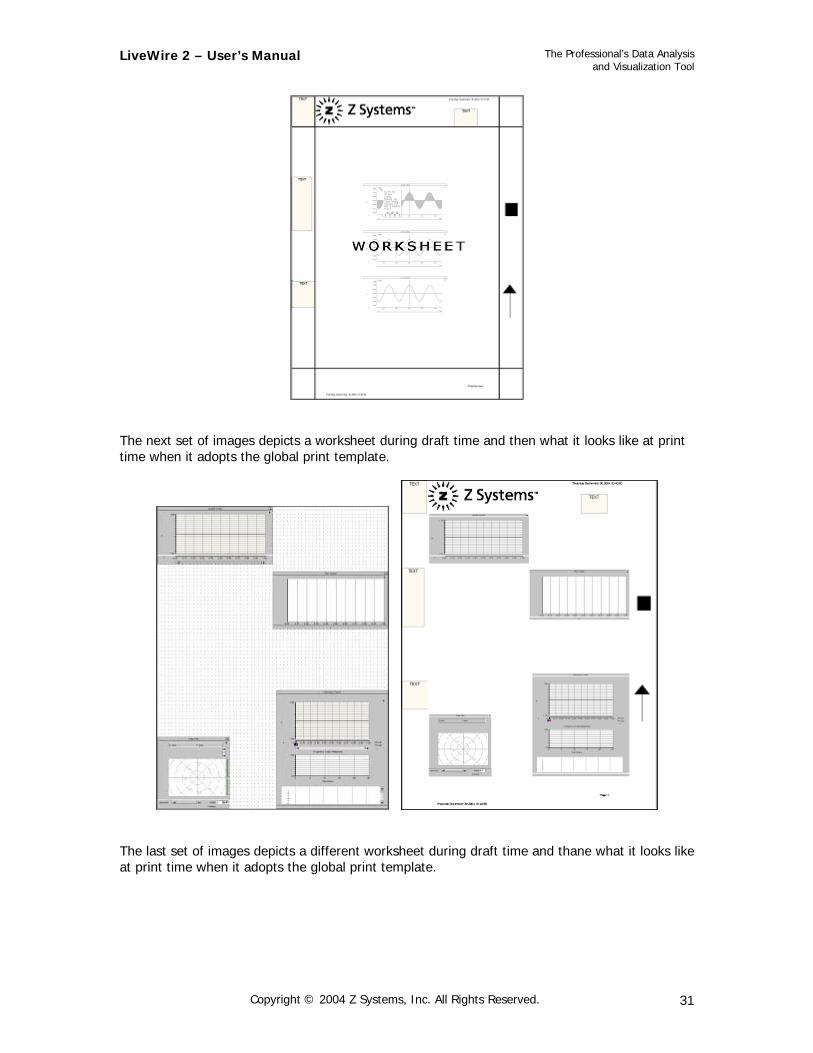
Final Print When you have assembled your printing template, all printed documents will adopt this template during a print job. The following is an example of a fully constructed printing template.
Copyright © 2004 Z Systems, Inc. All Rights Reserved. 30
LiveWire 2 – User’s Manual
The Professional’s Data Analysis and Visualization Tool
The next set of images depicts a worksheet during draft time and then what it looks like at print time when it adopts the global print template.
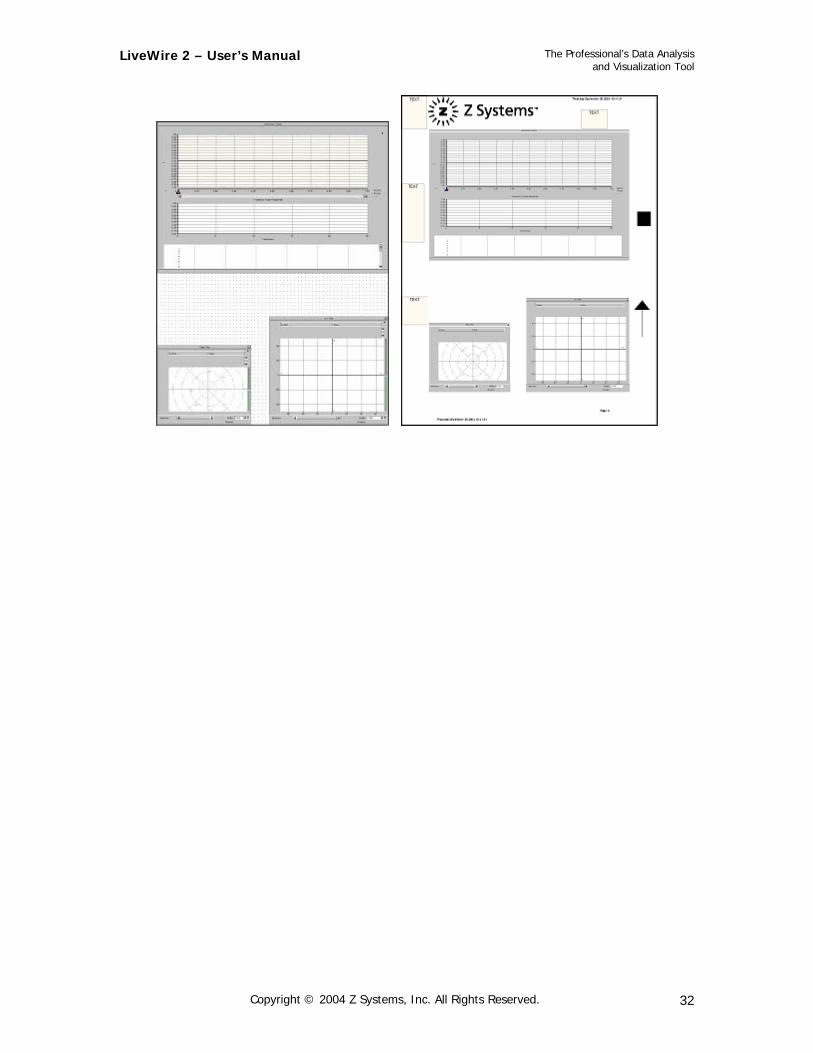
The last set of images depicts a different worksheet during draft time and thane what it looks like at print time when it adopts the global print template.
Copyright © 2004 Z Systems, Inc. All Rights Reserved. 31
LiveWire 2 – User’s Manual
The Professional’s Data Analysis and Visualization Tool
Copyright © 2004 Z Systems, Inc. All Rights Reserved. 32
LiveWire 2 – User’s Manual
The Professional’s Data Analysis and Visualization Tool
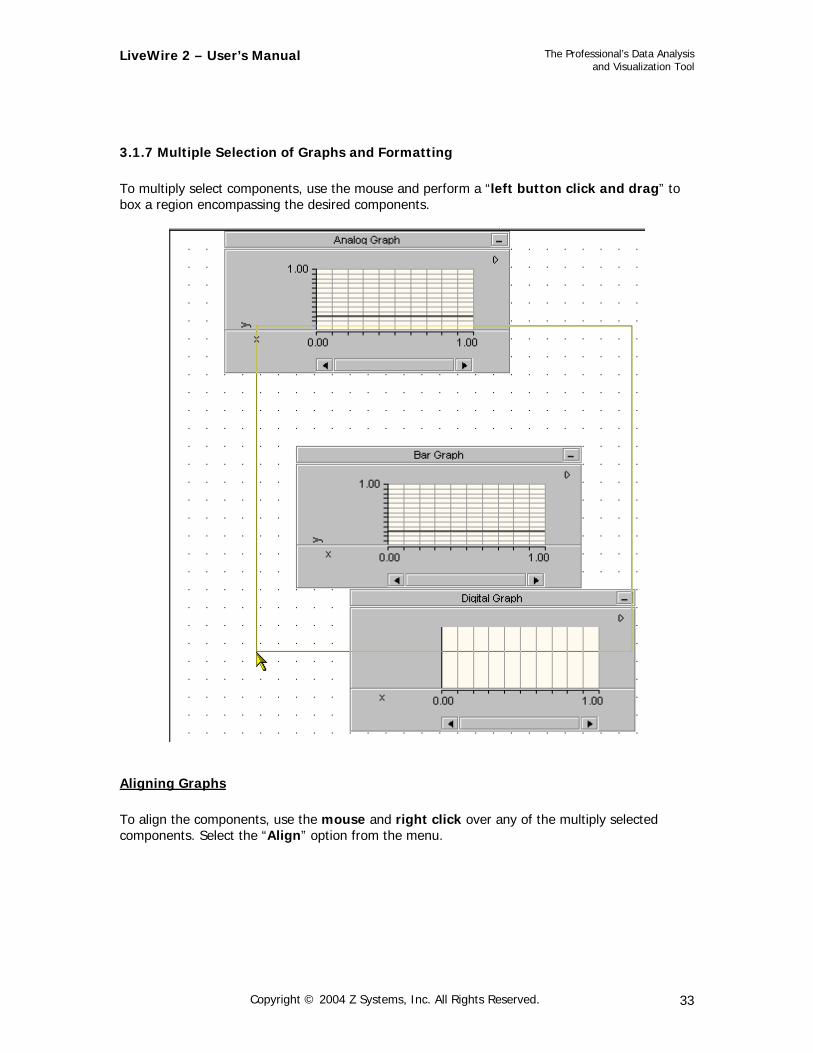
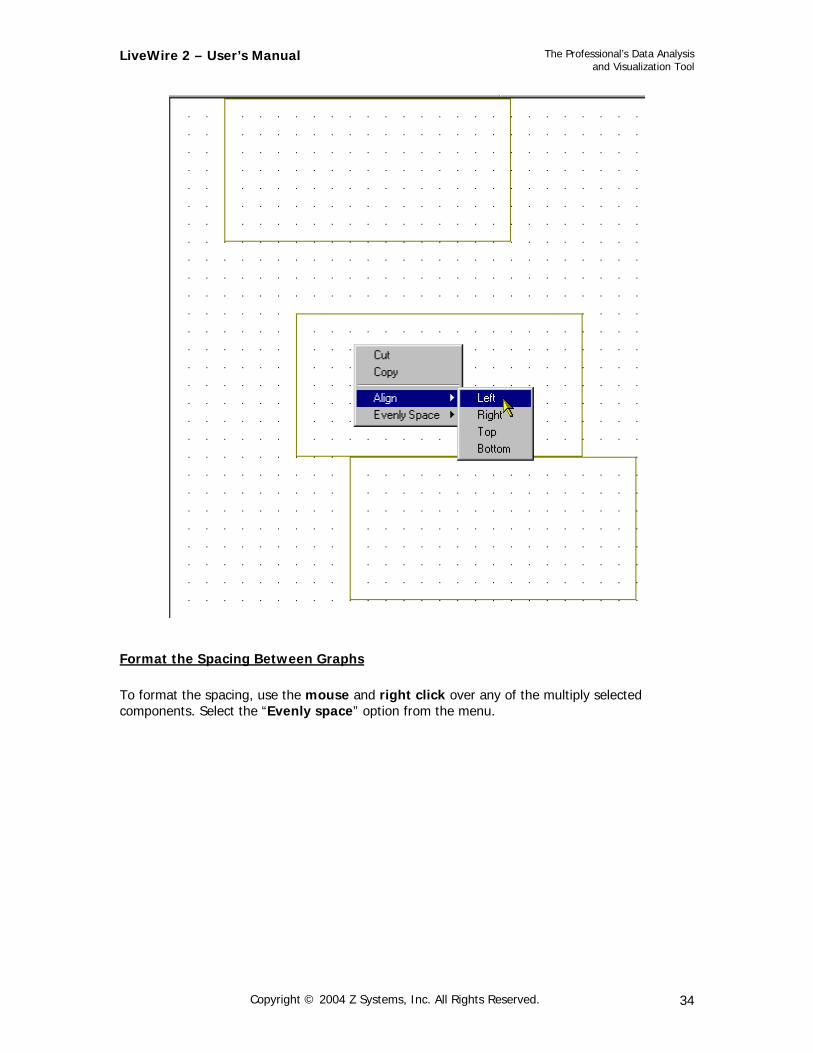
3.1.7 Multiple Selection of Graphs and Formatting To multiply select components, use the mouse and perform a “left button click and drag” to box a region encompassing the desired components.
Aligning Graphs To align the components, use the mouse and right click over any of the multiply selected components. Select the “Align” option from the menu.
Copyright © 2004 Z Systems, Inc. All Rights Reserved. 33
LiveWire 2 – User’s Manual
The Professional’s Data Analysis and Visualization Tool
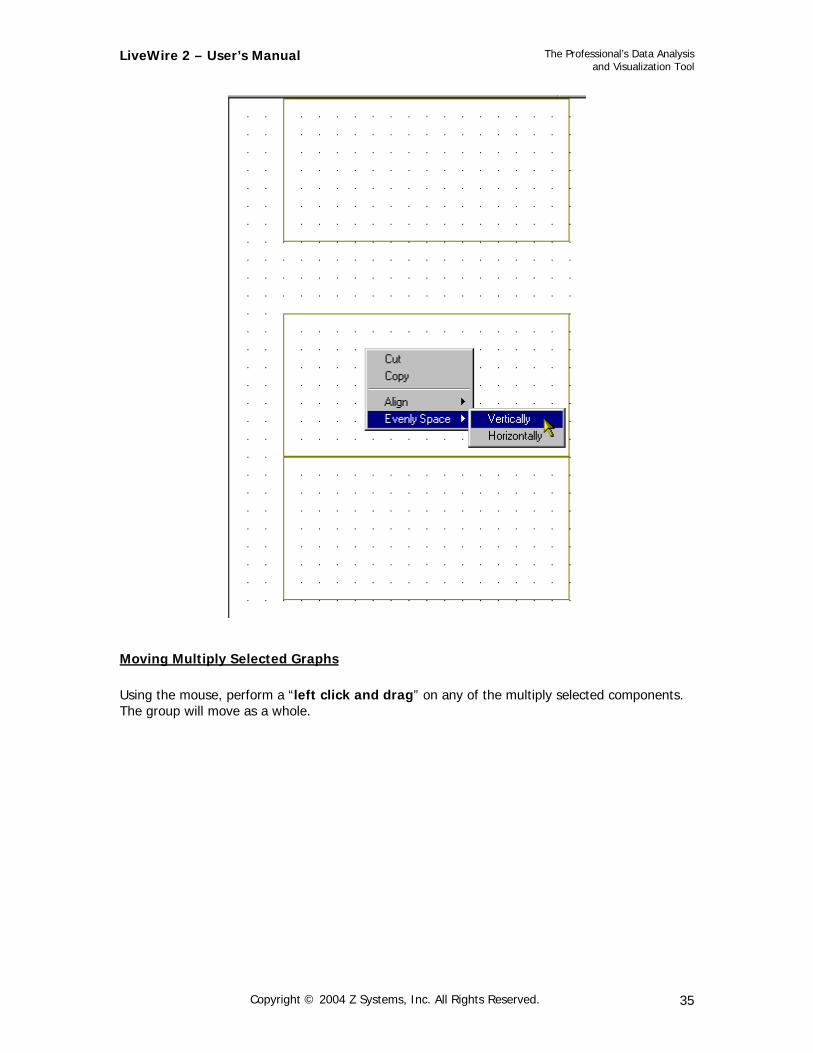
Format the Spacing Between Graphs To format the spacing, use the mouse and right click over any of the multiply selected components. Select the “Evenly space” option from the menu.
Copyright © 2004 Z Systems, Inc. All Rights Reserved. 34
LiveWire 2 – User’s Manual
The Professional’s Data Analysis and Visualization Tool
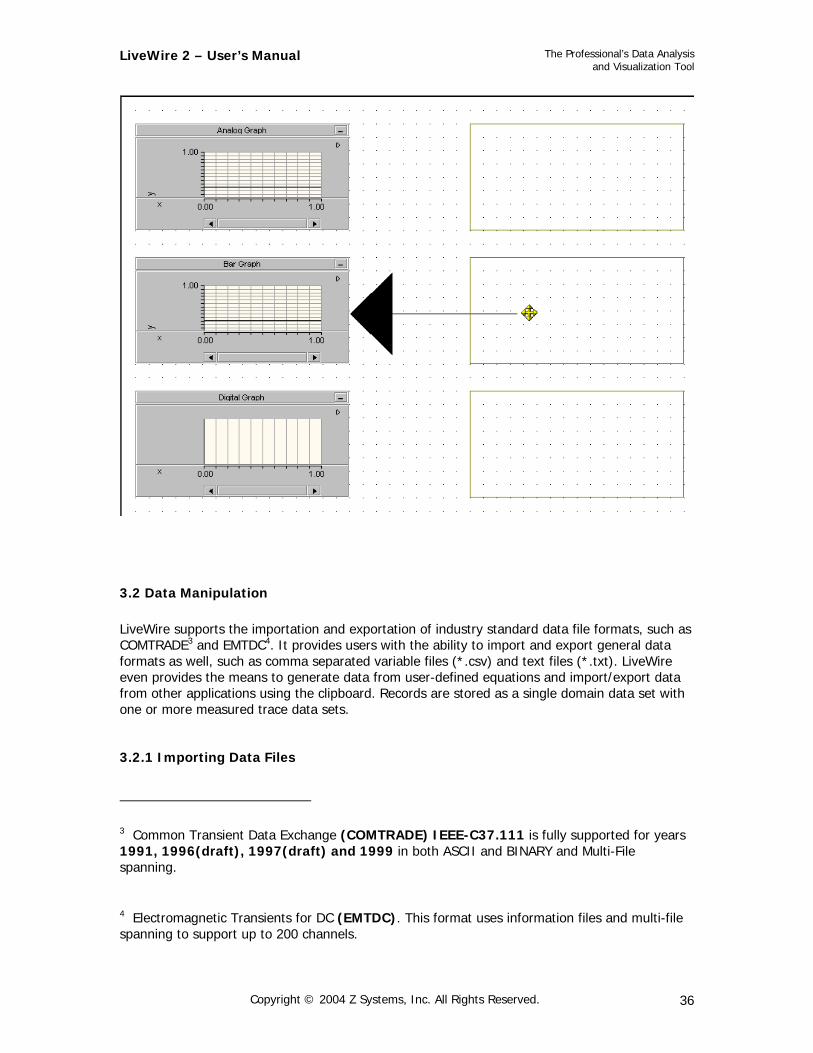
Moving Multiply Selected Graphs Using the mouse, perform a “left click and drag” on any of the multiply selected components. The group will move as a whole.
Copyright © 2004 Z Systems, Inc. All Rights Reserved. 35
LiveWire 2 – User’s Manual
The Professional’s Data Analysis and Visualization Tool
3.2 Data Manipulation LiveWire supports the importation and exportation of industry standard data file formats, such as COMTRADE3 and EMTDC4. It provides users with the ability to import and export general data formats as well, such as comma separated variable files (*.csv) and text files (*.txt). LiveWire even provides the means to generate data from user-defined equations and import/export data from other applications using the clipboard. Records are stored as a single domain data set with one or more measured trace data sets.
3.2.1 Importing Data Files
3 Common Transient Data Exchange (COMTRADE) IEEE-C37.111 is fully supported for years 1991, 1996(draft), 1997(draft) and 1999 in both ASCII and BINARY and Multi-File spanning.
4 Electromagnetic Transients for DC (EMTDC). This format uses information files and multi-file spanning to support up to 200 channels.
Copyright © 2004 Z Systems, Inc. All Rights Reserved. 36
LiveWire 2 – User’s Manual
The Professional’s Data Analysis and Visualization Tool
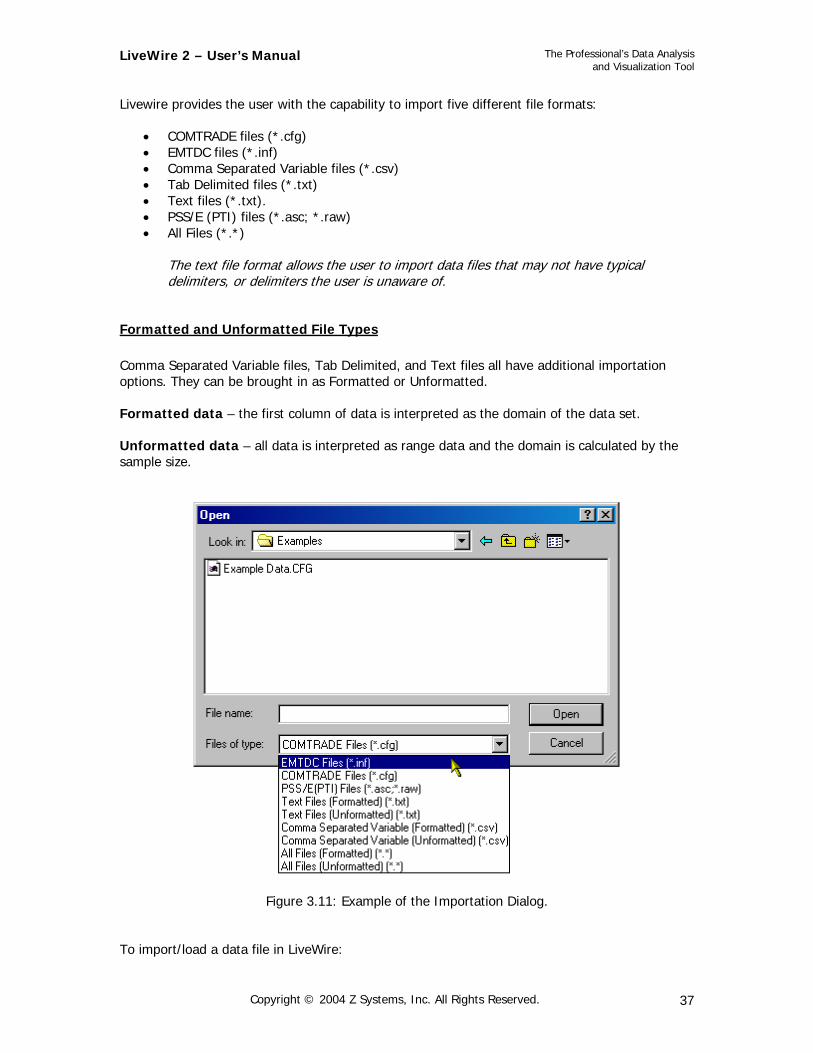
Livewire provides the user with the capability to import five different file formats:
• COMTRADE files (*.cfg) • EMTDC files (*.inf) • Comma Separated Variable files (*.csv) • Tab Delimited files (*.txt) • Text files (*.txt). • PSS/E (PTI) files (*.asc; *.raw) • All Files (*.*)
The text file format allows the user to import data files that may not have typical delimiters, or delimiters the user is unaware of.
Formatted and Unformatted File Types Comma Separated Variable files, Tab Delimited, and Text files all have additional importation options. They can be brought in as Formatted or Unformatted. Formatted data – the first column of data is interpreted as the domain of the data set. Unformatted data – all data is interpreted as range data and the domain is calculated by the sample size.
Figure 3.11: Example of the Importation Dialog.
To import/load a data file in LiveWire:
Copyright © 2004 Z Systems, Inc. All Rights Reserved. 37
LiveWire 2 – User’s Manual
The Professional’s Data Analysis and Visualization Tool
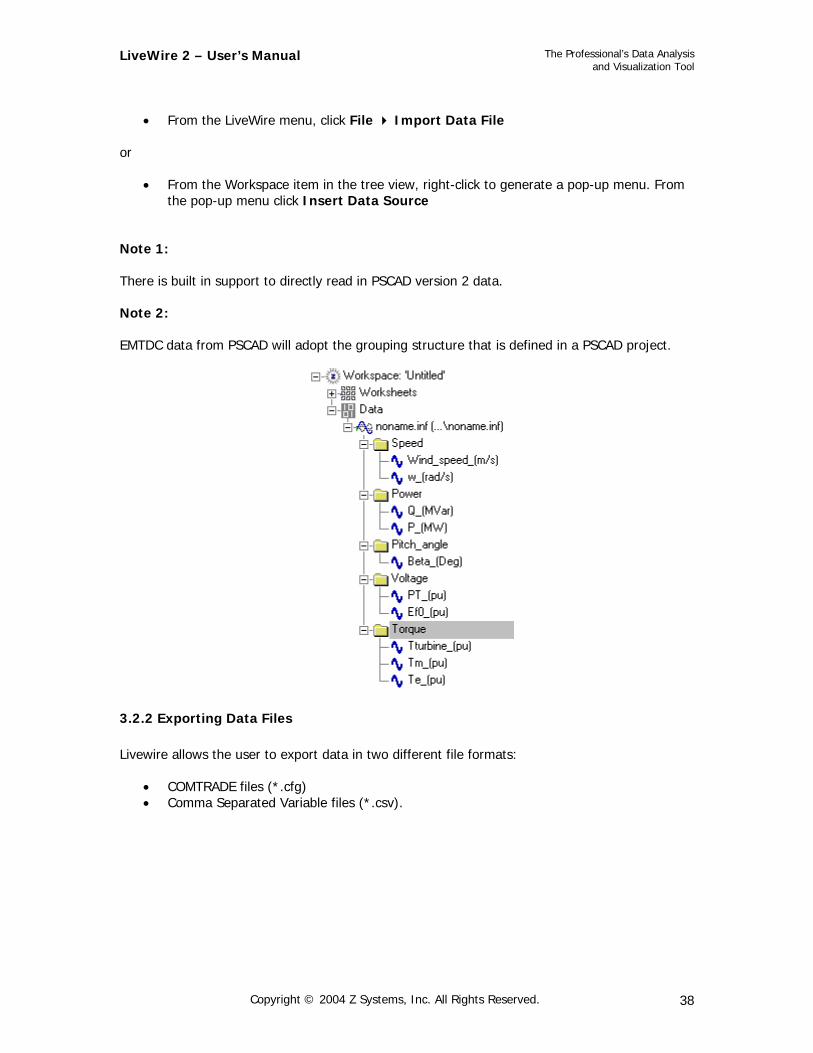
• From the LiveWire menu, click File Import Data File or
• From the Workspace item in the tree view, right-click to generate a pop-up menu. From
the pop-up menu click Insert Data Source
Note 1: There is built in support to directly read in PSCAD version 2 data. Note 2: EMTDC data from PSCAD will adopt the grouping structure that is defined in a PSCAD project.
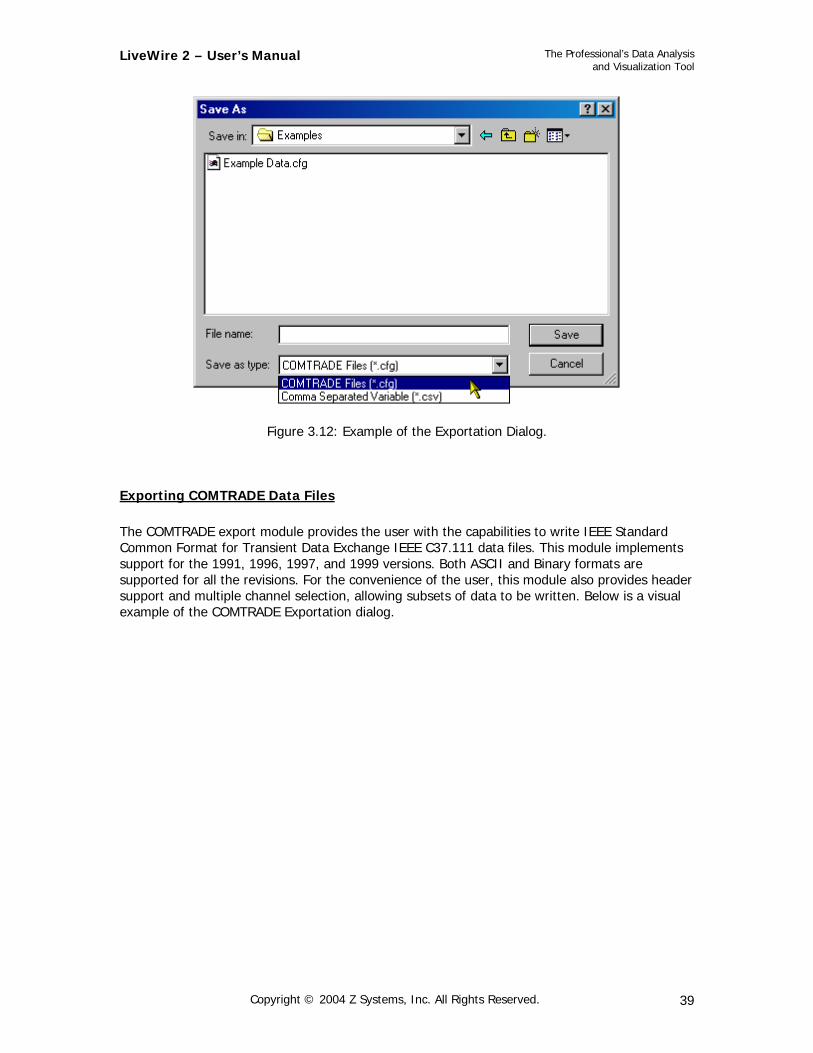
3.2.2 Exporting Data Files Livewire allows the user to export data in two different file formats:
• COMTRADE files (*.cfg) • Comma Separated Variable files (*.csv).
Copyright © 2004 Z Systems, Inc. All Rights Reserved. 38
LiveWire 2 – User’s Manual
The Professional’s Data Analysis and Visualization Tool
Figure 3.12: Example of the Exportation Dialog.
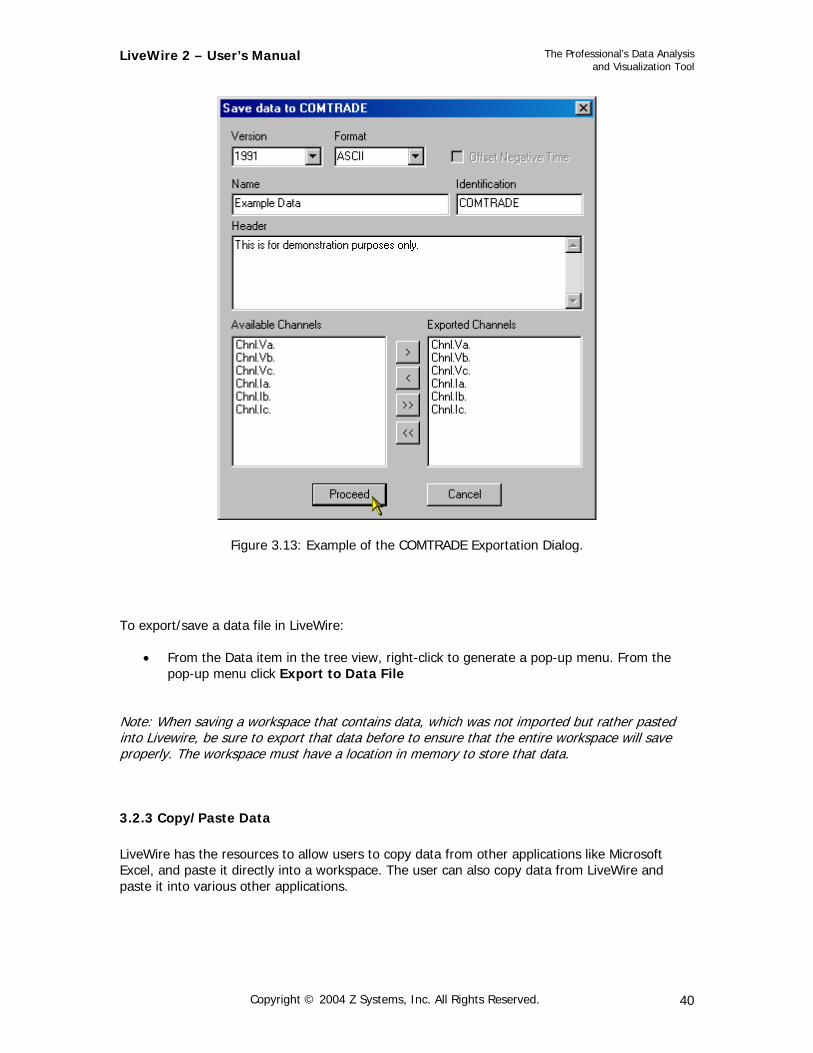
Exporting COMTRADE Data Files The COMTRADE export module provides the user with the capabilities to write IEEE Standard Common Format for Transient Data Exchange IEEE C37.111 data files. This module implements support for the 1991, 1996, 1997, and 1999 versions. Both ASCII and Binary formats are supported for all the revisions. For the convenience of the user, this module also provides header support and multiple channel selection, allowing subsets of data to be written. Below is a visual example of the COMTRADE Exportation dialog.
Copyright © 2004 Z Systems, Inc. All Rights Reserved. 39
LiveWire 2 – User’s Manual
The Professional’s Data Analysis and Visualization Tool
Figure 3.13: Example of the COMTRADE Exportation Dialog.
To export/save a data file in LiveWire:
• From the Data item in the tree view, right-click to generate a pop-up menu. From the pop-up menu click Export to Data File
Note: When saving a workspace that contains data, which was not imported but rather pasted into Livewire, be sure to export that data before to ensure that the entire workspace will save properly. The workspace must have a location in memory to store that data.
3.2.3 Copy/Paste Data LiveWire has the resources to allow users to copy data from other applications like Microsoft Excel, and paste it directly into a workspace. The user can also copy data from LiveWire and paste it into various other applications.
Copyright © 2004 Z Systems, Inc. All Rights Reserved. 40
LiveWire 2 – User’s Manual
The Professional’s Data Analysis and Visualization Tool
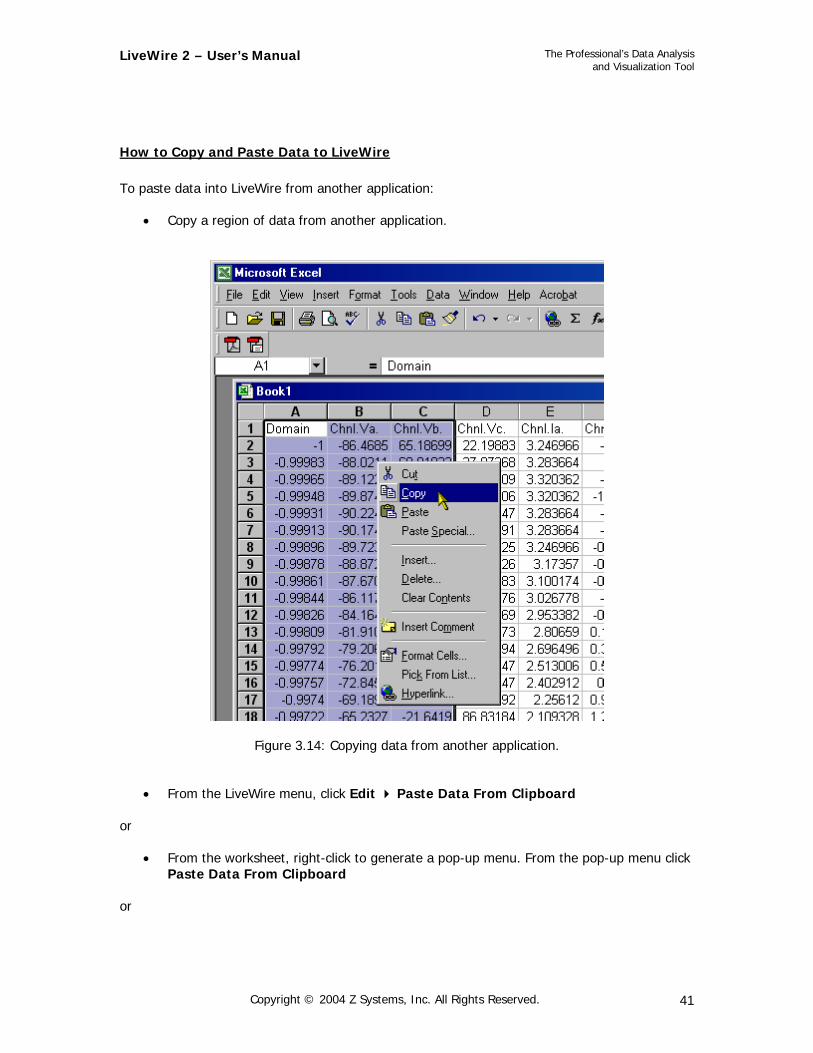
How to Copy and Paste Data to LiveWire To paste data into LiveWire from another application:
• Copy a region of data from another application.
Figure 3.14: Copying data from another application.
• From the LiveWire menu, click Edit Paste Data From Clipboard
or
• From the worksheet, right-click to generate a pop-up menu. From the pop-up menu click Paste Data From Clipboard
or
Copyright © 2004 Z Systems, Inc. All Rights Reserved. 41
LiveWire 2 – User’s Manual
The Professional’s Data Analysis and Visualization Tool
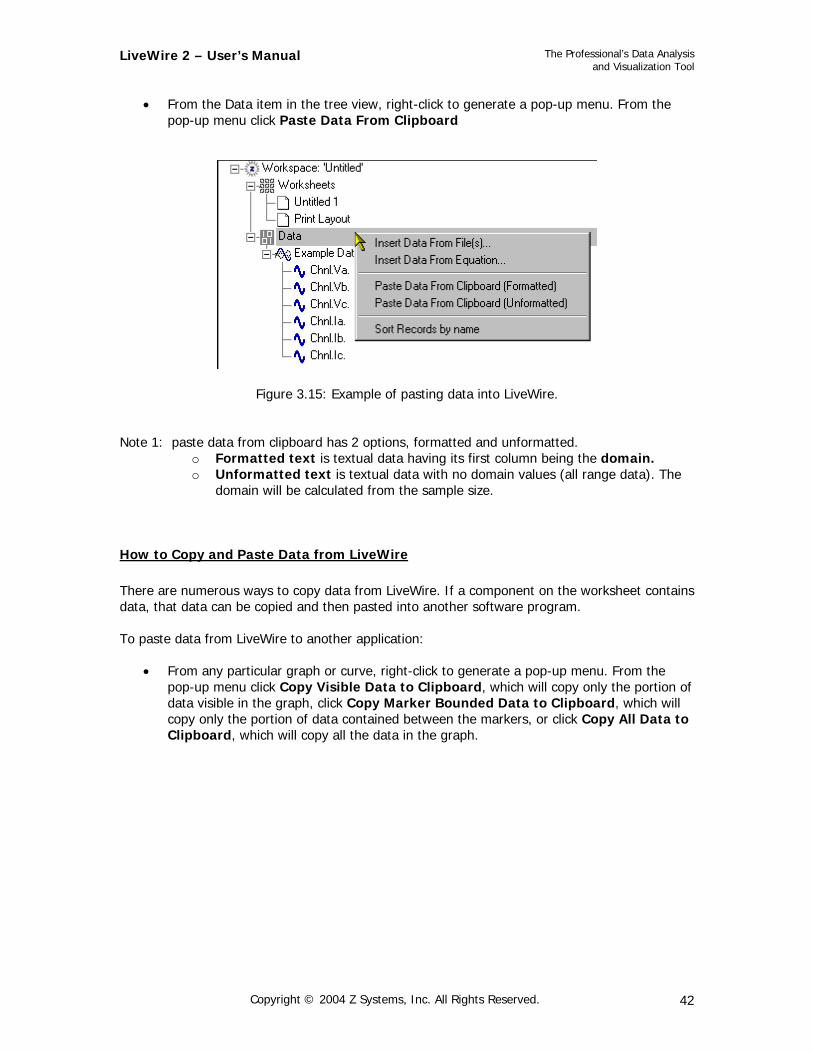
• From the Data item in the tree view, right-click to generate a pop-up menu. From the
pop-up menu click Paste Data From Clipboard
Figure 3.15: Example of pasting data into LiveWire. Note 1: paste data from clipboard has 2 options, formatted and unformatted.
o Formatted text is textual data having its first column being the domain. o Unformatted text is textual data with no domain values (all range data). The
domain will be calculated from the sample size.
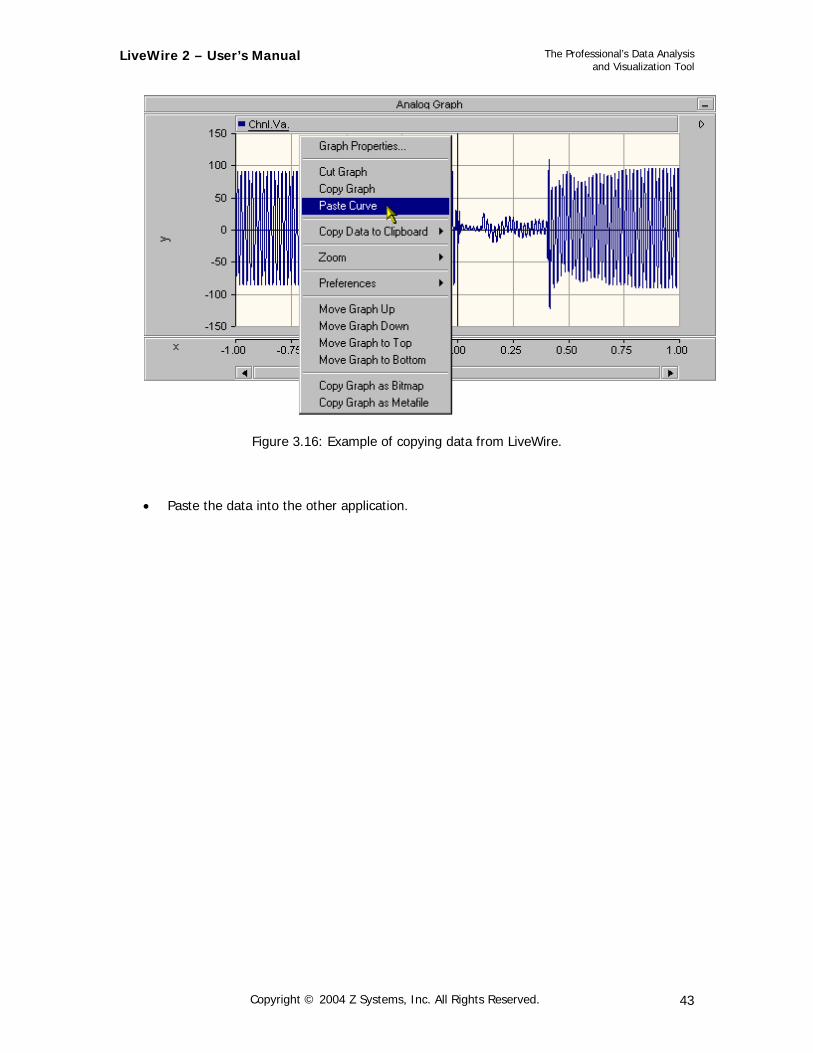
How to Copy and Paste Data from LiveWire There are numerous ways to copy data from LiveWire. If a component on the worksheet contains data, that data can be copied and then pasted into another software program. To paste data from LiveWire to another application:
• From any particular graph or curve, right-click to generate a pop-up menu. From the pop-up menu click Copy Visible Data to Clipboard, which will copy only the portion of data visible in the graph, click Copy Marker Bounded Data to Clipboard, which will copy only the portion of data contained between the markers, or click Copy All Data to Clipboard, which will copy all the data in the graph.
Copyright © 2004 Z Systems, Inc. All Rights Reserved. 42
LiveWire 2 – User’s Manual
The Professional’s Data Analysis and Visualization Tool
Figure 3.16: Example of copying data from LiveWire.
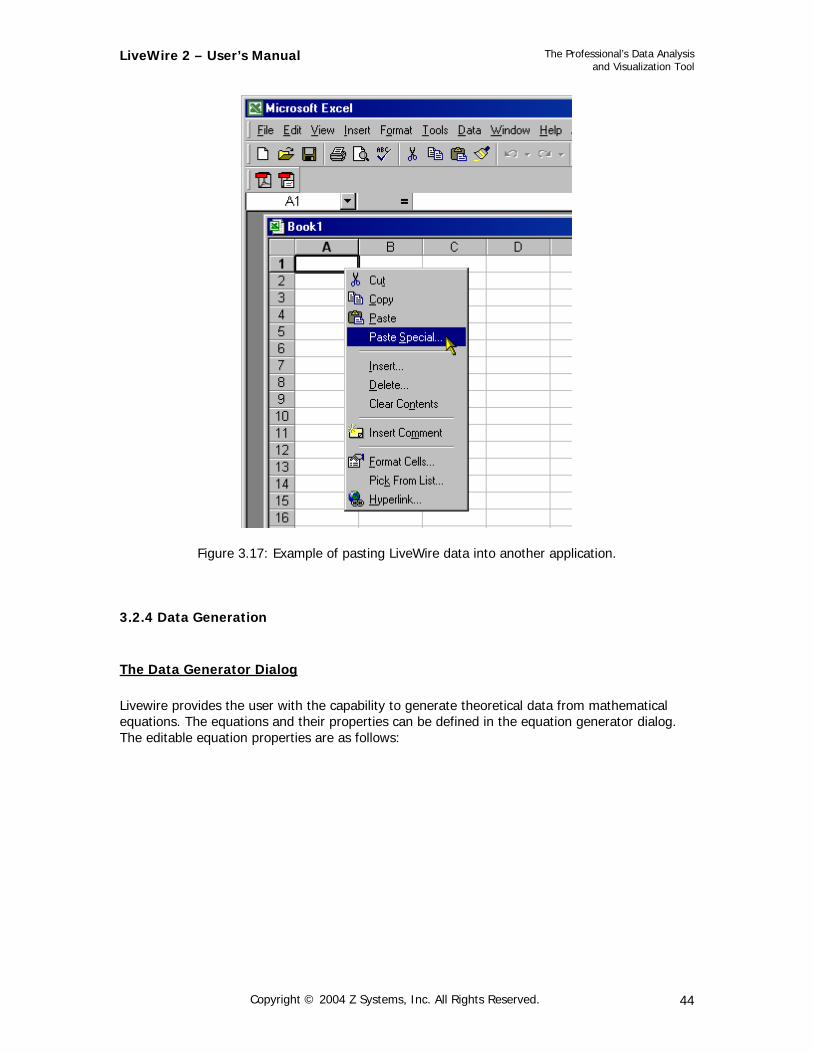
• Paste the data into the other application.
Copyright © 2004 Z Systems, Inc. All Rights Reserved. 43
LiveWire 2 – User’s Manual
The Professional’s Data Analysis and Visualization Tool
Figure 3.17: Example of pasting LiveWire data into another application.
3.2.4 Data Generation
The Data Generator Dialog Livewire provides the user with the capability to generate theoretical data from mathematical equations. The equations and their properties can be defined in the equation generator dialog. The editable equation properties are as follows:
Copyright © 2004 Z Systems, Inc. All Rights Reserved. 44
LiveWire 2 – User’s Manual
The Professional’s Data Analysis and Visualization Tool
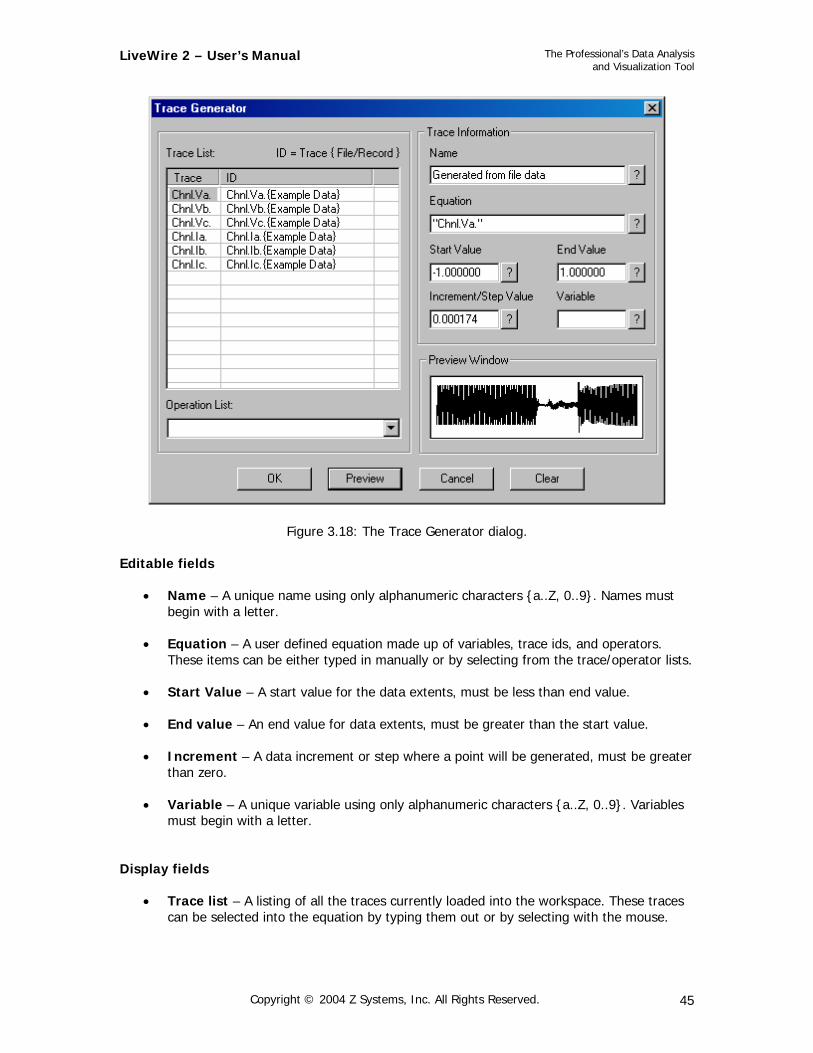
Figure 3.18: The Trace Generator dialog. Editable fields
• Name – A unique name using only alphanumeric characters {a..Z, 0..9}. Names must begin with a letter.
• Equation – A user defined equation made up of variables, trace ids, and operators.
These items can be either typed in manually or by selecting from the trace/operator lists.
• Start Value – A start value for the data extents, must be less than end value.
• End value – An end value for data extents, must be greater than the start value.
• Increment – A data increment or step where a point will be generated, must be greater than zero.
• Variable – A unique variable using only alphanumeric characters {a..Z, 0..9}. Variables
must begin with a letter. Display fields
• Trace list – A listing of all the traces currently loaded into the workspace. These traces can be selected into the equation by typing them out or by selecting with the mouse.
Copyright © 2004 Z Systems, Inc. All Rights Reserved. 45
LiveWire 2 – User’s Manual
The Professional’s Data Analysis and Visualization Tool
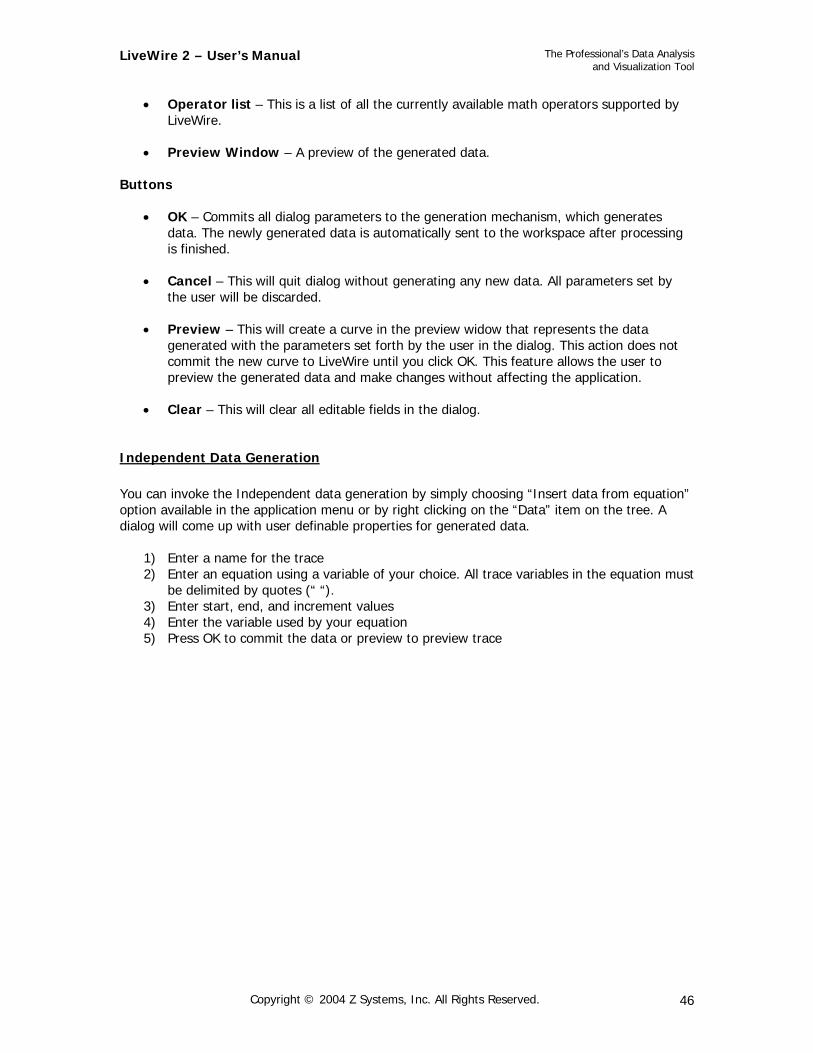
• Operator list – This is a list of all the currently available math operators supported by
LiveWire.
• Preview Window – A preview of the generated data. Buttons
• OK – Commits all dialog parameters to the generation mechanism, which generates data. The newly generated data is automatically sent to the workspace after processing is finished.
• Cancel – This will quit dialog without generating any new data. All parameters set by
the user will be discarded.
• Preview – This will create a curve in the preview widow that represents the data generated with the parameters set forth by the user in the dialog. This action does not commit the new curve to LiveWire until you click OK. This feature allows the user to preview the generated data and make changes without affecting the application.
• Clear – This will clear all editable fields in the dialog.
Independent Data Generation You can invoke the Independent data generation by simply choosing “Insert data from equation” option available in the application menu or by right clicking on the “Data” item on the tree. A dialog will come up with user definable properties for generated data.
1) Enter a name for the trace 2) Enter an equation using a variable of your choice. All trace variables in the equation must
be delimited by quotes (“ “). 3) Enter start, end, and increment values 4) Enter the variable used by your equation 5) Press OK to commit the data or preview to preview trace
Copyright © 2004 Z Systems, Inc. All Rights Reserved. 46
LiveWire 2 – User’s Manual
The Professional’s Data Analysis and Visualization Tool
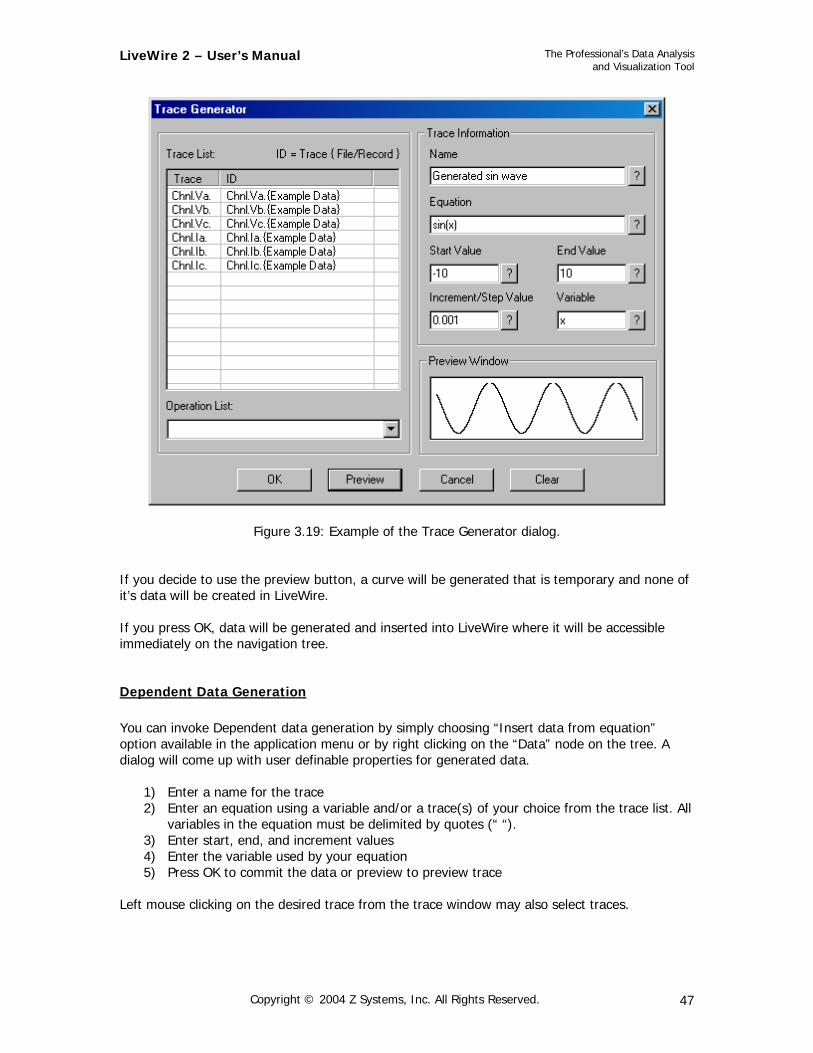
Figure 3.19: Example of the Trace Generator dialog.
If you decide to use the preview button, a curve will be generated that is temporary and none of it’s data will be created in LiveWire. If you press OK, data will be generated and inserted into LiveWire where it will be accessible immediately on the navigation tree.
Dependent Data Generation You can invoke Dependent data generation by simply choosing “Insert data from equation” option available in the application menu or by right clicking on the “Data” node on the tree. A dialog will come up with user definable properties for generated data.
1) Enter a name for the trace 2) Enter an equation using a variable and/or a trace(s) of your choice from the trace list. All
variables in the equation must be delimited by quotes (“ “). 3) Enter start, end, and increment values 4) Enter the variable used by your equation 5) Press OK to commit the data or preview to preview trace
Left mouse clicking on the desired trace from the trace window may also select traces.
Copyright © 2004 Z Systems, Inc. All Rights Reserved. 47
LiveWire 2 – User’s Manual
The Professional’s Data Analysis and Visualization Tool
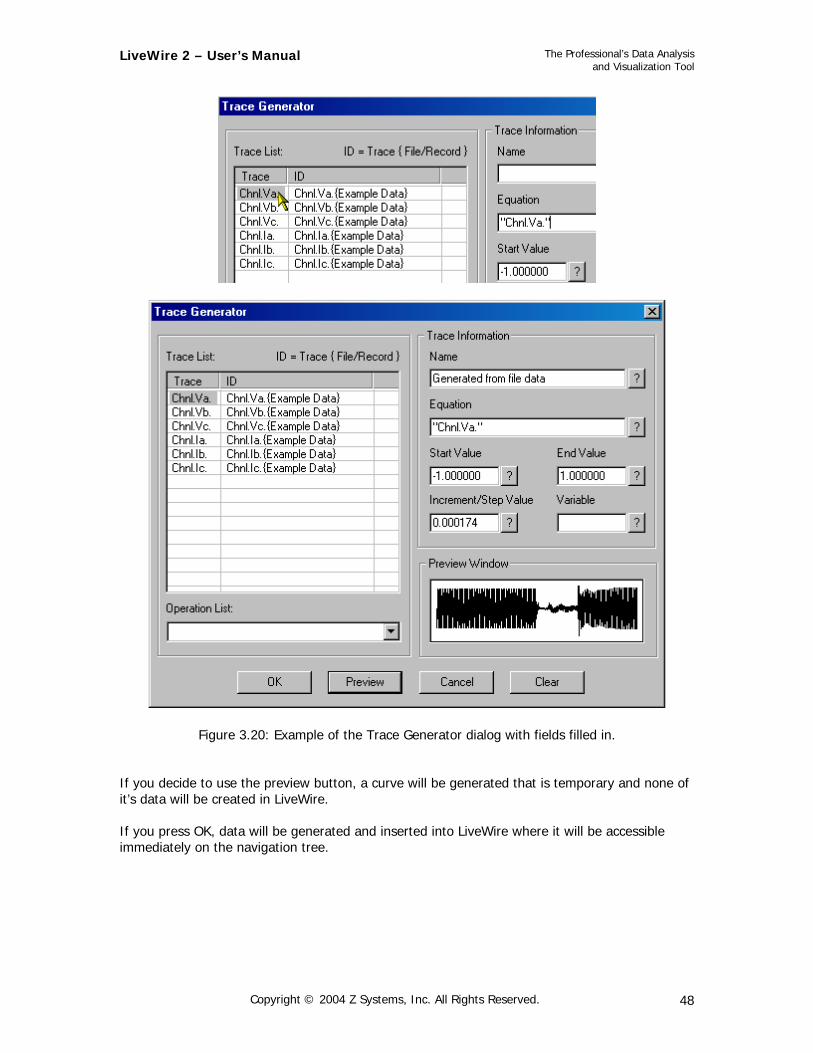
Figure 3.20: Example of the Trace Generator dialog with fields filled in. If you decide to use the preview button, a curve will be generated that is temporary and none of it’s data will be created in LiveWire. If you press OK, data will be generated and inserted into LiveWire where it will be accessible immediately on the navigation tree.
Copyright © 2004 Z Systems, Inc. All Rights Reserved. 48
LiveWire 2 – User’s Manual
The Professional’s Data Analysis and Visualization Tool
Dependent Data Generation *Special Note* (mismatched data) LiveWire allows the user to perform mathematical operations on two sets of data whose bounds and increments are mismatched. To see how it is handled, the following two examples illustrate but problems separately. Case 1 “Mismatched bounds” Two sets of data are added - Data set 1 starts at time 0 and ends at time 10 - Data set 2 starts at time 5 and ends at time 10 - Bounds for the new generated curve are set by the user from –10 to 10 Result The new data will be created as follows: - No data will exist from –10 to 0 but a domain will exist - Data from 0 to 5 will be created that is an exact copy of Data set 1 from 0 to 5 - Data from 5 to 10 will be the addition of Data set 1 and Data set 2
Case 2 “Mismatched data increment” Two sets of data are added - Data set 1 increment does not match Data set 2 increment - User sets the increment of the generated data to neither that of set 1 or 2 Result The new data will be created as follows: - The increment of the generated curve will be the user defined increment - Data from both dependant curves are INTERPOLATED if no data exists at a given time step.
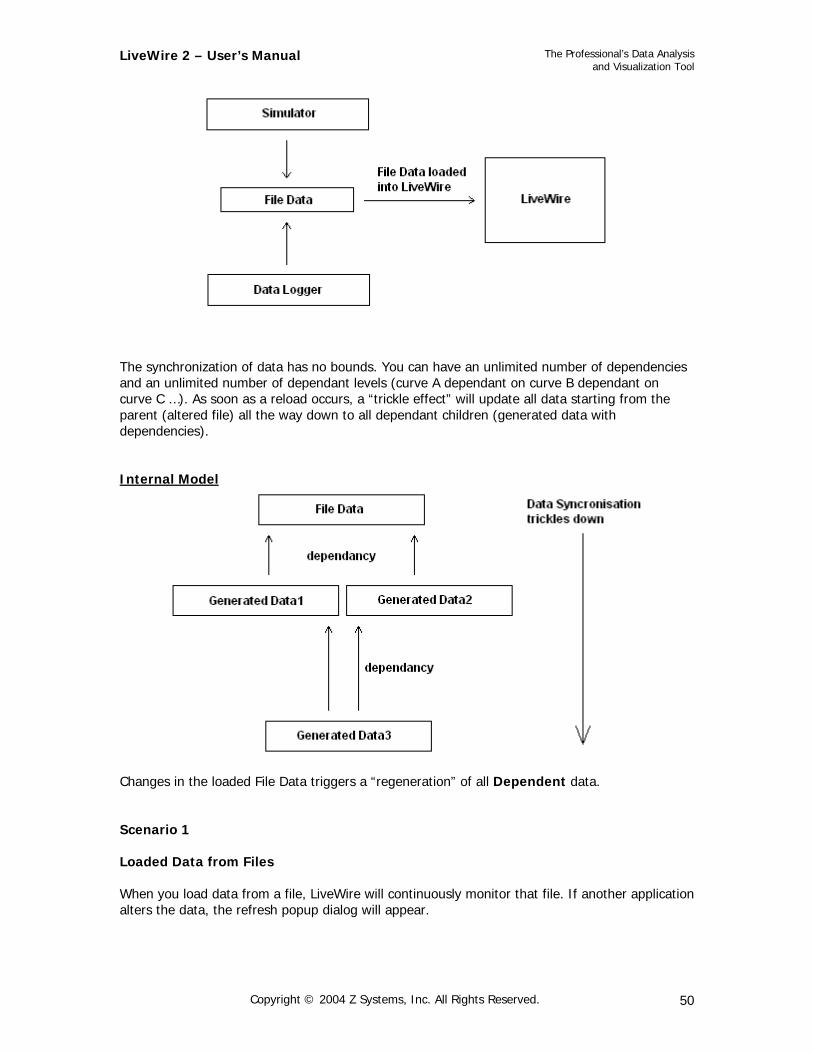
3.2.5 Synchronization of Data This is a special feature that updates the data in LiveWire when data has been changed. A popup box giving the option to reload the file will prompt the user. If the user chooses yes, the data will automatically reload with the changes reflected in the graphs and all dependant data (data generated with an external data as one of the variables). If the user chooses no, the unaltered data will remain in LiveWire. To force a manual reload, there is reload button at the top of the application. It can be pressed at anytime to refresh all data.
External Model LiveWire automatically detects changes in File data when the file has been altered by an external mechanism such as a Data Logger or Simulator.
Copyright © 2004 Z Systems, Inc. All Rights Reserved. 49
LiveWire 2 – User’s Manual
The Professional’s Data Analysis and Visualization Tool
The synchronization of data has no bounds. You can have an unlimited number of dependencies and an unlimited number of dependant levels (curve A dependant on curve B dependant on curve C …). As soon as a reload occurs, a “trickle effect” will update all data starting from the parent (altered file) all the way down to all dependant children (generated data with dependencies).
Internal Model
Changes in the loaded File Data triggers a “regeneration” of all Dependent data. Scenario 1 Loaded Data from Files When you load data from a file, LiveWire will continuously monitor that file. If another application alters the data, the refresh popup dialog will appear.
Copyright © 2004 Z Systems, Inc. All Rights Reserved. 50
LiveWire 2 – User’s Manual
The Professional’s Data Analysis and Visualization Tool
Pressing “Yes” will result in LiveWire reloading the data. Any graphs containing the altered data will also automatically reload. Scenario 2 Generated data with Dependencies on File Data Using the “trace generator”, you can generate data dependent on any external file data. By doing so, the generated trace will have a dependency on a specific file data. If another application alters the data in that file, the refresh popup dialog will appear. Pressing “Yes” will result in LiveWire reloading the file data. Any graphs containing the altered data will also automatically reload. Furthermore all generated data/graphs with dependencies on the reloaded file will also regenerate. NOTE: The synchronization of data has no bounds. You can have an unlimited number of dependencies and an unlimited number of dependant levels (curve A dependant on curve B dependant on curve C …). As soon as a reload occurs, a “trickle effect” will update all data starting from the parent (altered file) all the way down to all dependant children (generated data with dependencies).
3.2.6 Attaching Data to Graphs and Plots For the graphs and/or plots to be useful, you must be able to get the data connected to them. LiveWire provides many different ways to do this. On the worksheet, LiveWire represents every data set as a curve. To display or visualize a data set in a graph it must be attached as a curve.
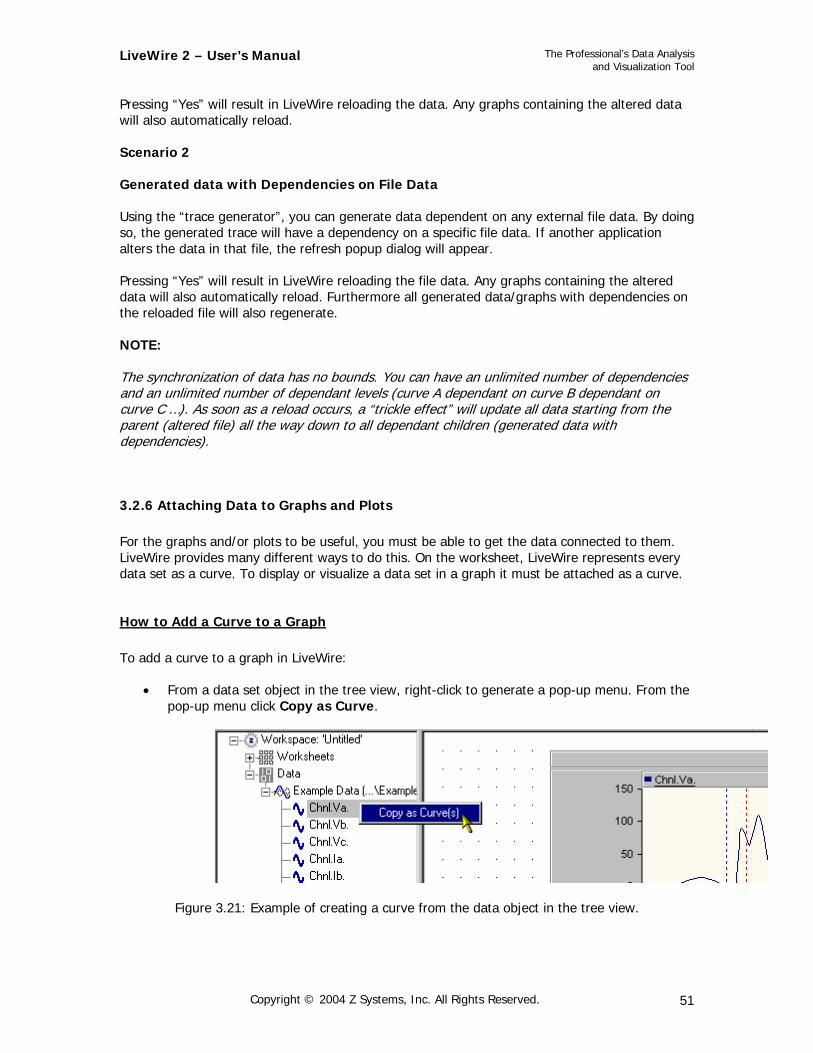
How to Add a Curve to a Graph To add a curve to a graph in LiveWire:
• From a data set object in the tree view, right-click to generate a pop-up menu. From the pop-up menu click Copy as Curve.
Figure 3.21: Example of creating a curve from the data object in the tree view.
Copyright © 2004 Z Systems, Inc. All Rights Reserved. 51
LiveWire 2 – User’s Manual
The Professional’s Data Analysis and Visualization Tool
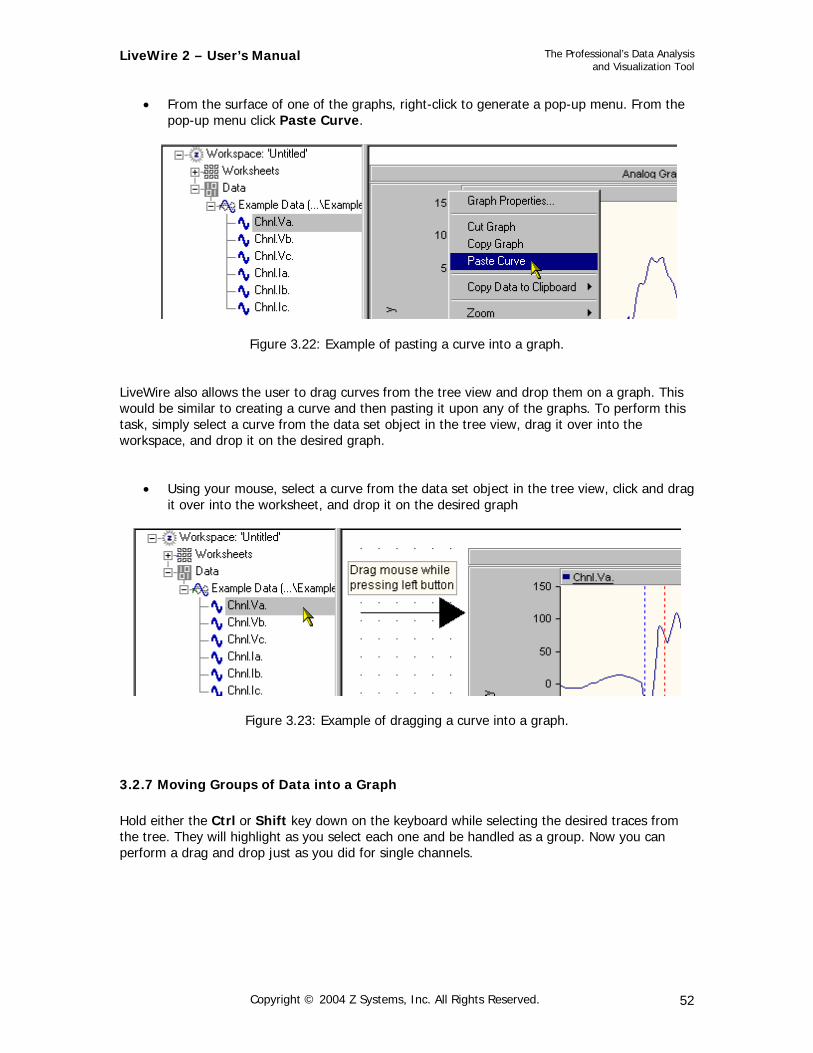
• From the surface of one of the graphs, right-click to generate a pop-up menu. From the
pop-up menu click Paste Curve.
Figure 3.22: Example of pasting a curve into a graph. LiveWire also allows the user to drag curves from the tree view and drop them on a graph. This would be similar to creating a curve and then pasting it upon any of the graphs. To perform this task, simply select a curve from the data set object in the tree view, drag it over into the workspace, and drop it on the desired graph.
• Using your mouse, select a curve from the data set object in the tree view, click and drag it over into the worksheet, and drop it on the desired graph
Figure 3.23: Example of dragging a curve into a graph.
3.2.7 Moving Groups of Data into a Graph Hold either the Ctrl or Shift key down on the keyboard while selecting the desired traces from the tree. They will highlight as you select each one and be handled as a group. Now you can perform a drag and drop just as you did for single channels.
Copyright © 2004 Z Systems, Inc. All Rights Reserved. 52
LiveWire 2 – User’s Manual
The Professional’s Data Analysis and Visualization Tool
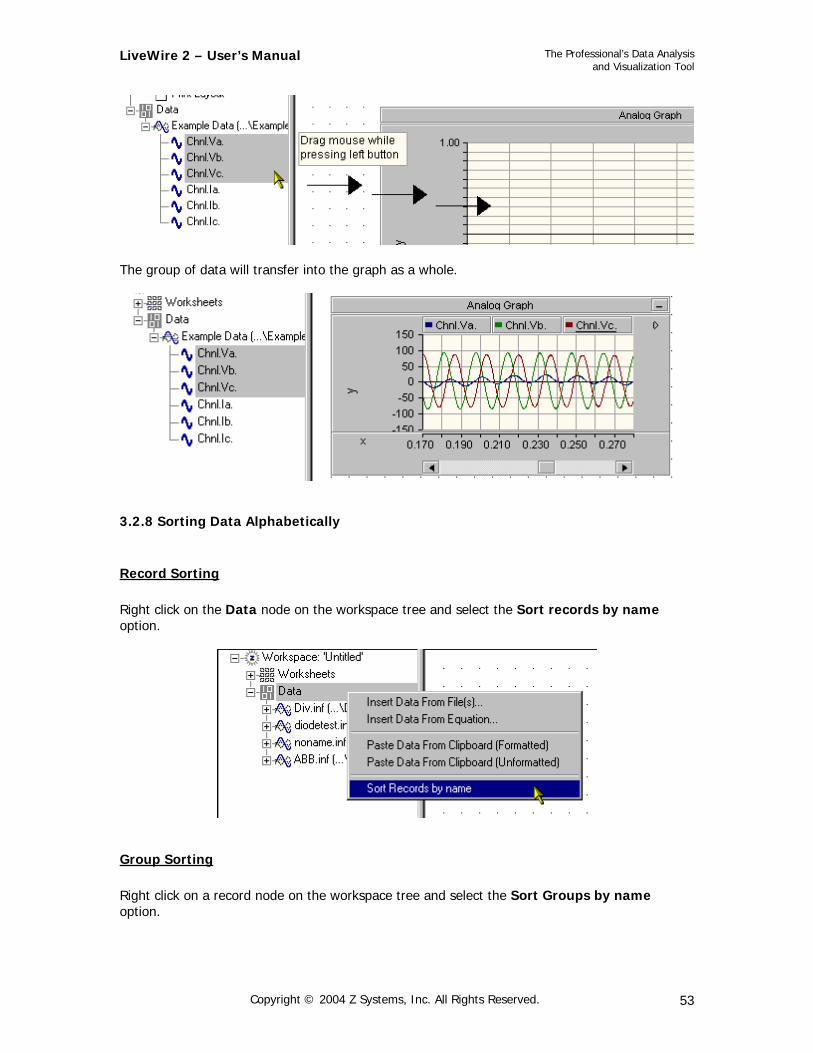
The group of data will transfer into the graph as a whole.
3.2.8 Sorting Data Alphabetically
Record Sorting Right click on the Data node on the workspace tree and select the Sort records by name option.
Group Sorting Right click on a record node on the workspace tree and select the Sort Groups by name option.
Copyright © 2004 Z Systems, Inc. All Rights Reserved. 53
LiveWire 2 – User’s Manual
The Professional’s Data Analysis and Visualization Tool
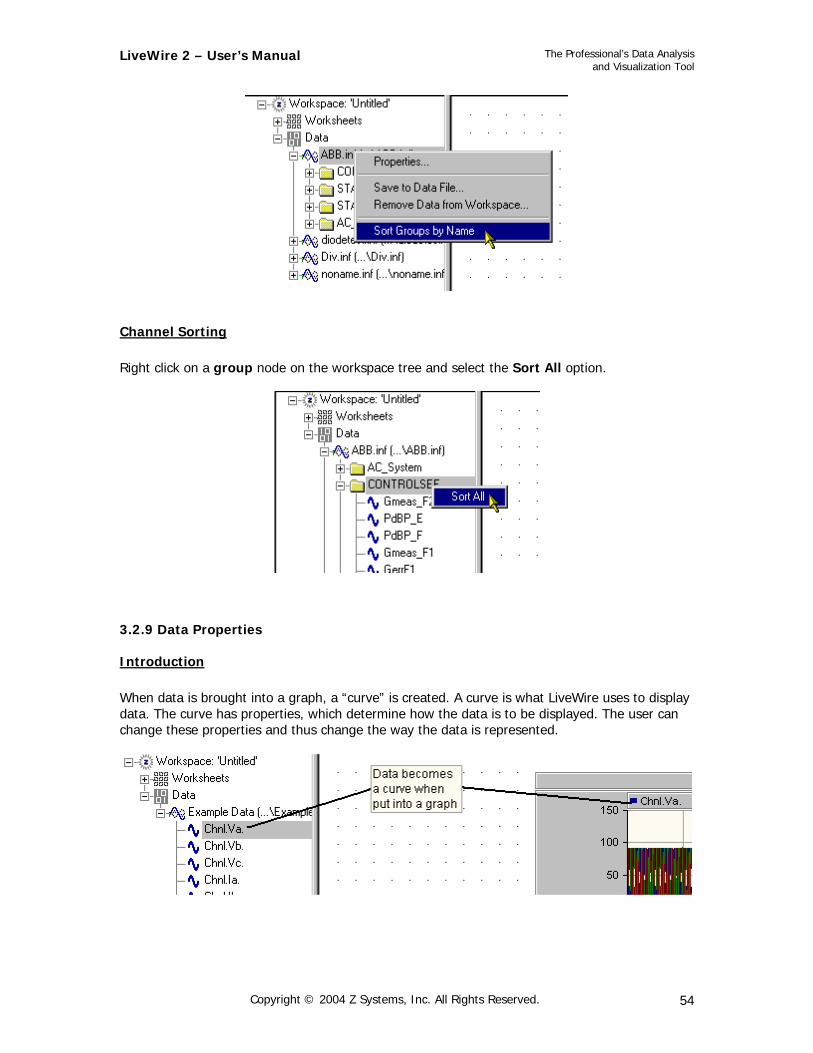
Channel Sorting Right click on a group node on the workspace tree and select the Sort All option.
3.2.9 Data Properties
Introduction When data is brought into a graph, a “curve” is created. A curve is what LiveWire uses to display data. The curve has properties, which determine how the data is to be displayed. The user can change these properties and thus change the way the data is represented.
Copyright © 2004 Z Systems, Inc. All Rights Reserved. 54
LiveWire 2 – User’s Manual
The Professional’s Data Analysis and Visualization Tool
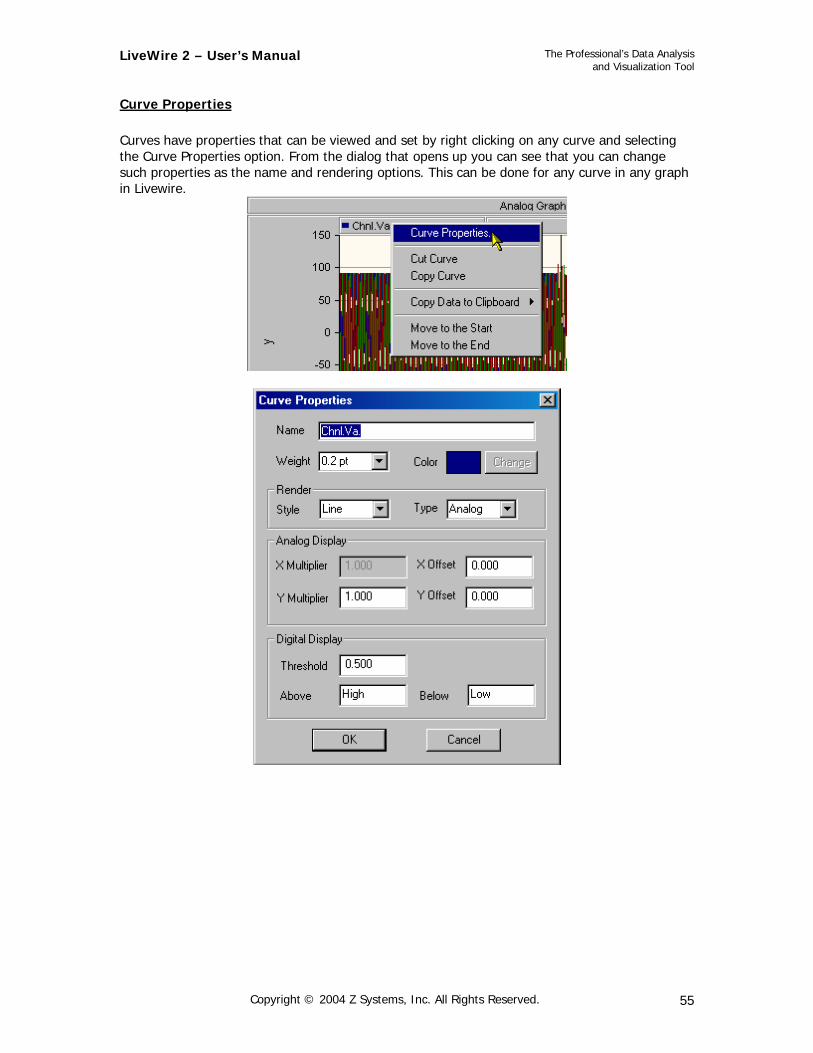
Curve Properties Curves have properties that can be viewed and set by right clicking on any curve and selecting the Curve Properties option. From the dialog that opens up you can see that you can change such properties as the name and rendering options. This can be done for any curve in any graph in Livewire.
Copyright © 2004 Z Systems, Inc. All Rights Reserved. 55
LiveWire 2 – User’s Manual
The Professional’s Data Analysis and Visualization Tool
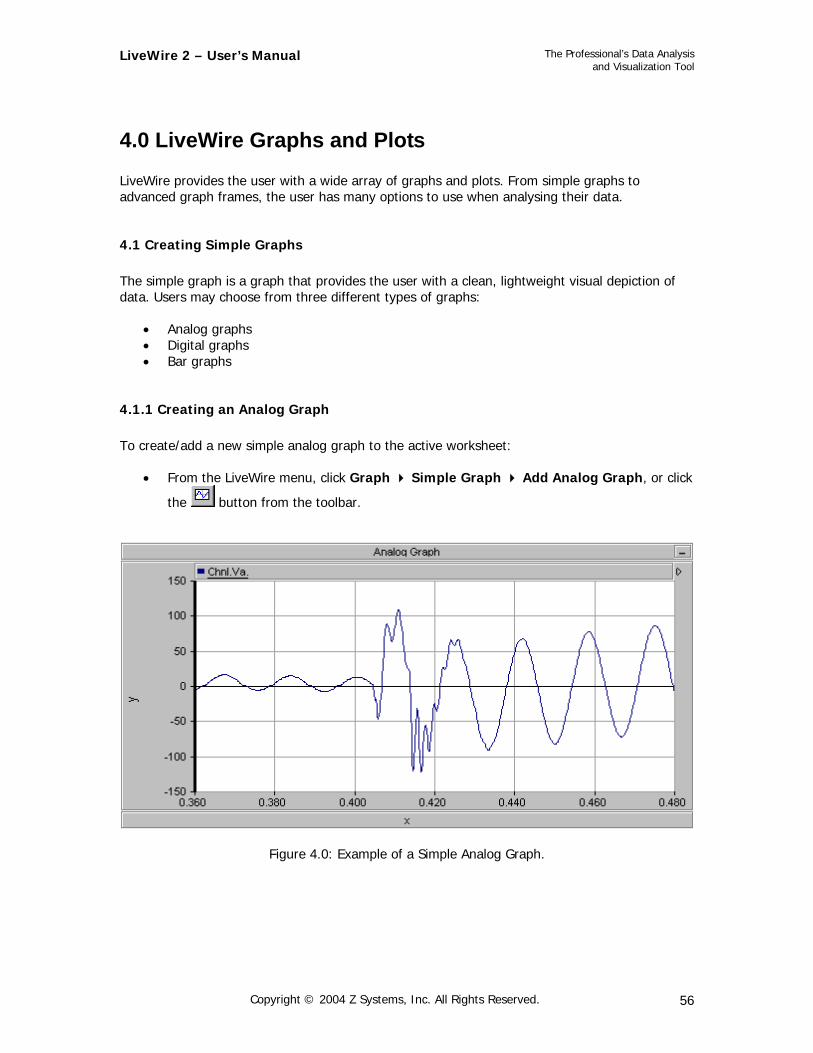
4.0 LiveWire Graphs and Plots LiveWire provides the user with a wide array of graphs and plots. From simple graphs to advanced graph frames, the user has many options to use when analysing their data.
4.1 Creating Simple Graphs The simple graph is a graph that provides the user with a clean, lightweight visual depiction of data. Users may choose from three different types of graphs:
• Analog graphs • Digital graphs • Bar graphs
4.1.1 Creating an Analog Graph To create/add a new simple analog graph to the active worksheet:
• From the LiveWire menu, click Graph Simple Graph Add Analog Graph, or click
the button from the toolbar.
Figure 4.0: Example of a Simple Analog Graph.
Copyright © 2004 Z Systems, Inc. All Rights Reserved. 56
LiveWire 2 – User’s Manual
The Professional’s Data Analysis and Visualization Tool
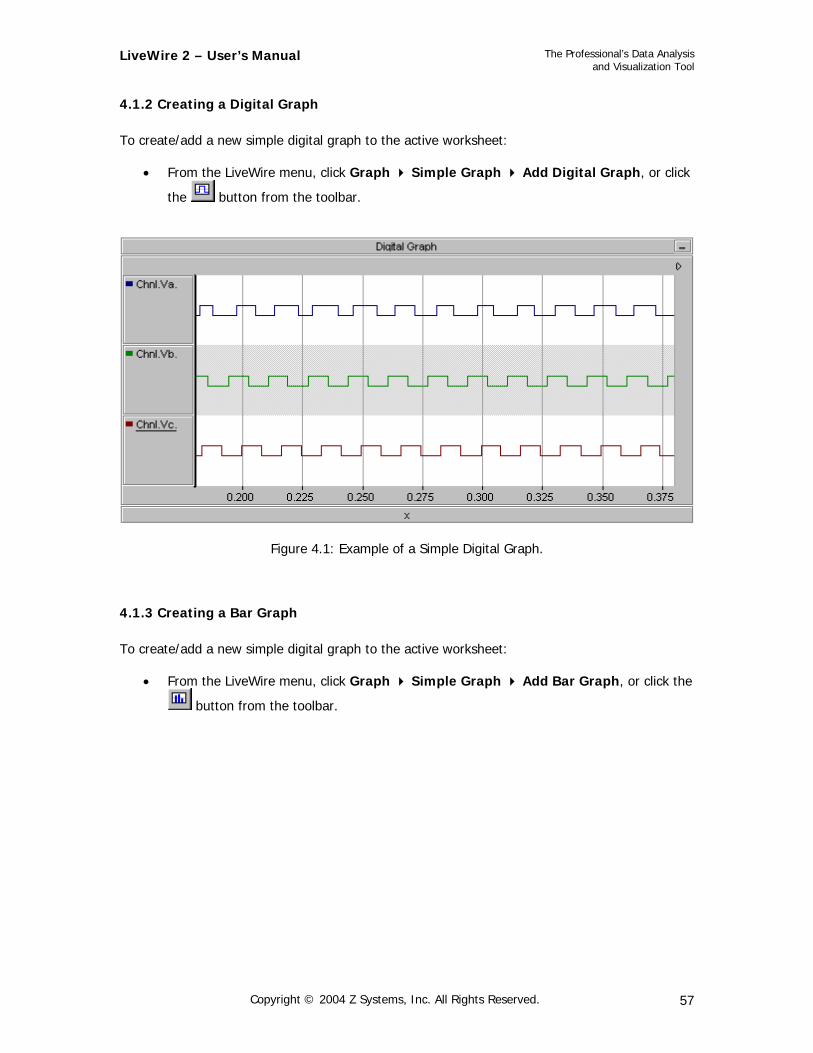
4.1.2 Creating a Digital Graph To create/add a new simple digital graph to the active worksheet:
• From the LiveWire menu, click Graph Simple Graph Add Digital Graph, or click
the button from the toolbar.
Figure 4.1: Example of a Simple Digital Graph.
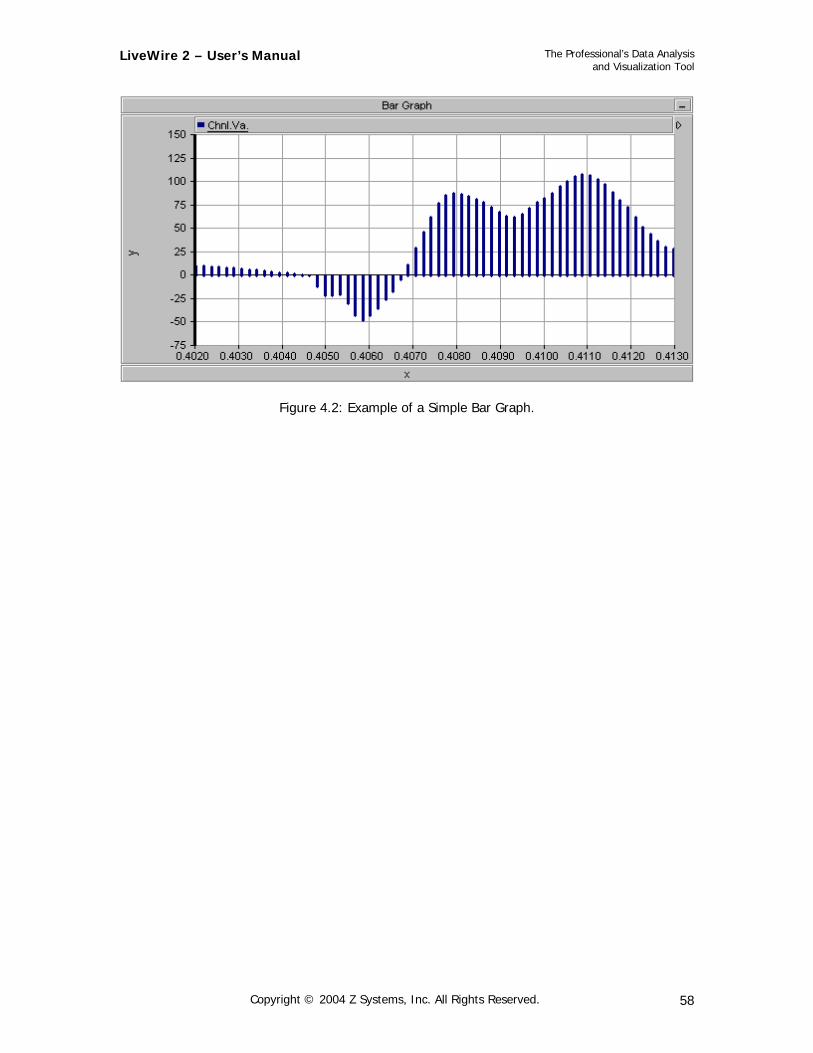
4.1.3 Creating a Bar Graph To create/add a new simple digital graph to the active worksheet:
• From the LiveWire menu, click Graph Simple Graph Add Bar Graph, or click the
button from the toolbar.
Copyright © 2004 Z Systems, Inc. All Rights Reserved. 57
LiveWire 2 – User’s Manual
The Professional’s Data Analysis and Visualization Tool
Figure 4.2: Example of a Simple Bar Graph.
Copyright © 2004 Z Systems, Inc. All Rights Reserved. 58
LiveWire 2 – User’s Manual
The Professional’s Data Analysis and Visualization Tool
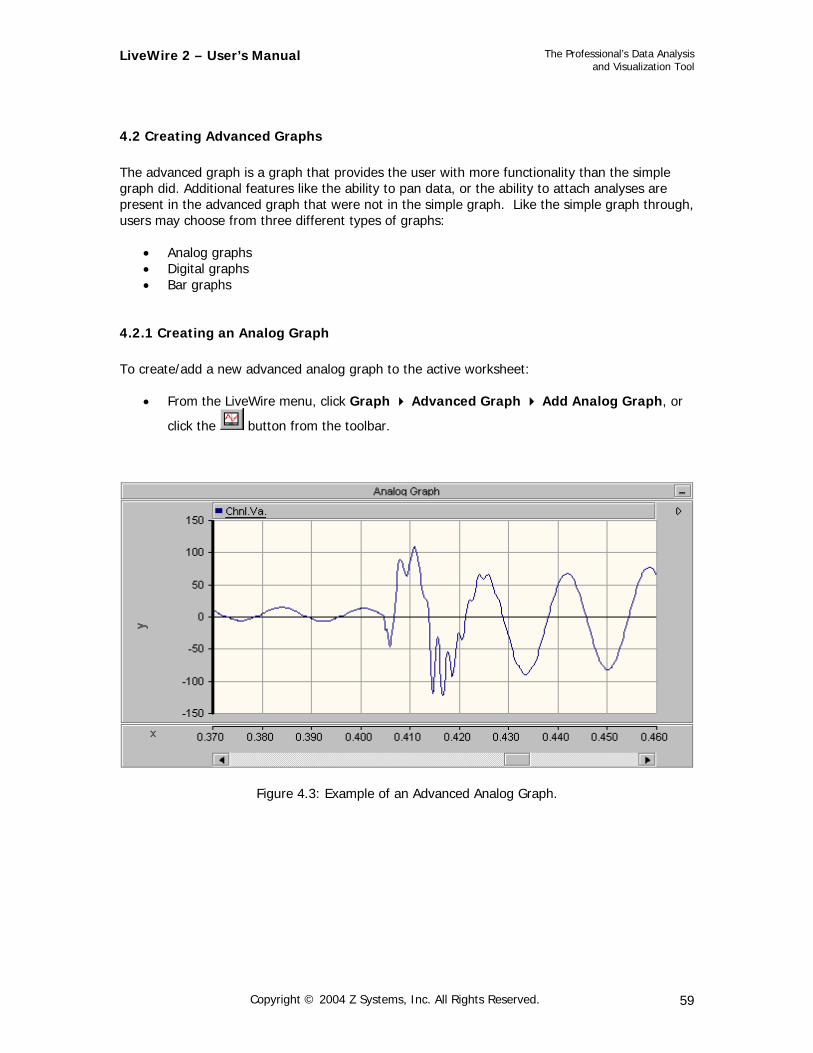
4.2 Creating Advanced Graphs The advanced graph is a graph that provides the user with more functionality than the simple graph did. Additional features like the ability to pan data, or the ability to attach analyses are present in the advanced graph that were not in the simple graph. Like the simple graph through, users may choose from three different types of graphs:
• Analog graphs • Digital graphs • Bar graphs
4.2.1 Creating an Analog Graph To create/add a new advanced analog graph to the active worksheet:
• From the LiveWire menu, click Graph Advanced Graph Add Analog Graph, or
click the button from the toolbar.
Figure 4.3: Example of an Advanced Analog Graph.
Copyright © 2004 Z Systems, Inc. All Rights Reserved. 59
LiveWire 2 – User’s Manual
The Professional’s Data Analysis and Visualization Tool
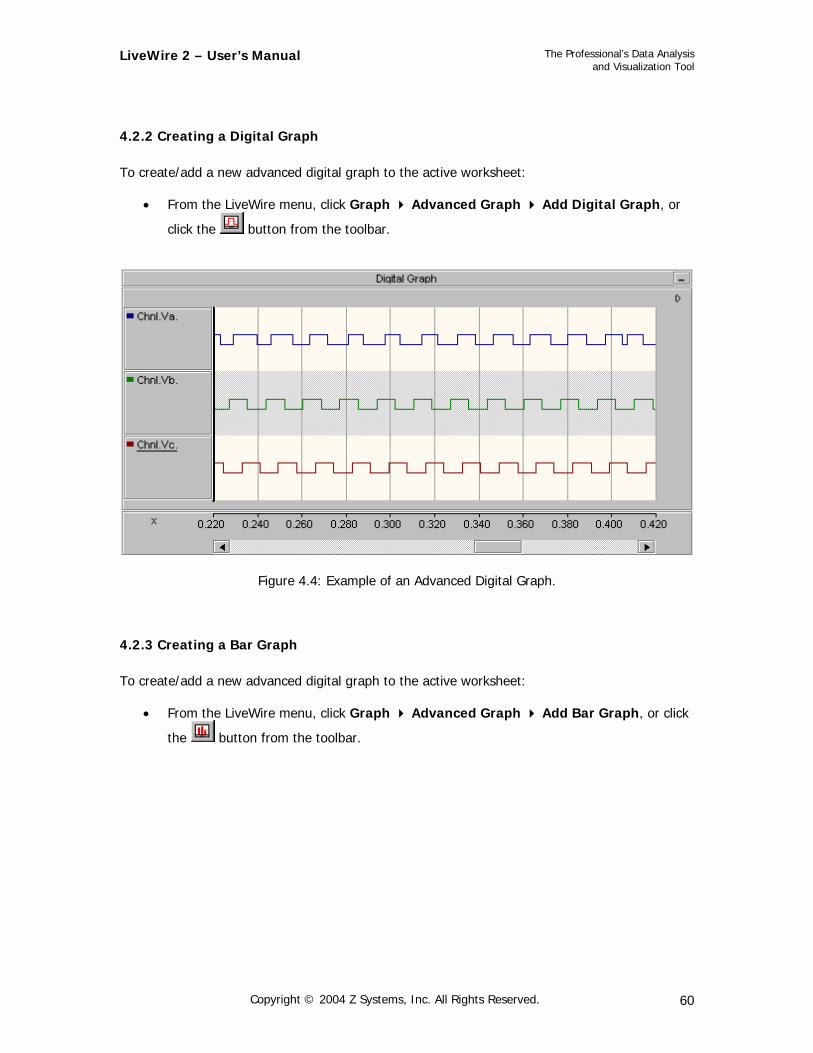
4.2.2 Creating a Digital Graph To create/add a new advanced digital graph to the active worksheet:
• From the LiveWire menu, click Graph Advanced Graph Add Digital Graph, or
click the button from the toolbar.
Figure 4.4: Example of an Advanced Digital Graph.
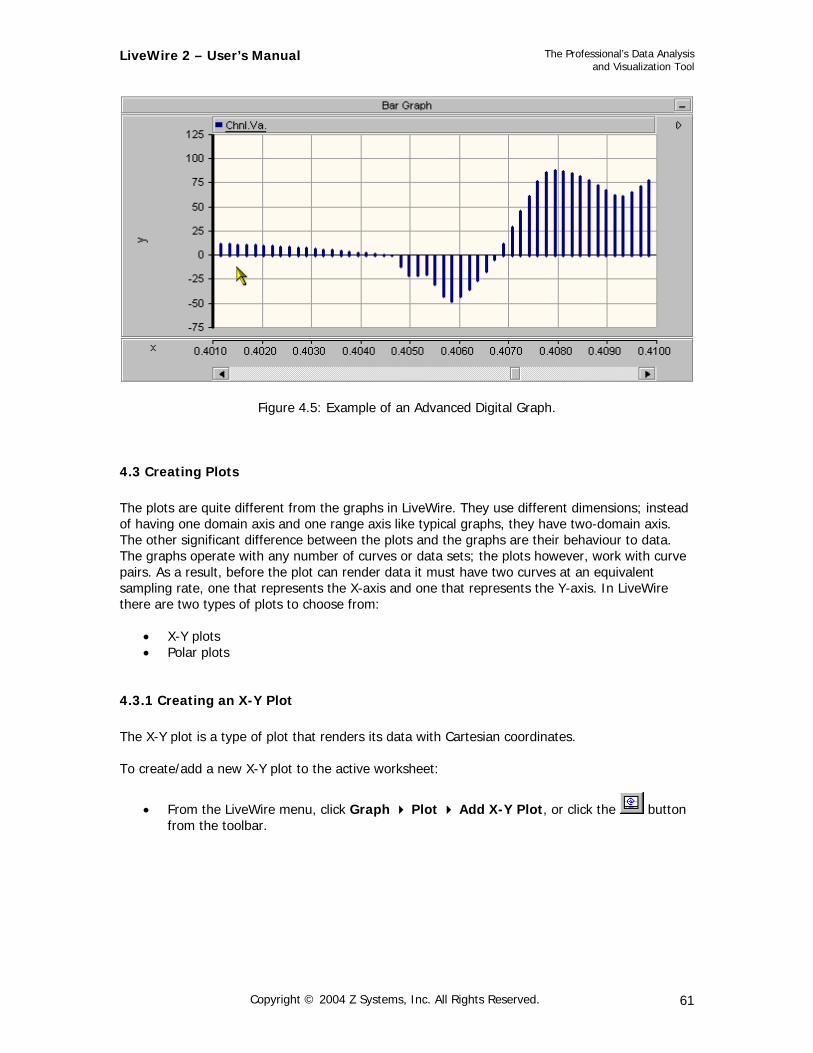
4.2.3 Creating a Bar Graph To create/add a new advanced digital graph to the active worksheet:
• From the LiveWire menu, click Graph Advanced Graph Add Bar Graph, or click
the button from the toolbar.
Copyright © 2004 Z Systems, Inc. All Rights Reserved. 60
LiveWire 2 – User’s Manual
The Professional’s Data Analysis and Visualization Tool
Figure 4.5: Example of an Advanced Digital Graph.
4.3 Creating Plots The plots are quite different from the graphs in LiveWire. They use different dimensions; instead of having one domain axis and one range axis like typical graphs, they have two-domain axis. The other significant difference between the plots and the graphs are their behaviour to data. The graphs operate with any number of curves or data sets; the plots however, work with curve pairs. As a result, before the plot can render data it must have two curves at an equivalent sampling rate, one that represents the X-axis and one that represents the Y-axis. In LiveWire there are two types of plots to choose from:
• X-Y plots • Polar plots
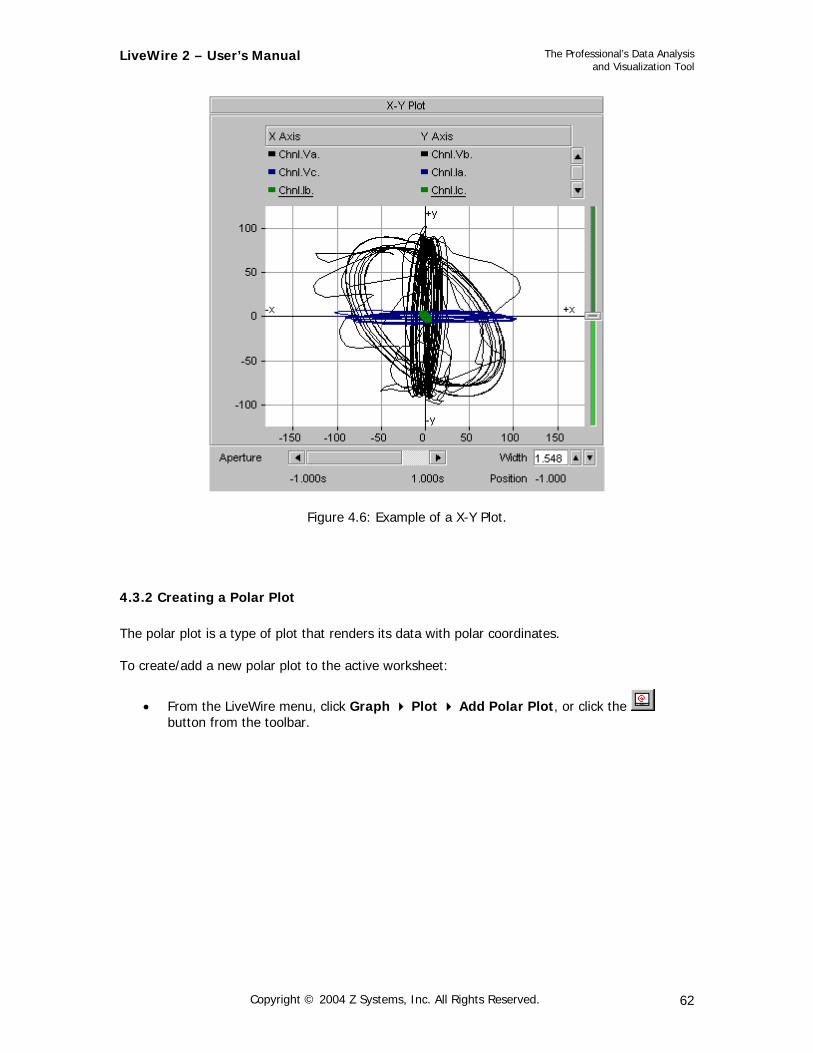
4.3.1 Creating an X-Y Plot The X-Y plot is a type of plot that renders its data with Cartesian coordinates. To create/add a new X-Y plot to the active worksheet:
• From the LiveWire menu, click Graph Plot Add X-Y Plot, or click the button from the toolbar.
Copyright © 2004 Z Systems, Inc. All Rights Reserved. 61
LiveWire 2 – User’s Manual
The Professional’s Data Analysis and Visualization Tool
Figure 4.6: Example of a X-Y Plot.
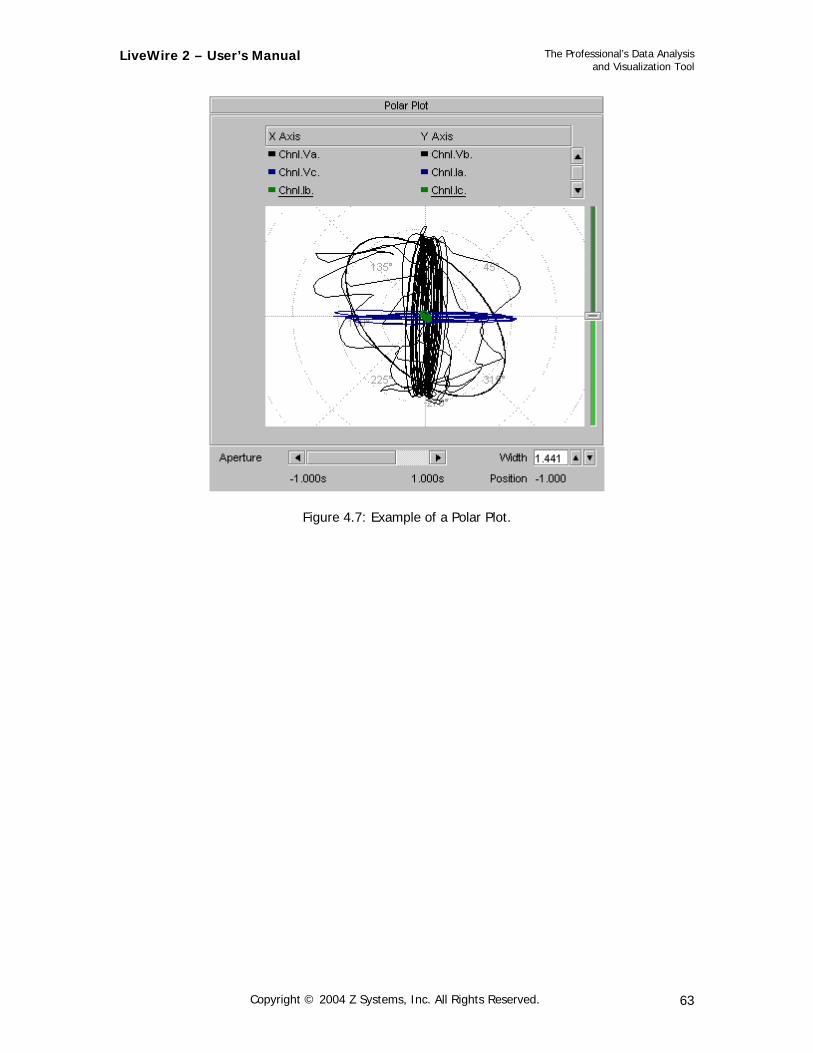
4.3.2 Creating a Polar Plot The polar plot is a type of plot that renders its data with polar coordinates. To create/add a new polar plot to the active worksheet:
• From the LiveWire menu, click Graph Plot Add Polar Plot, or click the button from the toolbar.
Copyright © 2004 Z Systems, Inc. All Rights Reserved. 62
LiveWire 2 – User’s Manual
The Professional’s Data Analysis and Visualization Tool
Figure 4.7: Example of a Polar Plot.
Copyright © 2004 Z Systems, Inc. All Rights Reserved. 63
LiveWire 2 – User’s Manual
The Professional’s Data Analysis and Visualization Tool
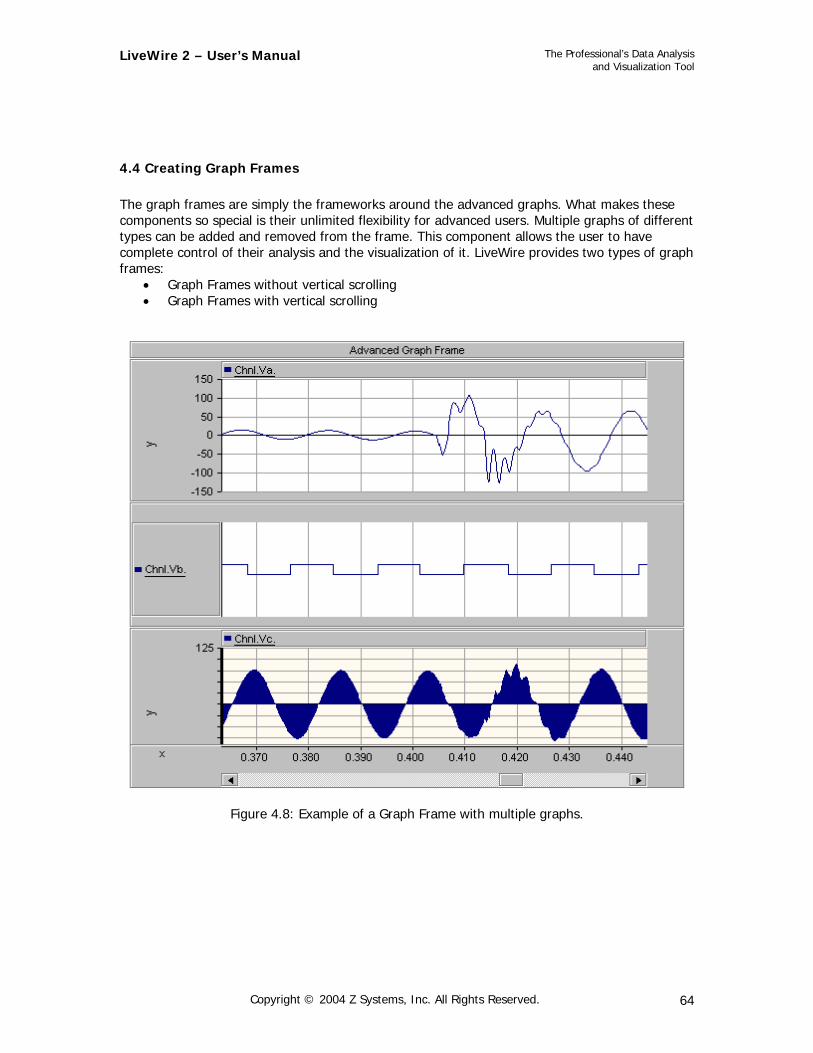
4.4 Creating Graph Frames The graph frames are simply the frameworks around the advanced graphs. What makes these components so special is their unlimited flexibility for advanced users. Multiple graphs of different types can be added and removed from the frame. This component allows the user to have complete control of their analysis and the visualization of it. LiveWire provides two types of graph frames:
• Graph Frames without vertical scrolling • Graph Frames with vertical scrolling
Figure 4.8: Example of a Graph Frame with multiple graphs.
Copyright © 2004 Z Systems, Inc. All Rights Reserved. 64
LiveWire 2 – User’s Manual
The Professional’s Data Analysis and Visualization Tool
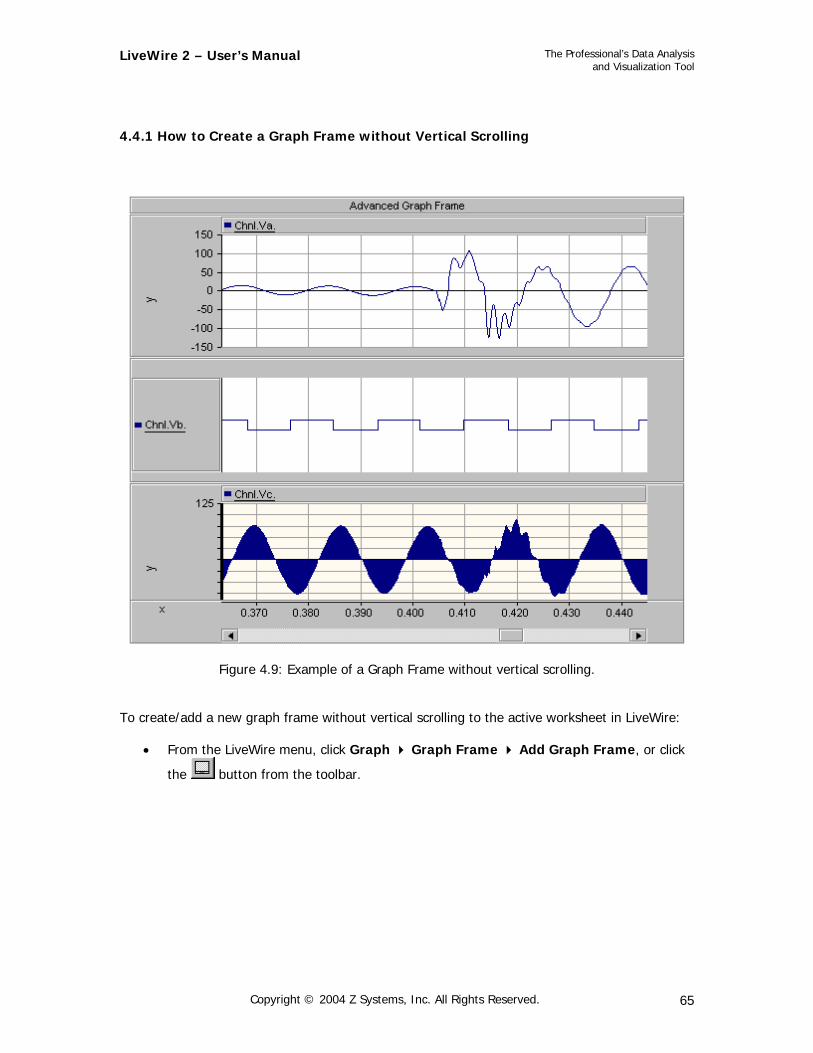
4.4.1 How to Create a Graph Frame without Vertical Scrolling
Figure 4.9: Example of a Graph Frame without vertical scrolling.
To create/add a new graph frame without vertical scrolling to the active worksheet in LiveWire:
• From the LiveWire menu, click Graph Graph Frame Add Graph Frame, or click
the button from the toolbar.
Copyright © 2004 Z Systems, Inc. All Rights Reserved. 65
LiveWire 2 – User’s Manual
The Professional’s Data Analysis and Visualization Tool
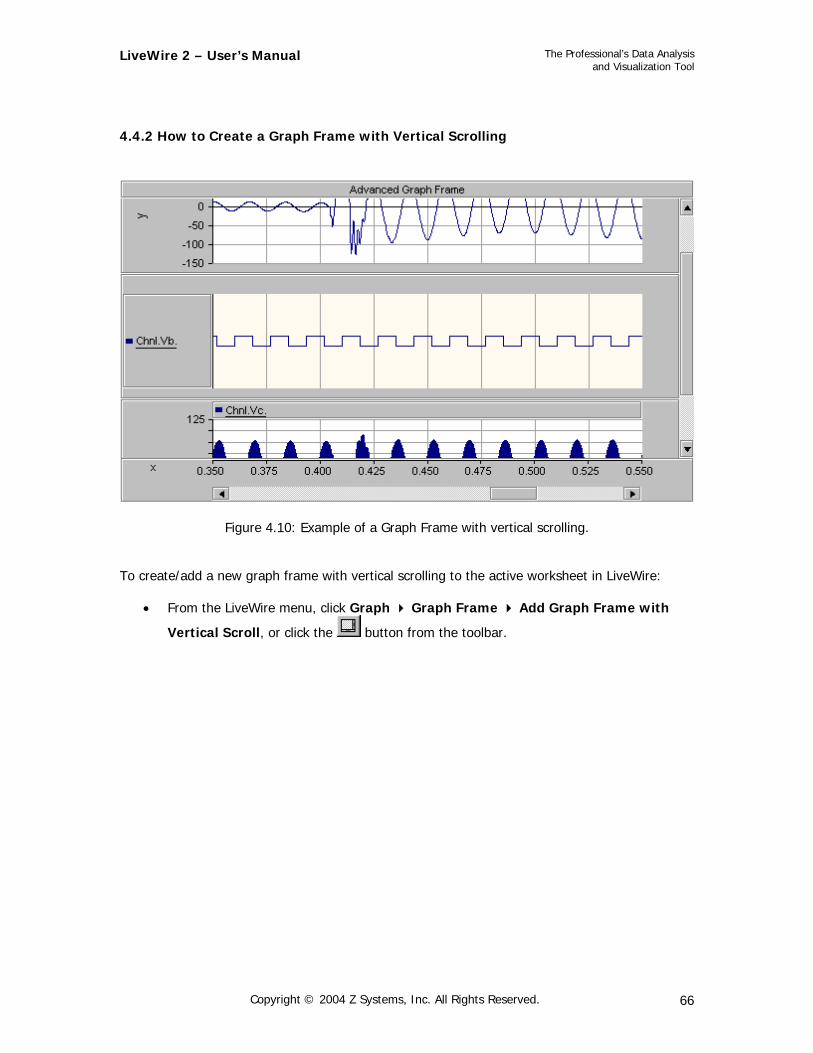
4.4.2 How to Create a Graph Frame with Vertical Scrolling
Figure 4.10: Example of a Graph Frame with vertical scrolling.
To create/add a new graph frame with vertical scrolling to the active worksheet in LiveWire:
• From the LiveWire menu, click Graph Graph Frame Add Graph Frame with
Vertical Scroll, or click the button from the toolbar.
Copyright © 2004 Z Systems, Inc. All Rights Reserved. 66
LiveWire 2 – User’s Manual
The Professional’s Data Analysis and Visualization Tool
4.5 Graph Features The graphs have many features available to the user; the following outlines only a few of the more important features. All of the features within the graphs can be accessed by the property dialogs or from the pop-up menus.
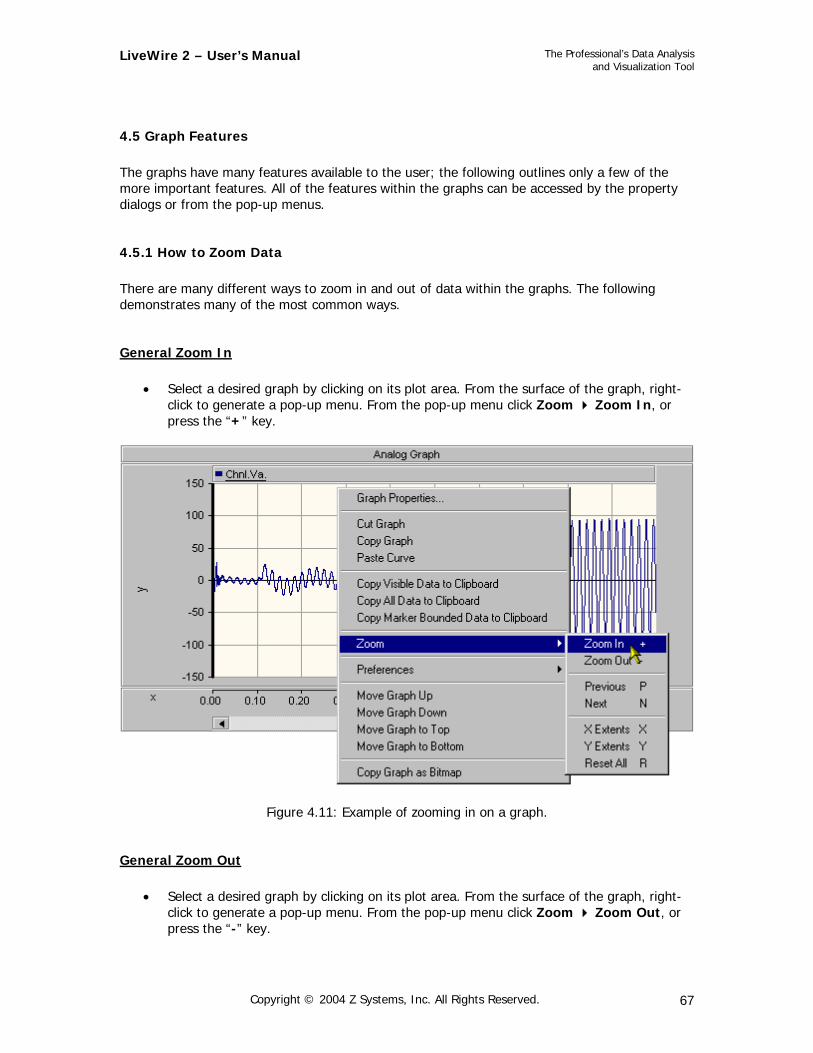
4.5.1 How to Zoom Data There are many different ways to zoom in and out of data within the graphs. The following demonstrates many of the most common ways.
General Zoom In
• Select a desired graph by clicking on its plot area. From the surface of the graph, right-click to generate a pop-up menu. From the pop-up menu click Zoom Zoom In, or press the “+” key.
Figure 4.11: Example of zooming in on a graph.
General Zoom Out
• Select a desired graph by clicking on its plot area. From the surface of the graph, right-click to generate a pop-up menu. From the pop-up menu click Zoom Zoom Out, or press the “-” key.
Copyright © 2004 Z Systems, Inc. All Rights Reserved. 67
LiveWire 2 – User’s Manual
The Professional’s Data Analysis and Visualization Tool
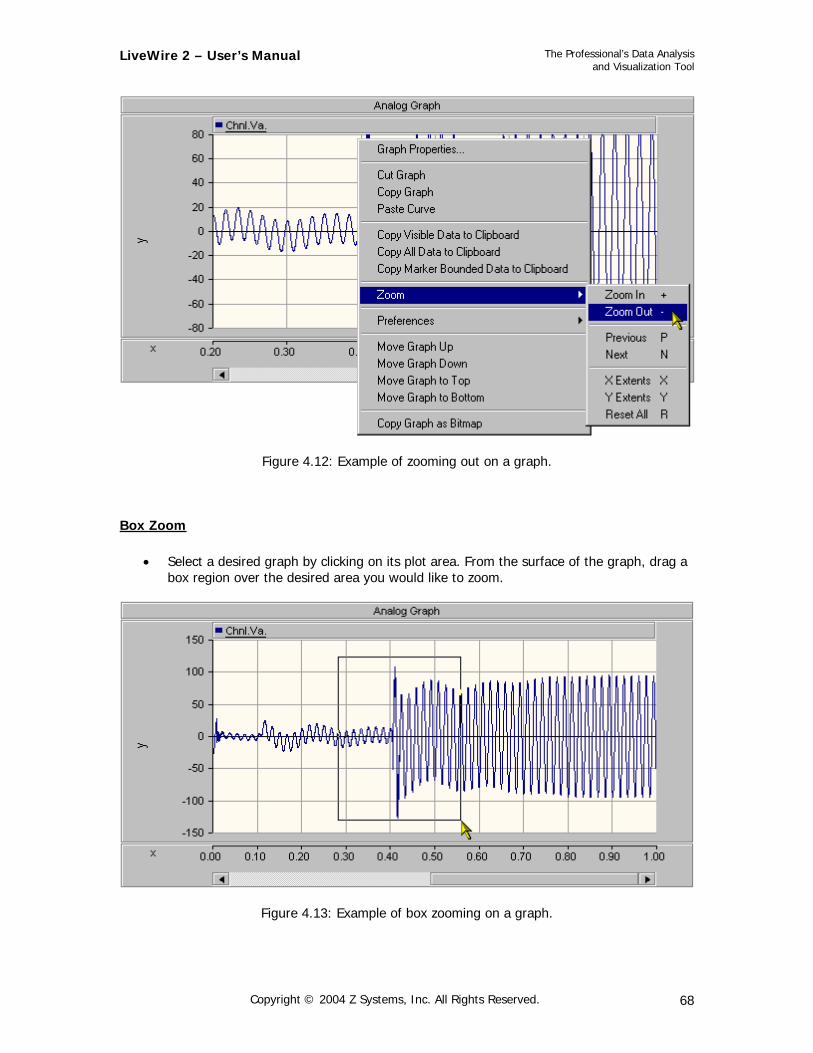
Figure 4.12: Example of zooming out on a graph.
Box Zoom
• Select a desired graph by clicking on its plot area. From the surface of the graph, drag a box region over the desired area you would like to zoom.
Figure 4.13: Example of box zooming on a graph.
Copyright © 2004 Z Systems, Inc. All Rights Reserved. 68

LiveWire 2 – User’s Manual
The Professional’s Data Analysis and Visualization Tool
Vertical Zoom
• Select a desired graph by clicking on its plot area. From the surface of the graph, with the Shift key pressed, drag a region over the desired area you would like to zoom.
Figure 4.14: Example of vertical zooming on a graph.
Horizontal Zoom
• Select a desired graph by clicking on its plot area. From the surface of the graph, with the Ctrl key pressed, drag a region over the desired area you would like to zoom.
Copyright © 2004 Z Systems, Inc. All Rights Reserved. 69
LiveWire 2 – User’s Manual
The Professional’s Data Analysis and Visualization Tool
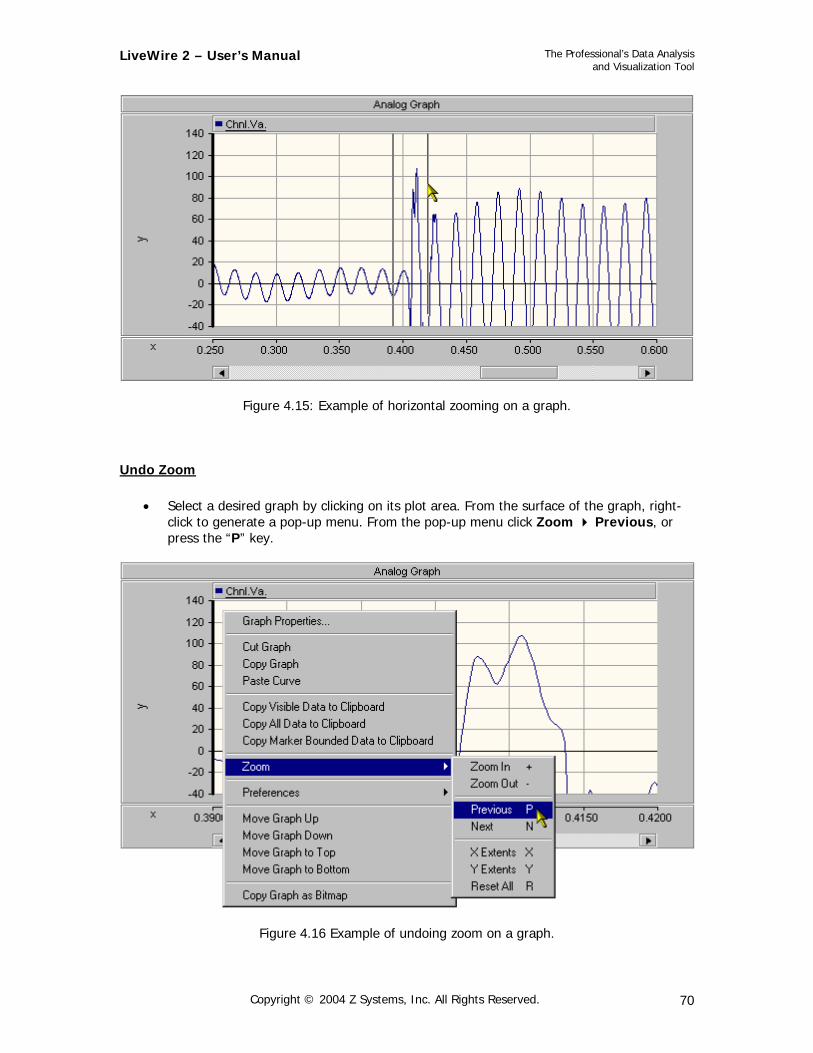
Figure 4.15: Example of horizontal zooming on a graph.
Undo Zoom
• Select a desired graph by clicking on its plot area. From the surface of the graph, right-click to generate a pop-up menu. From the pop-up menu click Zoom Previous, or press the “P” key.
Figure 4.16 Example of undoing zoom on a graph.
Copyright © 2004 Z Systems, Inc. All Rights Reserved. 70
LiveWire 2 – User’s Manual
The Professional’s Data Analysis and Visualization Tool
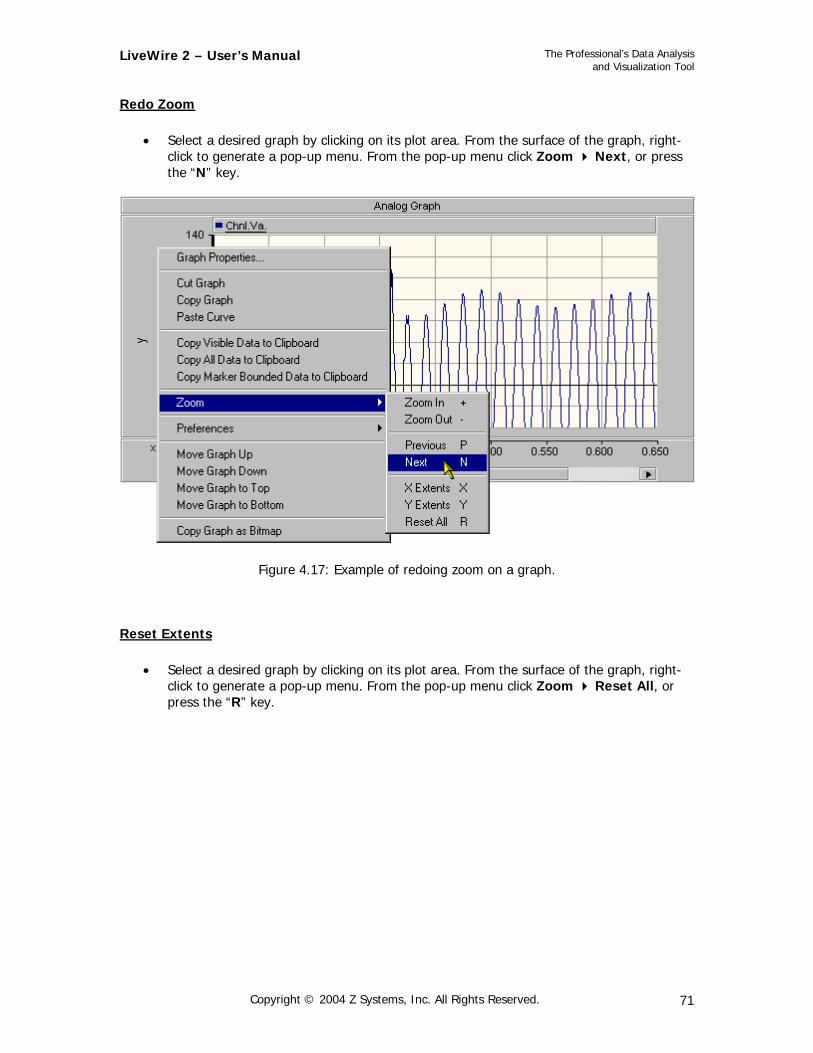
Redo Zoom
• Select a desired graph by clicking on its plot area. From the surface of the graph, right-click to generate a pop-up menu. From the pop-up menu click Zoom Next, or press the “N” key.
Figure 4.17: Example of redoing zoom on a graph.
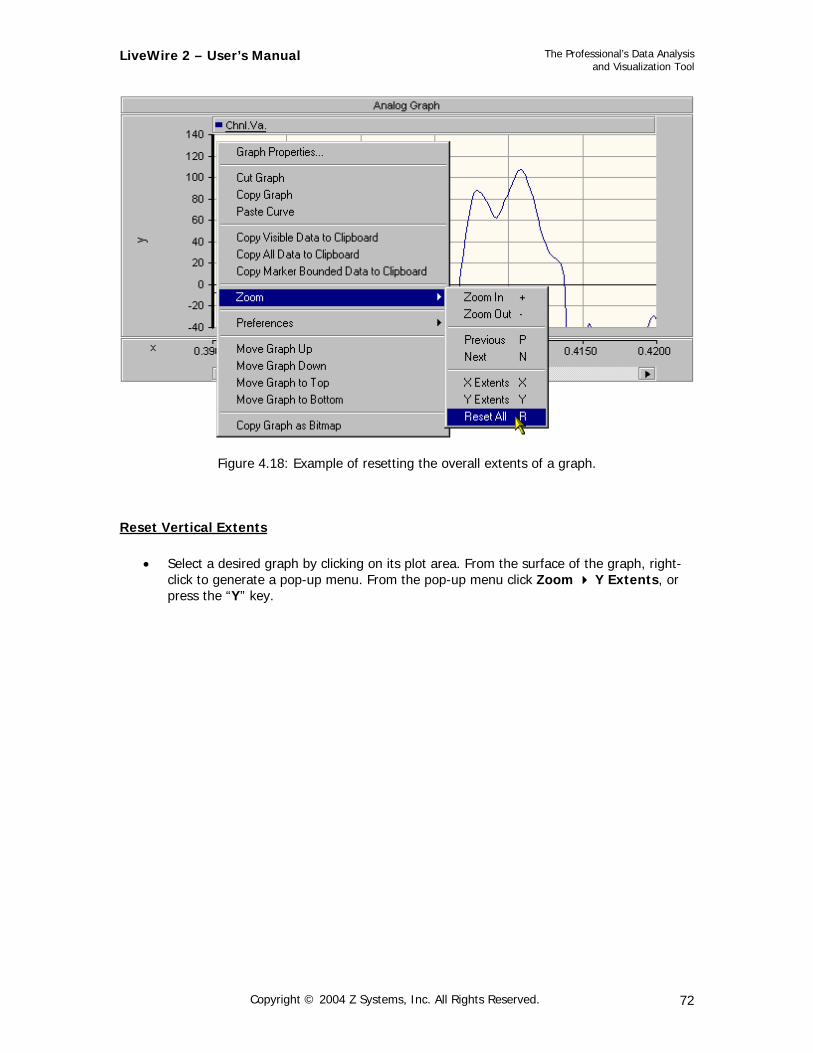
Reset Extents
• Select a desired graph by clicking on its plot area. From the surface of the graph, right-click to generate a pop-up menu. From the pop-up menu click Zoom Reset All, or press the “R” key.
Copyright © 2004 Z Systems, Inc. All Rights Reserved. 71
LiveWire 2 – User’s Manual
The Professional’s Data Analysis and Visualization Tool
Figure 4.18: Example of resetting the overall extents of a graph.
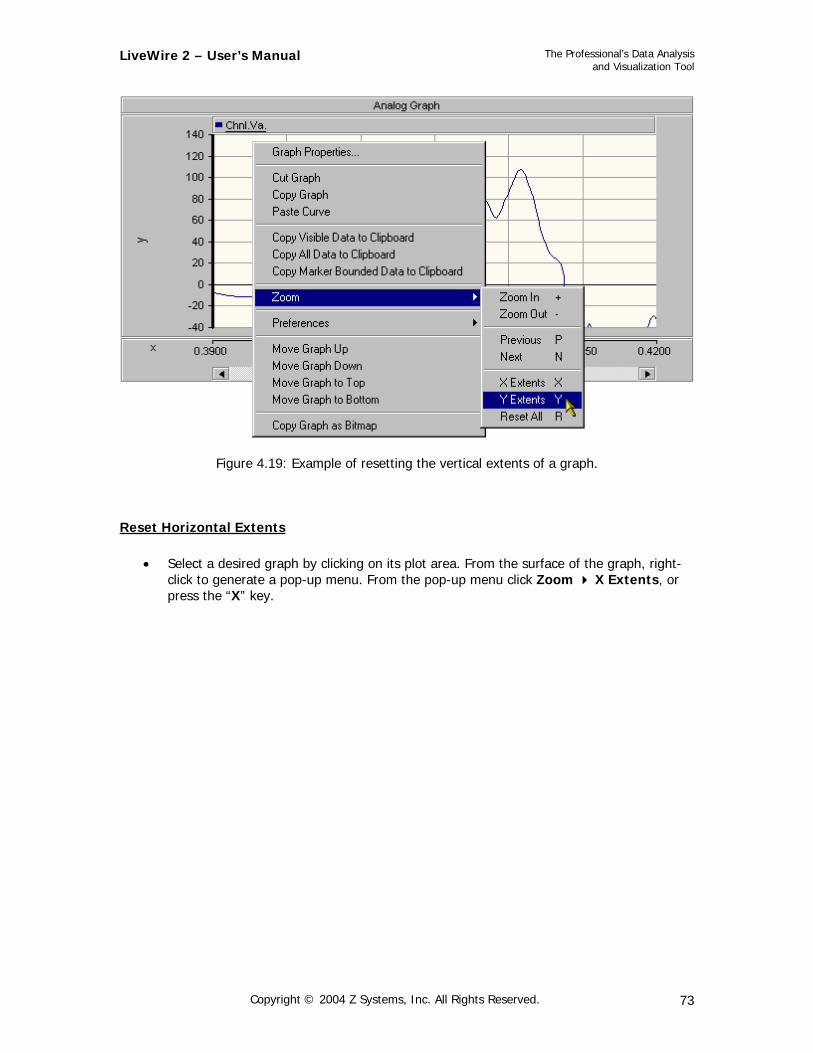
Reset Vertical Extents
• Select a desired graph by clicking on its plot area. From the surface of the graph, right-click to generate a pop-up menu. From the pop-up menu click Zoom Y Extents, or press the “Y” key.
Copyright © 2004 Z Systems, Inc. All Rights Reserved. 72
LiveWire 2 – User’s Manual
The Professional’s Data Analysis and Visualization Tool
Figure 4.19: Example of resetting the vertical extents of a graph.
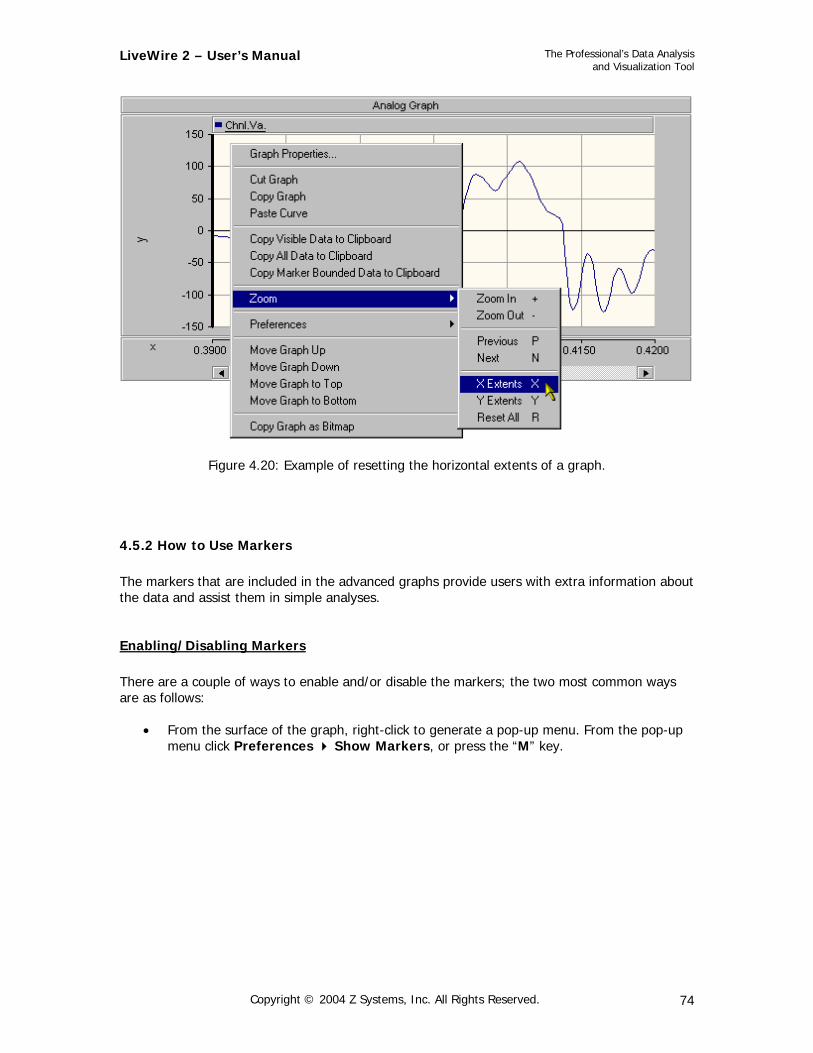
Reset Horizontal Extents
• Select a desired graph by clicking on its plot area. From the surface of the graph, right-click to generate a pop-up menu. From the pop-up menu click Zoom X Extents, or press the “X” key.
Copyright © 2004 Z Systems, Inc. All Rights Reserved. 73
LiveWire 2 – User’s Manual
The Professional’s Data Analysis and Visualization Tool
Figure 4.20: Example of resetting the horizontal extents of a graph.
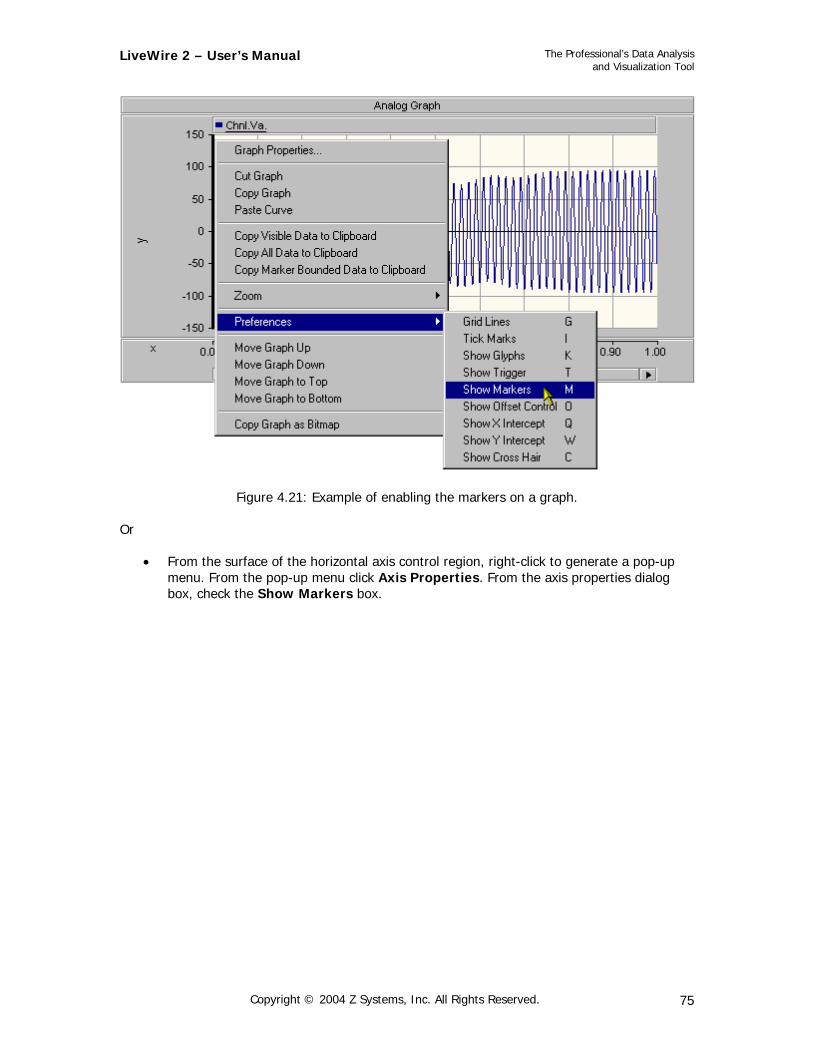
4.5.2 How to Use Markers The markers that are included in the advanced graphs provide users with extra information about the data and assist them in simple analyses.
Enabling/Disabling Markers There are a couple of ways to enable and/or disable the markers; the two most common ways are as follows:
• From the surface of the graph, right-click to generate a pop-up menu. From the pop-up menu click Preferences Show Markers, or press the “M” key.
Copyright © 2004 Z Systems, Inc. All Rights Reserved. 74
LiveWire 2 – User’s Manual
The Professional’s Data Analysis and Visualization Tool
Figure 4.21: Example of enabling the markers on a graph. Or
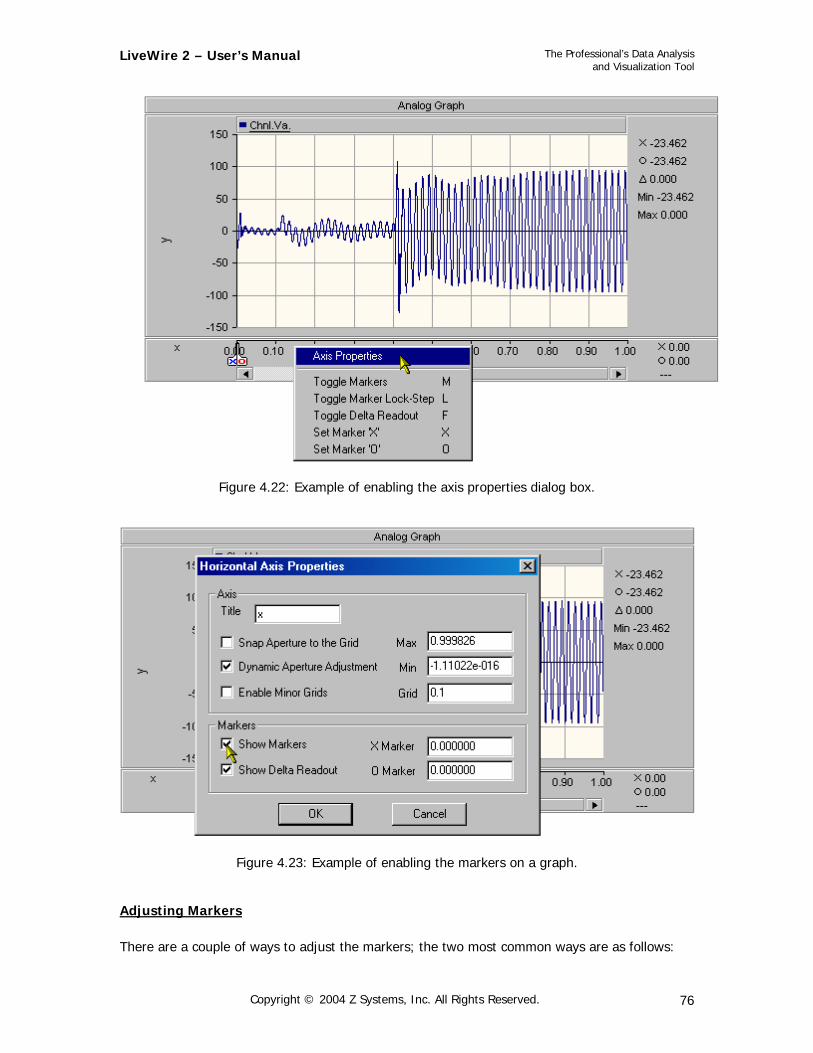
• From the surface of the horizontal axis control region, right-click to generate a pop-up
menu. From the pop-up menu click Axis Properties. From the axis properties dialog box, check the Show Markers box.
Copyright © 2004 Z Systems, Inc. All Rights Reserved. 75
LiveWire 2 – User’s Manual
The Professional’s Data Analysis and Visualization Tool
Figure 4.22: Example of enabling the axis properties dialog box.
Figure 4.23: Example of enabling the markers on a graph.
Adjusting Markers There are a couple of ways to adjust the markers; the two most common ways are as follows:
Copyright © 2004 Z Systems, Inc. All Rights Reserved. 76
LiveWire 2 – User’s Manual
The Professional’s Data Analysis and Visualization Tool
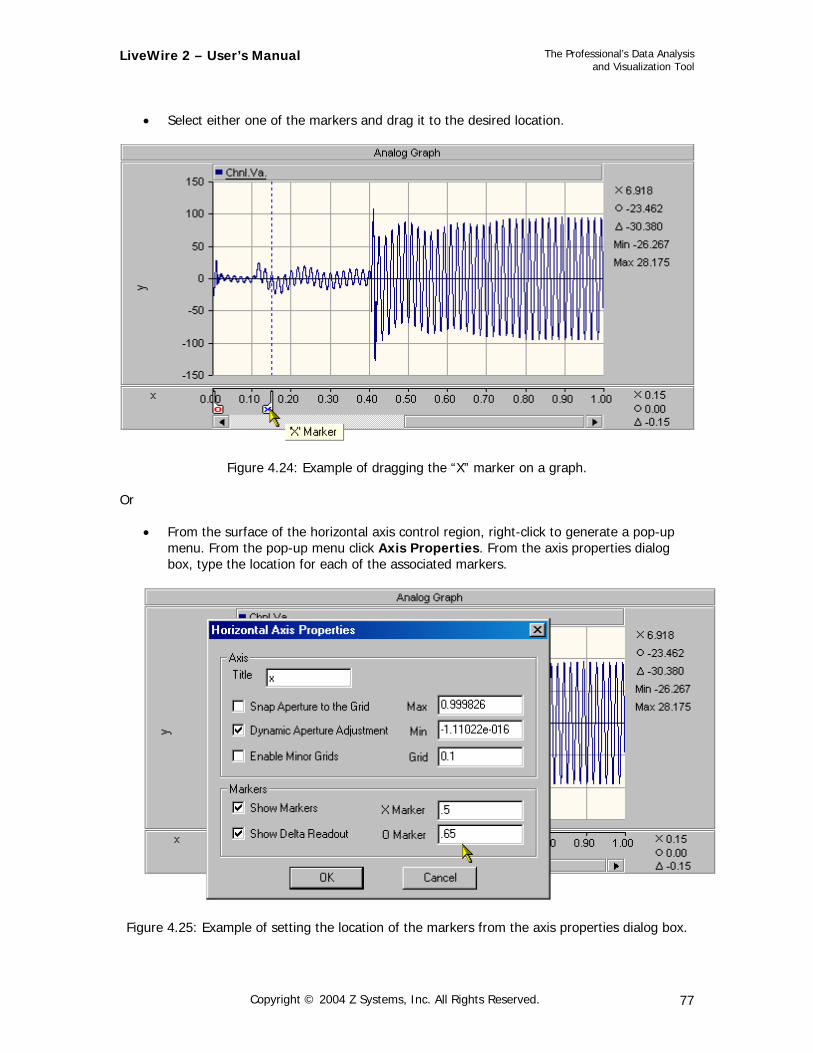
• Select either one of the markers and drag it to the desired location.
Figure 4.24: Example of dragging the “X” marker on a graph. Or
• From the surface of the horizontal axis control region, right-click to generate a pop-up menu. From the pop-up menu click Axis Properties. From the axis properties dialog box, type the location for each of the associated markers.
Figure 4.25: Example of setting the location of the markers from the axis properties dialog box.
Copyright © 2004 Z Systems, Inc. All Rights Reserved. 77
LiveWire 2 – User’s Manual
The Professional’s Data Analysis and Visualization Tool
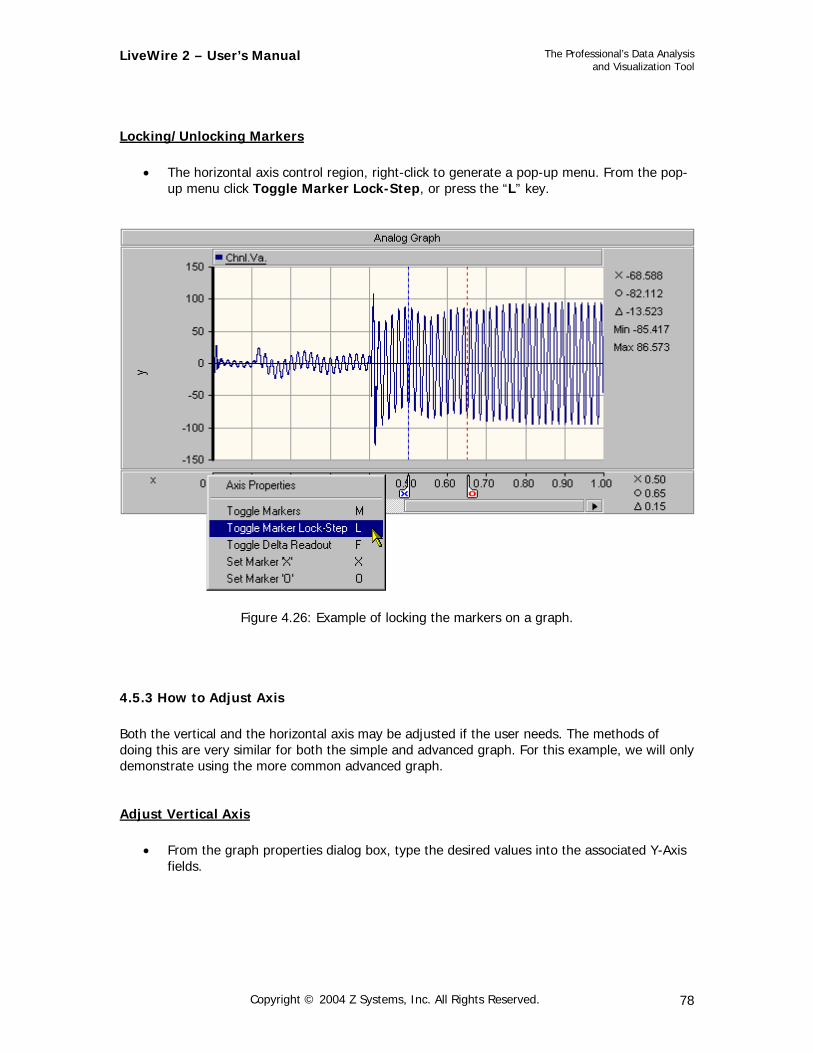
Locking/Unlocking Markers
• The horizontal axis control region, right-click to generate a pop-up menu. From the pop-up menu click Toggle Marker Lock-Step, or press the “L” key.
Figure 4.26: Example of locking the markers on a graph.
4.5.3 How to Adjust Axis Both the vertical and the horizontal axis may be adjusted if the user needs. The methods of doing this are very similar for both the simple and advanced graph. For this example, we will only demonstrate using the more common advanced graph.
Adjust Vertical Axis
• From the graph properties dialog box, type the desired values into the associated Y-Axis fields.
Copyright © 2004 Z Systems, Inc. All Rights Reserved. 78
LiveWire 2 – User’s Manual
The Professional’s Data Analysis and Visualization Tool
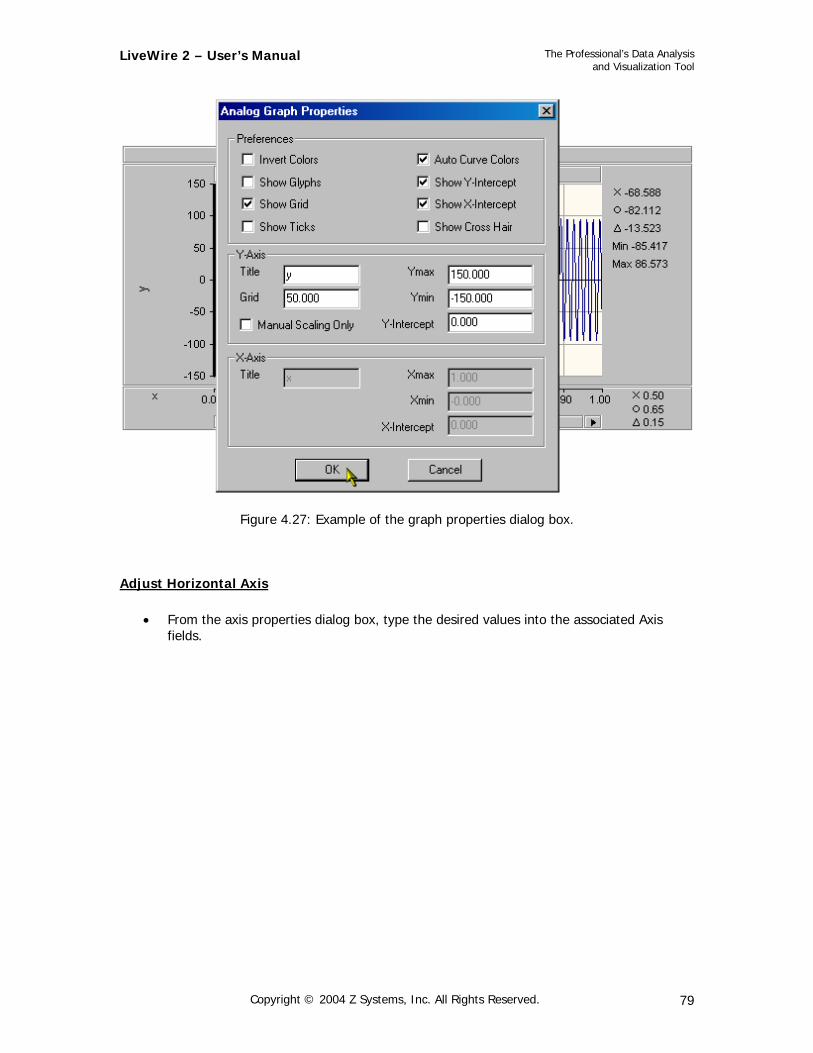
Figure 4.27: Example of the graph properties dialog box.
Adjust Horizontal Axis
• From the axis properties dialog box, type the desired values into the associated Axis fields.
Copyright © 2004 Z Systems, Inc. All Rights Reserved. 79
LiveWire 2 – User’s Manual
The Professional’s Data Analysis and Visualization Tool
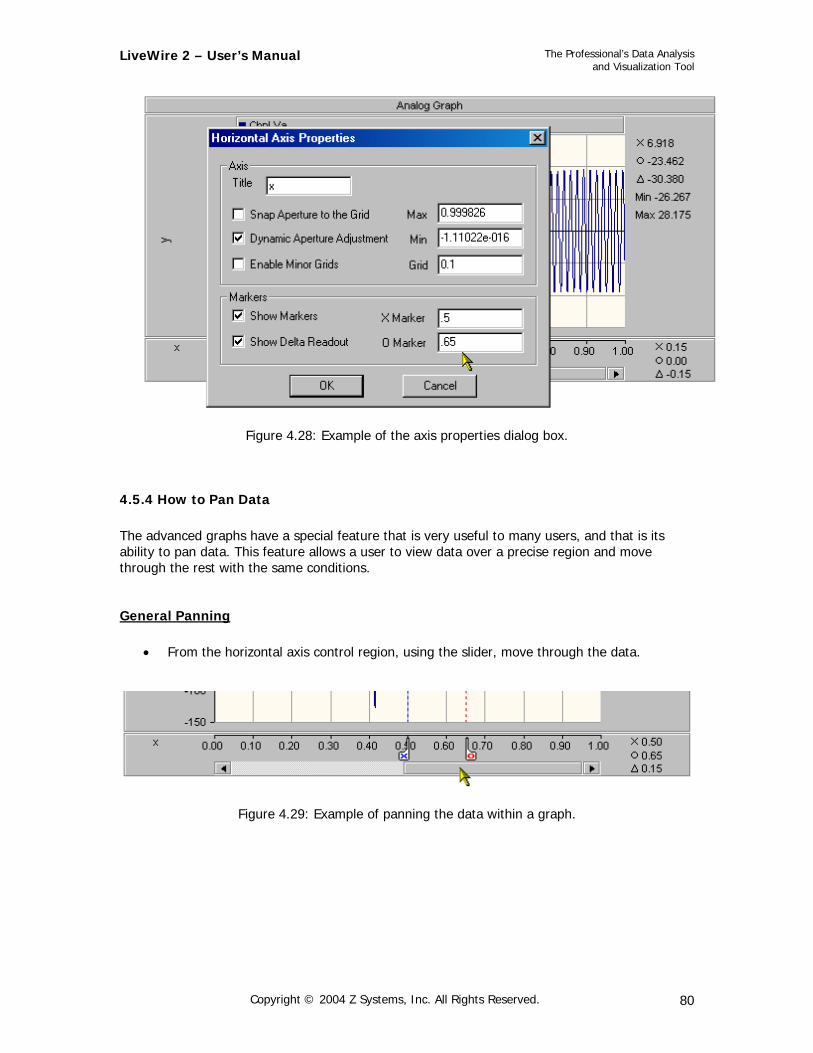
Figure 4.28: Example of the axis properties dialog box.
4.5.4 How to Pan Data The advanced graphs have a special feature that is very useful to many users, and that is its ability to pan data. This feature allows a user to view data over a precise region and move through the rest with the same conditions.
General Panning
• From the horizontal axis control region, using the slider, move through the data.
Figure 4.29: Example of panning the data within a graph.
Copyright © 2004 Z Systems, Inc. All Rights Reserved. 80
LiveWire 2 – User’s Manual
The Professional’s Data Analysis and Visualization Tool
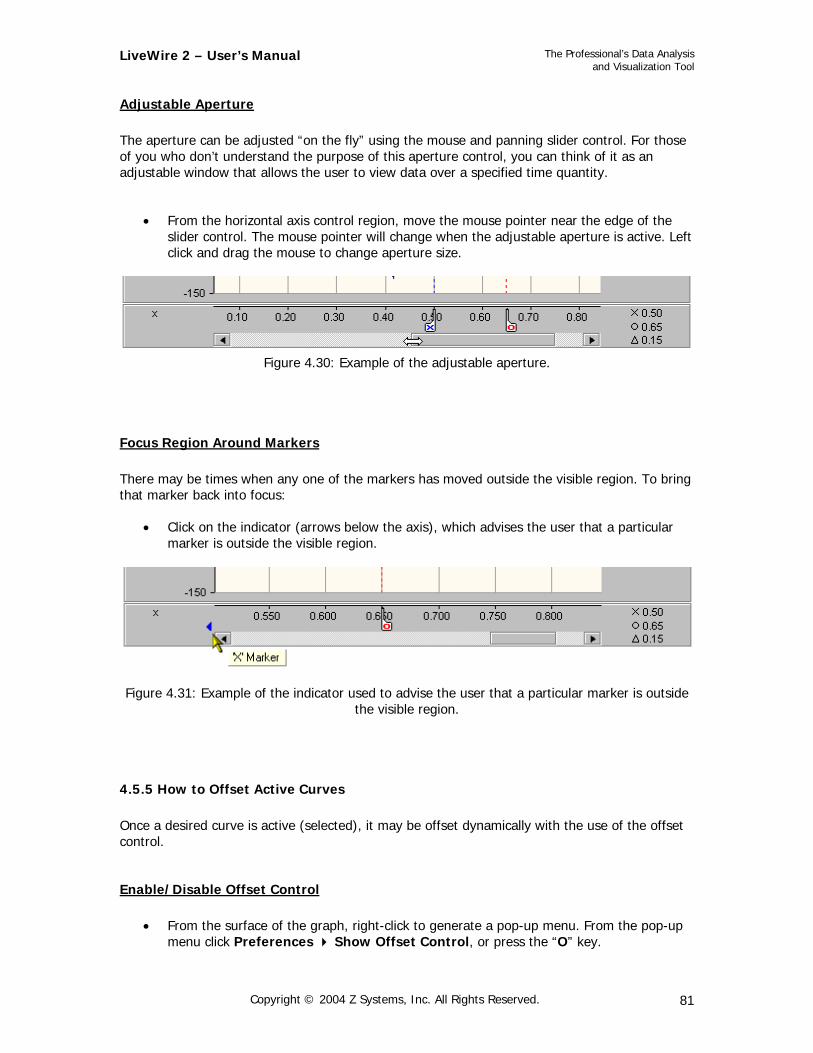
Adjustable Aperture The aperture can be adjusted “on the fly” using the mouse and panning slider control. For those of you who don’t understand the purpose of this aperture control, you can think of it as an adjustable window that allows the user to view data over a specified time quantity.
• From the horizontal axis control region, move the mouse pointer near the edge of the slider control. The mouse pointer will change when the adjustable aperture is active. Left click and drag the mouse to change aperture size.
Figure 4.30: Example of the adjustable aperture.
Focus Region Around Markers There may be times when any one of the markers has moved outside the visible region. To bring that marker back into focus:
• Click on the indicator (arrows below the axis), which advises the user that a particular marker is outside the visible region.
Figure 4.31: Example of the indicator used to advise the user that a particular marker is outside the visible region.
4.5.5 How to Offset Active Curves Once a desired curve is active (selected), it may be offset dynamically with the use of the offset control.
Enable/Disable Offset Control
• From the surface of the graph, right-click to generate a pop-up menu. From the pop-up menu click Preferences Show Offset Control, or press the “O” key.
Copyright © 2004 Z Systems, Inc. All Rights Reserved. 81
LiveWire 2 – User’s Manual
The Professional’s Data Analysis and Visualization Tool
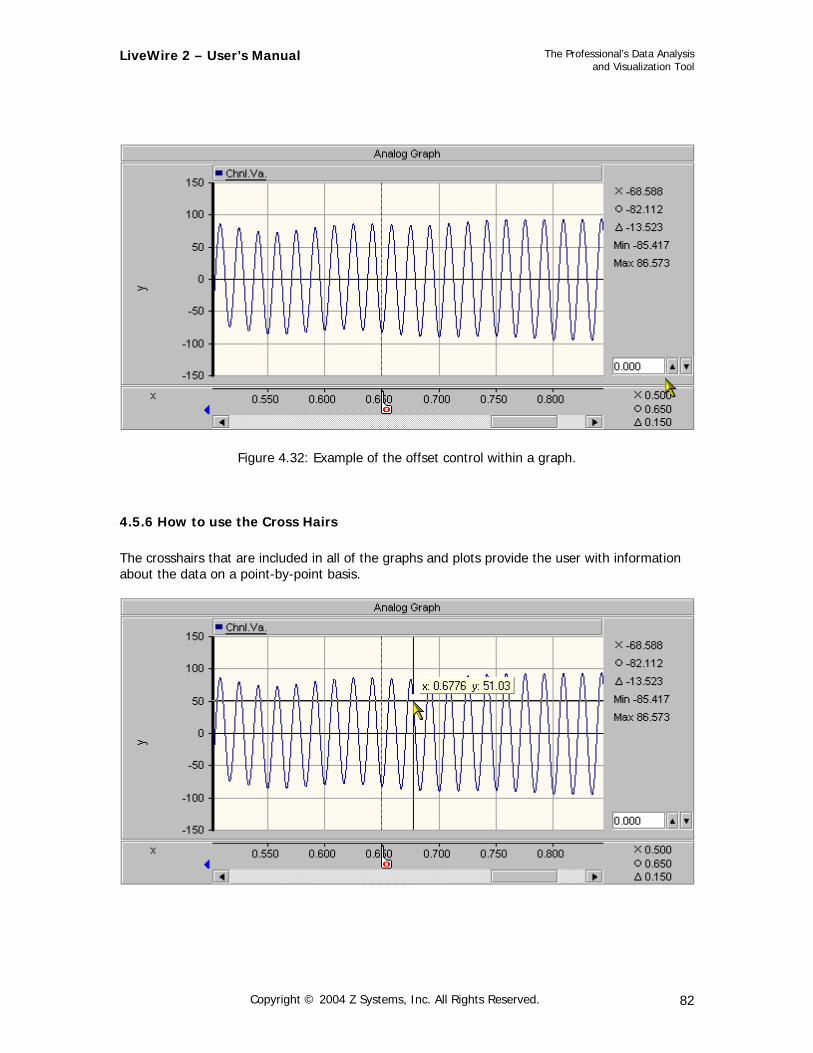
Figure 4.32: Example of the offset control within a graph.
4.5.6 How to use the Cross Hairs The crosshairs that are included in all of the graphs and plots provide the user with information about the data on a point-by-point basis.
Copyright © 2004 Z Systems, Inc. All Rights Reserved. 82
LiveWire 2 – User’s Manual
The Professional’s Data Analysis and Visualization Tool
Enabling/Disabling the Cross Hairs There are a couple of ways to enable and/or disable the crosshairs; the two most common ways are as follows:
• From the surface of the graph, right-click to generate a pop-up menu. From the pop-up menu click Preferences Show Cross Hair, or press the “C” key.
Or
• From the surface of the graph, right-click to generate a pop-up menu. From the pop-up menu click Graph Properties. From the graph properties dialog box, check the Show Cross Hair box.
Toggle Cross Hair Mode The cross hair feature in the graphs has two modes of operation. The default mode snaps the cross hair to the data points and provides the user with point-by-point information. The other mode doesn’t snap the cross hair to the data, but rather provides the user with general coordinate information relating to the graph.
4.5.7 How to Set General Display Preferences Like many of the components within LiveWire, the user can adjust their displays to suit their needs.
Set Display Preferences
• From the surface of the graph, right-click to generate a pop-up menu. From the pop-up menu click Properties. From the properties dialog box, select the preferences desired.
Copyright © 2004 Z Systems, Inc. All Rights Reserved. 83
LiveWire 2 – User’s Manual
The Professional’s Data Analysis and Visualization Tool
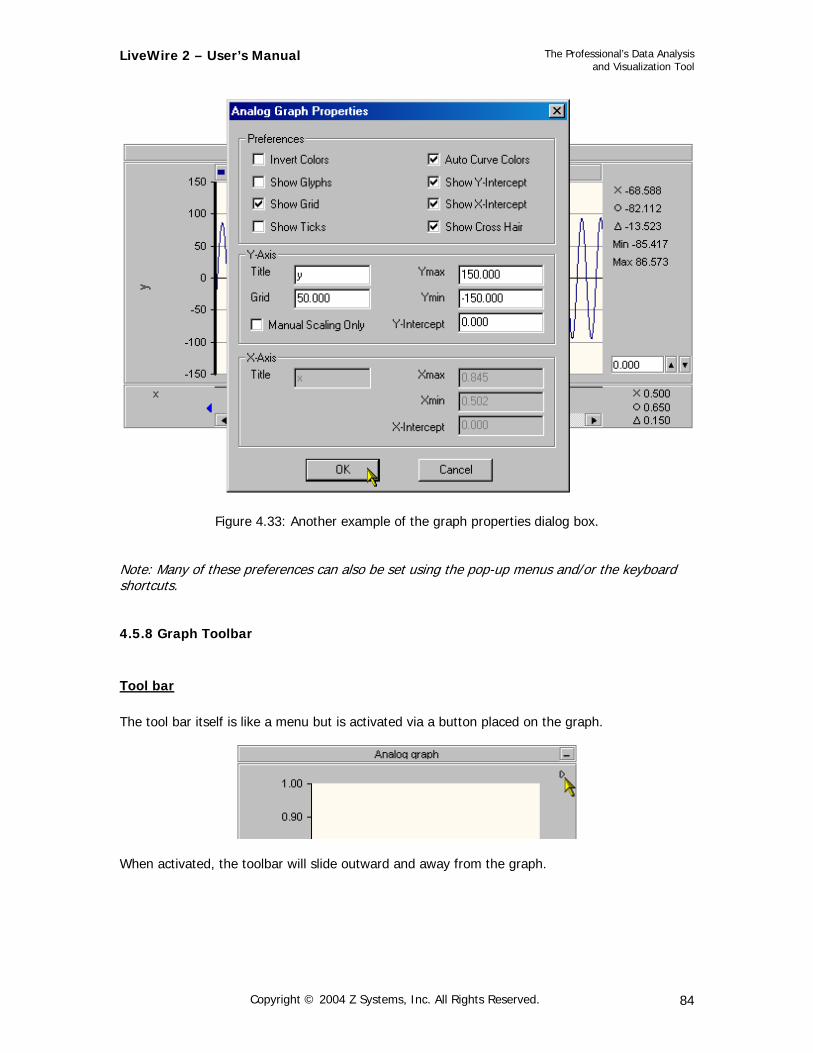
Figure 4.33: Another example of the graph properties dialog box. Note: Many of these preferences can also be set using the pop-up menus and/or the keyboard shortcuts.
4.5.8 Graph Toolbar
Tool bar The tool bar itself is like a menu but is activated via a button placed on the graph.
When activated, the toolbar will slide outward and away from the graph.
Copyright © 2004 Z Systems, Inc. All Rights Reserved. 84
LiveWire 2 – User’s Manual
The Professional’s Data Analysis and Visualization Tool
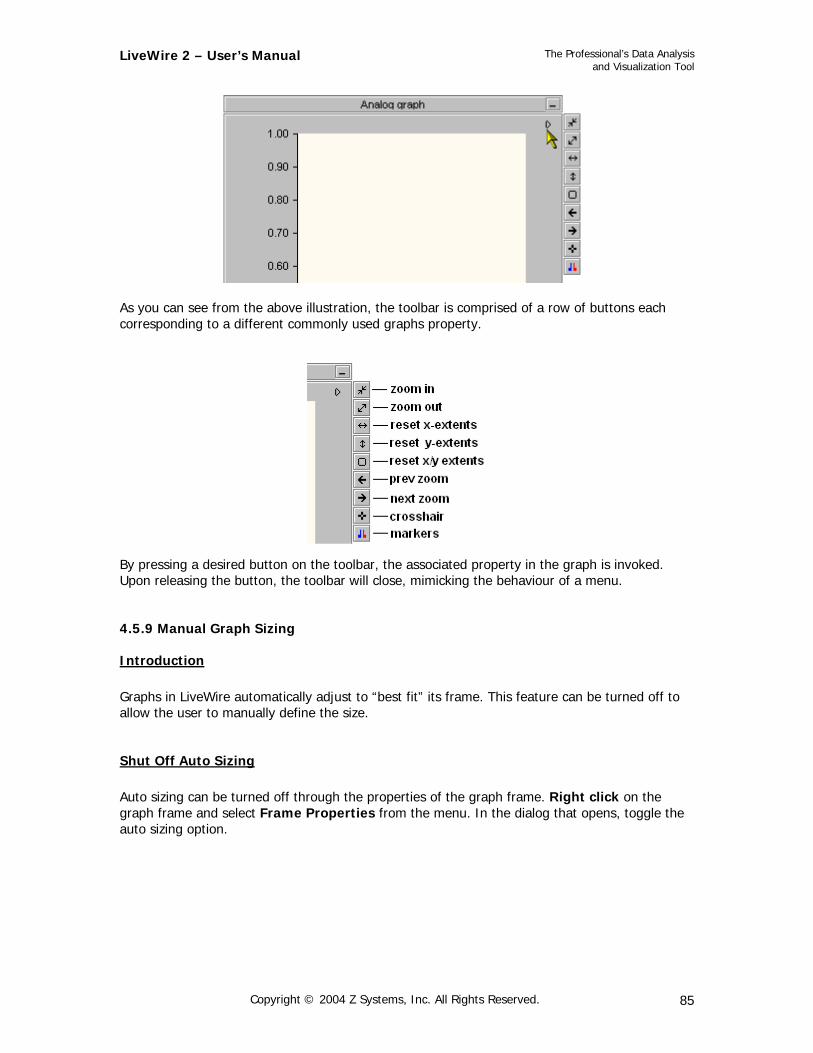
As you can see from the above illustration, the toolbar is comprised of a row of buttons each corresponding to a different commonly used graphs property.
By pressing a desired button on the toolbar, the associated property in the graph is invoked. Upon releasing the button, the toolbar will close, mimicking the behaviour of a menu.
4.5.9 Manual Graph Sizing
Introduction Graphs in LiveWire automatically adjust to “best fit” its frame. This feature can be turned off to allow the user to manually define the size.
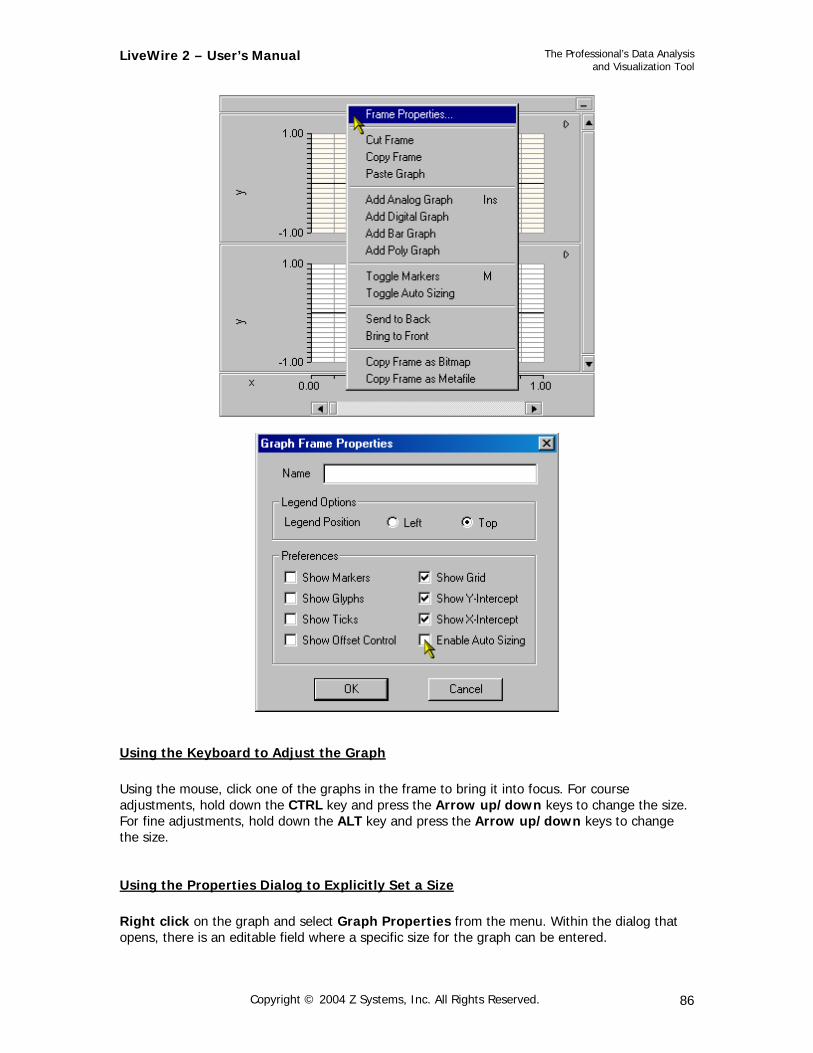
Shut Off Auto Sizing Auto sizing can be turned off through the properties of the graph frame. Right click on the graph frame and select Frame Properties from the menu. In the dialog that opens, toggle the auto sizing option.
Copyright © 2004 Z Systems, Inc. All Rights Reserved. 85
LiveWire 2 – User’s Manual
The Professional’s Data Analysis and Visualization Tool
Using the Keyboard to Adjust the Graph Using the mouse, click one of the graphs in the frame to bring it into focus. For course adjustments, hold down the CTRL key and press the Arrow up/down keys to change the size. For fine adjustments, hold down the ALT key and press the Arrow up/down keys to change the size.
Using the Properties Dialog to Explicitly Set a Size Right click on the graph and select Graph Properties from the menu. Within the dialog that opens, there is an editable field where a specific size for the graph can be entered.
Copyright © 2004 Z Systems, Inc. All Rights Reserved. 86
LiveWire 2 – User’s Manual
The Professional’s Data Analysis and Visualization Tool
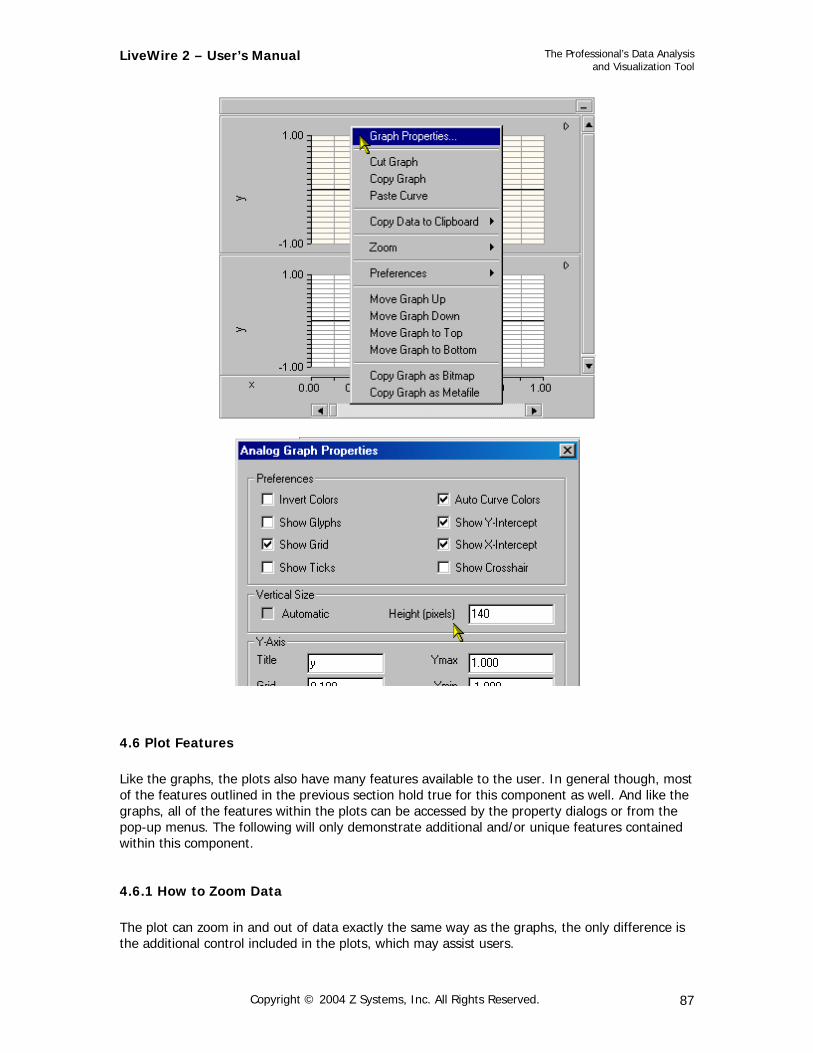
4.6 Plot Features Like the graphs, the plots also have many features available to the user. In general though, most of the features outlined in the previous section hold true for this component as well. And like the graphs, all of the features within the plots can be accessed by the property dialogs or from the pop-up menus. The following will only demonstrate additional and/or unique features contained within this component.
4.6.1 How to Zoom Data The plot can zoom in and out of data exactly the same way as the graphs, the only difference is the additional control included in the plots, which may assist users.
Copyright © 2004 Z Systems, Inc. All Rights Reserved. 87
LiveWire 2 – User’s Manual
The Professional’s Data Analysis and Visualization Tool
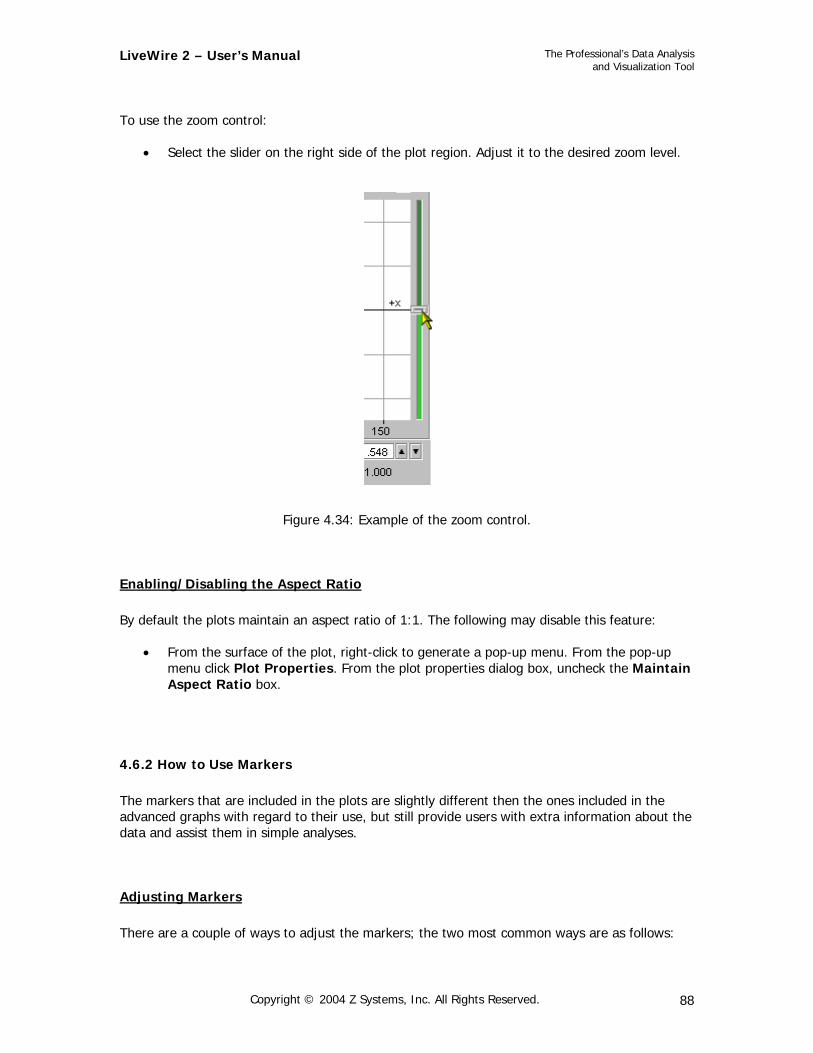
To use the zoom control:
• Select the slider on the right side of the plot region. Adjust it to the desired zoom level.
Figure 4.34: Example of the zoom control.
Enabling/Disabling the Aspect Ratio By default the plots maintain an aspect ratio of 1:1. The following may disable this feature:
• From the surface of the plot, right-click to generate a pop-up menu. From the pop-up menu click Plot Properties. From the plot properties dialog box, uncheck the Maintain Aspect Ratio box.
4.6.2 How to Use Markers The markers that are included in the plots are slightly different then the ones included in the advanced graphs with regard to their use, but still provide users with extra information about the data and assist them in simple analyses.
Adjusting Markers There are a couple of ways to adjust the markers; the two most common ways are as follows:
Copyright © 2004 Z Systems, Inc. All Rights Reserved. 88
LiveWire 2 – User’s Manual
The Professional’s Data Analysis and Visualization Tool
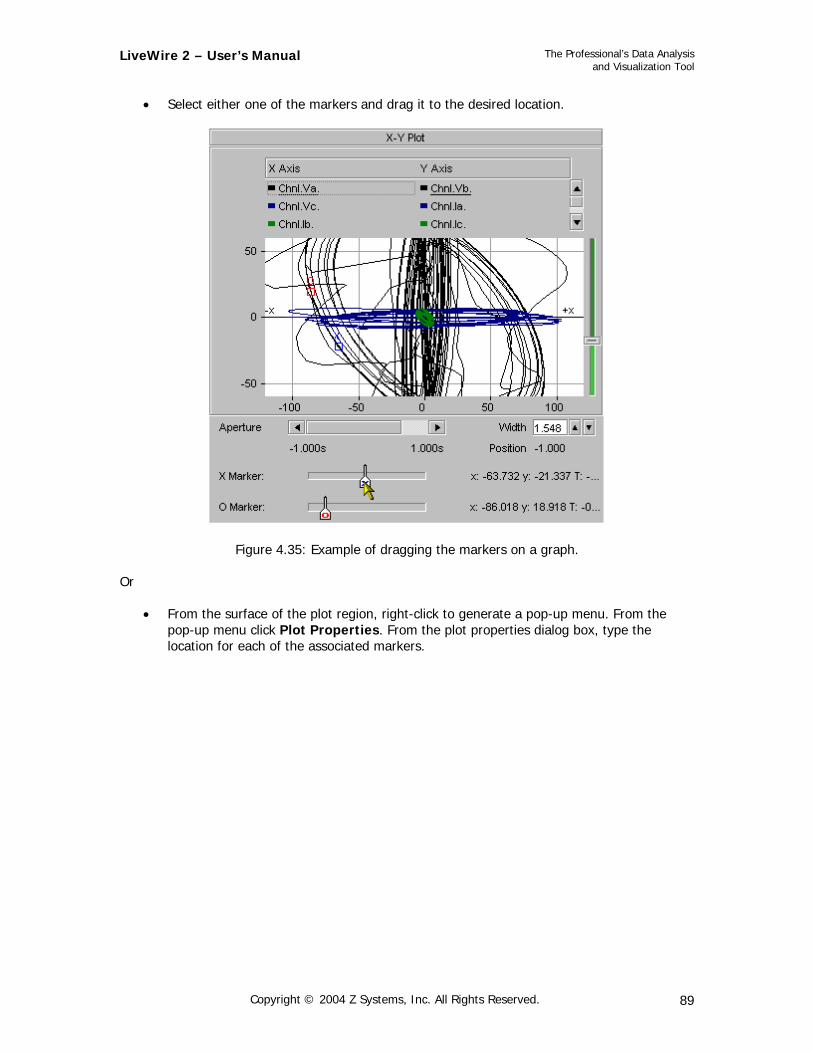
• Select either one of the markers and drag it to the desired location.
Figure 4.35: Example of dragging the markers on a graph. Or
• From the surface of the plot region, right-click to generate a pop-up menu. From the pop-up menu click Plot Properties. From the plot properties dialog box, type the location for each of the associated markers.
Copyright © 2004 Z Systems, Inc. All Rights Reserved. 89
LiveWire 2 – User’s Manual
The Professional’s Data Analysis and Visualization Tool
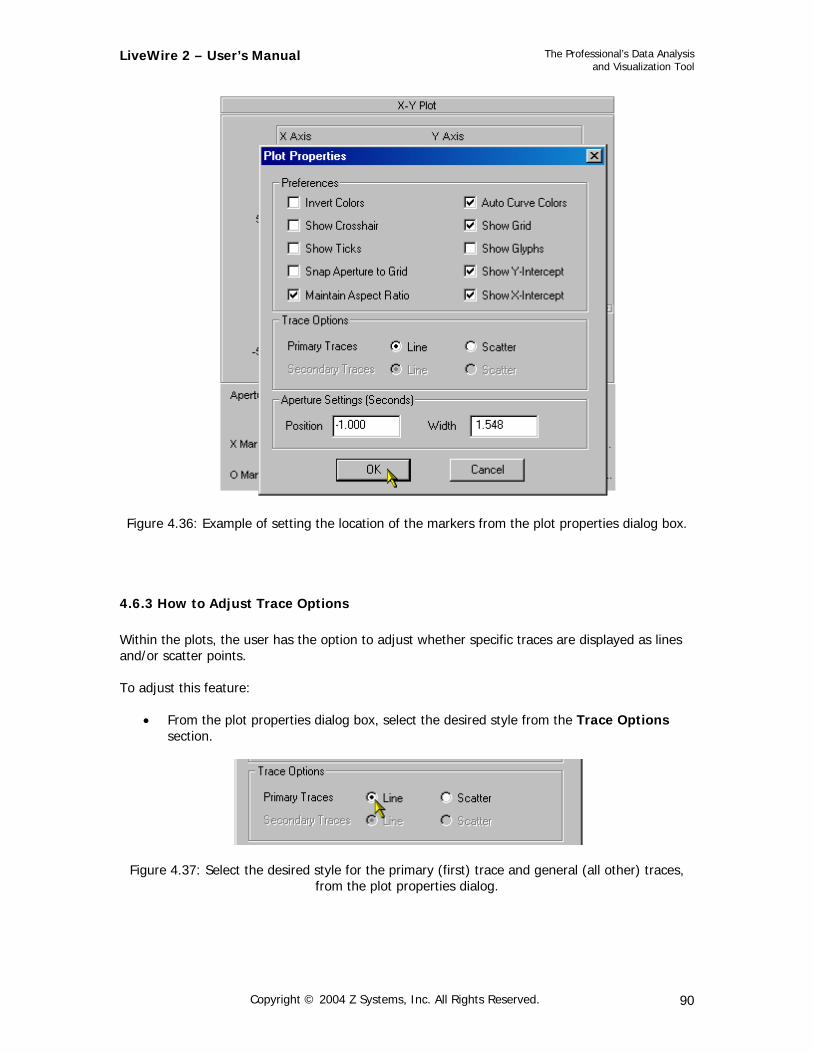
Figure 4.36: Example of setting the location of the markers from the plot properties dialog box.
4.6.3 How to Adjust Trace Options Within the plots, the user has the option to adjust whether specific traces are displayed as lines and/or scatter points. To adjust this feature:
• From the plot properties dialog box, select the desired style from the Trace Options section.
Figure 4.37: Select the desired style for the primary (first) trace and general (all other) traces, from the plot properties dialog.
Copyright © 2004 Z Systems, Inc. All Rights Reserved. 90
LiveWire 2 – User’s Manual
The Professional’s Data Analysis and Visualization Tool
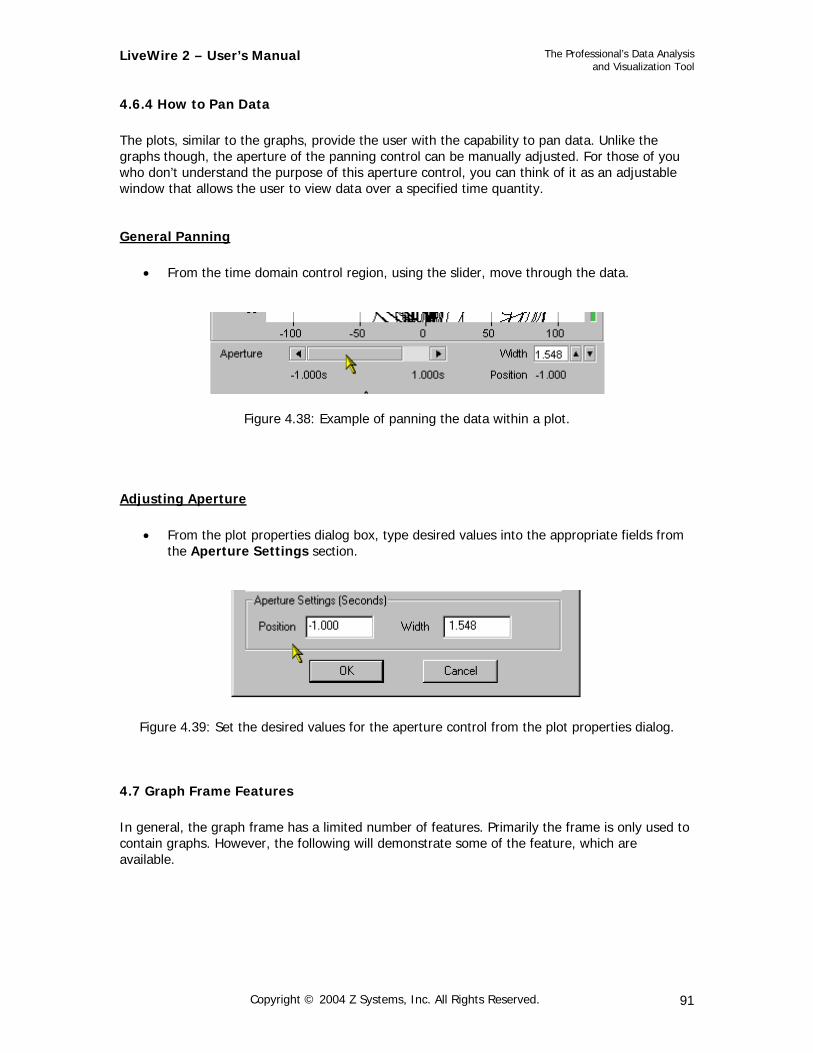
4.6.4 How to Pan Data The plots, similar to the graphs, provide the user with the capability to pan data. Unlike the graphs though, the aperture of the panning control can be manually adjusted. For those of you who don’t understand the purpose of this aperture control, you can think of it as an adjustable window that allows the user to view data over a specified time quantity.
General Panning
• From the time domain control region, using the slider, move through the data.
Figure 4.38: Example of panning the data within a plot.
Adjusting Aperture
• From the plot properties dialog box, type desired values into the appropriate fields from the Aperture Settings section.
Figure 4.39: Set the desired values for the aperture control from the plot properties dialog.
4.7 Graph Frame Features In general, the graph frame has a limited number of features. Primarily the frame is only used to contain graphs. However, the following will demonstrate some of the feature, which are available.
Copyright © 2004 Z Systems, Inc. All Rights Reserved. 91
LiveWire 2 – User’s Manual
The Professional’s Data Analysis and Visualization Tool
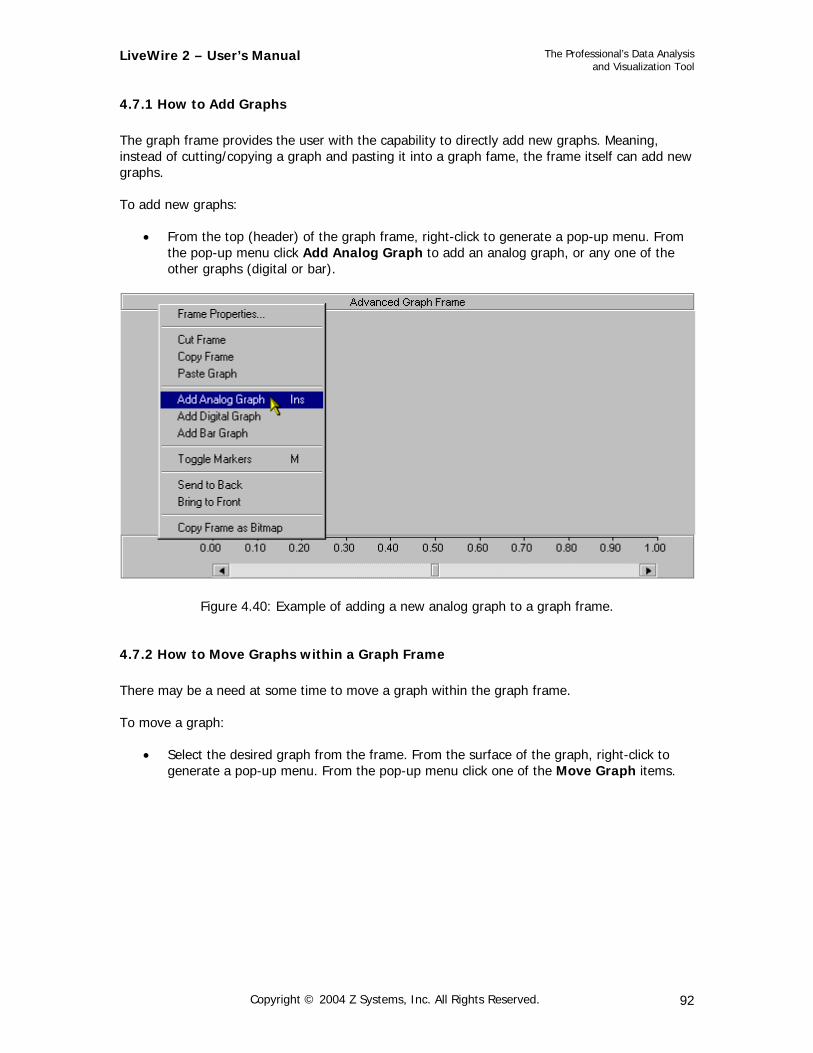
4.7.1 How to Add Graphs The graph frame provides the user with the capability to directly add new graphs. Meaning, instead of cutting/copying a graph and pasting it into a graph fame, the frame itself can add new graphs. To add new graphs:
• From the top (header) of the graph frame, right-click to generate a pop-up menu. From the pop-up menu click Add Analog Graph to add an analog graph, or any one of the other graphs (digital or bar).
Figure 4.40: Example of adding a new analog graph to a graph frame.
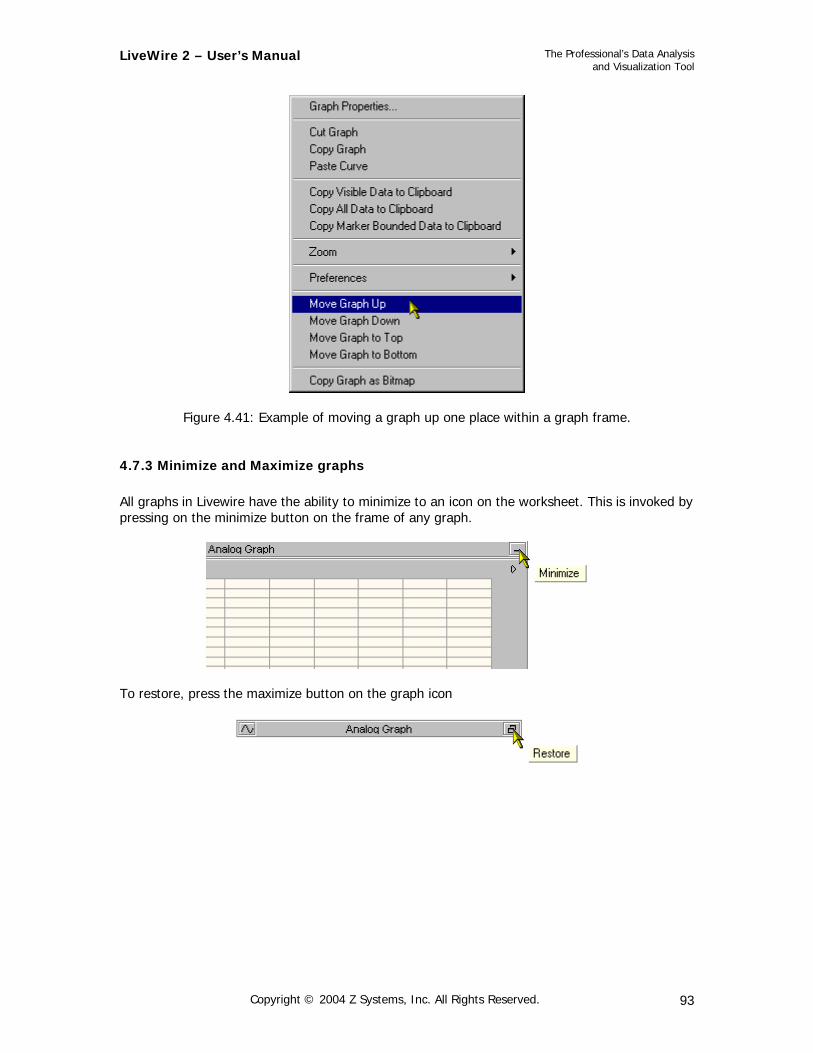
4.7.2 How to Move Graphs within a Graph Frame There may be a need at some time to move a graph within the graph frame. To move a graph:
• Select the desired graph from the frame. From the surface of the graph, right-click to generate a pop-up menu. From the pop-up menu click one of the Move Graph items.
Copyright © 2004 Z Systems, Inc. All Rights Reserved. 92
LiveWire 2 – User’s Manual
The Professional’s Data Analysis and Visualization Tool
Figure 4.41: Example of moving a graph up one place within a graph frame.
4.7.3 Minimize and Maximize graphs All graphs in Livewire have the ability to minimize to an icon on the worksheet. This is invoked by pressing on the minimize button on the frame of any graph.
To restore, press the maximize button on the graph icon
Copyright © 2004 Z Systems, Inc. All Rights Reserved. 93
LiveWire 2 – User’s Manual
The Professional’s Data Analysis and Visualization Tool
5.0 Harmonic Analysis Component 5.1 Creating Harmonic Components
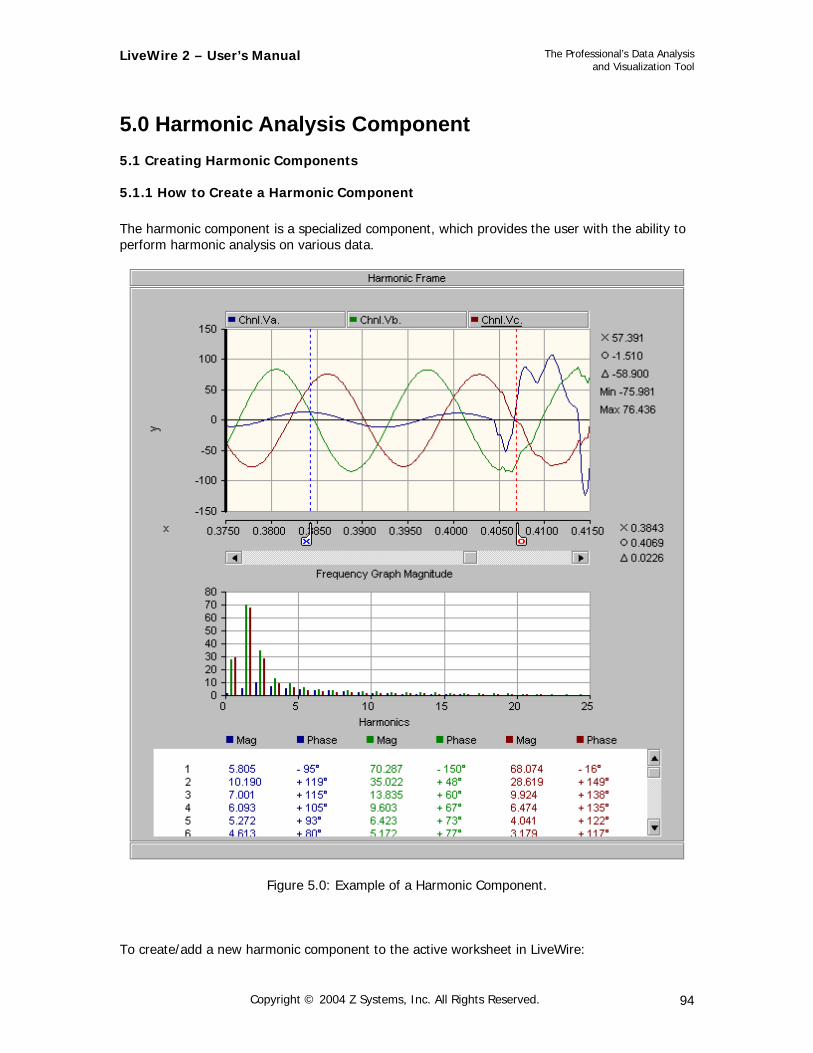
5.1.1 How to Create a Harmonic Component The harmonic component is a specialized component, which provides the user with the ability to perform harmonic analysis on various data.
Figure 5.0: Example of a Harmonic Component.
To create/add a new harmonic component to the active worksheet in LiveWire:
Copyright © 2004 Z Systems, Inc. All Rights Reserved. 94
LiveWire 2 – User’s Manual
The Professional’s Data Analysis and Visualization Tool
• From the LiveWire menu, click Graph Specialized Add Harmonic Graph
Component, or click the button from the toolbar.
5.2 Attaching Data to Harmonic Components For the harmonic component to be useful, you must be able to get the data connected to them. LiveWire provides many different ways to do this. To display or visualize and perform a harmonic analysis on a data set in a graph it must be attached as a curve.
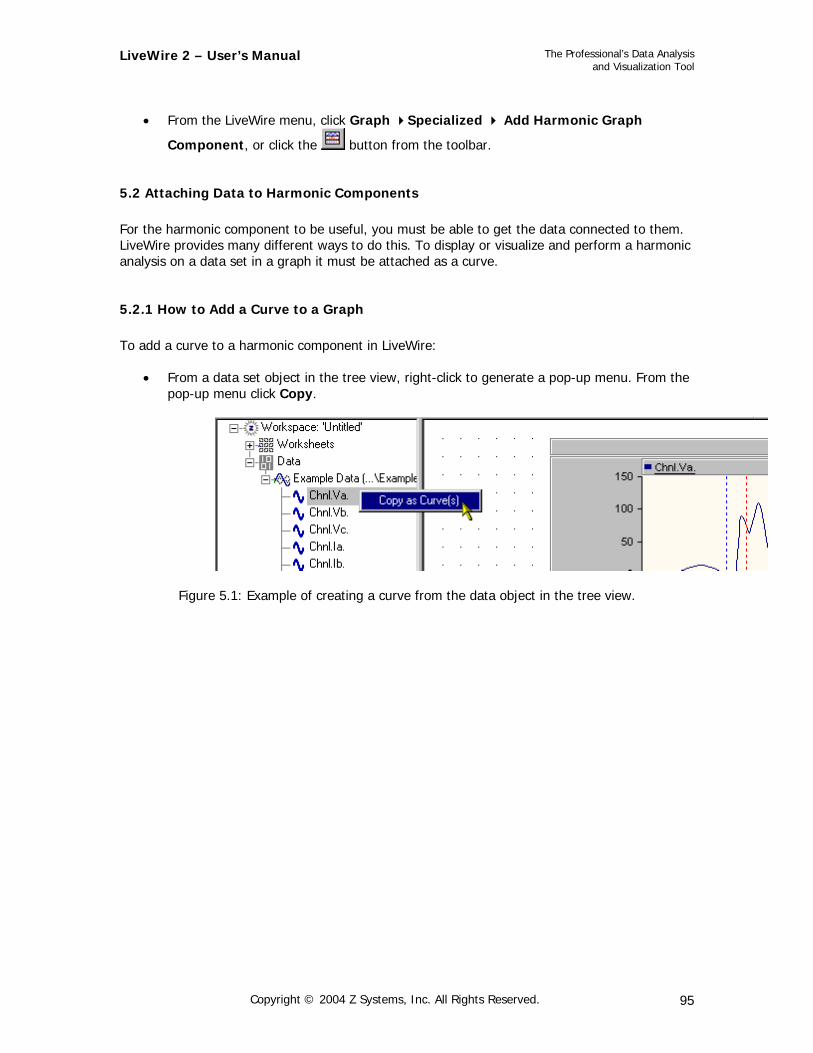
5.2.1 How to Add a Curve to a Graph To add a curve to a harmonic component in LiveWire:
• From a data set object in the tree view, right-click to generate a pop-up menu. From the pop-up menu click Copy.
Figure 5.1: Example of creating a curve from the data object in the tree view.
Copyright © 2004 Z Systems, Inc. All Rights Reserved. 95
LiveWire 2 – User’s Manual
The Professional’s Data Analysis and Visualization Tool
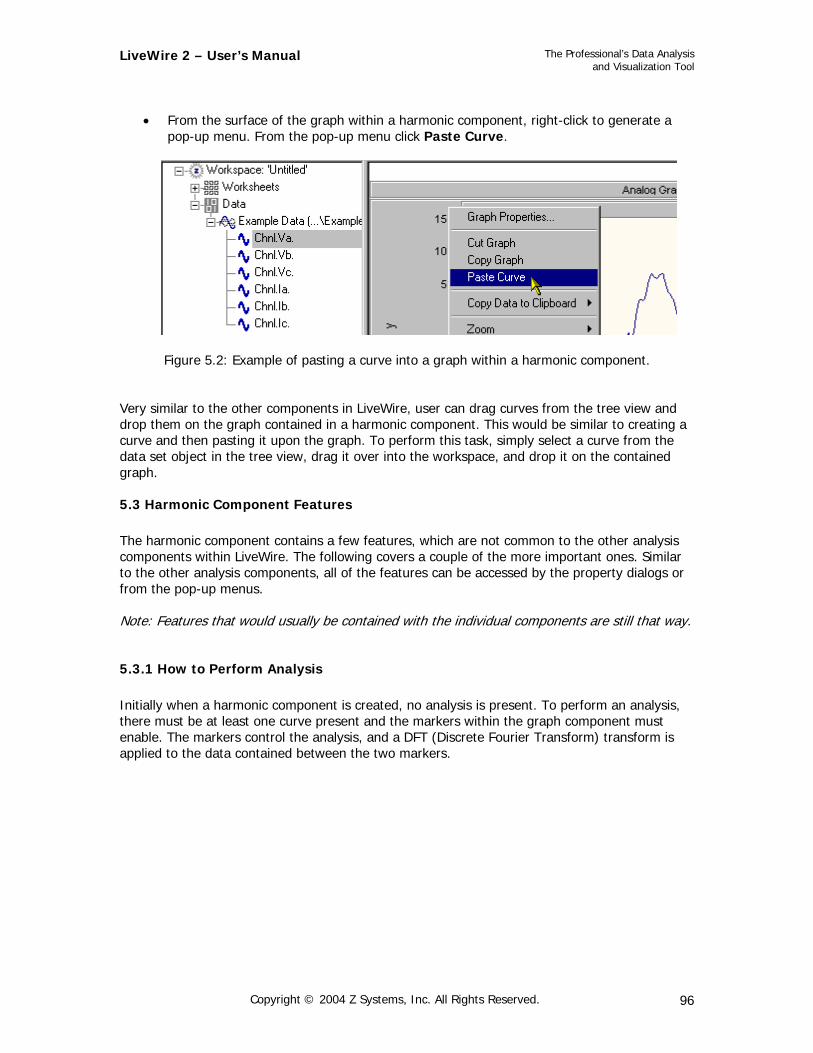
• From the surface of the graph within a harmonic component, right-click to generate a
pop-up menu. From the pop-up menu click Paste Curve.
Figure 5.2: Example of pasting a curve into a graph within a harmonic component. Very similar to the other components in LiveWire, user can drag curves from the tree view and drop them on the graph contained in a harmonic component. This would be similar to creating a curve and then pasting it upon the graph. To perform this task, simply select a curve from the data set object in the tree view, drag it over into the workspace, and drop it on the contained graph.
5.3 Harmonic Component Features The harmonic component contains a few features, which are not common to the other analysis components within LiveWire. The following covers a couple of the more important ones. Similar to the other analysis components, all of the features can be accessed by the property dialogs or from the pop-up menus. Note: Features that would usually be contained with the individual components are still that way.
5.3.1 How to Perform Analysis Initially when a harmonic component is created, no analysis is present. To perform an analysis, there must be at least one curve present and the markers within the graph component must enable. The markers control the analysis, and a DFT (Discrete Fourier Transform) transform is applied to the data contained between the two markers.
Copyright © 2004 Z Systems, Inc. All Rights Reserved. 96
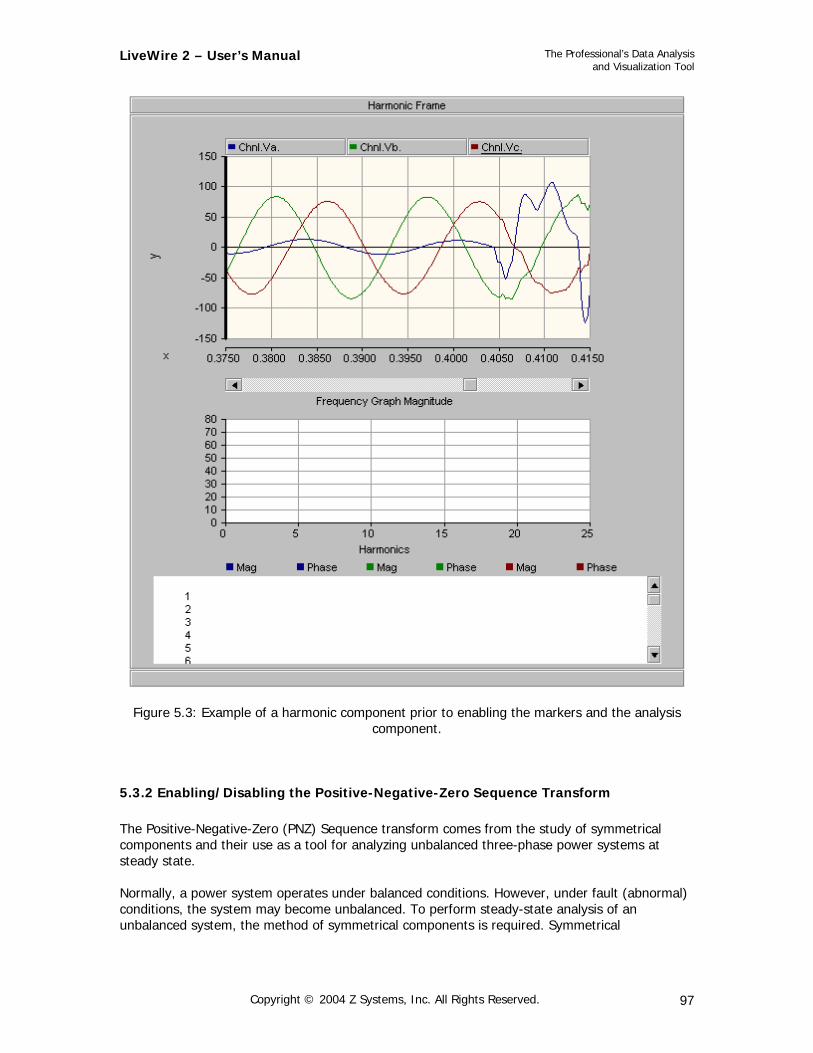
LiveWire 2 – User’s Manual
The Professional’s Data Analysis and Visualization Tool
Figure 5.3: Example of a harmonic component prior to enabling the markers and the analysis component.
5.3.2 Enabling/Disabling the Positive-Negative-Zero Sequence Transform The Positive-Negative-Zero (PNZ) Sequence transform comes from the study of symmetrical components and their use as a tool for analyzing unbalanced three-phase power systems at steady state. Normally, a power system operates under balanced conditions. However, under fault (abnormal) conditions, the system may become unbalanced. To perform steady-state analysis of an unbalanced system, the method of symmetrical components is required. Symmetrical
Copyright © 2004 Z Systems, Inc. All Rights Reserved. 97

LiveWire 2 – User’s Manual
The Professional’s Data Analysis and Visualization Tool
components allow you to break down the problem of solving unbalanced fault conditions in the power system. Symmetrical components consist of three sets of phasors; the positive sequence, the negative sequence, and the zero sequence. Before the Positive-Negative-Zero Sequence transform can be applied, there must be exactly three curves present in the harmonic component. There are a couple of ways to enable and/or disable the PNZ Sequence transform; the two most common ways are as follows:
• From the frame of the harmonic frame, right-click to generate a pop-up menu. From the pop-up menu click Toggle PNZS Transform, or press the “Z” key.
Or
• From the frame of the harmonic component, right-click to generate a pop-up menu. From the pop-up menu click Properties. From the harmonic component properties dialog box, check the Enable Positive-Negative-Zero Sequence Transform box.
Copyright © 2004 Z Systems, Inc. All Rights Reserved. 98
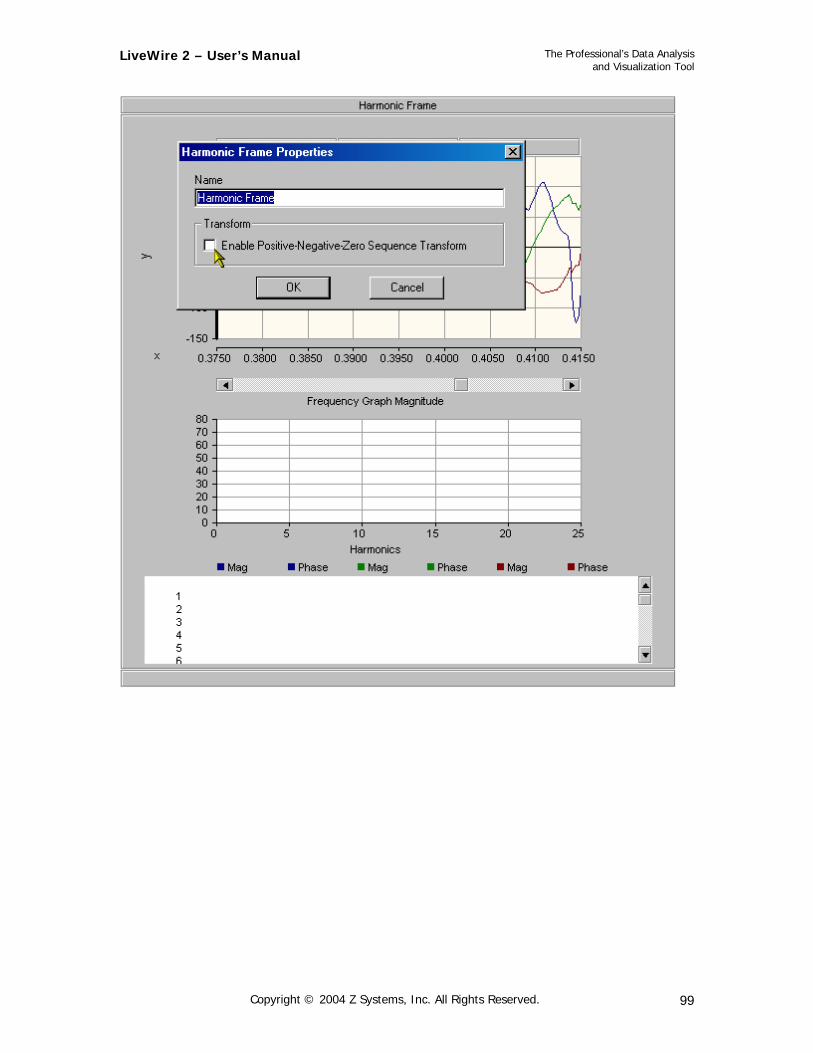
LiveWire 2 – User’s Manual
The Professional’s Data Analysis and Visualization Tool
Copyright © 2004 Z Systems, Inc. All Rights Reserved. 99
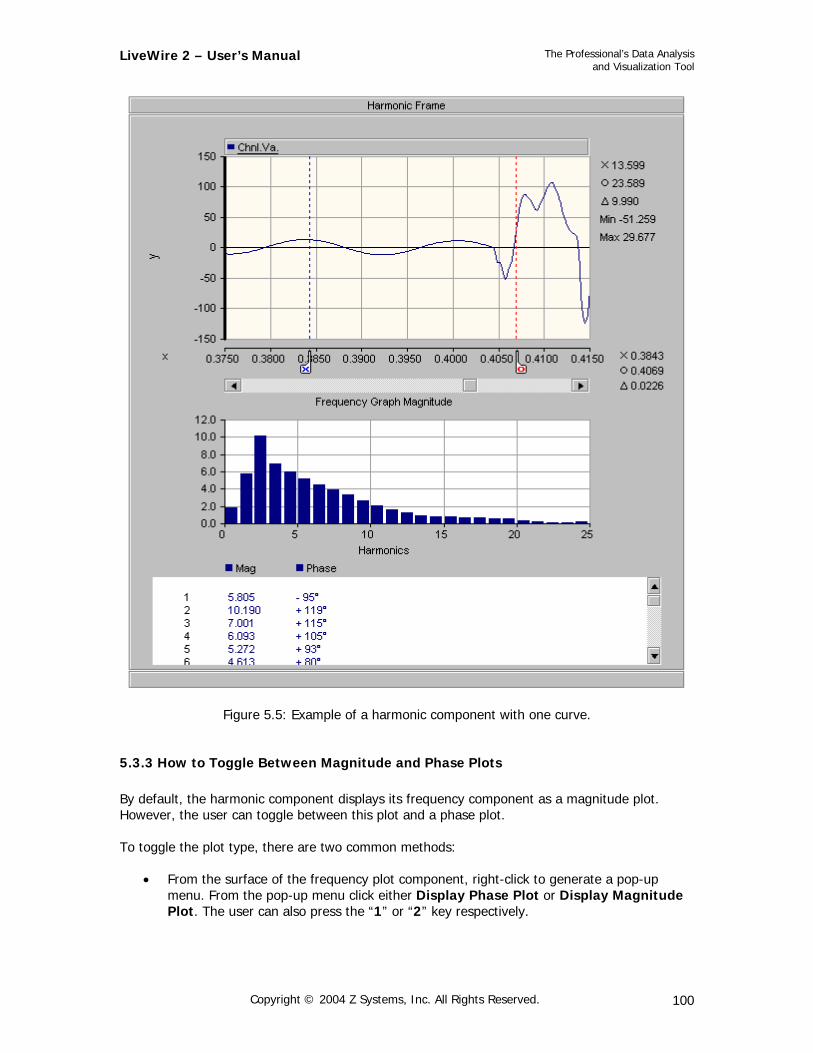
LiveWire 2 – User’s Manual
The Professional’s Data Analysis and Visualization Tool
Figure 5.5: Example of a harmonic component with one curve.
5.3.3 How to Toggle Between Magnitude and Phase Plots By default, the harmonic component displays its frequency component as a magnitude plot. However, the user can toggle between this plot and a phase plot. To toggle the plot type, there are two common methods:
• From the surface of the frequency plot component, right-click to generate a pop-up menu. From the pop-up menu click either Display Phase Plot or Display Magnitude Plot. The user can also press the “1” or “2” key respectively.
Copyright © 2004 Z Systems, Inc. All Rights Reserved. 100
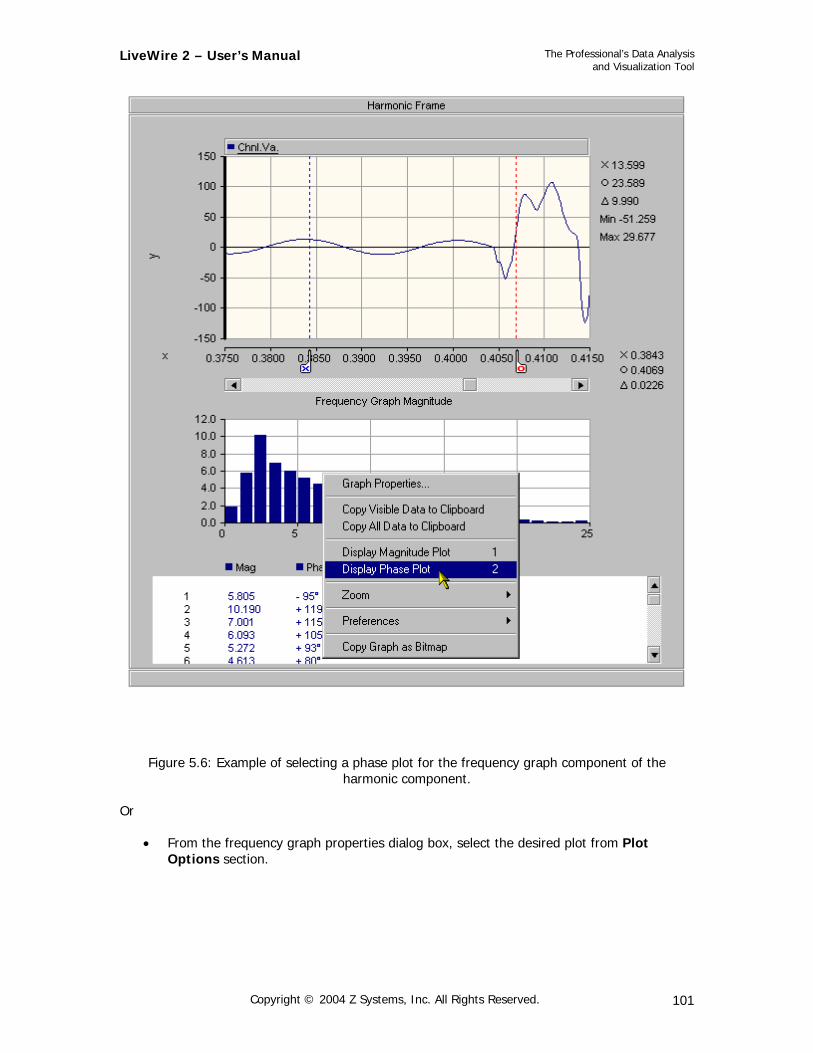
LiveWire 2 – User’s Manual
The Professional’s Data Analysis and Visualization Tool
Figure 5.6: Example of selecting a phase plot for the frequency graph component of the
harmonic component.
Or
• From the frequency graph properties dialog box, select the desired plot from Plot Options section.
Copyright © 2004 Z Systems, Inc. All Rights Reserved. 101
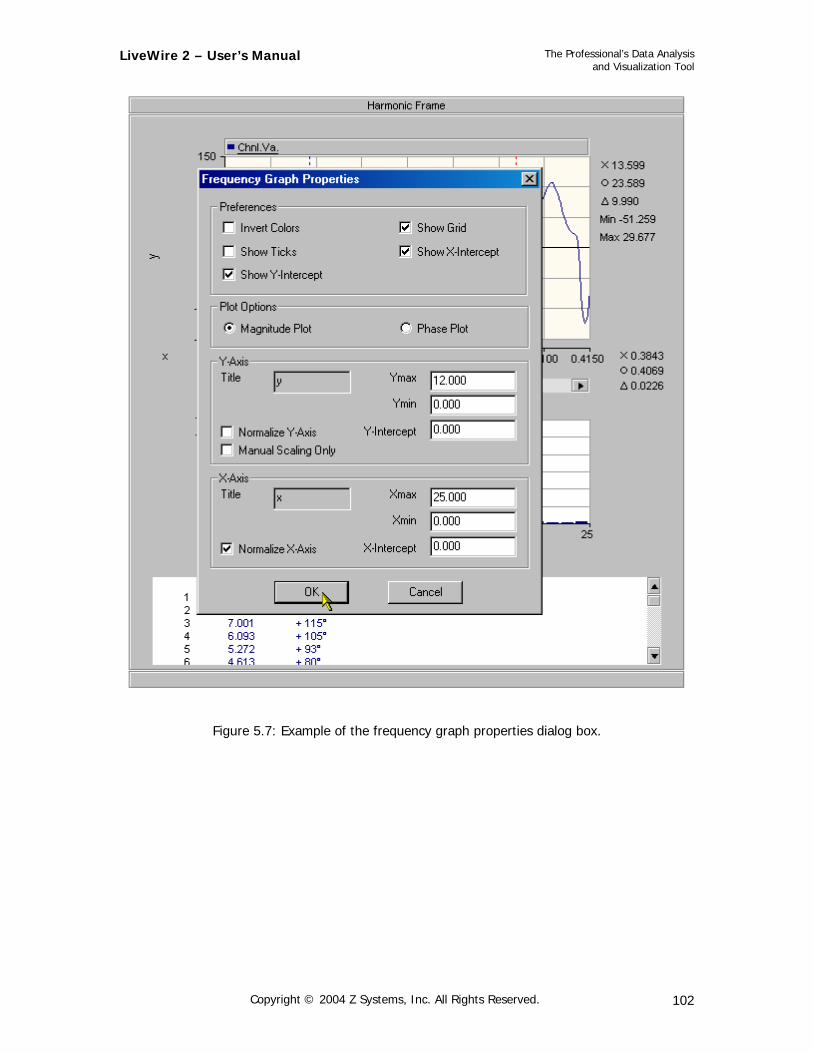
LiveWire 2 – User’s Manual
The Professional’s Data Analysis and Visualization Tool
Figure 5.7: Example of the frequency graph properties dialog box.
Copyright © 2004 Z Systems, Inc. All Rights Reserved. 102
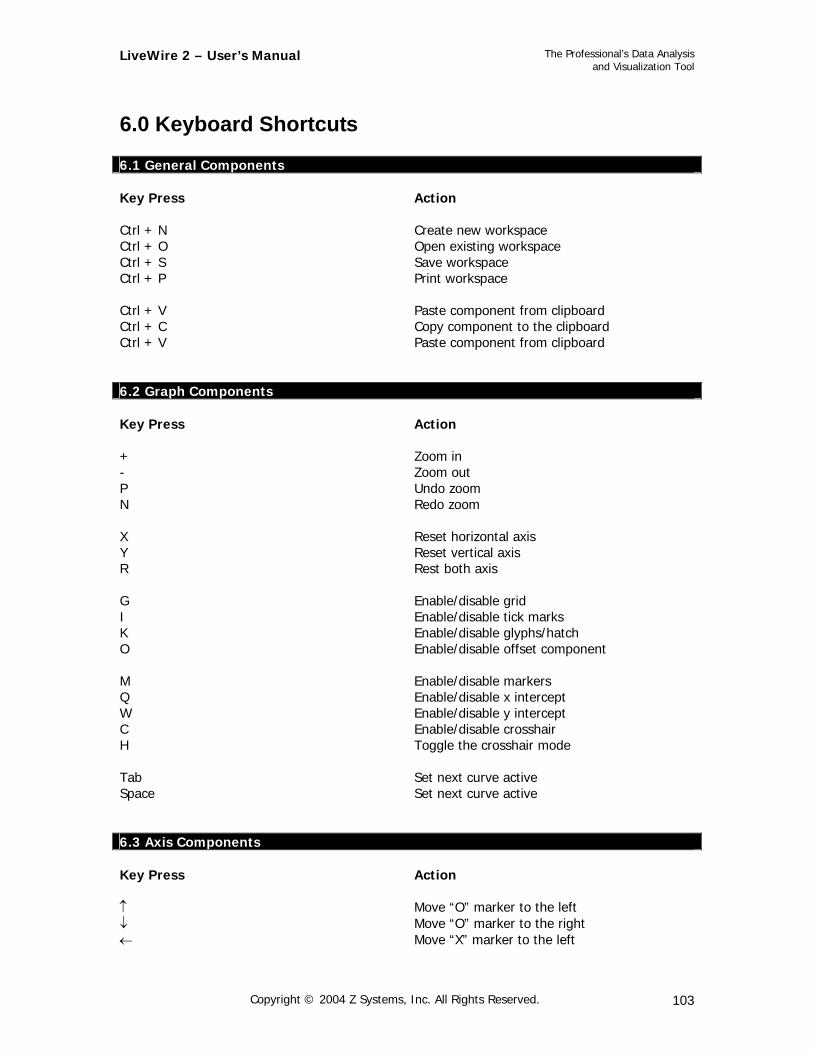
LiveWire 2 – User’s Manual
The Professional’s Data Analysis and Visualization Tool
6.0 Keyboard Shortcuts 6.1 General Components Key Press
Action
Ctrl + N Create new workspace Ctrl + O Open existing workspace Ctrl + S Save workspace Ctrl + P Print workspace Ctrl + V Paste component from clipboard Ctrl + C Copy component to the clipboard Ctrl + V Paste component from clipboard
6.2 Graph Components Key Press
Action
+ Zoom in - Zoom out P Undo zoom N Redo zoom X Reset horizontal axis Y Reset vertical axis R Rest both axis G Enable/disable grid I Enable/disable tick marks K Enable/disable glyphs/hatch O Enable/disable offset component M Enable/disable markers Q Enable/disable x intercept W Enable/disable y intercept C Enable/disable crosshair H Toggle the crosshair mode Tab Set next curve active Space
Set next curve active
6.3 Axis Components Key Press
Action
↑ Move “O” marker to the left ↓ Move “O” marker to the right ← Move “X” marker to the left
Copyright © 2004 Z Systems, Inc. All Rights Reserved. 103

LiveWire 2 – User’s Manual
The Professional’s Data Analysis and Visualization Tool
→ Move “X” marker to the right X Snap the “X” marker to the mouse O Snap the “O” marker to the mouse L Lock the markers F Toggle the delta marker readout mode
6.4 Frequency Plots Key Press
Action
1 Display the magnitude plot 2 Display the phase plot 6.5 Harmonic Analysis Component Key Press
Action
Z Enable/Disable the Positive-Negative-Zero
Sequence Transform
Copyright © 2004 Z Systems, Inc. All Rights Reserved. 104
LiveWire 2 – User’s Manual
The Professional’s Data Analysis and Visualization Tool
7.0 Technical Support Z Systems is committed to providing you with comprehensive technical support. Before Contacting Technical Support Before you contact our technical support department, please try to resolve your problems by using this guide and/or the Z Systems, Inc. web site. Tips
Your problem may be resolved by applying the most recent patch or upgrade of the software.
Your product registration key is required to obtain technical support.
Contact Information
Company Headquarters: Z Systems, Inc. 102 – 545 Hervo Street Winnipeg, Manitoba Canada R3T 3L6
Phone Number: (204) 453-1755
Fax Number:
(204) 474-1543
Support E-Mail: [email protected]
Company Web Site: http://www.zsystems.ca
Please include a description of your problem. Also include a return address, daytime phone number, and/or any other relevant information.
Copyright © 2004 Z Systems, Inc. All Rights Reserved. 105
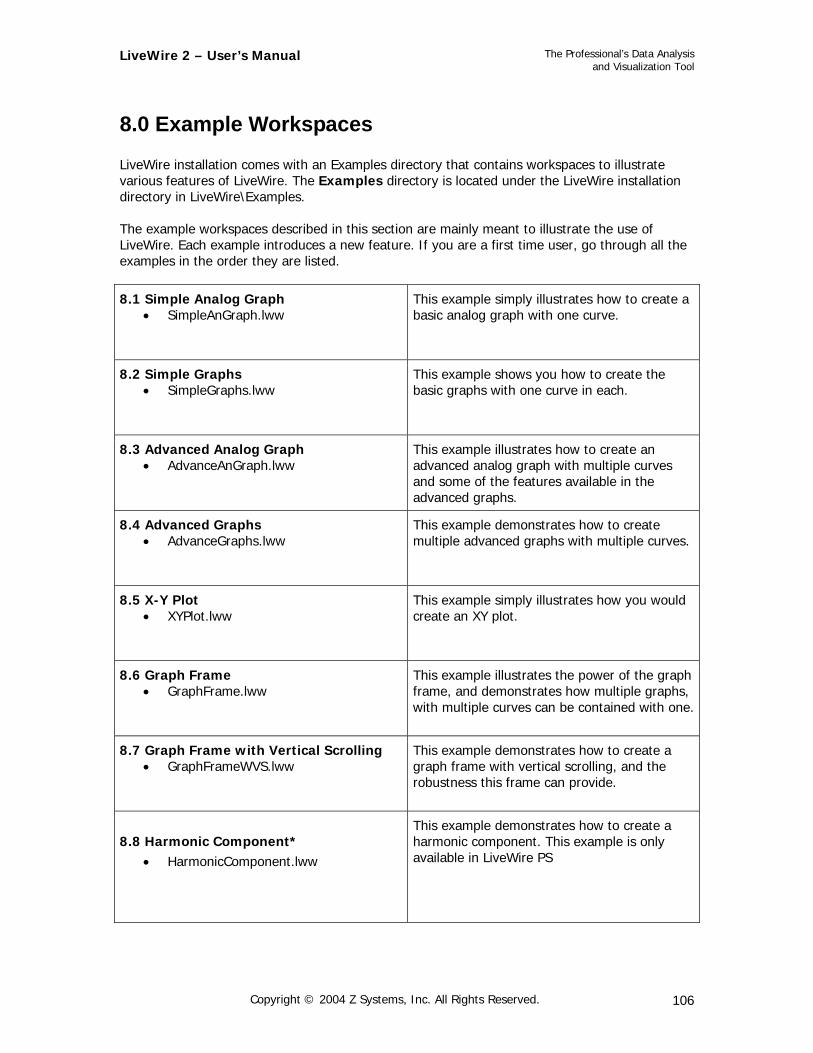
LiveWire 2 – User’s Manual
The Professional’s Data Analysis and Visualization Tool
8.0 Example Workspaces LiveWire installation comes with an Examples directory that contains workspaces to illustrate various features of LiveWire. The Examples directory is located under the LiveWire installation directory in LiveWire\Examples. The example workspaces described in this section are mainly meant to illustrate the use of LiveWire. Each example introduces a new feature. If you are a first time user, go through all the examples in the order they are listed.
8.1 Simple Analog Graph • SimpleAnGraph.lww
This example simply illustrates how to create a basic analog graph with one curve.
8.2 Simple Graphs • SimpleGraphs.lww
This example shows you how to create the basic graphs with one curve in each.
8.3 Advanced Analog Graph • AdvanceAnGraph.lww
This example illustrates how to create an advanced analog graph with multiple curves and some of the features available in the advanced graphs.
8.4 Advanced Graphs • AdvanceGraphs.lww
This example demonstrates how to create multiple advanced graphs with multiple curves.
8.5 X-Y Plot • XYPlot.lww
This example simply illustrates how you would create an XY plot.
8.6 Graph Frame • GraphFrame.lww
This example illustrates the power of the graph frame, and demonstrates how multiple graphs, with multiple curves can be contained with one.
8.7 Graph Frame with Vertical Scrolling • GraphFrameWVS.lww
This example demonstrates how to create a graph frame with vertical scrolling, and the robustness this frame can provide.
8.8 Harmonic Component* • HarmonicComponent.lww
This example demonstrates how to create a harmonic component. This example is only available in LiveWire PS
Copyright © 2004 Z Systems, Inc. All Rights Reserved. 106

LiveWire 2 – User’s Manual
The Professional’s Data Analysis and Visualization Tool
9.0 LiveWire Licence Agreement
LIVEWIRE V2 LICENCE AGREEMENT IMPORTANT CAREFULLY READ THIS LICENCE AGREEMENT BEFORE PROCEEDING. SOFTWARE PROGRAM: LIVEWIRE Version 2 This document is your Proof of LICENCE and the legal agreement governing your use of the Software. 1. GRANT Z Systems Inc. ('ZSYSTEMS') grants you the right to use the Software Program Version (the 'Software') specified above and its associated documentation, on the Quantity of personal computers as specified on the purchase order(s). You may copy the Software into the local memory or storage device of the specified quantity of computers. You may copy the Software onto a network server for the sole purpose of distributing the Software to the specified quantity of computers. You may make archival or back-up copies of the Software. You may not transfer or LICENCE your rights to use the Software, the Software itself including any updates to the specified version of the Software, and the accompanying documentation including this LICENCE Agreement. 2. COPYRIGHT The Software is owned by ZSYSTEMS and is protected by copyright laws and international treaties. Your use of the Software and associated documentation is subject to the applicable copyright laws and the express rights and restrictions of this LICENCE Agreement. 3. RESTRICTIONS You may not rent, lease, loan, or otherwise transfer the Software except as expressly authorized in this LICENCE Agreement. You may not remove any copyright, trademark, or other proprietary notices from the Software or the media. You may not reverse engineer, decompile, disassemble, or translate the Software, or otherwise attempt to derive the source code of the Software, except to the extent the ZSYSTEMS cannot prohibit such acts by law. 4. LIMITED WARANTY a) ZSYSTEMS warrants that the Software will perform substantially as described in the documentation accompanying the Software for a period of sixty (60) days from delivery. ANY IMPLIED WARRANTIES OF MERCHANTABILITY OR FITNESS FOR A PARTICULAR PURPOSE ARE LIMITED TO SIXTY (60) DAYS. b) EXCLUSIVE REMEDY. ZSYSTEMS's and its suppliers' entire liability and your exclusive remedy for Software which does not conform to the ZSYSTEMS's Limited Warranty shall be, at the ZSYSTEMS's option, either (1) repair or replacement of the nonconforming Software, or (2) refund of your purchase price. This warranty and remedy are subject to your returning the nonconforming Software during the warranty period to the supplier from whom you obtained the Software. c) DISCLAIMER OF WARRANTIES. THE ABOVE WARRANTIES ARE YOUR EXCLUSIVE WARRANTIES AND NO OTHER WARRANTY, EXPRESS OR IMPLIED, WILL APPLY. ZSYSTEMS does not warrant that the operation of the Software will be uninterrupted or error free. This warranty gives you specific legal rights, and you may also have other rights which vary from region to region. Some states do not allow limitations on how long an implied warranty lasts, so the above limitation may not apply to you. 5. ALLOCATION OF LIABILITY ZSYSTEMS'S AND ITS SUPPLIERS' TOTAL LIABILITY TO YOU FOR ANY CAUSE WHATSOEVER SHALL BE LIMITED TO THE PURCHASE PRICE YOU PAID FOR THE PRODUCT. THIS LIMITATION WILL APPLY REGARDLESS OF THE FORM OF ACTION, WHETHER IN CONTRACT OR TORT, INCLUDING WITHOUT LIMITATION NEGLIGENCE. IN NO EVENT WILL ZSYSTEMS OR ITS SUPPLIERS BE LIABLE FOR ANY DAMAGES RESULTING FROM LOSS OF DATA OR USE, LOST PROFITS, OR ANY INCIDENTAL OR CONSEQUENTIAL DAMAGES. 6. INDEMNITY ZSYSTEMS will defend any claim, action or proceeding brought against you to the extent that it is based upon a claim that use of the Software or of the Documentation within the scope of this Agreement infringes any patents, copyrights, LICENCE or other proprietary rights, provided that ZSYSTEMS is notified by you in writing of such claims, actions or proceedings immediately upon you becoming aware of the same. ZSYSTEMS shall have the right to control the defense of all such claims, actions or proceedings and you will cooperate fully with ZSYSTEMS in the defense thereof. In no event you shall settle any such claim, action or proceeding without ZSYSTEMS's prior written approval. ZSYSTEMS's obligation shall not extend to any claim, action or proceeding brought against you based upon a claim that: (a) use of the Software as modified by you; or (b) use of any modification of the Software by you infringes any patent, copyright, LICENCE or other proprietary right. 7. CUSTOMER SUPPORT You may purchase additional software support at prices and conditions set by ZSYSTEMS. Telephone support, bug fixes, if any, to the software will be provided under contract by ZSYSTEMS. ZSYSTEMS is not required to provide support to customers who have not purchased software support. 8. GENERAL You are responsible for compliance with all applicable export or re-export control laws and regulations if you export the Software. This Agreement is governed by and is to be construed under the laws of the Province of Manitoba. The 1980 United Nations Convention on Contracts for the International Sale of Goods will not apply. If you have any questions concerning this Agreement, please contact our local representatives office through which you obtained this Agreement or write to: Z Systems Inc. 102-545 Hervo Street Winnipeg, Manitoba R3T 3L6 Canada 9. ACKNOWLEDGEMENT You acknowledge that you have read this agreement, understand it, and agree to be bound by its terms and conditions. All registered and unregistered trademarks are the sole property of their owners, and are specifically listed in the Software Product Description or user documentation for this Software Program. Copyright (C) Z Systems Inc., 2004. All rights reserved.
Copyright © 2004 Z Systems, Inc. All Rights Reserved. 107

LiveWire 2 – User’s Manual
The Professional’s Data Analysis and Visualization Tool
10.0 Copyright Copyright © 2004 Z Systems, Inc. All Rights Reserved. The entire risk of the use or the result of the use of this software and the documentation remains with the user. No part of this document may be reproduced or transmitted in any means, electronic or mechanical, for any purpose, except as expressed in the Software License Agreement. Z Systems, Z Systems Logo, and LiveWire are trademarks of Z Systems, Inc. All other brand and product names are trademarks or registered trademarks of their respective owners.
Copyright © 2004 Z Systems, Inc. All Rights Reserved. 108