Embed Size (px)
Citation preview
© Oene Oenema, Wageningen UR © Oene Oenema, Wageningen UR
Livestock production and manure
management in EU-27
Oene Oenema
Wageningen University
ReUseWaste Kick off meeting
Copenhagen, Denmark Sept 24-26, 2012
© Oene Oenema, Wageningen UR
Outline
Agriculture in European Union (EU-27)
Livestock production in EU-27
Manure management
Summary
© Oene Oenema, Wageningen UR
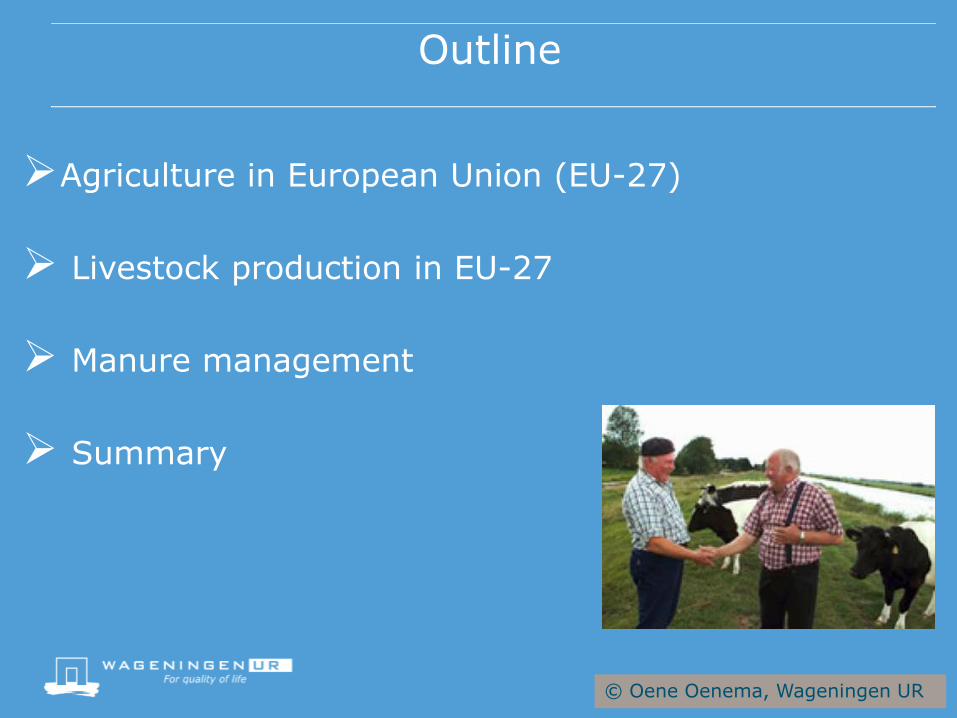
European Union (EU-27)
27 countries
4.2 million km2
500 million people
23 official languages
UAA: 1.6 million km2
7 million farms
Average size 22 ha
© Oene Oenema, Wageningen UR
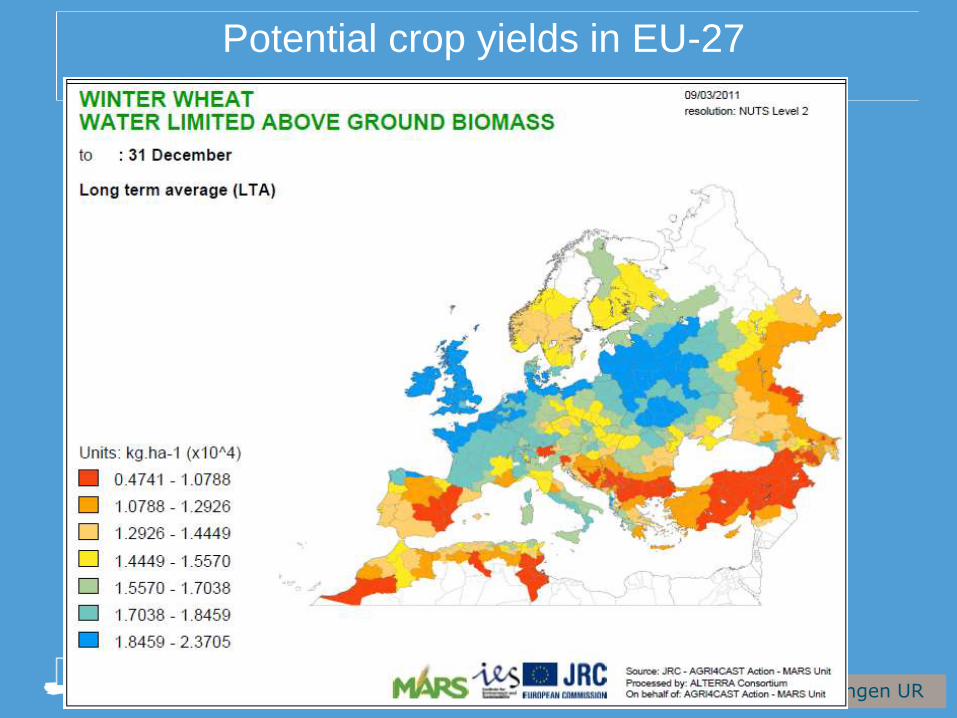
Potential crop yields in EU-27
© Oene Oenema, Wageningen UR
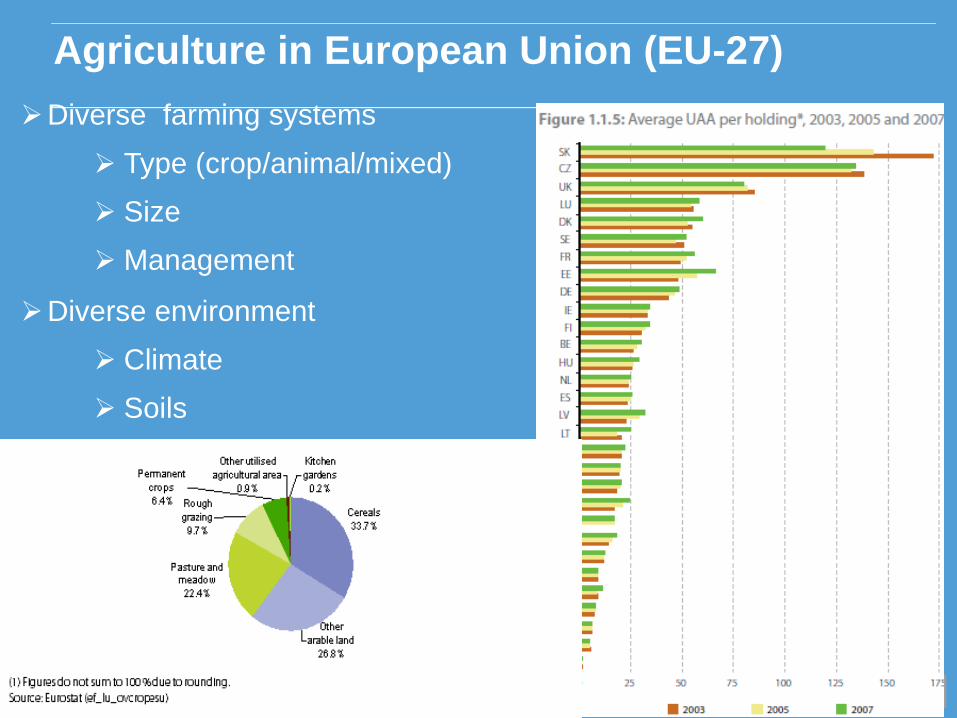
Agriculture in European Union (EU-27)
Diverse farming systems
Type (crop/animal/mixed)
Size
Management
Diverse environment
Climate
Soils
© Oene Oenema, Wageningen UR
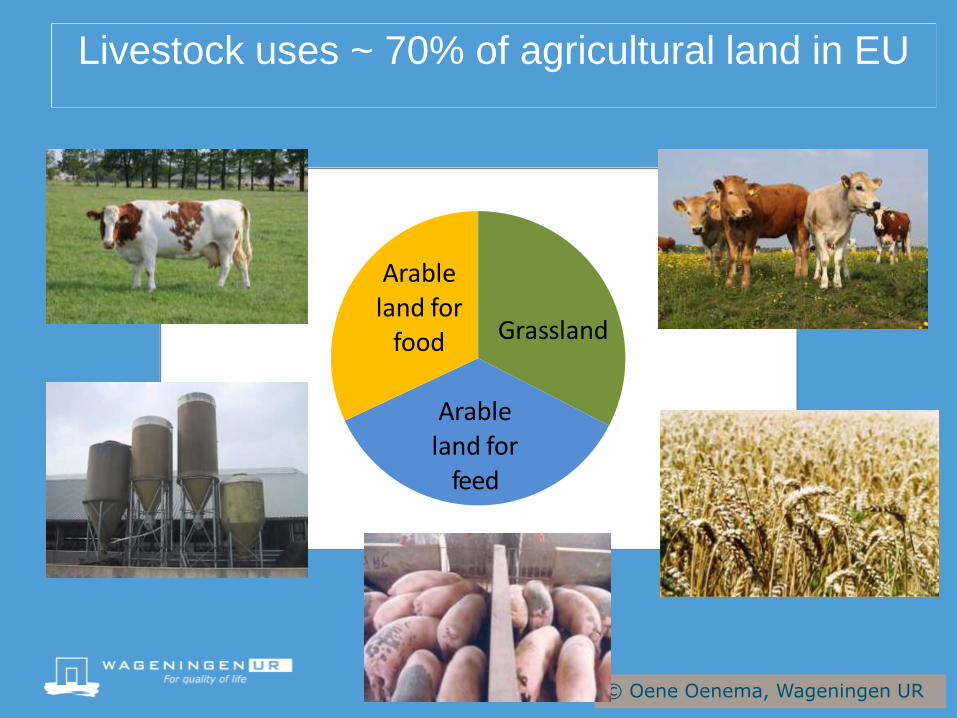
Livestock uses ~ 70% of agricultural land in EU
Grassland
Arable land for
feed
Arable land for
food
© Oene Oenema, Wageningen UR
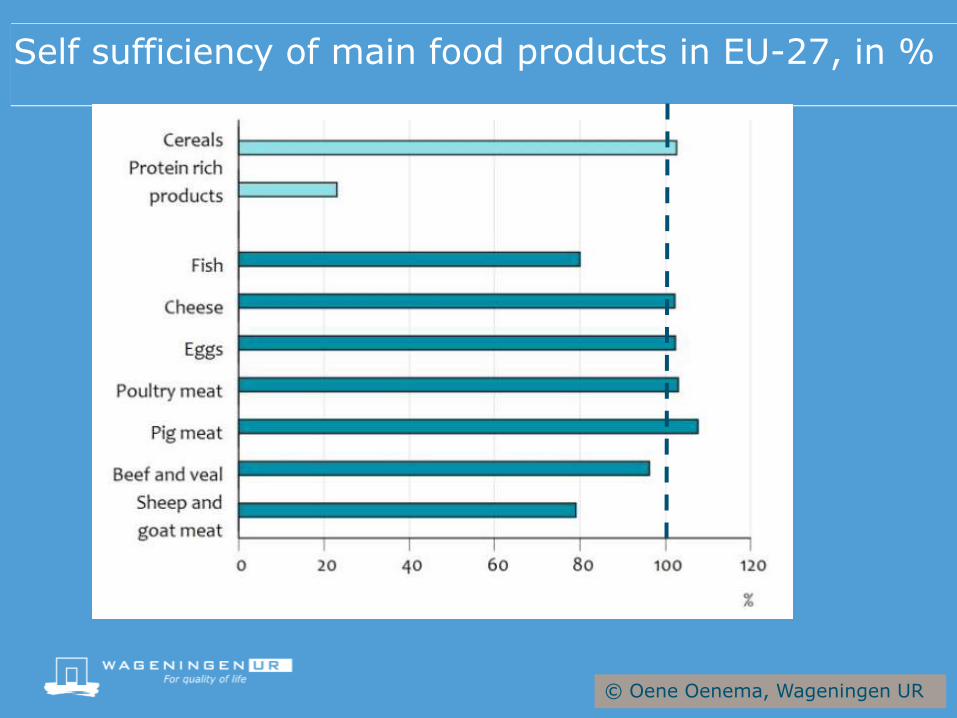
Self sufficiency of main food products in EU-27, in %
© Oene Oenema, Wageningen UR
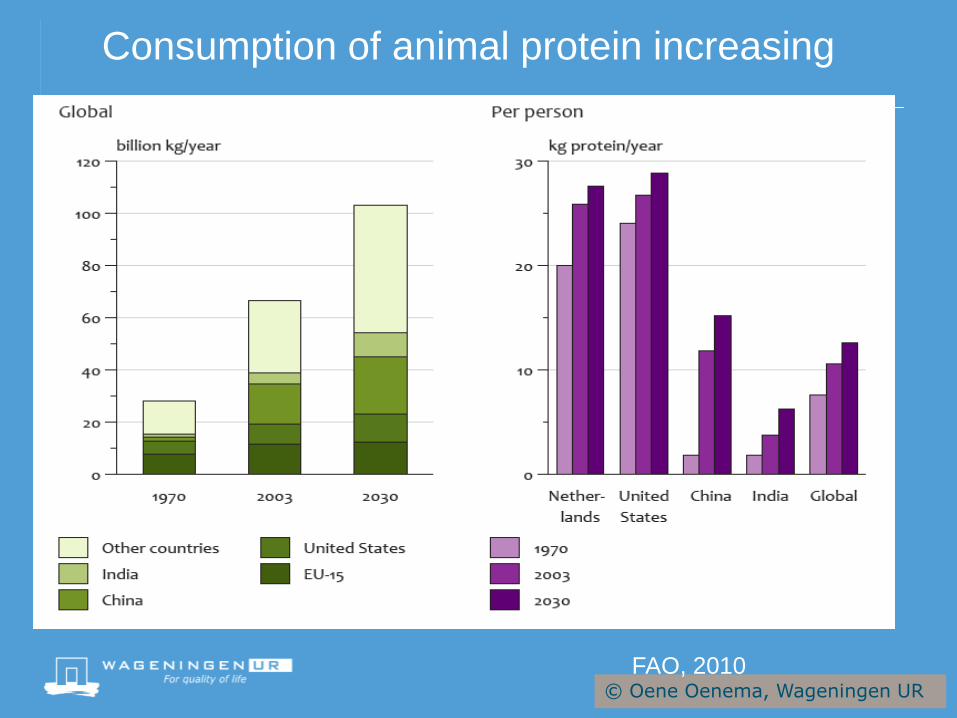
Consumption of animal protein increasing
FAO, 2010
© Oene Oenema, Wageningen UR
0
20
40
60
80
100
120
140
160
1960 1970 1980 1990 2000 2010
Sh
ee
p &
Go
at,
millio
n
0
20
40
60
80
100
120
1960 1970 1980 1990 2000 2010
Ca
ttle
, m
illio
n
0
20
40
60
80
100
120
140
160
180
1960 1970 1980 1990 2000 2010
Pig
s, m
illio
n
0
200
400
600
800
1000
1200
1400
1960 1970 1980 1990 2000 2010
Po
ult
ry
, m
illio
n
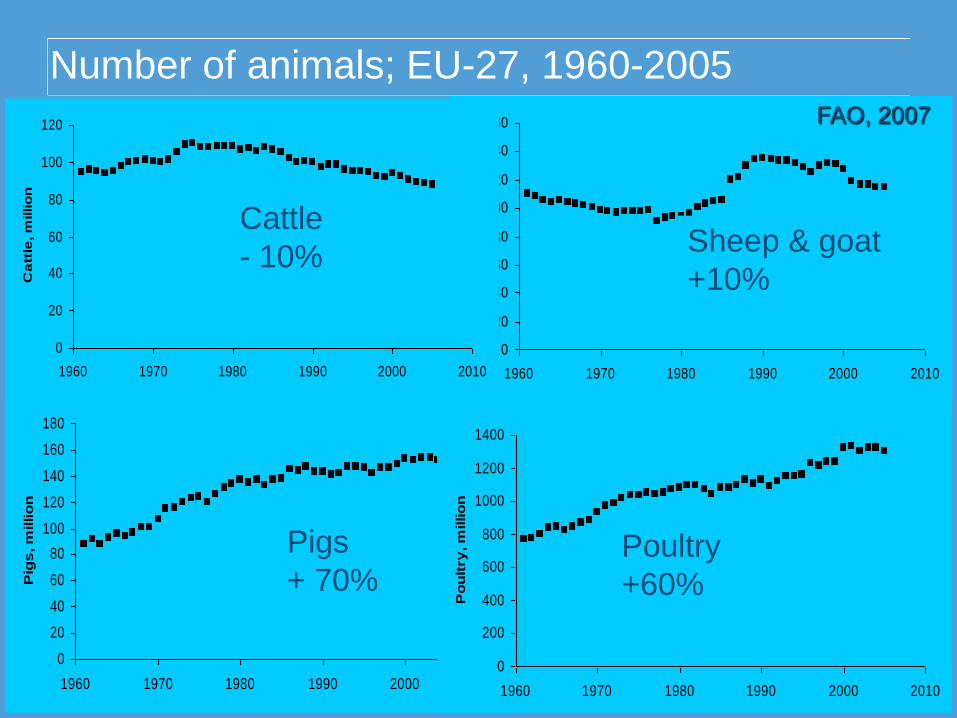
Cattle
- 10% Sheep & goat
+10%
Pigs
+ 70% Poultry
+60%
FAO, 2007
Number of animals; EU-27, 1960-2005
© Oene Oenema, Wageningen UR
0
2
4
6
8
10
12
14
16
18
1960 1970 1980 1990 2000 2010
Ch
ick
en
, b
illio
ns
0
200
400
600
800
1000
1200
1960 1970 1980 1990 2000 2010
Pig
s, m
illio
ns
0
200
400
600
800
1000
1200
1400
1600
1960 1970 1980 1990 2000 2010
ca
ttle
, m
illio
ns
0
200
400
600
800
1000
1200
1400
1600
1800
2000
1960 1970 1980 1990 2000 2010
Sh
ee
p, m
illio
n
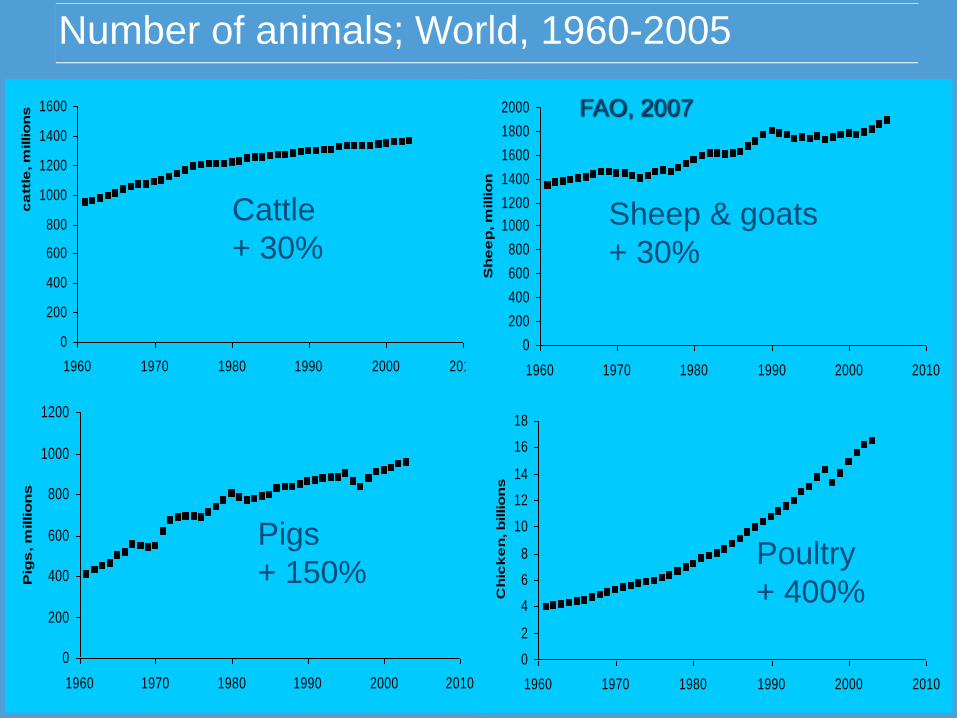
Cattle
+ 30%
Pigs
+ 150%
Sheep & goats
+ 30%
Poultry
+ 400%
FAO, 2007
Number of animals; World, 1960-2005
© Oene Oenema, Wageningen UR
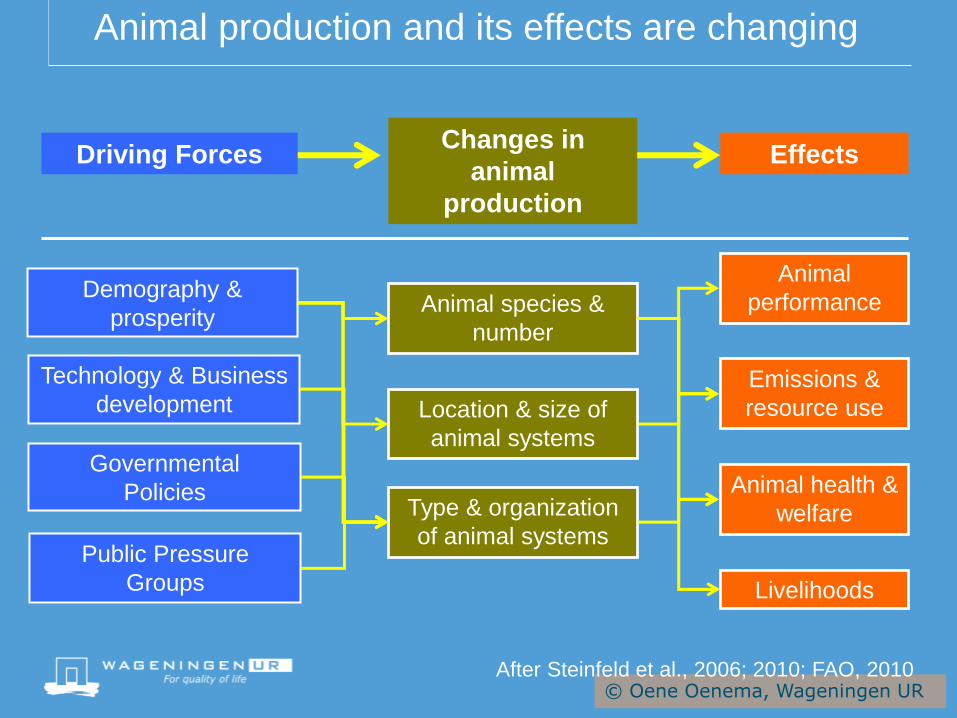
Animal production and its effects are changing
Demography &
prosperity
Technology & Business
development
Governmental
Policies
Public Pressure
Groups
Animal species &
number
Location & size of
animal systems
Type & organization
of animal systems
Animal
performance
Emissions &
resource use
Animal health &
welfare
Livelihoods
Driving Forces Changes in
animal
production
Effects
After Steinfeld et al., 2006; 2010; FAO, 2010
© Oene Oenema, Wageningen UR
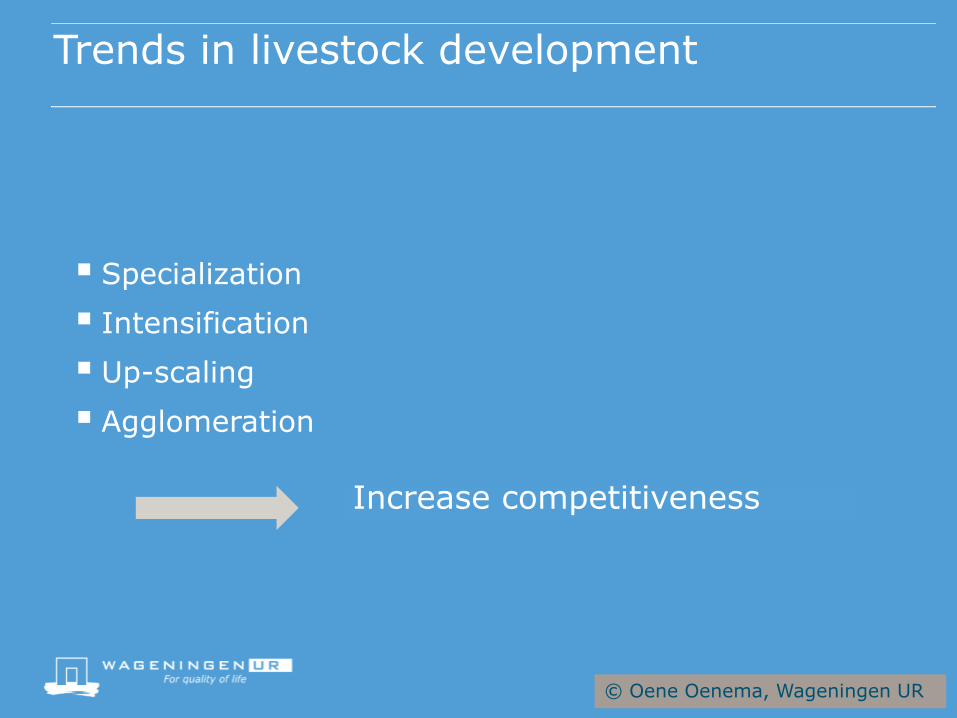
Trends in livestock development
Specialization
Intensification
Up-scaling
Agglomeration
Increase competitiveness
© Oene Oenema, Wageningen UR
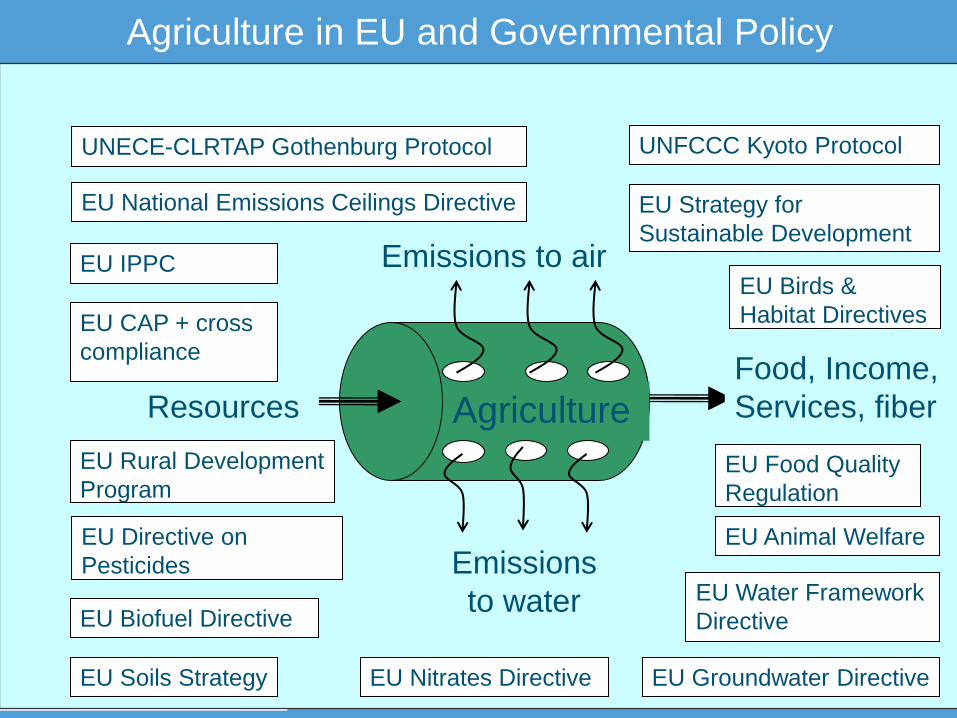
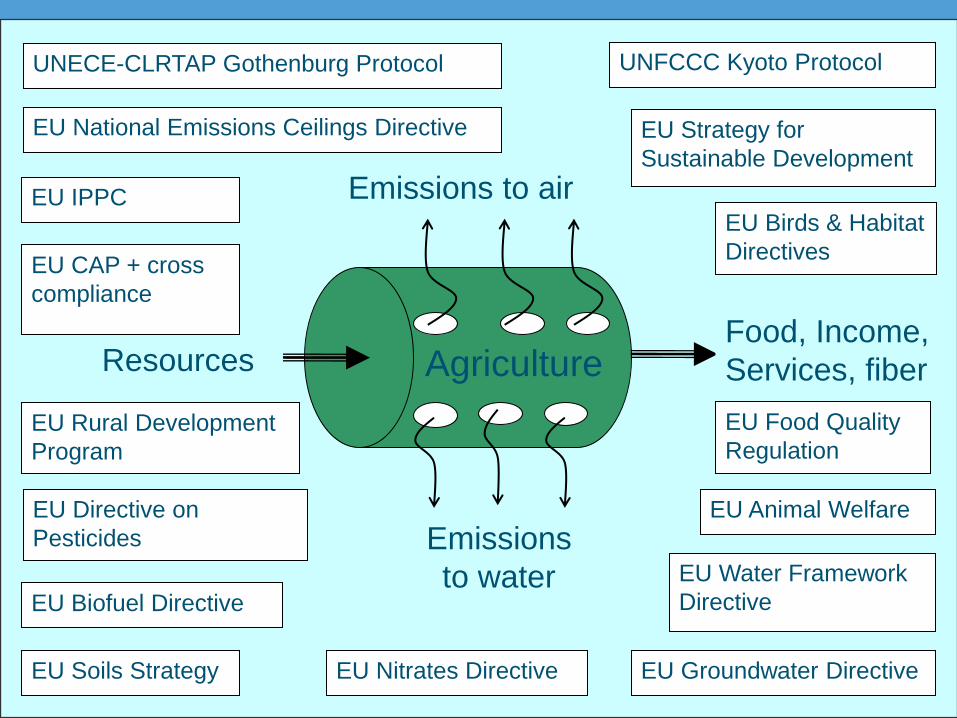
Agriculture Resources
Food, Income,
Services, fiber
Emissions to air
Emissions
to water
UNFCCC Kyoto Protocol UNECE-CLRTAP Gothenburg Protocol
EU National Emissions Ceilings Directive
EU IPPC
EU CAP + cross
compliance
EU Rural Development
Program
EU Water Framework
Directive
EU Nitrates Directive
EU Directive on
Pesticides
EU Strategy for
Sustainable Development
EU Birds &
Habitat Directives
EU Soils Strategy EU Groundwater Directive
EU Animal Welfare
EU Food Quality
Regulation
EU Biofuel Directive
Agriculture in EU and Governmental Policy
© Oene Oenema, Wageningen UR
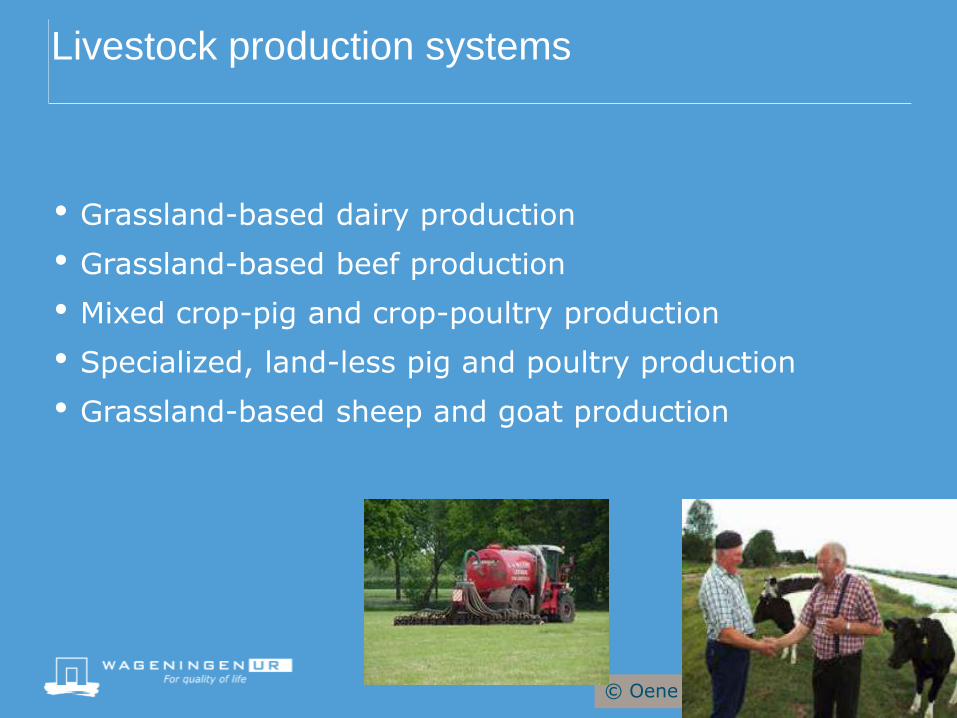
Livestock production systems
• Grassland-based dairy production
• Grassland-based beef production
• Mixed crop-pig and crop-poultry production
• Specialized, land-less pig and poultry production
• Grassland-based sheep and goat production
© Oene Oenema, Wageningen UR
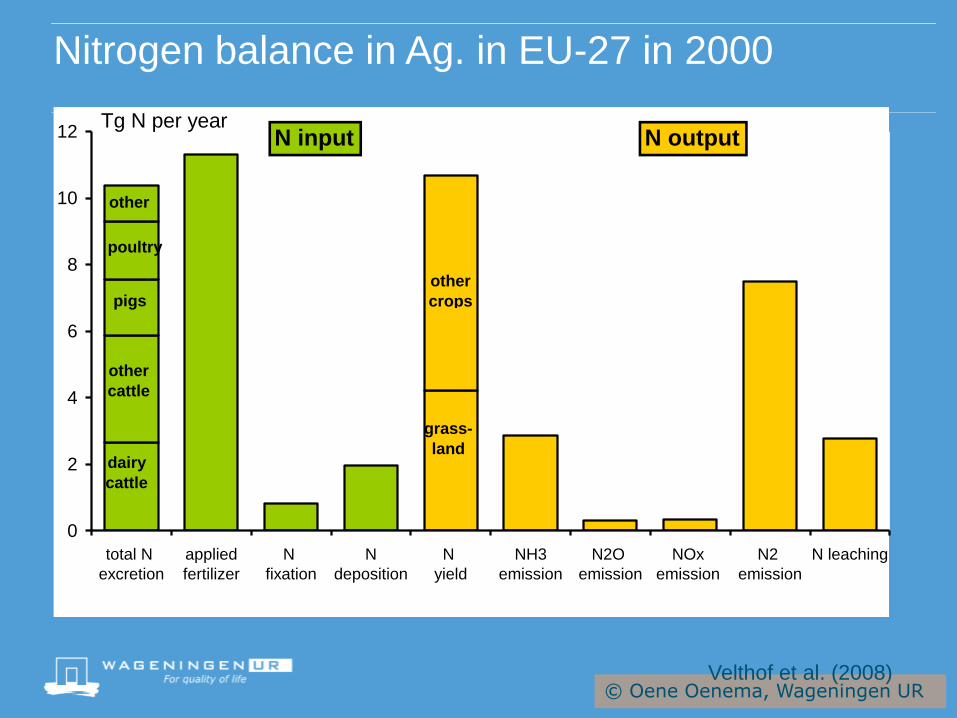
Nitrogen balance in Ag. in EU-27 in 2000
Velthof et al. (2008)
0
2
4
6
8
10
12
total N
excretion
applied
fertilizer
N
fixation
N
deposition
N
yield
NH3
emission
N2O
emission
NOx
emission
N2
emission
N leaching
Tg N per year
dairy
cattle
other
cattle
pigs
poultry
other
grass-
land
other
crops
N input N output
© Oene Oenema, Wageningen UR
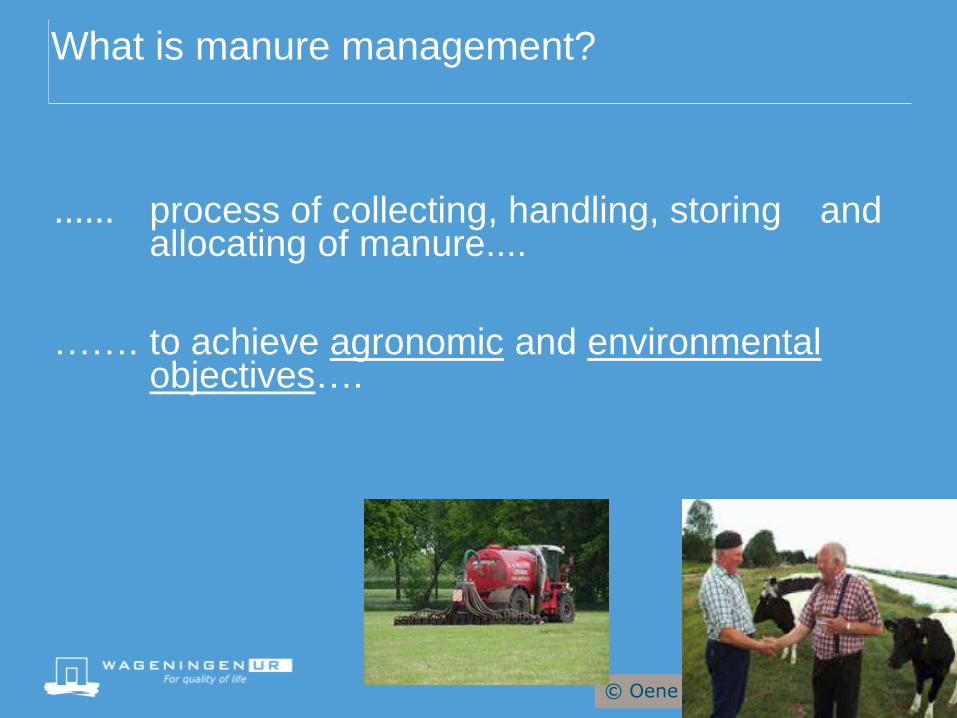
What is manure management?
…… process of collecting, handling, storing and allocating of manure....
……. to achieve agronomic and environmental objectives….
© Oene Oenema, Wageningen UR
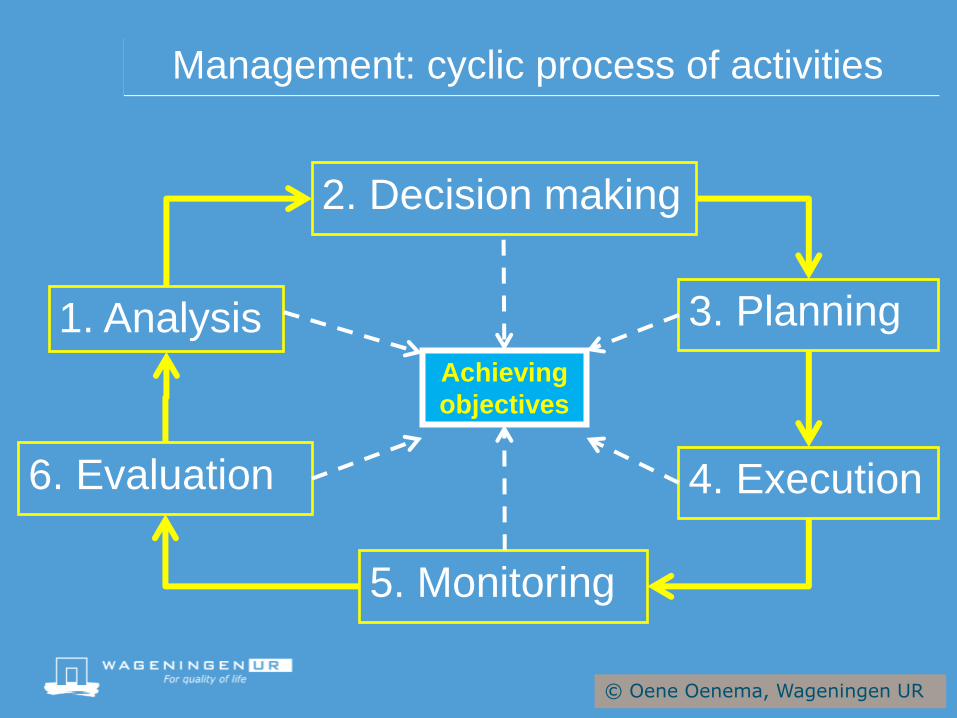
Management: cyclic process of activities
1. Analysis
2. Decision making
3. Planning
4. Execution
5. Monitoring
6. Evaluation
Achieving
objectives
© Oene Oenema, Wageningen UR
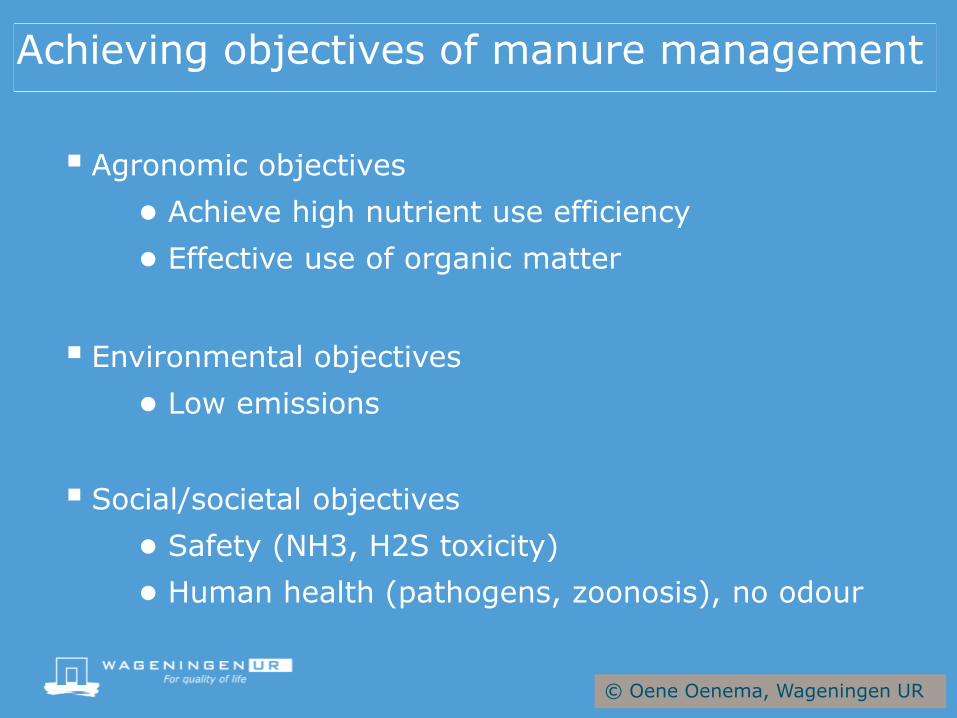
Achieving objectives of manure management
Agronomic objectives
● Achieve high nutrient use efficiency
● Effective use of organic matter
Environmental objectives
● Low emissions
Social/societal objectives
● Safety (NH3, H2S toxicity)
● Human health (pathogens, zoonosis), no odour
© Oene Oenema, Wageningen UR
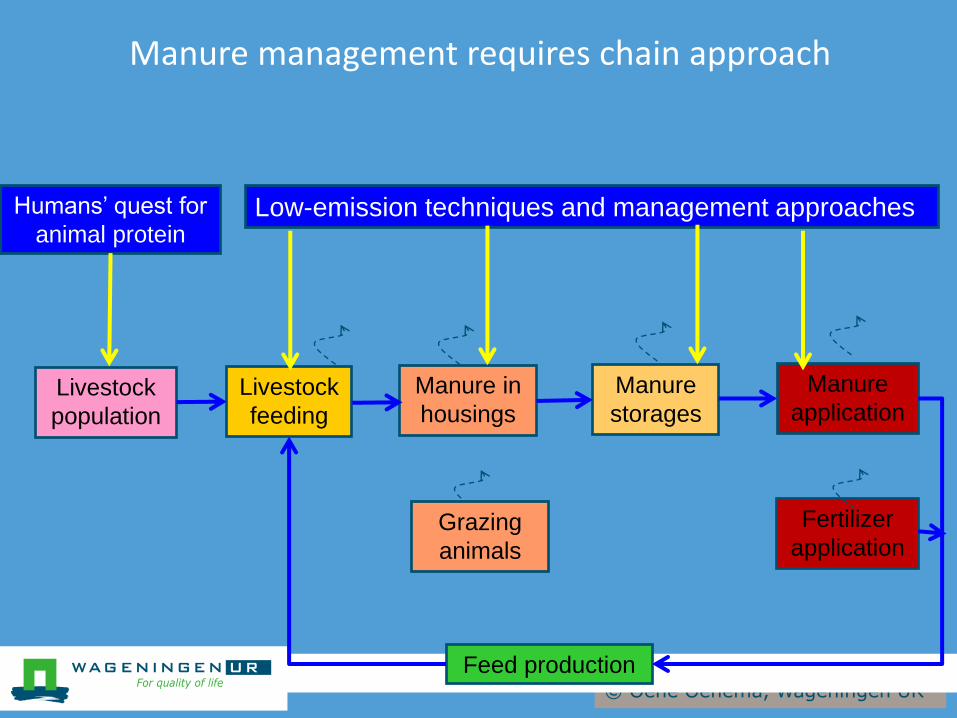
Livestock
population
Manure
application Livestock
feeding
Manure in
housings
Manure
storages
Fertilizer
application Grazing
animals
Humans’ quest for
animal protein Low-emission techniques and management approaches
Feed production
Manure management requires chain approach
© Oene Oenema, Wageningen UR
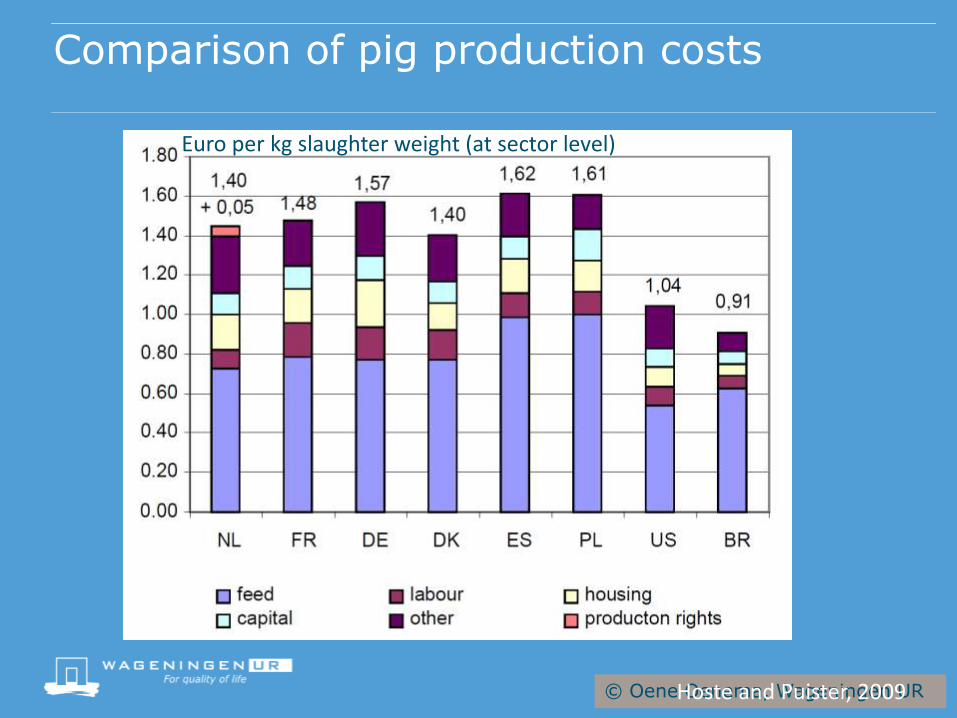
Comparison of pig production costs
Euro per kg slaughter weight (at sector level)
Hoste and Puister, 2009
© Oene Oenema, Wageningen UR
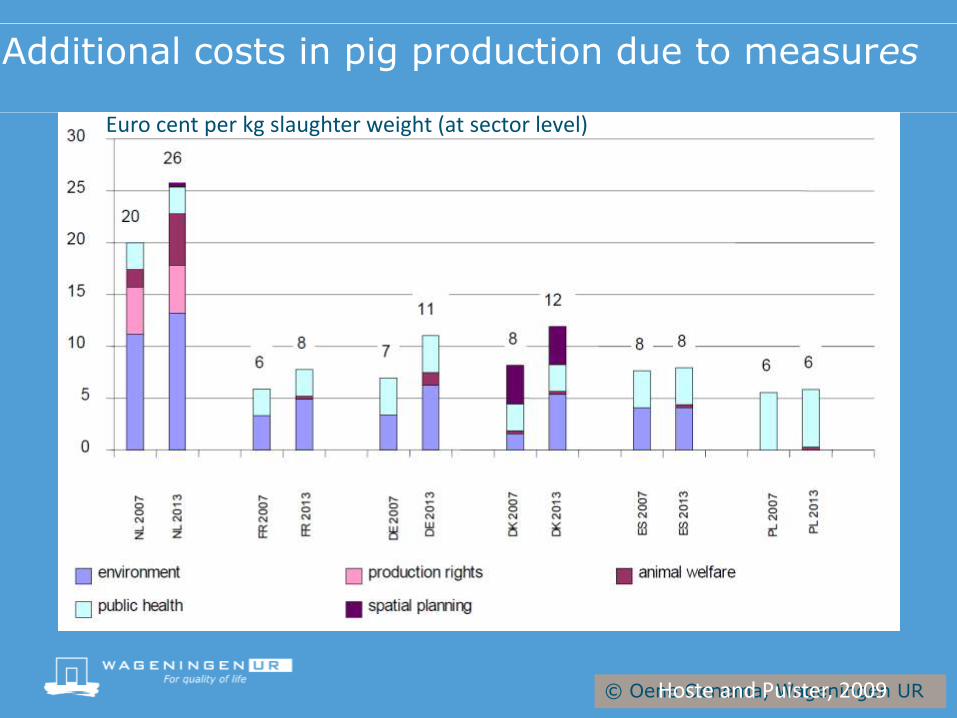
Additional costs in pig production due to measures
Euro cent per kg slaughter weight (at sector level)
Hoste and Puister, 2009
© Oene Oenema, Wageningen UR
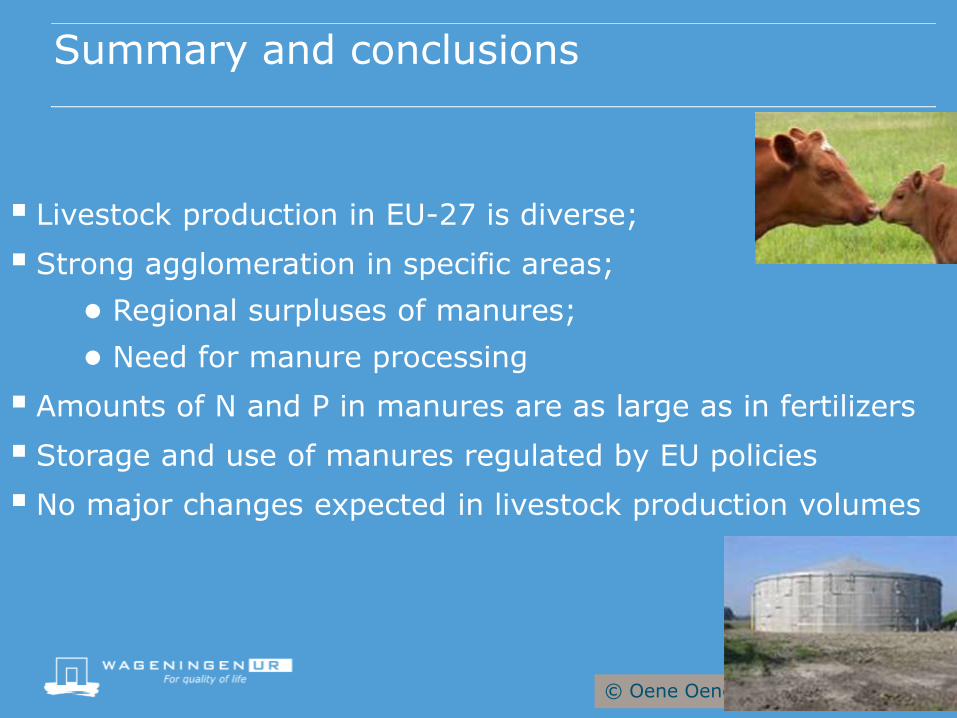
Summary and conclusions
Livestock production in EU-27 is diverse;
Strong agglomeration in specific areas;
● Regional surpluses of manures;
● Need for manure processing
Amounts of N and P in manures are as large as in fertilizers
Storage and use of manures regulated by EU policies
No major changes expected in livestock production volumes
© Oene Oenema, Wageningen UR
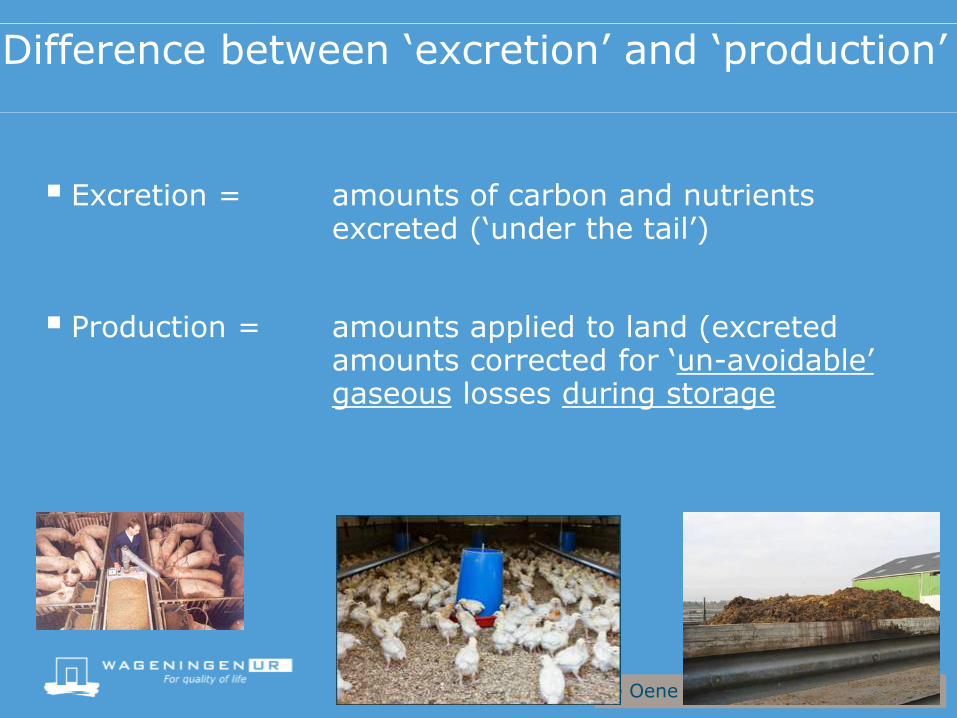
Difference between ‘excretion’ and ‘production’
Excretion = amounts of carbon and nutrients excreted (‘under the tail’)
Production = amounts applied to land (excreted amounts corrected for ‘un-avoidable’ gaseous losses during storage
© Oene Oenema, Wageningen UR
Calculation of nutrient excretion
Basic formula:
Nutrient excretion = nutrient intake – nutrients in marketable animal products,
where, ‘marketable’ products = milk, meat, egg, wool
© Oene Oenema, Wageningen UR
Management measures & manure excretion
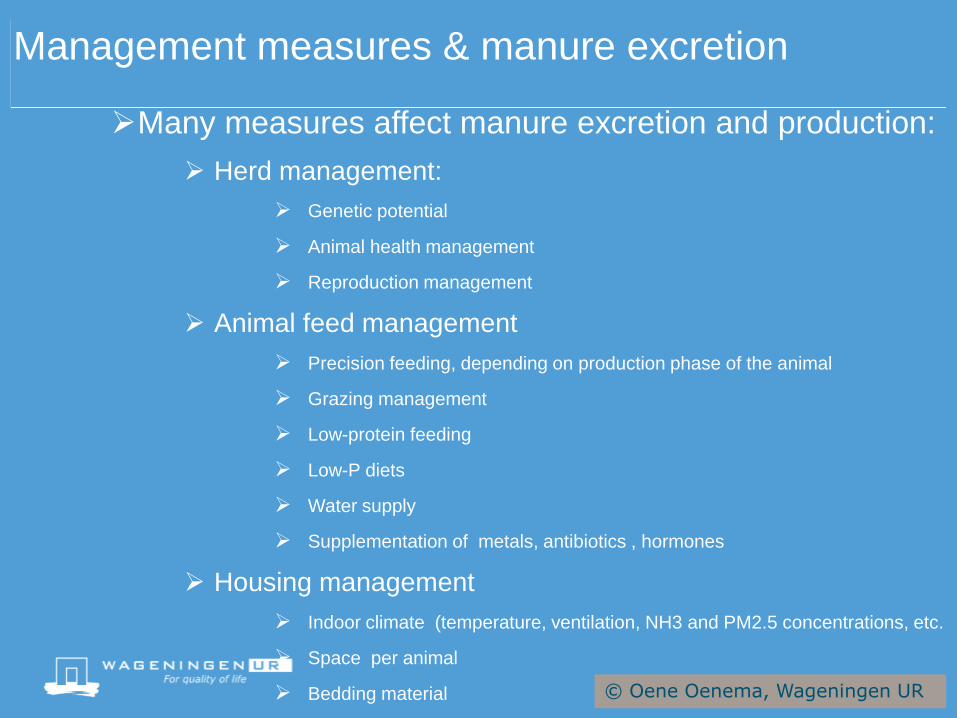
Many measures affect manure excretion and production:
Herd management:
Genetic potential
Animal health management
Reproduction management
Animal feed management
Precision feeding, depending on production phase of the animal
Grazing management
Low-protein feeding
Low-P diets
Water supply
Supplementation of metals, antibiotics , hormones
Housing management
Indoor climate (temperature, ventilation, NH3 and PM2.5 concentrations, etc.
Space per animal
Bedding material
© Oene Oenema, Wageningen UR
Manure management
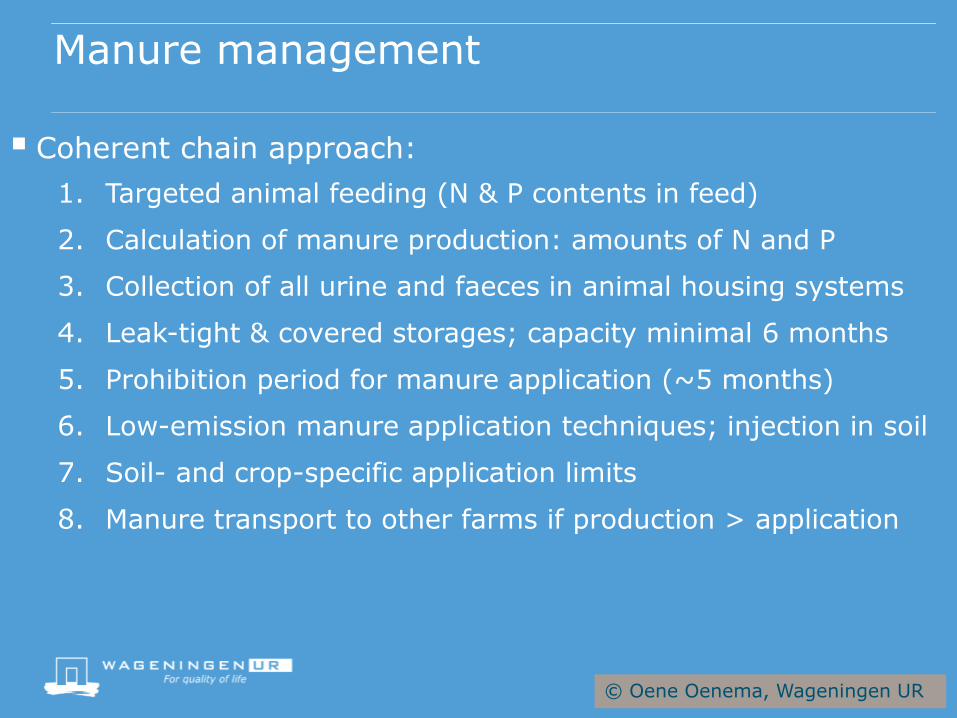
Coherent chain approach:
1. Targeted animal feeding (N & P contents in feed)
2. Calculation of manure production: amounts of N and P
3. Collection of all urine and faeces in animal housing systems
4. Leak-tight & covered storages; capacity minimal 6 months
5. Prohibition period for manure application (~5 months)
6. Low-emission manure application techniques; injection in soil
7. Soil- and crop-specific application limits
8. Manure transport to other farms if production > application
© Oene Oenema, Wageningen UR
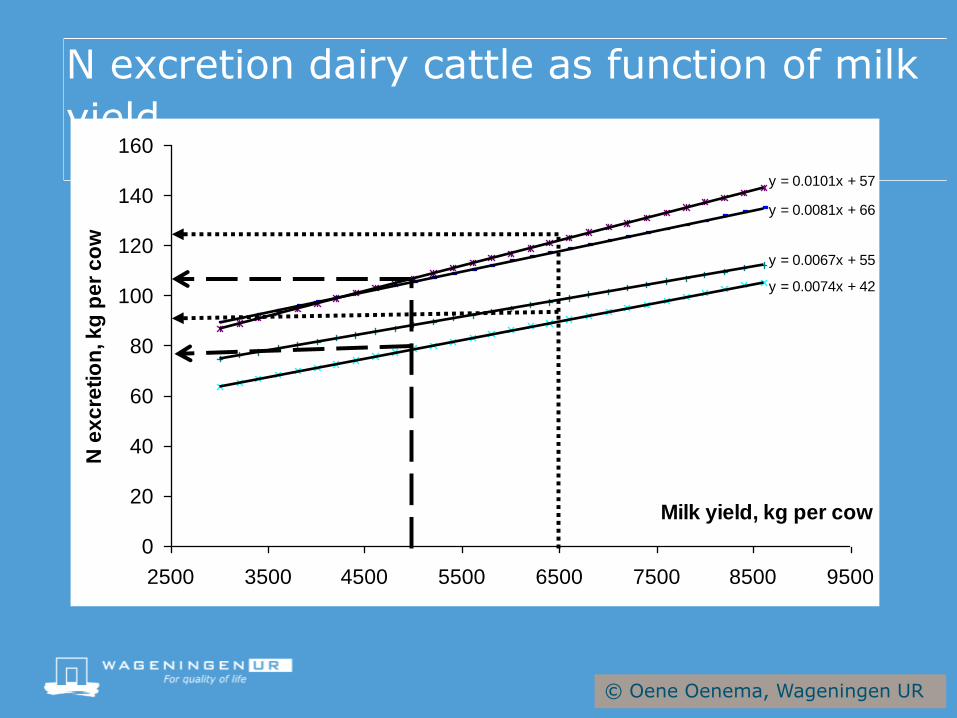
Simple formula for feed requirements dairy cattle
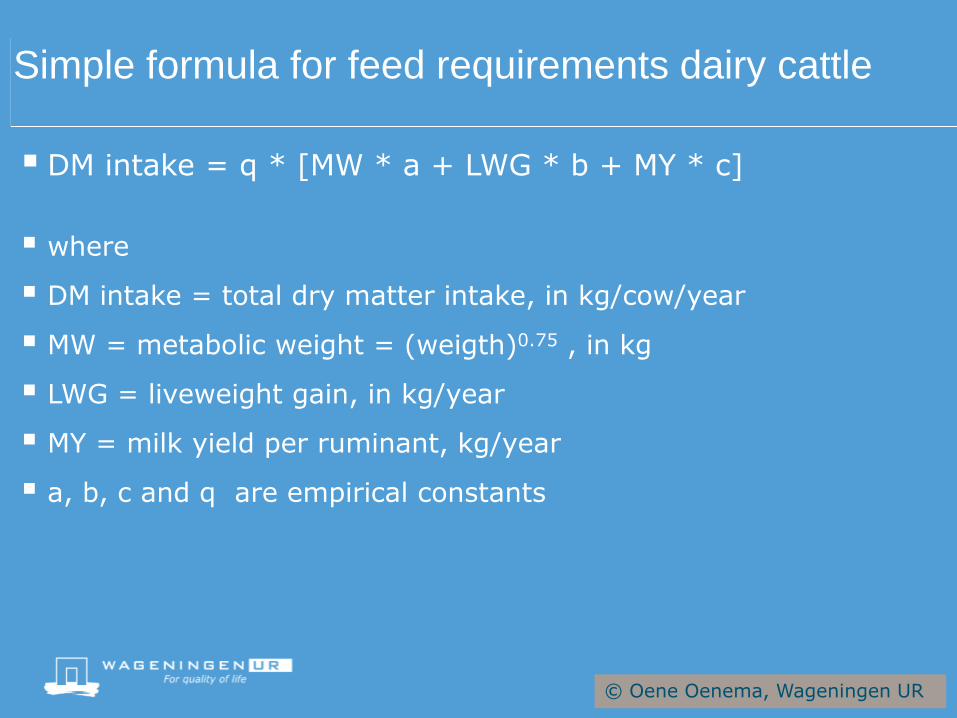
DM intake = q * [MW * a + LWG * b + MY * c]
where
DM intake = total dry matter intake, in kg/cow/year
MW = metabolic weight = (weigth)0.75 , in kg
LWG = liveweight gain, in kg/year
MY = milk yield per ruminant, kg/year
a, b, c and q are empirical constants
© Oene Oenema, Wageningen UR
N excretion dairy cattle as function of milk
yield
y = 0.0101x + 57
y = 0.0081x + 66
y = 0.0074x + 42
y = 0.0067x + 55
0
20
40
60
80
100
120
140
160
2500 3500 4500 5500 6500 7500 8500 9500
Milk yield, kg per cow
N e
xc
reti
on
, k
g p
er
co
w
© Oene Oenema, Wageningen UR
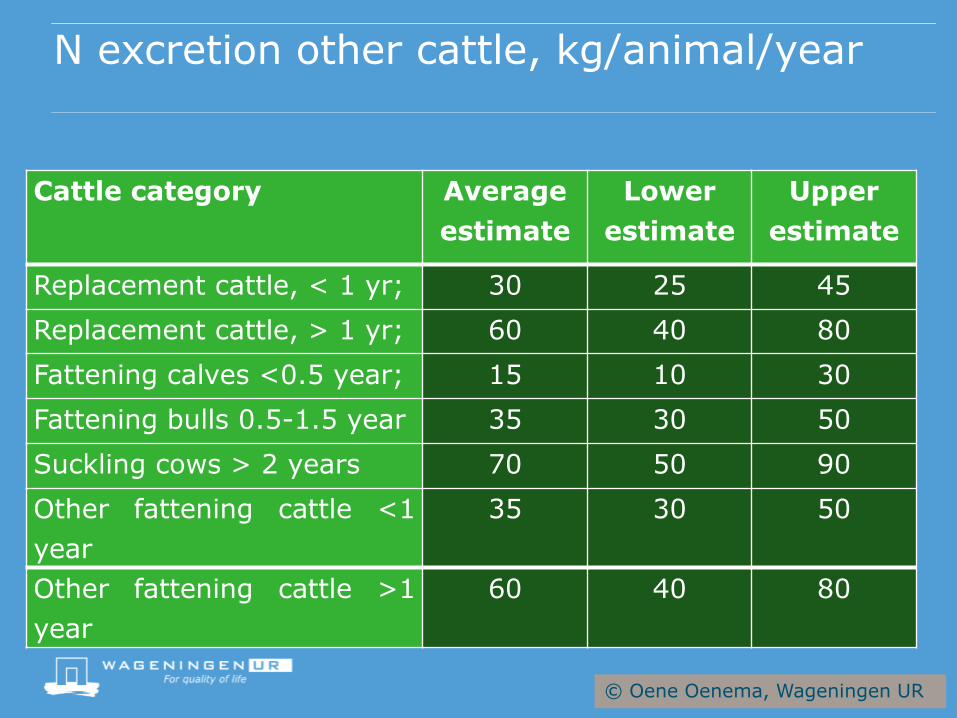
N excretion other cattle, kg/animal/year
Cattle category Average
estimate
Lower
estimate
Upper
estimate
Replacement cattle, < 1 yr; 30 25 45
Replacement cattle, > 1 yr; 60 40 80
Fattening calves <0.5 year; 15 10 30
Fattening bulls 0.5-1.5 year 35 30 50
Suckling cows > 2 years 70 50 90
Other fattening cattle <1
year
35 30 50
Other fattening cattle >1
year
60 40 80
© Oene Oenema, Wageningen UR
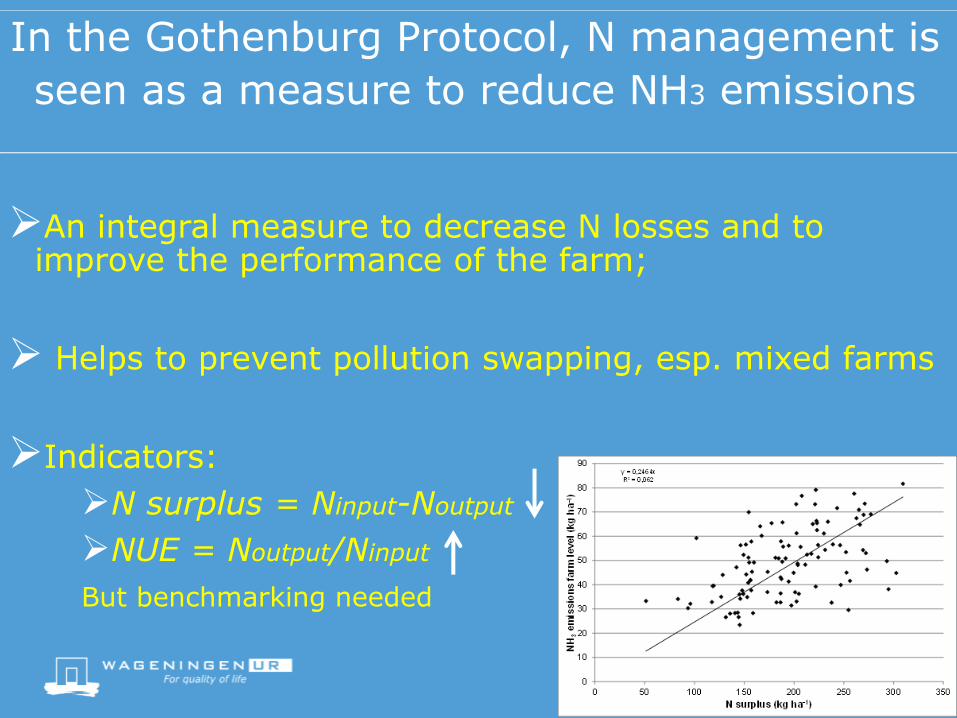
In the Gothenburg Protocol, N management is
seen as a measure to reduce NH3 emissions
An integral measure to decrease N losses and to improve the performance of the farm;
Helps to prevent pollution swapping, esp. mixed farms
Indicators:
N surplus = Ninput-Noutput
NUE = Noutput/Ninput
But benchmarking needed
© Oene Oenema, Wageningen UR
Conclusions (i)
Little empirical information about cost of N management;
Cost of N management tend to go down over time;
Cost-effectiveness largest on large farms;
Indirect effects appear significant.
More studies needed!!
© Oene Oenema, Wageningen UR
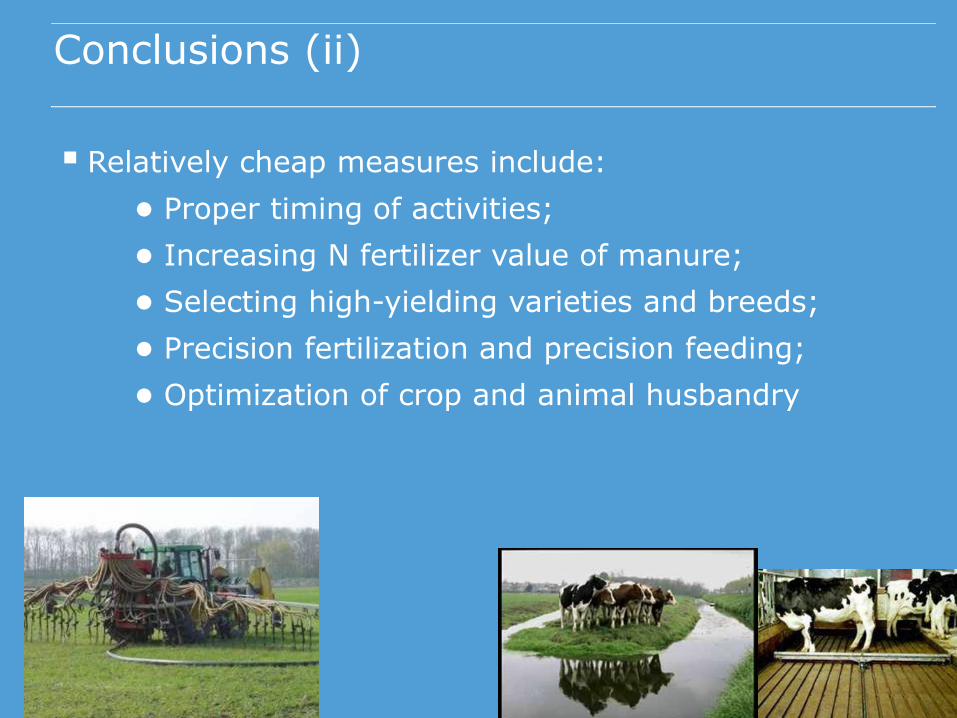
Conclusions (ii)
Relatively cheap measures include:
● Proper timing of activities;
● Increasing N fertilizer value of manure;
● Selecting high-yielding varieties and breeds;
● Precision fertilization and precision feeding;
● Optimization of crop and animal husbandry
© Oene Oenema, Wageningen UR
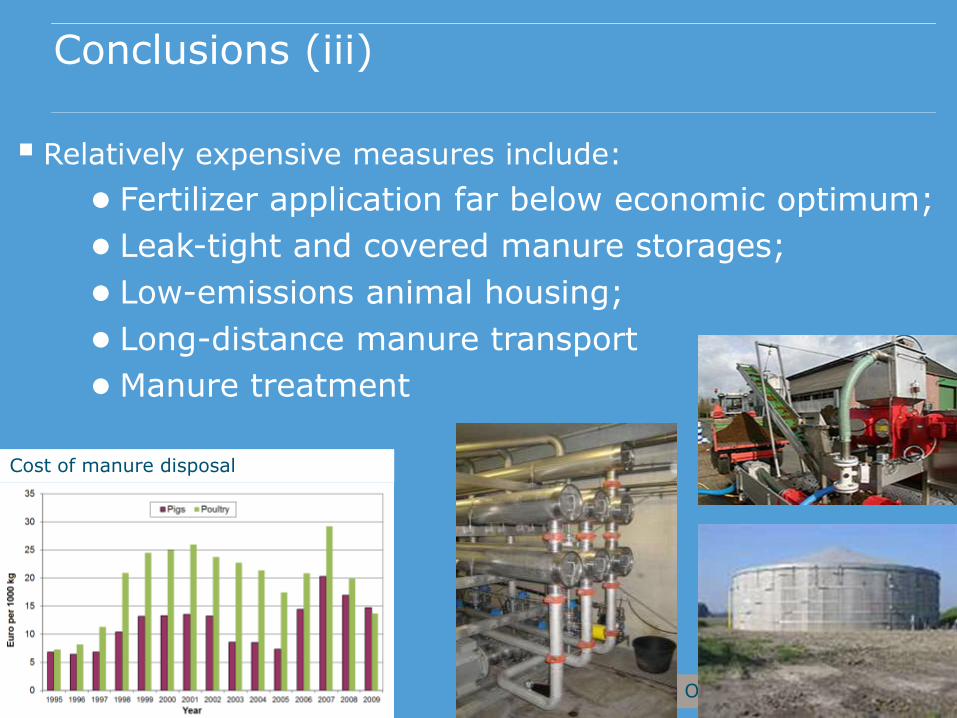
Conclusions (iii)
Relatively expensive measures include:
● Fertilizer application far below economic optimum;
● Leak-tight and covered manure storages;
● Low-emissions animal housing;
● Long-distance manure transport
● Manure treatment
Cost of manure disposal

© Oene Oenema, Wageningen UR
Questions?
Thank you!
© Oene Oenema, Wageningen UR
Questions?
Thank you!
© Oene Oenema, Wageningen UR
Agriculture Resources Food, Income,
Services, fiber
Emissions to air
Emissions
to water
UNFCCC Kyoto Protocol UNECE-CLRTAP Gothenburg Protocol
EU National Emissions Ceilings Directive
EU IPPC
EU CAP + cross
compliance
EU Rural Development
Program
EU Water Framework
Directive
EU Nitrates Directive
EU Directive on
Pesticides
EU Strategy for
Sustainable Development
EU Birds & Habitat
Directives
EU Soils Strategy EU Groundwater Directive
EU Animal Welfare
EU Food Quality
Regulation
EU Biofuel Directive


![filevoddeJ el suep sequuop sap spnuue seldwoo sel oene aouepnouoo el el nd suone,u snou 'voddea ep elep el uo!lseô ep vodde] el nåê] sed lueÃe,u enb SUOleUÔ!S snoA snou '101 el](https://img.pdfslide.us/doc/110x75/5d3ac77f88c99322128d4d76/el-suep-sequuop-sap-spnuue-seldwoo-sel-oene-aouepnouoo-el-el-nd-suoneu-snou-voddea.jpg)


![fileOepowwoo) sap Jed sqqelêAnouêJ uou sue!q -Ins suonuenqns ep sueoa sunaoueug ep snos smns?ð suoneuop sôaq suoddv asuda] ap oene spuog ep neennou vodau ap sveoa (salqelêAnoueJ](https://img.pdfslide.us/doc/110x75/5d3ac77f88c99322128d4d71/sap-jed-sqqeleanouej-uou-sueq-ins-suonuenqns-ep-sueoa-sunaoueug-ep-snos-smnsd.jpg)