Embed Size (px)
Citation preview
Nicholas Institute for Environmental Policy SolutionsNI R 14-03 Supplemental Paper 2
March 2014
Assessing Potential Impacts of Livestock Management on Groundwater
Thomas Harter Giorgos Kourakos
Katherine Lockhart
Acknowledgments This supplemental paper was solicited and produced in support of “Refining Models for Quantifying the Water Quality Benefits of Improved Animal Management for Use in Water Quality Trading,” which was
prepared with support from the U.S. Department of Agriculture, Office of Environmental Markets.
How to cite this reportThomas Harter, Giorgos Kourakos, and Katherine Lockhart. 2014. Assessing Potential Impacts of
Livestock Management on Groundwater. NI R 14-03 Supplemental Paper 2. Durham, NC: Duke University.
Department of Land, Air, and Water Resources, University of California, Davis
2
ABSTRACT This supplemental paper provides a brief review of the potential for groundwater pollution from animal feeding operations (AFOs). Management activities that address surface water quality may reduce nutrient loads, but they may also lead to a deterioration of groundwater quality as well as additional methane emissions. Groundwater pollutants may eventually compromise surface water quality when a portion of the groundwater returns to the stream as baseflow. These cross-media effects are important to consider within a holistic review of the sustainability of AFO measures. We outline the potential risk of groundwater quality degradation from proposals to improve surface water quality. A review of methods to quantify the potential damage to groundwater from surface water programs indicates such research would require significant groundwater monitoring and a coupling of the findings with integrated assessment and models. We discuss methods of monitoring groundwater discharge from AFOs, including discharge from associated croplands receiving manure applications. We also summarize modeling tools used to assess the impact of management measures on groundwater quality. Our findings indicate that appropriate models exist to simulate the pollutant source, to simulate processes within the root zone and in the unsaturated zone below the root zone, and to assess transport in groundwater discharging into wells, streams, and springs. Research on the integration of these models—coupling source systems with root zone/unsaturated zone pollutant fate and transport models, with groundwater models, and with surface water models—is not as well defined. This report shows an overwhelming lack of groundwater-related data on the effects of management practices in animal operations, including nutrient management practices in crops involving manure applications. Significant additional regulatory, funding, programmatic, and research resources are needed at the federal level to address groundwater-quality concerns.
3
CONTENTS UNDERSTANDING GROUNDWATER POLLUTION IN ANIMAL FEEDING OPERATIONS ................ 4
Animal Holding Areas .............................................................................................................................. 4 Liquid Manure Storage Lagoons .............................................................................................................. 6 Manure Treated Cropland ....................................................................................................................... 8
MANAGING GROUNDWATER POLLUTION IN ANIMAL FEEDING OPERATIONS ......................... 8 MONITORING GROUNDWATER POLLUTION IN ANIMAL FEEDING OPERATIONS .................... 10 MODELING GROUNDWATER POLLUTION FROM ANIMAL FEEDING OPERATIONS .................. 11 UNCERTAINTY IN ASSESSING RELATIVE CHANGES IN GROUNDWATER QUALITY DUE TO CHANGES IN MANAGEMENT PRACTICES ............................................................................... 13 CONCLUSION ........................................................................................................................ 14 REFERENCES ......................................................................................................................... 16
4
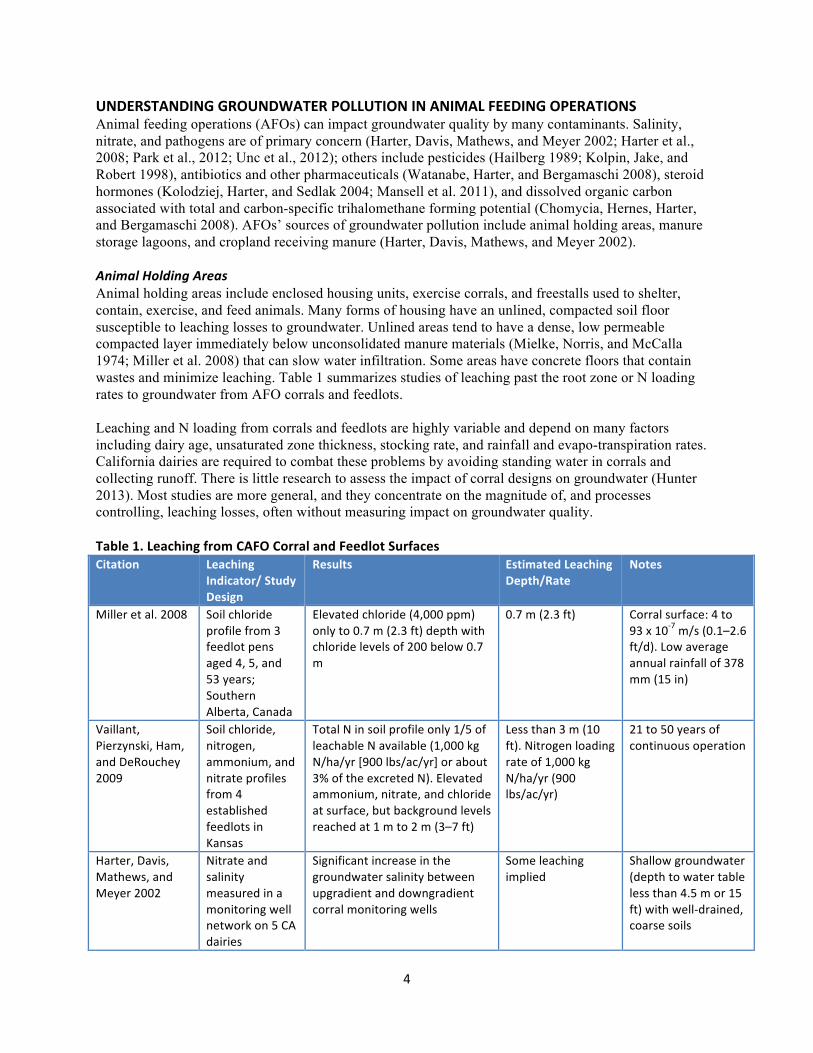
UNDERSTANDING GROUNDWATER POLLUTION IN ANIMAL FEEDING OPERATIONS Animal feeding operations (AFOs) can impact groundwater quality by many contaminants. Salinity, nitrate, and pathogens are of primary concern (Harter, Davis, Mathews, and Meyer 2002; Harter et al., 2008; Park et al., 2012; Unc et al., 2012); others include pesticides (Hailberg 1989; Kolpin, Jake, and Robert 1998), antibiotics and other pharmaceuticals (Watanabe, Harter, and Bergamaschi 2008), steroid hormones (Kolodziej, Harter, and Sedlak 2004; Mansell et al. 2011), and dissolved organic carbon associated with total and carbon-specific trihalomethane forming potential (Chomycia, Hernes, Harter, and Bergamaschi 2008). AFOs’ sources of groundwater pollution include animal holding areas, manure storage lagoons, and cropland receiving manure (Harter, Davis, Mathews, and Meyer 2002). Animal Holding Areas Animal holding areas include enclosed housing units, exercise corrals, and freestalls used to shelter, contain, exercise, and feed animals. Many forms of housing have an unlined, compacted soil floor susceptible to leaching losses to groundwater. Unlined areas tend to have a dense, low permeable compacted layer immediately below unconsolidated manure materials (Mielke, Norris, and McCalla 1974; Miller et al. 2008) that can slow water infiltration. Some areas have concrete floors that contain wastes and minimize leaching. Table 1 summarizes studies of leaching past the root zone or N loading rates to groundwater from AFO corrals and feedlots. Leaching and N loading from corrals and feedlots are highly variable and depend on many factors including dairy age, unsaturated zone thickness, stocking rate, and rainfall and evapo-transpiration rates. California dairies are required to combat these problems by avoiding standing water in corrals and collecting runoff. There is little research to assess the impact of corral designs on groundwater (Hunter 2013). Most studies are more general, and they concentrate on the magnitude of, and processes controlling, leaching losses, often without measuring impact on groundwater quality. Table 1. Leaching from CAFO Corral and Feedlot Surfaces Citation Leaching
Indicator/ Study Design
Results Estimated Leaching Depth/Rate
Notes
Miller et al. 2008 Soil chloride profile from 3 feedlot pens aged 4, 5, and 53 years; Southern Alberta, Canada
Elevated chloride (4,000 ppm) only to 0.7 m (2.3 ft) depth with chloride levels of 200 below 0.7 m
0.7 m (2.3 ft) Corral surface: 4 to 93 x 10-‐7 m/s (0.1–2.6 ft/d). Low average annual rainfall of 378 mm (15 in)
Vaillant, Pierzynski, Ham, and DeRouchey 2009
Soil chloride, nitrogen, ammonium, and nitrate profiles from 4 established feedlots in Kansas
Total N in soil profile only 1/5 of leachable N available (1,000 kg N/ha/yr [900 lbs/ac/yr] or about 3% of the excreted N). Elevated ammonium, nitrate, and chloride at surface, but background levels reached at 1 m to 2 m (3–7 ft)
Less than 3 m (10 ft). Nitrogen loading rate of 1,000 kg N/ha/yr (900 lbs/ac/yr)
21 to 50 years of continuous operation
Harter, Davis, Mathews, and Meyer 2002
Nitrate and salinity measured in a monitoring well network on 5 CA dairies
Significant increase in the groundwater salinity between upgradient and downgradient corral monitoring wells
Some leaching implied
Shallow groundwater (depth to water table less than 4.5 m or 15 ft) with well-‐drained, coarse soils
5
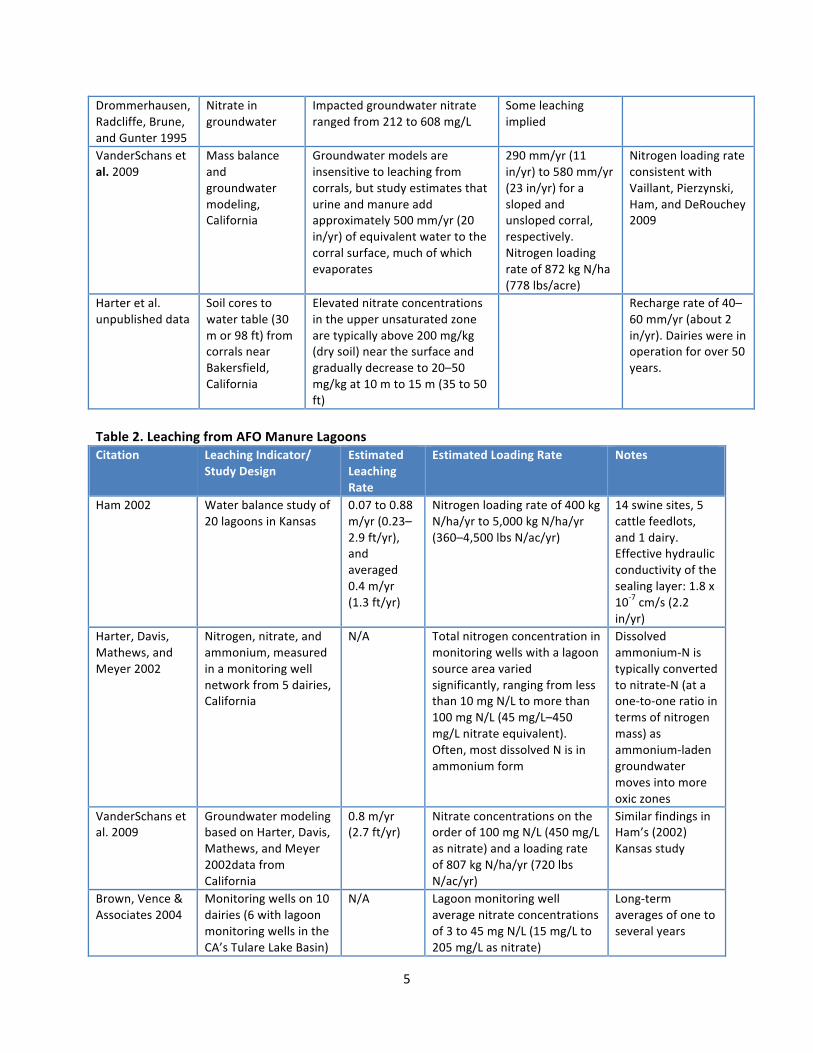
Drommerhausen, Radcliffe, Brune, and Gunter 1995
Nitrate in groundwater
Impacted groundwater nitrate ranged from 212 to 608 mg/L
Some leaching implied
VanderSchans et al. 2009
Mass balance and groundwater modeling, California
Groundwater models are insensitive to leaching from corrals, but study estimates that urine and manure add approximately 500 mm/yr (20 in/yr) of equivalent water to the corral surface, much of which evaporates
290 mm/yr (11 in/yr) to 580 mm/yr (23 in/yr) for a sloped and unsloped corral, respectively. Nitrogen loading rate of 872 kg N/ha (778 lbs/acre)
Nitrogen loading rate consistent with Vaillant, Pierzynski, Ham, and DeRouchey 2009
Harter et al. unpublished data
Soil cores to water table (30 m or 98 ft) from corrals near Bakersfield, California
Elevated nitrate concentrations in the upper unsaturated zone are typically above 200 mg/kg (dry soil) near the surface and gradually decrease to 20–50 mg/kg at 10 m to 15 m (35 to 50 ft)
Recharge rate of 40–60 mm/yr (about 2 in/yr). Dairies were in operation for over 50 years.
Table 2. Leaching from AFO Manure Lagoons Citation Leaching Indicator/
Study Design Estimated Leaching Rate
Estimated Loading Rate Notes
Ham 2002 Water balance study of 20 lagoons in Kansas
0.07 to 0.88 m/yr (0.23–2.9 ft/yr), and averaged 0.4 m/yr (1.3 ft/yr)
Nitrogen loading rate of 400 kg N/ha/yr to 5,000 kg N/ha/yr (360–4,500 lbs N/ac/yr)
14 swine sites, 5 cattle feedlots, and 1 dairy. Effective hydraulic conductivity of the sealing layer: 1.8 x 10-‐7 cm/s (2.2 in/yr)
Harter, Davis, Mathews, and Meyer 2002
Nitrogen, nitrate, and ammonium, measured in a monitoring well network from 5 dairies, California
N/A Total nitrogen concentration in monitoring wells with a lagoon source area varied significantly, ranging from less than 10 mg N/L to more than 100 mg N/L (45 mg/L–450 mg/L nitrate equivalent). Often, most dissolved N is in ammonium form
Dissolved ammonium-‐N is typically converted to nitrate-‐N (at a one-‐to-‐one ratio in terms of nitrogen mass) as ammonium-‐laden groundwater moves into more oxic zones
VanderSchans et al. 2009
Groundwater modeling based on Harter, Davis, Mathews, and Meyer 2002data from California
0.8 m/yr (2.7 ft/yr)
Nitrate concentrations on the order of 100 mg N/L (450 mg/L as nitrate) and a loading rate of 807 kg N/ha/yr (720 lbs N/ac/yr)
Similar findings in Ham’s (2002) Kansas study
Brown, Vence & Associates 2004
Monitoring wells on 10 dairies (6 with lagoon monitoring wells in the CA’s Tulare Lake Basin)
N/A Lagoon monitoring well average nitrate concentrations of 3 to 45 mg N/L (15 mg/L to 205 mg/L as nitrate)
Long-‐term averages of one to several years
6
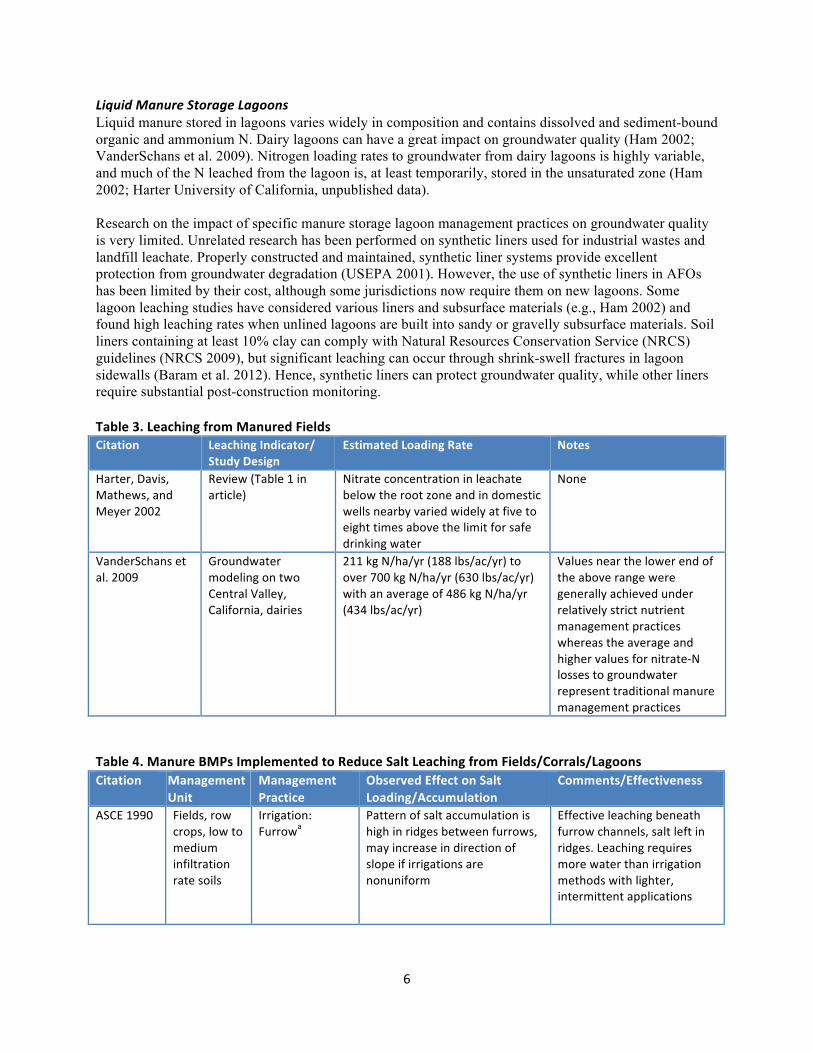
Liquid Manure Storage Lagoons Liquid manure stored in lagoons varies widely in composition and contains dissolved and sediment-bound organic and ammonium N. Dairy lagoons can have a great impact on groundwater quality (Ham 2002; VanderSchans et al. 2009). Nitrogen loading rates to groundwater from dairy lagoons is highly variable, and much of the N leached from the lagoon is, at least temporarily, stored in the unsaturated zone (Ham 2002; Harter University of California, unpublished data). Research on the impact of specific manure storage lagoon management practices on groundwater quality is very limited. Unrelated research has been performed on synthetic liners used for industrial wastes and landfill leachate. Properly constructed and maintained, synthetic liner systems provide excellent protection from groundwater degradation (USEPA 2001). However, the use of synthetic liners in AFOs has been limited by their cost, although some jurisdictions now require them on new lagoons. Some lagoon leaching studies have considered various liners and subsurface materials (e.g., Ham 2002) and found high leaching rates when unlined lagoons are built into sandy or gravelly subsurface materials. Soil liners containing at least 10% clay can comply with Natural Resources Conservation Service (NRCS) guidelines (NRCS 2009), but significant leaching can occur through shrink-swell fractures in lagoon sidewalls (Baram et al. 2012). Hence, synthetic liners can protect groundwater quality, while other liners require substantial post-construction monitoring. Table 3. Leaching from Manured Fields Citation Leaching Indicator/
Study Design Estimated Loading Rate Notes
Harter, Davis, Mathews, and Meyer 2002
Review (Table 1 in article)
Nitrate concentration in leachate below the root zone and in domestic wells nearby varied widely at five to eight times above the limit for safe drinking water
None
VanderSchans et al. 2009
Groundwater modeling on two Central Valley, California, dairies
211 kg N/ha/yr (188 lbs/ac/yr) to over 700 kg N/ha/yr (630 lbs/ac/yr) with an average of 486 kg N/ha/yr (434 lbs/ac/yr)
Values near the lower end of the above range were generally achieved under relatively strict nutrient management practices whereas the average and higher values for nitrate-‐N losses to groundwater represent traditional manure management practices
Table 4. Manure BMPs Implemented to Reduce Salt Leaching from Fields/Corrals/Lagoons Citation Management
Unit Management Practice
Observed Effect on Salt Loading/Accumulation
Comments/Effectiveness
ASCE 1990 Fields, row crops, low to medium infiltration rate soils
Irrigation: Furrowa
Pattern of salt accumulation is high in ridges between furrows, may increase in direction of slope if irrigations are nonuniform
Effective leaching beneath furrow channels, salt left in ridges. Leaching requires more water than irrigation methods with lighter, intermittent applications
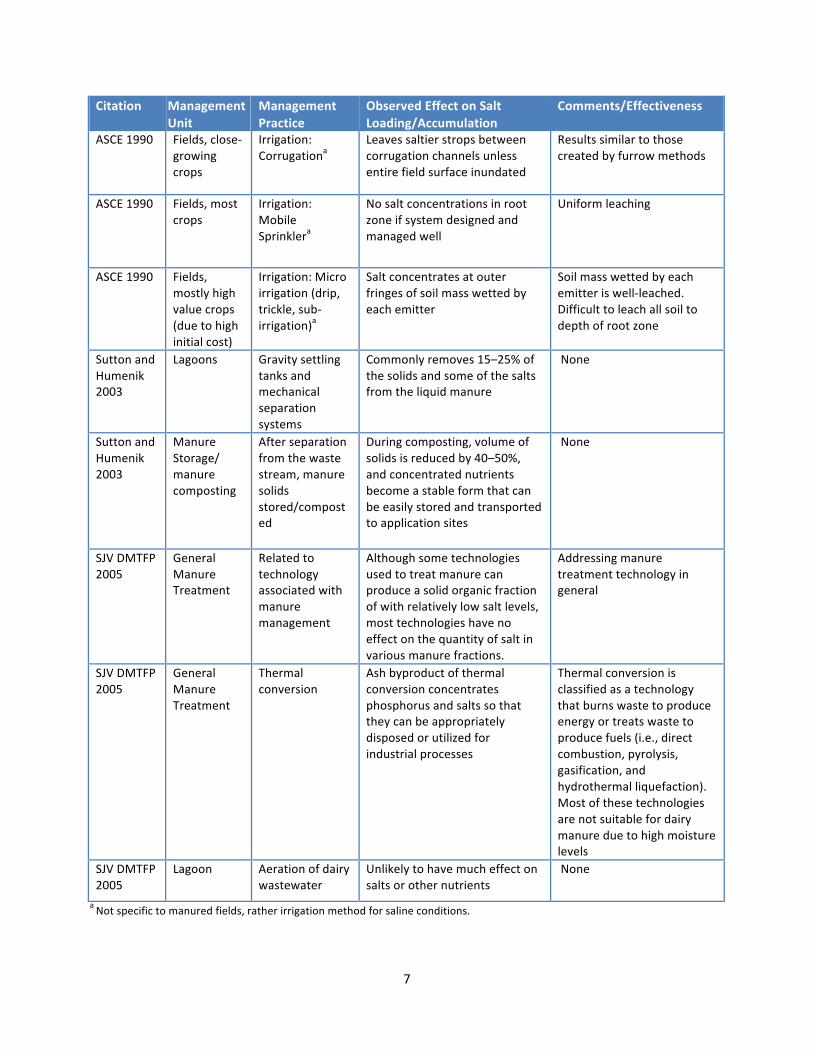
7
Citation Management Unit
Management Practice
Observed Effect on Salt Loading/Accumulation
Comments/Effectiveness
ASCE 1990 Fields, close-‐growing crops
Irrigation: Corrugationa
Leaves saltier strops between corrugation channels unless entire field surface inundated
Results similar to those created by furrow methods
ASCE 1990 Fields, most crops
Irrigation: Mobile Sprinklera
No salt concentrations in root zone if system designed and managed well
Uniform leaching
ASCE 1990 Fields, mostly high value crops (due to high initial cost)
Irrigation: Micro irrigation (drip, trickle, sub-‐irrigation)a
Salt concentrates at outer fringes of soil mass wetted by each emitter
Soil mass wetted by each emitter is well-‐leached. Difficult to leach all soil to depth of root zone
Sutton and Humenik 2003
Lagoons Gravity settling tanks and mechanical separation systems
Commonly removes 15–25% of the solids and some of the salts from the liquid manure
None
Sutton and Humenik 2003
Manure Storage/ manure composting
After separation from the waste stream, manure solids stored/composted
During composting, volume of solids is reduced by 40–50%, and concentrated nutrients become a stable form that can be easily stored and transported to application sites
None
SJV DMTFP 2005
General Manure Treatment
Related to technology associated with manure management
Although some technologies used to treat manure can produce a solid organic fraction of with relatively low salt levels, most technologies have no effect on the quantity of salt in various manure fractions.
Addressing manure treatment technology in general
SJV DMTFP 2005
General Manure Treatment
Thermal conversion
Ash byproduct of thermal conversion concentrates phosphorus and salts so that they can be appropriately disposed or utilized for industrial processes
Thermal conversion is classified as a technology that burns waste to produce energy or treats waste to produce fuels (i.e., direct combustion, pyrolysis, gasification, and hydrothermal liquefaction). Most of these technologies are not suitable for dairy manure due to high moisture levels
SJV DMTFP 2005
Lagoon Aeration of dairy wastewater
Unlikely to have much effect on salts or other nutrients
None
a Not specific to manured fields, rather irrigation method for saline conditions.
8
Manure Treated Cropland N loading rates from manured fields (Table 3) are lower than those from lagoons (Table 2), but can still be several times greater than safe drinking water limits allow (Harter, Davis, Mathews, and Meyer 2002). Thus, field N mass balance estimates are key in selecting appropriate manure management practices (Harter, Davis, Mathews, and Meyer 2002; VanderSchans et al. 2009). The National Dairy Environmental Stewardship Council has recommended synchronizing crop nutrient demand with manure application and rotating vegetable and forage crops as practices to improve the N mass balance on farms by reducing or eliminating the need for commercial fertilizer (NDESC 2005). MANAGING GROUNDWATER POLLUTION IN ANIMAL FEEDING OPERATIONS Point source discharges in animal holding areas commonly affect groundwater over a limited area (one to a few hectares). The release of contaminants is incidental, sporadic or accidental, and of limited duration (hours to months). Point sources do not contribute significantly to basin recharge (Freeze and Cherry 1979; Bower 2000; Domenico and Schwartz 2008], but the concentration of pollutants in point source discharge and affected groundwater is extremely high. Point sources have been regulated for nearly four decades. Science has made tremendous advances to support the cleanup of existing point source pollution in ground and surface waters. In contrast, nonpoint source pollution typically occurs repeatedly, often as part of intentional land use management practices (e.g., irrigation) over long time periods across substantial surficial areas. Nonpoint source pollution is intrinsically linked to natural, intentional, or induced recharge, particularly in agricultural regions (UN/WWAP 2006; Burow, Nolan, Rupert, and Dubrovsky 2010; Siebert 2005). For salts and N, polluted waters are typically less than one order of magnitude above regulatory limits (relatively low intensity), while background concentration levels are often less than one order of magnitude below regulatory limits. In the United States, nonpoint sources are commonly controlled through voluntary efforts, education and outreach, or economic incentives. Regulatory efforts are now increasing, but often lacking in science. Due to their diffuse nature, the control of surface water and groundwater discharge from nonpoint sources is significantly hampered by the difficulties in capturing and monitoring the water quality during events, which are spatially widespread, highly non-uniform, and often sporadic (high spatial and temporal variability). Representative water samples from such nonpoint source discharge events are exceedingly difficult to obtain and often require a significant investment in infrastructure and sample analysis. Few scientific tools for point sources are effective for nonpoint sources. Many nonpoint tools are conceptual and lack the physico-chemical rigor of point source contaminant hydrology, particularly for groundwater. Also, there are critical differences between surface and groundwater discharges, which are important to consider when designing management options. First, surface water discharge is rapid, while groundwater flow is much slower. Streamflow velocities are on the order of 0.1 to 10 meters per second (0.3 to 30 feet per second). Natural groundwater velocity in production aquifers is generally on the order of a few meters to hundreds of meters per year. Second, surface water is organized in a reverse tree branch network: discharges from many smaller streams combine and mix into a larger stream. Hence, each watershed, regardless of scale, has a single outlet that can be monitored for cumulative water quality effects. Surface streamflows that merge at a confluence generally mix within a short distance downstream. In contrast, groundwater is organized as an unstructured three-dimensional flow system, constrained by geologic settings. An aquifer has many flow entry (recharge) locations, often distributed across the landscape, and many exit (discharge) locations, such as domestic, irrigation, and municipal wells, streams, and rivers. Recharge and discharge are key
9
drivers of the structure and dynamics of groundwater flow patterns. Mixing of groundwater from multiple sources is limited to dispersion processes. Mixing occurs predominantly at the fringes of individual plumes, but plumes of high pollutant concentration generally do not “dissolve” into the larger groundwater body by mixing. Plumes persist for decades to centuries. For nonpoint source processes, mixing and dispersion play a limited role in the distribution of groundwater contamination due to the wide spatial extent of pollution. The dominant mixing typically happens when groundwater is discharged into a well by pumping: the groundwater is instantaneously mixed with older, typically deeper water and younger, typically shallower water entering the well screen. Similarly, groundwater discharge to streams is subject to stream mixing. Third, the cumulative impact of nonpoint (and point) source pollution on surface water is measured at the outlet of the watershed (USGS 2013). The cumulative impact of nonpoint (and point) source pollution on groundwater is measured by statistical evaluation of distributed multi-depth monitoring network data (e.g., Harter, Davis, Mathews, and Meyer 2002; Nolan, and Hitt 2006; Visser, Broers, Heerdink, and Bierkens 2009; Lockhart, King, and Harter 2013). Fourth, waste discharges into surface water are regulated under the Clean Water Act and subject to NPDES permits and TMDL implementation plans. Waste discharges to groundwater are not regulated under federal legislation. The registration, management, and waste disposal practices of some toxic chemicals are regulated under various federal regulations (Federal Insecticide Fungicide and Rodenticide Act [FIFRA], 7 U.S.C. 136-136y, 1972; Toxic Substances Control Act [TSCA], 15 U.S.C. (C. 53) 2601-2692, 1976; Resources Conservation and Recovery Act [RCRA], 42 U.S.C. § 6901, 1976). However, federal regulation does not prohibit or regulate the discharge of nutrients and salts into potable groundwater resources unless it is by direct injection (Safe Drinking Water Act [SDWA], 42 U.S.C. § 300f, 1974).
The characteristics of the impact on groundwater of nonpoint source pollution (as opposed to point source pollution) pose some key challenges. First, research on the effect of specific AFO management practices on groundwater quality across the spectrum of key crops, nutrient and water management practices, and hydrogeologic conditions in the United States is lacking. Most research has focused on the effects on surface water quality. Second, effective monitoring schemes of groundwater quality associated with AFOs are only beginning—predominantly in Europe and in some states with regulations for groundwater discharge (e.g., California). Third, coupling of root zone modeling tools with nonpoint groundwater contamination models is in its infancy. The integration of such models with surface water models and/or land-atmosphere-climate models is almost non-existent, but is a critical research mission for USDA. Third, given the previous points, the evaluation, assessment, and monitoring of AFO management effects on groundwater is challenging. Fourth, manure contains potential pollutants—(pathogens, antibiotics, pesticides, other endocrine disrupting chemicals in addition to nitrogen and salts, which may be of interest to WQT—that can affect the quality of surfacewater or groundwater. Runoff into surface water provides little attenuation of these pollutants. But transport in soils and aquifers leads to significant retardation in their environmental dissemination due to sorption processes; and many pollutants are subject to significantly increased degradation (microbial or otherwise), chemical transformations, and filtration (e.g., pathogens, pollutants sorbed to colloidal matter). In those cases, decreasing pollutant runoff while increasing pollutant infiltration into soils has some potentially beneficial attenuating consequences (Kolodziej, Harter, and
10
Sedlak 2004; Watanabe, Harter, and Bergamaschi 2008; Koehne, Koehne, and Simunek 2009). In sandy soils or soils with significant macropore structure (e.g., cracked clay soils overlying tile drains), attenuation processes prior to recharging groundwater or discharging into tile drains may be very limited. Fifth, organic nitrogen and ammonia nitrogen are also much less mobile in the subsurface environment than in surface runoff. However, under aerobic conditions, nitrogen ultimately is transformed to nitrate, which is highly mobile and not subject to retardation or degradation. Any dissolved salts are similarly mobile in the subsurface environment. Most groundwater underlying agricultural basins is used for drinking water, discharged to nearby (or even distant) streams, or used for irrigation. Hence, for nitrate (except where significant denitrification is known to occur) and for salinity, the transfer of surface water discharges into groundwater discharges is not desirable.
For nitrate (but not for salts) increasing leaching to groundwater by reducing runoff is beneficial where subsurface conditions favor denitrification, thus ideally reducing nitrate to harmless N2 gas. Some strongly reducing aquifer regions have been mapped by state and local agencies or by the U.S. Geological Survey, but in many locations, the rate of denitrification will be unknown or highly uncertain. An assessment would require (extensive) in situ groundwater monitoring. Denitrification may also produce N2O, a potent greenhouse gas (Schlesinger 2009), an undesirable and poorly understood cross-media impact of denitrification. Nutrient management practices exist to reduce nitrate both in runoff and groundwater (Dzurella et al. 2012), but little monitoring data exist that quantifiably link management practices to groundwater nitrate leaching. MONITORING GROUNDWATER POLLUTION IN ANIMAL FEEDING OPERATIONS Groundwater monitoring is accomplished with typically one to two monitoring wells upgradient of the targeted facility to determine background or ambient concentration, and two and or more wells immediately downgradient of the facility. However, linking groundwater pollution in monitoring wells to specific activities or sources within or near an AFO often yields ambiguous results. This is due to the ubiquitous release of two key groundwater pollutants of concern, nitrate and salinity, across an AFO’s various management units (lagoons, corrals, manured fields), as well as surrounding farmland, which may receive applications of fertilizer or manure. There are alternative monitoring approaches to address this dilemma. The Netherlands maintains an extensive three-tiered national water quality monitoring program encompassing soils, shallow groundwater, and deep groundwater. The Dutch program is designed as a national monitoring network, with sampling locations distributed in a randomized network stratified by major soil and aquifer types, and by major farm types. Results are evaluated statistically, similar to Harter, Davis, Mathews, and Meyer (2002). In New Mexico, all dairy farms must construct groundwater monitoring networks such that an assessment can be made of the farm’s impact on groundwater quality. California, with more than 1,500 dairy farms, most of them classified as AFOs, initially required all facilities with significant management practice violations or suspected groundwater contamination to install monitoring networks, typically with 4–12 monitoring wells. New groundwater quality protection rules for dairies, however, put more emphasis on monitoring source management (CVRWB 2007). Monitoring source management practices allows for an indirect assessment of actual pollutant discharges to groundwater, which are subject to uncertainties due to the complexity of potentially attenuating processes such as denitrification, ammonia volatilization, and crop uptake of significant amounts of salt. The advantage of monitoring source management practices as a regulatory control tool is that this provides the operator with a more tangible framework for managing potential pollutant sources.
11
A combination of source management practice monitoring with broader, regional groundwater monitoring (e.g., The Netherlands, California’s Dairy Order) addresses the weaknesses of each approach when used alone. MODELING GROUNDWATER POLLUTION FROM ANIMAL FEEDING OPERATIONS Soil water and solute flux models such as GLEAMS, SWAT, and HYDRUS can simulate changes in long-term average pollutant leaching to groundwater, but field data for a range of management practices and crops are needed for model calibration. Unsaturated zone and groundwater quality are tightly linked, but contaminant fluxes below the root zone or in groundwater are very rarely monitored in field research projects. This increases uncertainty in unsaturated zone and groundwater model predictions. An assessment of the impact on water quality due to animal farming management practices involves three integrated systems: nitrate or salt source system (corral construction, lagoon design, crop management system), the root zone and underlying unsaturated zone, and the groundwater system. Due to the size of many animal farming systems, especially when including pasture or cropland affected by manure applications, the assessment of groundwater pollution is akin to a nonpoint source pollution assessment, as opposed to a point-source assessment, where groundwater pollution is the result of a single, highly localized source. Groundwater nonpoint-source assessment tools are grouped into three categories (NRC 1993):
(1) Overlay and index methods for maps of qualitative indices of groundwater vulnerability to pollution (Aller et al. 1987; National Research Council 1993; Civita and De Maio 2004; Pavlis, Cummins, and Donnell 2010).
(2) Statistical approaches for the likelihood of pollution from existing water-quality datasets and associated explanatory variables, using regression (Nolan, Hitt, and Ruddy 2002), fuzzy logic (Uricchio, Giordano, and Lopez 2004), artificial neural networks (Khalil, Almasri, McKee, and Kaluarachchi 2005), etc.
(3) Process-based methods that explicitly simulate the physics of soil and groundwater flow and transport. These approaches include zero-order mixing models (Mercado 1976; Lee 2007) or one-dimensional plug-flow models that assume vertical advective flux of contaminants into the aquifer (Refsgaard et al. 1999; Cho and Mostaghimi 2009). More complex approaches include coupled one-, two-, or three-dimensional numerical flow and transport models. Three-dimensional models of soil and groundwater transport are computationally demanding (Harter and Morel-Seytoux 2013). At sufficiently high resolution (centimeter to meter scale), their application is limited to small sites. Alternatively, when simulating entire groundwater basins, these models are operated under relatively coarse resolution (hundreds of meters to kilometers) and make significant assumptions about the physics of effective flow and transport processes at the scale of resolution.
An illustrative example of a process-based method is the streamline transport method (Ginn 2001; Weissmann, Zhang, LaBolle, and Fogg 2002; McMahon et al. 2008; Herrera 2010; Kourakos, Klein, Cortis, and Harter 2012). The method focuses on the affected recipients of groundwater pollution—a river receiving groundwater discharge, water supply wells, or springs used for water supply. The streamline method uses a backward tracing approach to connect these so-called “receptors” (wells, streams, springs) with their recharge sources, which may include pollutant sources (e.g., cropland, lagoons, corrals, etc.). The streamline method is based on a solid understanding of groundwater flow dynamics in an aquifer, usually obtained by computer modeling (Harter and Morel-Seytoux 2013). In the streamline method, groundwater flow is visualized using many individual streamline traces, or streamtubes. The streamtubes also carry pollutants, and computer models can be used to compute the travel time of pollutants between pollutant source and receptor. Computer models also account for the fate of pollutants (e.g., any sorption or degradation that may occur along the streamtube). The streamline method provides a visual illustration
12
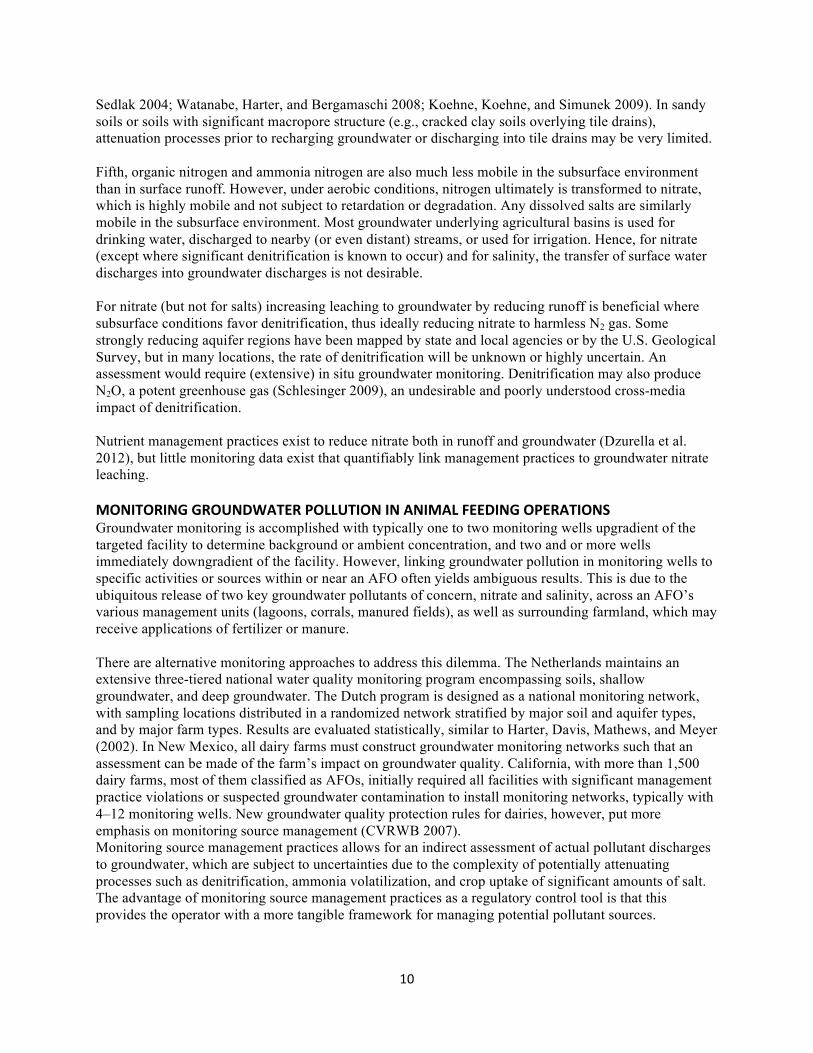
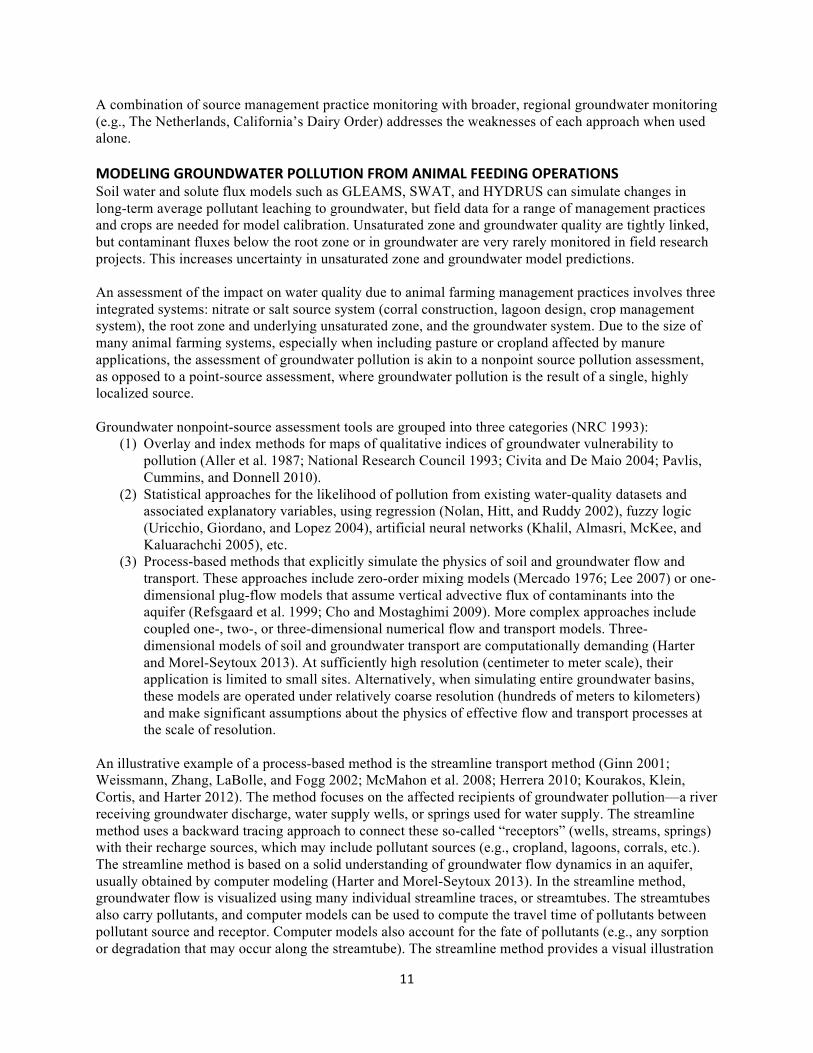
of groundwater flow and transport dynamics, and thus some understanding of how groundwater obtained from a supply well or flowing into a stream may be linked to various pollution sources that recharge into an aquifer (Figure 1).
Figure 1. Streamline transport modeling concept illustrates the fate of nonpoint source pollutants in groundwater aquifers. The top panel shows a map view of groundwater streamlines across the groundwater basin delineated by the gray area; the bottom panel shows a three-dimensional view of streamlines from within the aquifer, looking upward against the land surface. The land surface is characterized by different land uses (various colors). The bluish/reddish streamlines (top) or streamtubes (bottom) represent streamlines of groundwater flow. The color shading of the streamlines indicates the groundwater age. Groundwater age begins with zero years at the point of recharge (dark blue). The longer the travel time, the older the groundwater. Only streamlines that converge on local water supply wells are shown. In the map view, the dark blue end of a streamline represents the recharge point, the lighter blue or reddish end point of a streamline represents the water supply well. In this example from south-central
13
California, recharge is mostly from two streams in the northern and central-eastern area, and from excess irrigation. Areas with little groundwater recharge (e.g., the southwestern part of this basin), pump very old groundwater that is transported there from far away (top). Water supply wells are the main “receptor” of groundwater. In the three-dimensional aquifer view (bottom), the intake screen (the portion of the well receiving groundwater) is represented as a red vertical tube. Individual well screens receive a mix of groundwater—younger groundwater enters near the top of the well screen, older groundwater enters near the bottom of the well screen. Within the same well, older groundwater may be from much further away than younger groundwater (bottom).
Figure 1 illustrates the streamlines obtained as part of a nonpoint source nitrate transport model for the Tule River aquifer in southern Central Valley, California (Kourakos and Harter 2013). In this illustration, groundwater age is indicated by the color along the streamline. The longer groundwater travels, the older it is. The youngest groundwater is dark blue; the oldest groundwater is dark red. The map view of groundwater streamlines in this basin indicates that the northern and central regions of the aquifer (Figure 1, top panel) receive most groundwater recharge via irrigation return and stream discharge. The streamtubes of wells located in those areas are relatively short and consist of only young water. On the other hand, there is little recharge in the southwestern and southeastern areas of this region. Wells in those regions tend to be very deep and they have sources located tens of miles away leading to long travel times, measured in centuries or even millenia. At any given time, water pumped from a water supply well (Figure 1, bottom panel) is actually a mix of ages. Typically the water near the top of the screen is relatively young (<10 years old). More recently recharged groundwater is likely to have a higher nitrate concentration due to the intensification of agriculture and animal farming during the past half century. The deeper parts of well screens often receive very old water (>100 years old) that would be relatively free of nonpoint source pollutants from animal farming. Depending on the depth of the wells and water availability (landscape recharge, stream recharge), recharge sources may only be a few tens of meters away or several miles to tens of miles upstream.
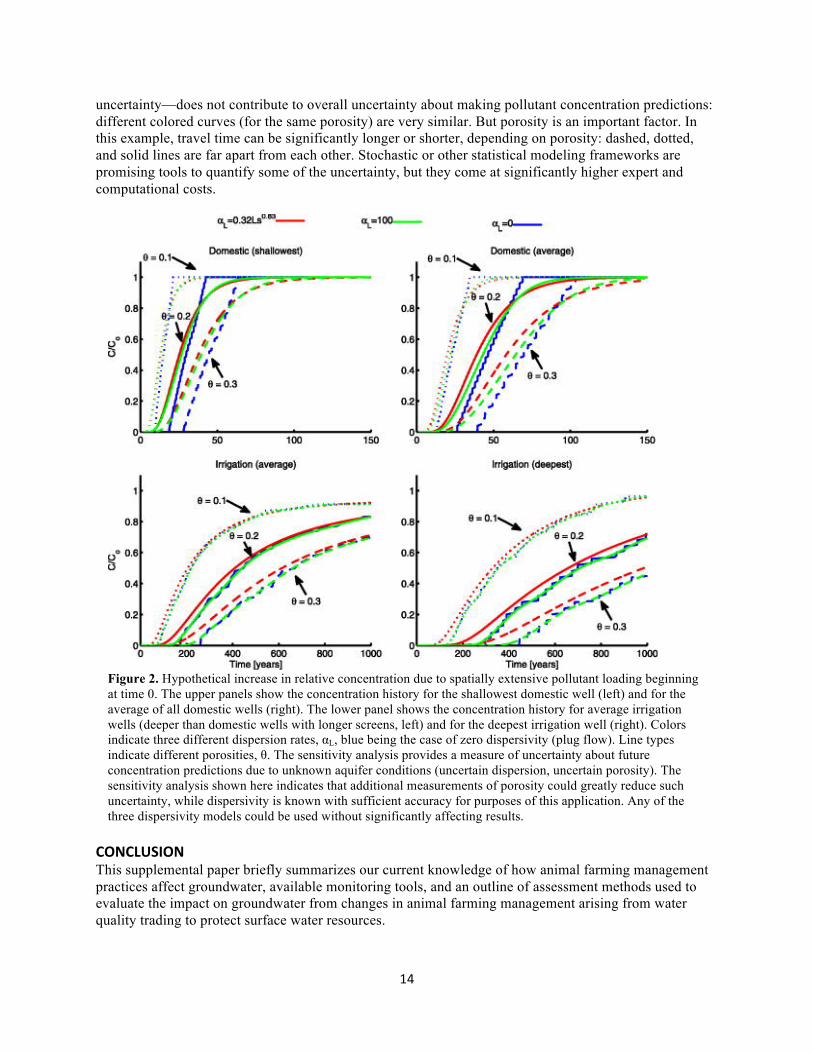
UNCERTAINTY IN ASSESSING RELATIVE CHANGES IN GROUNDWATER QUALITY DUE TO CHANGES IN MANAGEMENT PRACTICES Groundwater flow (the shape, arrangement, and age of the streamlines shown in Figure 1) is influenced by the spatial distribution of recharge sources, wells, streams, and springs as much as it is influenced by the internal geologic structure of a groundwater basin. For example, hydraulic conductivity of the aquifer is highly variable but only measured in a few locations. In addition, preferential flow may occur in fractured rock aquifers or Karst aquifers, which may offer very limited capacity to naturally attenuate pollutants such as nitrate. This leads to uncertainty about the fate of pollutants in the subsurface. Uncertainty also arises from the complexity of land use decisions that cannot be accurately captured at a regional scale. These land use decisions translate into boundary conditions and stresses that critically drive assessment models. The complexity of these factors make it difficult to assess which source will have a direct impact on which receptor (well, stream section) and to precisely predict the extent of impact on wells or streams over time. Methods outlined in the previous section can be used to assess the impact of policy or management decisions in AFO management for WQT for groundwater. Using sensitivity analysis and statistical methods, these tools also provide an opportunity to assess the degree of uncertainty associated with limited knowledge about sources or groundwater aquifer complexity. Figure 2 shows an example of the uncertainty due to different aquifer porosity values and different dispersivity. Porosity is an important factor that affects the speed at which pollutants may travel through the subsurface. Dispersivity refers to the tendency to disperse pollutants while they are transported through the aquifer. In Figure 2, each panel corresponds to a well at a different depth. Concentration as a function of time (so-called breakthrough curves) are shown. Different breakthrough curves are obtained depending on the choice of porosity or dispersivity, both of which are highly uncertain. In this example, dispersivity—within the range of
14
uncertainty—does not contribute to overall uncertainty about making pollutant concentration predictions: different colored curves (for the same porosity) are very similar. But porosity is an important factor. In this example, travel time can be significantly longer or shorter, depending on porosity: dashed, dotted, and solid lines are far apart from each other. Stochastic or other statistical modeling frameworks are promising tools to quantify some of the uncertainty, but they come at significantly higher expert and computational costs.
Figure 2. Hypothetical increase in relative concentration due to spatially extensive pollutant loading beginning at time 0. The upper panels show the concentration history for the shallowest domestic well (left) and for the average of all domestic wells (right). The lower panel shows the concentration history for average irrigation wells (deeper than domestic wells with longer screens, left) and for the deepest irrigation well (right). Colors indicate three different dispersion rates, αL, blue being the case of zero dispersivity (plug flow). Line types indicate different porosities, θ. The sensitivity analysis provides a measure of uncertainty about future concentration predictions due to unknown aquifer conditions (uncertain dispersion, uncertain porosity). The sensitivity analysis shown here indicates that additional measurements of porosity could greatly reduce such uncertainty, while dispersivity is known with sufficient accuracy for purposes of this application. Any of the three dispersivity models could be used without significantly affecting results.
CONCLUSION This supplemental paper briefly summarizes our current knowledge of how animal farming management practices affect groundwater, available monitoring tools, and an outline of assessment methods used to evaluate the impact on groundwater from changes in animal farming management arising from water quality trading to protect surface water resources.
15
We identify three main components of animal farms that affect groundwater: animal holding areas (animal yard, corrals, exercise yard), manure storage areas (lagoons), and manure application areas (fields). A large variety of management practices are associated with each of these potential groundwater pollution sources. Animal farming is known to pose significant risks to groundwater pollution, primarily from microbial pollutants and due to nutrient losses, but also due to the elevated salinity of animal waste. Our current knowledge of the impact on groundwater from animal farming is largely based on studies that consider animal farming operations within a larger regional landscape or specific components of animal farms (e.g., animal yards, lagoons). Very few studies evaluate or compare specific management practices in regards to their impact on groundwater, largely due to the significant cost of groundwater monitoring. Research is needed to better understand relative differences in groundwater quality and their relationship to current or alternative management practices for each of the three major components in animal farming (animal holding areas, manure storage areas, and manure application areas). Additional research should include comparative long-term groundwater quality monitoring, more extensive application of existing assessment methods, and development of new tools geared toward groundwater quality evaluation and measuring prediction uncertainty. Research on the integration of groundwater models with other models—coupling source systems with root zone/unsaturated zone pollutant fate and transport models, with groundwater models, and with surface water models is currently an emerging field in hydrologic simulation. These tools will be critical in the context of assessing the environmental effects of AFO management that also include the impact on air emissions and groundwater, which are often outside the expertise of watershed managers. Significant additional regulatory, funding, programmatic, and research resources are needed at the federal level to address groundwater quality concerns.
16
REFERENCES Aller, L., T. Bennett, J.H. Lehr, R.J. Petty, and G. Hackett. 1987. DRASTIC: A Standardized System for Evaluating Groundwater Pollution Potential using Hydrogeologic Settings. Ada, Okla.: U.S. Environmental Protection Agency. http://nepis.epa.gov/Exe/ZyPURL.cgi?Dockey=20007KU4.txt. ASCE (American Society of Civil Engineers). 1990. Agricultural Salinity Assessment and Management. ASCE Manuals and Reports on Engineering Practice 71, New York: ASCE. Baram, S., S. Arnon, Z. Ronen, D. Kurtzman, and O. Dahan. 2012. “Infiltration Mechanisms Controls Nitrification and Denitrification Processes under Dairy Waste Lagoon.” Journal of Environmental Quality 41(5): 1623–1632. Bouwer, H. 2000. “Integrated Water Management: Emerging Issues and Challenges.” Agricultural Water Management 45(3): 217–228. Brown, Vence, and Associates. 2004. Review of Animal Waste Management Regulations, Task 2 Report: Title 27 Effectiveness to Protect Groundwater Quality. Central Valley Regional Water Quality Control Board. http://www.waterboards.ca.gov/centralvalley/water_issues/dairies/historical_dairy_program_info/index.shtml. Burow, K.R., B.T. Nolan, M.G. Rupert, and N.M. Dubrovsky. 2010. “Nitrate in Groundwater of the United States, 1991−2003.” Environmental Science & Technology 44(13): 4988–4997. Central Valley Regional Water Board. 2007. “Waste Discharge Requirements General Order for Existing Milk Cow Dairies.” Order No. R5-2007-0035. http://www.waterboards.ca.gov/centralvalley/board_decisions/adopted_orders/general_orders/r5-2007-0035.pdf. Cho, J., and S. Mostaghimi. 2009. “Dynamic Agricultural Non-point Source Assessment Tool (DANSAT): Model Development.” Biosystems Engineering 102(4): 486–499 . Chomycia, J.C., P.J. Hernes, T. Harter, and B.A. Bergamaschi. 2008. “Land Management Impacts on Dairy-Derived Dissolved Organic Carbon in Groundwater.” Journal of Environmental Quality 37(2): 333–343. Civita, M., and M. De Maio. 2004. “Assessing and Mapping Groundwater Vulnerability to Contamination: The Italian ‘Combined’ Approach.” Geofisica International 43(4): 513–532. Domenico, P.A., and J.A. Schwartz. 2008. Physical and Chemical Hydrogeology. New York: John Wiley. Drommerhausen, D.J., D.E. Radcliffe, D.E. Brune, and H.D. Gunter. 1995. “Electromagnetic Conductivity Surveys of Dairies for Groundwater Nitrate.” Journal of Environmental Quality 24(6): 1083–1091. Dzurella, K.N., J. Medellin-Azuara, V.B. Jensen, A.M. King, N. De La Mora, A. Fryjoff-Hung, T.S. Rosenstock, T. Harter, R. Howitt, A.D. Hollander, J. Darby, K. Jessoe, J.R. Lund, and G.S. Pettygrove. 2012. Addressing Nitrate in California’s Drinking Water, Technical Report 3: Nitrogen Source Reduction
17
to Protect Groundwater Quality with a Focus on Tulare Lake Basin and Salinas Valley Groundwater. Report for the State Water Resources Control Board Report to the Legislature. Davis, Calif.: Center for Watershed Sciences, University of California, Davis. Freeze, R.A., and J.A. Cherry. 1979. Groundwater. Englewood Cliffs, N.J.: Hemel Hempstead, Prentice-Hall International. Ginn, T. 2001. “Stochastic-Convective Transport with Nonlinear Reactions and Mixing: Finite Streamtube Ensemble Formulation for Multicomponent Reaction Systems with Intra-Streamtube Dispersion.” Journal of Contaminant Hydrology 47(1): 1-28. Ginn, T. 2002. “Streamtube-Ensemble Techniques for Nonlinear Multicomponent Reactive Transport in Heterogeneous Media.” In Stochastic Methods in Subsurface Contaminant Hydrology, edited by R. Govindaraju, 169–238 Hoboken, N.J.: ASCE Press. Ham, J.M. 2002. “Seepage Losses from Animal Waste Lagoons: A Summary of a Four-Year Investigation in Kansas.” Transactions of the ASAE 45(4): 983–992. Harter, T., H. Davis, M.C. Mathews, and R.D. Meyer. 2002. “Shallow Groundwater Quality on Dairy Farms with Irrigated Forage Crops.” Journal of Contaminant Hydrology 55(3–4): 287–315. Harter, T., E.R. Atwill, L.L. Hou, B.M. Karle, and K.W. Tate. 2008. “Developing Risk Models of Cryptosporidium Transport in Soils from Vegetated, Tilted Soilbox Experiments.” Journal of Environmental Quality 37(1): 245–258. Harter T., and H. Morel-Seytoux. 2013. Peer Review of the IWFM, MODFLOW and HGS Model Codes: Potential for Water Management Applications in California’s Central Valley and Other Irrigated Groundwater Basins. Final Report, California Water and Environmental Modeling Forum, Sacramento, July 2013. http://www.cwemf.org. Harter, T. Unpublished data. “Deep Soil Cores underneath California Dairy Sites: Nitrate and Salt Dynamics.” Davis, Calif.: University of California, Davis. Herrera, P.A., A.J. Valocchi, and R.D. Beckie. 2010. “A Multidimensional Streamline-based Method to Simulate Reactive Solute Transport in Heterogeneous Porous Media.” Advanced Water Resources 33(7): 711–727. Hunter, W.J. 2013. “Pilot-Scale Vadose Zone Biobarriers Removed Nitrate Leaching from a Cattle Corral.” Journal of Soil and Water Conservation 68(1): 52–59. Khalil, A., M.N. Almasri, M. McKee, and J.J. Kaluarachchi. 2005. “Applicability of Statistical Learning Algorithms in Groundwater Quality Modeling.” Water Resources Research. doi:10.1029/2004WR003608. Koehne, J.M., S. Koehne, and J. Simunek. 2009. “A Review of Model Applications for Structured Soils: b) Pesticide Transport.” Journal of Contaminant Hydrology 104(1–4): 36–60. Kolpin, D., B. Jake, and G. Robert. 1998. “Occurrence of Pesticides in Shallow Groundwater of the United States: Initial Results from the National Water-Quality Assessment Program.” USGS Staff Published Research. Paper 70. http://digitalcommons.unl.edu/usgsstaffpub/70.
18
Kolodziej, E.P., T. Harter, and D.L. Sedlak. 2004. “Dairy Wastewater, Aquaculture, and Spawning Fish as Sources of Steroid Hormones in the Aquatic Environment.” Environmental Science and Technology 38(23): 6377–6384. Kourakos, G., F. Klein, A. Cortis, and T. Harter. 2012. “A Groundwater Nonpoint Source Pollution Modeling Framework to Evaluate Long-Term Dynamics of Pollutant Exceedance Probabilities in Wells and Other Discharge Locations.” Water Resources Research. doi:10.1029/2011WR010813. Kourakos, G., and T. Harter, 2013. “Vectorized Simulation of Groundwater Flow and Streamline Transport.” Environmental Modelling & Software 52: 207–221. Lee, S.S. 2007. “Unsaturated-Zone Leaching and Saturated-Zone Mixing Model in Heterogeneous Layers.” In Springer Proceedings in Physics, Volume 112, part VI, edited by T. Schanz, 387–399. Berlin, Germany: Springer. Lockhart, K.M., A.M. King, and T. Harter. 2013. “Identifying Sources of Groundwater Nitrate Contamination in a Large Alluvial Groundwater Basin with Highly Diversified Intensive Agricultural Production.” Journal of Contaminant Hydrology 151: 140–154. Mansell, D.S., R.J. Bryson, T. Harter, J.P. Webster, E.P. Kolodziej, and D. Sedlak. 2011. “Fate of Endogenous Steroid Hormones in Steer Feedlots under Simulated Rainfall-Induced Runoff.” Environmental Science and Technology 45(20): 8811–8818. McMahon, P.B., K.R. Burow, L.J. Kauffman, S.M. Eberts, J.K. Böhlke, and J.J. Gurdak. 2008. “Simulated Response of Water Quality in Public Supply Wells to Land Use Change.” Water Resources Research. doi:10.1029/2007WR006731. Mercado, A. 1976. “Nitrate and Chloride Pollution of Aquifers: A Regional Study with the Aid of a Single-Cell Model.” Water Resources Research 12(4): 731–747. Mielke, L.N., P. Norris, and T.M. McCalla. 1974. “Soil Profile Conditions of Cattle Feedlots.” Journal of Environmental Quality 3(1): 14–17. Miller, J.J., T. Curtis, F.J. Larney, T.A. McAllister, and B.M. Olson. 2008. “Physical and Chemical Properties of Feedlot Pen Surfaces Located on Moderately Coarse- and Moderately Fine-Textured Soils in Southern Alberta.” Journal of Environmental Quality 37(4): 1589–1598. National Dairy Environmental Stewardship Council. 2005. “Cost-Effective and Environmentally Beneficial Dairy Manure Management Practices.” San Francisco: Sustainable Conservation. http://www.suscon.org/dairies/pdfs/NDESCreportCostEffective.pdf. National Research Council. 1993. Groundwater Vulnerability Assessment: Predicting Relative Contamination Potential Under Conditions of Uncertainty. Washington, D.C.: National Academy Press. NRCS (Natural Resources Conservation Service). 2009. Natural Resources Conservation Service, Conservation Practice Standard, Waste Treatment Lagoon No. Code 359. http://efotg.sc.egov.usda.gov/references/public/SD/359.pdf. Nolan, B.T., K.J. Hitt, and B.C. Ruddy. 2002. “Probability of Nitrate Contamination in Recently Recharged Groundwaters in the Conterminous United States.” Environmental Science and Technology 36(10): 2138–2145.
19
Nolan, B.T., and K.J. Hitt. 2006. “Vulnerability of Shallow Groundwater and Drinking-Water Wells to Nitrate in the United States.” Environmental Science and Technology 40: 7834–7840. Park, Y., E.R. Atwill, L.L. Hou, A.I. Packman, and T. Harter. 2012. “Deposition of Cryptosporidium Parvum Oocysts in Porous Media: A Synthesis of Attachment Efficiencies Measured under Varying Environmental Conditions.” Environmental Science and Technology 46(17): 9491–9500. Pavlis, P., E. Cummins, and K. Mc Donnell. 2010. “Groundwater Vulnerability Assessment of Plant Protection Products.” Human and Ecological Risk Assessment 16(3): 621–650. Refsgaard, J.C., M. Thorsen, J.B. Jensen, S. Kleeschulte, and S. Hansen. 1999. “Large-Scale Modeling of Groundwater Contamination from Nitrate Leaching.” Journal of Hydrology 221(3–4): 117–140. San Joaquin Valley Dairy Manure Technology Feasibility Panel. 2005. An Assessment of Technologies for Management and Treatment of Dairy Manure in California’s Central Valley. Sacramento, Calif.: California Environmental Protection Agency, Air Resources Board. Available from http://www.arb.ca.gov/ag/caf/dairypnl/dmtfaprprt.pdf. Schlesinger, W.H. 2009. “On the Fate of Anthropogenic Nitrogen.” Proceedings of the National Academy of Sciences of the United States of America 106(1): 203–208. Siebert, S. 2005. “Global-Scale Modeling of Nitrogen Balances at the Soil Surface.” Frankfurt Hydrology Papers 02. Frankfurt am Main, Germany: Institute of Phyiscal Geography, Frankfurt University. https://www2.uni-frankfurt.de/45217765/FHP_02_Siebert_2005.pdf. SJV DMTFP (San Joaquin Valley Dairy Manure Technology Feasibility Panel). 2005. An Assessment of Technologies for Management and Treatment of Dairy Manure in California’s Central Valley. December, 2005. Sutton, A., and F. Humenik. 2003. “CAFO Fact Sheet#24: Technology Options to Comply with Land Application Rules.” Ames, Iowa: Midwest Plan Service, Iowa State University. http://www.heartlandwq.iastate.edu/ManureManagement/Regulations/cafosheets/fact24.htm. Tanji, Kenneth K. (ed.). 1990. Agricultural Salinity Assessment and Management. Manual 71. New York: American Society of Civil Engineers. Unc, A., M.J. Goss, S. Cook, X. Li, E.R. Atwill, and T. Harter. 2012. “Analysis of Matrix Effects Critical to Microbial Transport in Organic Waste-Affected Soils across Laboratory and Field Scales.” Water Resources Research 48(6): W00L12. United Nations World Water Assessment Programme. 2006. “United Nations World Water Development Report 2: Water, a Shared Responsibility.” http://unesdoc.unesco.org/images/0014/001444/144409e.pdf. Paris, France: UNESCO. Uricchio V.F., R. Giordano, and N. Lopez. 2004. “A Fuzzy Knowledge-based Decision Support System for Groundwater Pollution Risk Evaluation.” Journal of Environmental Management 73(3): 189–197. U.S. Environmental Protection Agency. 2001. “United States Environmental Protection Agency, Solid Waste and Emergency Response (5306W), Geosynthetic Clay Liners Used in Municipal Solid Waste Landfills.” http://www.epa.gov/osw/nonhaz/municipal/landfill/geosyn.pdf.
20
U.S. Geological Survey. Various dates. National Field Manual for the Collection of Water-Quality Data. Techniques of Water-Resources Investigations. http://water.usgs.gov/owq/FieldManual. For a summary of revisions since 1999 go to http://water.usgs.gov/owq/FieldManual/mastererrata.html. Watanabe, N., T. Harter, and B.A. Bergamaschi. 2008. “Environmental Occurrence and Shallow Groundwater Detection of the Antibiotic Monensin from Dairy Farms.” Journal of Environmental Quality 37(supplement): S78–S85. Weissmann, G.S., and G.E. Fogg. 1999. “Multi-Scale Alluvial Fan Heterogeneity Modeled with Transition Probability Geostatistics in a Sequence Stratigraphic Framework.” Journal of Hydrology 226(1–2): 48–65. Weissmann, G.S., Y. Zhang, E.M. LaBolle, and G.E. Fogg. 2002. “Dispersion of Groundwater Age in an Alluvial Aquifer System.” Water Resources Research 38(10): 1198–1211.. Vaillant, G.C., G.M. Pierzynski, J.M. Ham, and J. DeRouchey. 2009. “Nutrient Accumulation Below Cattle Feedlot Pens in Kansas.” Journal of Environmental Quality 38(3): 909–918. Van der Schans, M.L., T. Harter, A. Leijnse, M.C. Mathews, and R.D. Meyer. 2009. “Characterizing Sources of Nitrate Leaching from an Irrigated Dairy Farm in Merced County, California.” Journal of Contaminant Hydrology 110(1–2): 9–21. Visser, A., H.P. Broers, R. Heerdink, and M.F.P. Bierkens. 2009. “Trends in Pollutant Concentrations in Relation to Time of Recharge and Reactive Transport at the Groundwater Body Scale.” Journal of Hydrology 369(3): 427–439.