Embed Size (px)
Citation preview

• 139 •
Chapter 5
Liveability describes the degree to which a place supports quality of life, health and wellbeing.
In broad terms, liveable cities are healthy, safe, harmonious, attractive and affordable. They have high amenity, provide good accessibility and are environmentally sustainable.
The importance of cities to a globally competitive economy is now widely acknowledged (COAG 2011) and liveability is recognised as an important component of competitive advantage. International city indicators have been produced in recent years to inform decisions about where to set up businesses or seek employment. By international standards Australian cities are ranked among the most liveable in the world.
The features of cities that make them liveable include the quality of the design and amenity of the built and natural environment. Equally important is the degree of access to employment, education, health and community services; to social, cultural and recreational opportunities and facilities; to open space and natural landscapes. Other characteristics reflect qualities of urban communities, such as a diversity of people and activities that add vibrancy to places and enrich personal experiences. Essential to community wellbeing is social cohesion, which is the level of trust among people, and social inclusion, which is the extent to which all members of the community have access to the available opportunities and resources. These attributes are described in more detail in this chapter.
• 139 •
Liveability

• 140 •
Department of Infrastructure and Transport • Major Cities Unit
Summary IndicatorsDimension Indicators
Liveability
Property Council of Australia 2011 My city survey
The Economist 2011 Quality of Life Index
Global city indices PricewaterhouseCoopers 2011 Cities of Opportunity
Inequality Wi k nson and Pickett 2010 Income inequality and social outcomes
Climatic comfort Mean ra nfall and temperatures 1992 to 2011, major cities
Housing Households composition and dwelling type
Tenure and residential mobility
Affordability Hous ng affordability
Household expenditure
Mercer 2011 Cost of Living
The Economist 2011 World Wide Cost of Living
Australian dollar exchange rate
Health L fe expectancy for males and females, Indigenous and non-Indigenous
Obesity and overweight rates for males and females aged 15 and over
Physical nactivity rates for
Active Travel Walking and bicycle riding rates
Safety Road fatalities
Accessibility Access to higher education by transport mode
Social nclusion Proportion of the Indigenous population in major cities
Aged cared accommodation projected deficits
Use of locally available public transport by people with a disability
Community wel being Australian Wellbe ng ndex
Community indicators survey, Victoria 2007
Key findings• Australia’s largest cities are in the top 10 of most global liveability rankings and have retained
or improved their position.
• Melbourne is ranked the most liveable city in the world by one international standard but Adelaide is the most liveable city in Australia as rated by its residents.
• Capital cities were rated highly by a survey of more than 4,000 residents for recreational opportunities, outdoor and natural environments and for variety of cultural, entertainment and educational facilities. They rated poorly on roads and traffic congestion, public transport services, environmental sustainability and climate change, and providing quality affordable housing (Property Council of Australia (PCA) 2011).
• The cost of greenfield developments is significantly lower than infill developments in all capitals except Sydney where cost of land and associated infrastructure charges on greenfield developments push their price higher than some infill.
• Australia has had one of the largest increases in real house prices among OECD countries, particularly since 2000. Price growth rates have been similar between capital cities and the rest of Australia.

• 141 •
Chapter 5 Liveability • State of Australian Cities 2011
• Household size continues to decrease as couple families with children continue to decline as a proportion of household mix.
• A relatively high proportion of Sydney households live in units and other medium/high density dwellings compared with other capital cities, particularly Melbourne. Families with children overwhelmingly occupy separate houses.
• Income inequality remains an area where Australian cities are not performing as strongly as many other OECD countries.
• People living in the major cities are generally less likely to die from preventable causes than people in country areas, regardless of socioeconomic levels.
• Although a substantial gap remains between Indigenous and non-Indigenous Australians, in many wellbeing indicators there has been a positive trend in the long term unemployment rate in major cities for Indigenous 18-64-year-olds, which has decreased from 57 per cent in 1994, to 25 per cent in 2008.
Liveability measuresLiveability in many ways is highly subjective but both public and private sector organisations seek to measure this concept to inform policy and investment decisions.
While there is no definitive set of factors that constitute liveability, there are some commonly acknowledged characteristics of cities that enhance quality of life. A survey of Australian residents of capital cities commissioned by the Property Council of Australia (PCA) entitled My City: The People’s Verdict found that Adelaide rated most highly as a liveable city (PCA 2011). The survey asked people to rank the importance they placed on a set of 17 attributes that make a city liveable, which can be grouped as follows:
• Safety – the city is for people and their property
• Accessibility – there are good healthcare services, employment and economic opportunities, quality public transport, an efficient road network and minimal traffic congestion, and good schools and other educational facilities
• Affordability – it is an affordable place with a good standard of living and there is a range of quality affordable housing
• Health – the city has a good climate, is clean, well-maintained and unpolluted, and there is a wide range of recreational opportunities such as playgrounds, cycle paths and parks
• Diversity – there is a wide range of cultural entertainment options and a diverse range of people who get along well
• Environmental sustainability – good approaches to environmental sustainability and climate change are enacted
• Quality design and amenity – the natural environment and the look and design of the city (the buildings, streetscapes and cityscape) are attractive.
• 142 •
Department of Infrastructure and Transport • Major Cities Unit
Across the various attributes, the cities were rated highly for their recreational outdoor environments, natural environments and variety of cultural, entertainment and educational facilities. However, they rated poorly on roads and traffic congestion, public transport services, environmental sustainability and climate change, and provision of quality affordable housing.
The strengths and weaknesses of the capital cities are reflected in how residents ranked their cities on the attributes. Darwin ranked highest on economic opportunity, Brisbane for good transport service, Hobart for safety, Adelaide for affordable housing and Melbourne for an attractive look and design (Figure 5.1).
Figure 5.1 Property Council of Australia Liveability Index 2011 – Survey responses for liveability attributes
Attractive Look and Design Employment and Economic Opportunity
Quality Affordable Housing Safe Place for People and Property
Good Transport Service
SydneyDarwinHobartPerthBrisbaneCanberraMelbourneAdelaide
52%
50%
42%
57%
57%
44%
67%
37%
31%
64%
62%
73%
24%
21%
58%
51%
58%
45%
32%
49%
38%
65%
42%
32%
50%
63%
28%
29%
48%
50%
32%
78%
36%
17%
39%
33%
60%
32%
9%
47%
Note: Percentage of survey respondents who agreed that their city had these liveability attributes.
Source: PCA 2011

• 143 •
Chapter 5 Liveability • State of Australian Cities 2011
Quality of life and community wellbeingQuality of life and community wellbeing are two mutually reinforcing aspects of how liveability of a city is experienced. Quality of life relates to the experience of individuals and households that make up a population, whereas community wellbeing relates to how quality of life is experienced by the population as a whole, and in particular to social interaction and how well people ‘get along’ together.
OECD Better Life Index Since 1961, the Organisation for Economic Cooperation and Development (OECD) has primarily used GDP to measure economic and social progress. For the past decade the OECD has been developing new measures of good quality of life to identify the best way to measure the progress of societies – moving beyond GDP and examining the areas that impact on people’s lives such as security, leisure, income distribution and a clean environment. The OECD has identified 11 dimensions as essential to well-being, known as the Better Life Index. The index includes indicators for housing, income, employment, education, local environment, health, safety, richness of community ties, overall satisfaction with life and work life balance.
Where all the indicators are equally weighted, Australia ranks amongst the top five OECD countries on a score out of 10 on the Better life index (Figure 5.2).
Figure 5.2 OECD Your better life index, 2011 Aggregate of score data
Turk
ey
Mexico
Chile
Esto
nia
Hunga
ry
Portu
gal
Slova
k Rep
ublic
Greec
e
Polan
dKor
ea ItalySp
ain
Czech
Rep
ublic
Israe
l
Slove
nia
Irelan
d
Fran
ce
German
y
Belgi
um
Luxe
mbour
g
Austri
a
United
King
dom
Japan
Finlan
d
United
State
s
Nether
lands
Switz
erlan
d
Denmar
k
Norway
Austra
lia
Canad
a
Swed
en
New Z
ealan
d
Icelan
d
0
1.00
2.00
3.00
5.00
4.00
9.00
8.00
7.00
6.00
OEC
D a
ggre
gate
sco
re
Note: * Aggregate score has been calculated as the sum of score data for each of 20 indicators across 11 topics divided by the number of scores where data is available. Imputed values have not been used.
Source: OECD 2011a
• 144 •
Department of Infrastructure and Transport • Major Cities Unit
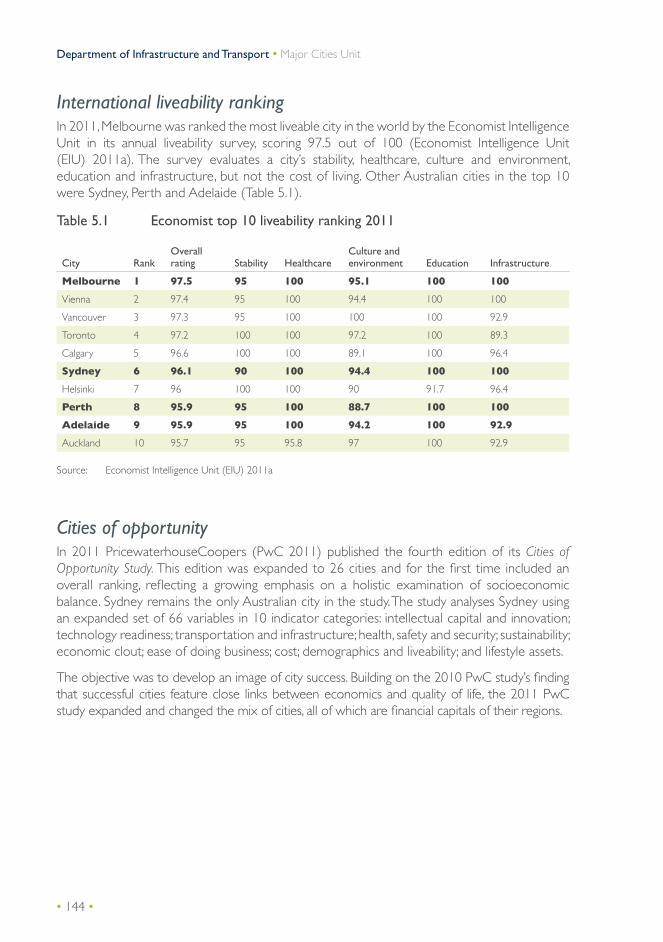
International liveability rankingIn 2011, Melbourne was ranked the most liveable city in the world by the Economist Intelligence Unit in its annual liveability survey, scoring 97.5 out of 100 (Economist Intelligence Unit (EIU) 2011a). The survey evaluates a city’s stability, healthcare, culture and environment, education and infrastructure, but not the cost of living. Other Australian cities in the top 10 were Sydney, Perth and Adelaide (Table 5.1).
Table 5.1 Economist top 10 liveability ranking 2011
City RankOverall rating Stability Healthcare
Culture and environment Education Infrastructure
Melbourne 1 97.5 95 100 95.1 100 100
Vienna 2 97.4 95 100 94.4 100 100
Vancouver 3 97.3 95 100 100 100 92.9
Toronto 4 97.2 100 100 97.2 100 89.3
Calgary 5 96.6 100 100 89.1 100 96.4
Sydney 6 96.1 90 100 94.4 100 100
Helsinki 7 96 100 100 90 91.7 96.4
Perth 8 95.9 95 100 88.7 100 100
Adelaide 9 95.9 95 100 94.2 100 92.9
Auckland 10 95.7 95 95.8 97 100 92.9
Source: Economist Intelligence Unit (EIU) 2011a
Cities of opportunity In 2011 PricewaterhouseCoopers (PwC 2011) published the fourth edition of its Cities of Opportunity Study. This edition was expanded to 26 cities and for the first time included an overall ranking, reflecting a growing emphasis on a holistic examination of socioeconomic balance. Sydney remains the only Australian city in the study. The study analyses Sydney using an expanded set of 66 variables in 10 indicator categories: intellectual capital and innovation; technology readiness; transportation and infrastructure; health, safety and security; sustainability; economic clout; ease of doing business; cost; demographics and liveability; and lifestyle assets.
The objective was to develop an image of city success. Building on the 2010 PwC study’s finding that successful cities feature close links between economics and quality of life, the 2011 PwC study expanded and changed the mix of cities, all of which are financial capitals of their regions.

• 145 •
Chapter 5 Liveability • State of Australian Cities 2011
The study reports that Sydney:
• is in the top five cities in terms of overall ranking (Figure 5.3)
• ranks second for sustainability and demographics and liveability
• ranks fourth for health, safety and security
• is in the middle group (17th) for technology readiness (which includes internet access in schools, broadband quality, and software and multimedia development and design)
• is in the middle group (15th) for transportation and infrastructure, top scoring with the miles of mass transit track indicator and at the bottom for cost of public transport.
Figure 5.3 PwC Cities of Opportunity score, international cities
New York
Toronto
San Francisco
Stockholm
Sydney
London
Chicago
Paris
Singapore
Hong Kong
Houston
Los Angeles
Berlin
Tokyo
Madrid
Seoul
Beijing
Abu Dhabi
Shanghai
Mexico City
Moscow
Santiago
Istanbul
São Paulo
Johannesburg
Mumbai
200 400 600 800 1 000 1 2000 1 400
Source: PwC 2011

• 146 •
Department of Infrastructure and Transport • Major Cities Unit
Four of the PwC Cities of Opportunity indicator dimensions are detailed in Table 5.2, illustrating Sydney’s strengths in demographics liveability and intellectual capital compared with the other 25 cities in the study, as well as two areas, technology readiness and transportation and infrastructure where some other cities have an advantage.
Each of the dimensions is made up of a range of indicators as described below:
• Demographics and liveability considered the size of a city’s working-age population and speed of workers’ commutes, housing stock, quality of living and life satisfaction, heat and humidity, and the risk of natural disaster.
• Intellectual capital is a source of innovation that drives a nation’s social and economic development. Stockholm is significantly ahead of other cities in this category. Sydney ranked first for libraries with public access, second for percentage of domestic expenditure on research and development, and third for research performance of top universities. Conversely, Sydney ranked 13th for entrepreneurial environment and 12th for class size.
• Technology readiness illustrates the software, hardware and bandwidth required for economic and academic progress. Analysis shows a strong positive correlation between cities with robust information and communications technology and strong intellectual assets (PwC 2011). New York, Seoul, Stockholm, San Francisco, Chicago, Singapore and Hong Kong have been able to leverage high-technology and attract large numbers of technical people and related investors. Sydney ranked in the middle against the three variables of internet access in schools, broadband quality, and digital economy, and was 21st for software and multimedia development and design.
• The city rankings for ‘cost of public transport’ tend to be lower when rankings for housing, quality of living or literacy and enrolment in secondary and tertiary education are higher. This suggests that a relatively higher cost of public transport is acceptable if the system provides access and convenience to citizens. Sydney was the lowest ranked city against the cost of public transport but was at the top for ‘miles of mass transit track’, which is the total miles of metro, tram and light rail track within a city per 100,000 people. (PwC 2011)

• 147 •
Chapter 5 Liveability • State of Australian Cities 2011
Table 5.2 PwC Cities of Opportunity city rankings for selected indicators
Demography andLiveability
Intellectual Capitaland Innovation
TechnologyReadiness
Transportationand Infrastructure
Stockholm 26 Stockholm 26 New York 26 Paris 26
Sydney 25 Toronto 25 Seoul 25 Chicago 25
Toronto 24 San Francisco 24 Stockholm 24 New York 24
San Francisco 23 New York 24 San Francisco 23 San Francisco 23
Los Angeles 22 Paris 22 Chicago 22 Madrid 22
Madrid 22 Los Angeles 21 Singapore 21 Tokyo 21
Berlin 20 Sydney 20 Hong Kong 20 Hong Kong 20
Paris 19 Houston 20 Los Angeles 19 London 20
Chicago 19 Tokyo 20 Houston 18 Seoul 18
Houston 19 Chicago 17 Tokyo 18 Mexico City 17
S ngapore 16 London 16 London 16 Stockholm 17
Abu Dhabi 15 Berlin 15 Toronto 15 Be j ng 15
Hong Kong 14 Seoul 14 Paris 14 Sydney 14
New York 13 Madrid 13 Moscow 13 Moscow 13
Sao Paulo 12 Singapore 12 Berl n 12 Shanghai 12
Mexico City 11 Hong Kong 11 Sydney 11 Toronto 12
Seoul 10 Moscow 10 Shanghai 11 Singapore 10
London 10 Shanghai 9 Beijing 9 Berlin 9
Tokyo 8 Be j ng 8 Madrid 8 Abu Dhabi 8
Be j ng 7 Mexico City 8 Istanbul 7 Istanbul 7
Santiago 6 Abu Dhabi 6 Sao Paulo 6 Los Angeles 6
Istanbul 5 Santiago 5 Santiago 6 Houston 5
Johannesburg 4 Sao Paulo 4 Abu Dhabi 4 Santiago 4
Mumbai 3 Johannesburg 3 Mexico City 3 Sao Paulo 3
Shanghai 3 Mumbai 2 Mumbai 2 Mumbai 3
Moscow 1 Istanbul 1 Johannesburg 1 Johannesburg 1
Source: Adapted from PwC 2011

• 148 •
Department of Infrastructure and Transport • Major Cities Unit
Inequality and social outcomesWilkinson and Pickett’s (2010) research published in the book The Spirit Level examines international data that relates inequality at a national scale to a range of social development measures including health, social relations and human capital. They found that health and social problems are worse in more unequal countries, as shown in Figure 5.4.
Figure 5.4 International comparisons of income inequality and health and social outcomes
Better
Worse
HighLowIncome inequality
Hea
lth a
nd s
ocia
l out
com
es
AustraliaAustriaCanadaDenmark
Finland
FranceGermany
GreeceIreland
Italy
Japan
Netherlands
New Zealand
Norway
Portugal
Spain
Sweden
Switzerland
UK
USA
Belgium
Social and health outcomes based on a combined index of
• Life expectancy
• Maths and literacy
• Infant mortality
• Homicides
• Imprisonment
• Teenage births
• Trust
• Obesity
• Mental illness (including drug and alcohol addiction)
• Social mobility
Source: Wilkinson and Pickett 2010
• 149 •
Chapter 5 Liveability • State of Australian Cities 2011
Quality of life of individuals and households and the social and health outcomes for urban communities are closely associated with the natural and built environments of the cities. The next section of this chapter describes some of the aspects of the built and natural environments in Australian major cities that affect liveability.
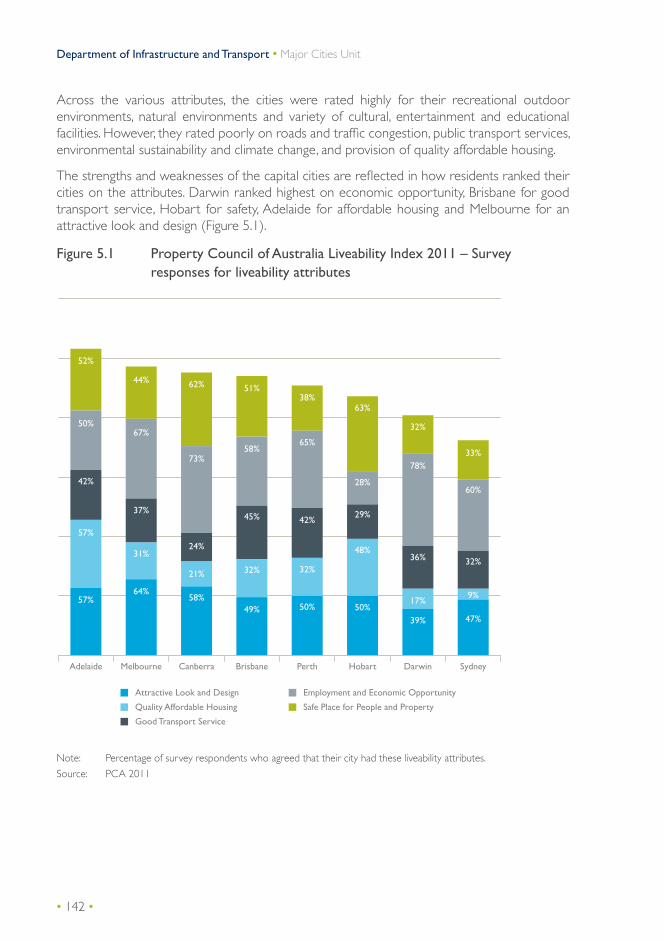
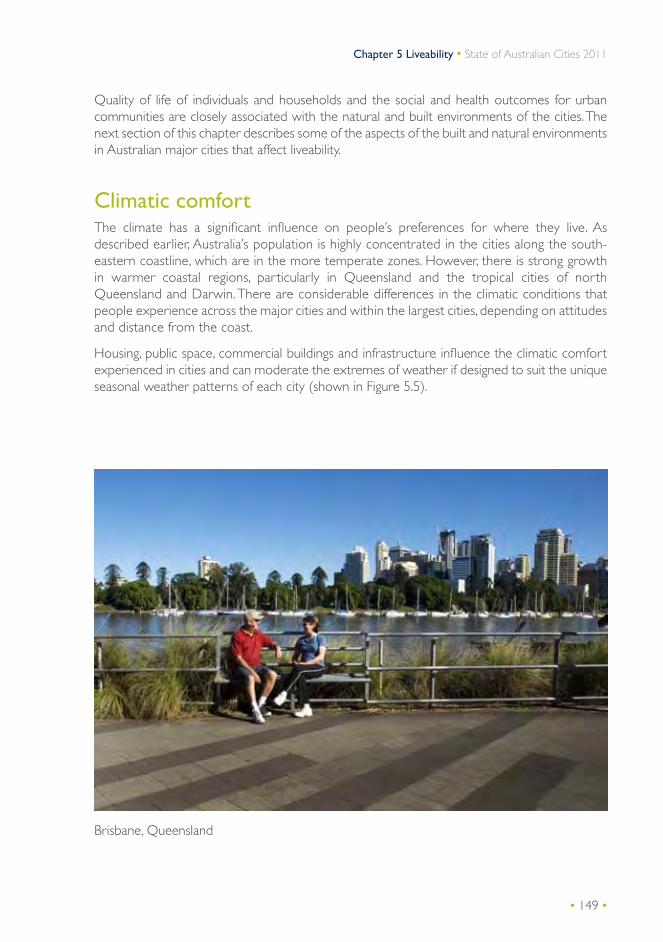
Climatic comfortThe climate has a significant influence on people’s preferences for where they live. As described earlier, Australia’s population is highly concentrated in the cities along the south-eastern coastline, which are in the more temperate zones. However, there is strong growth in warmer coastal regions, particularly in Queensland and the tropical cities of north Queensland and Darwin. There are considerable differences in the climatic conditions that people experience across the major cities and within the largest cities, depending on attitudes and distance from the coast.
Housing, public space, commercial buildings and infrastructure influence the climatic comfort experienced in cities and can moderate the extremes of weather if designed to suit the unique seasonal weather patterns of each city (shown in Figure 5.5).
Brisbane, Queensland

• 150 •
Department of Infrastructure and Transport • Major Cities Unit
Figure 5.5 Mean rainfall and temperatures 1992 to 2011, major cities

• 151 •
Chapter 5 Liveability • State of Australian Cities 2011
Source: Bureau of Meteorology 2011

• 152 •
Department of Infrastructure and Transport • Major Cities Unit
HousingThe availability of suitable and affordable housing and the type and distribution of residential development are fundamental to the liveability of cities and the wellbeing of individuals and households.
Housing supplyThe National Housing Supply Council (NHSC) 2010 State of Supply report concluded that there is a substantial and growing undersupply of housing in Australia. It also showed that while the impact of the global financial crisis on Australia has been less pervasive and severe than in other advanced economies, the financial crisis has led to some tightening in lending criteria among lending institutions, making access to credit more difficult for residential property developers and to a lesser extent, for some residential purchasers. A longer-lasting effect of the crisis on supply is likely to be reduced multi-unit development because of the effect of the crisis on financing structures for such developments in Australia (NHSC 2010).
The actual number of dwelling units commenced nationally in 2008–09 was 131,600, which was significantly below the 158,500 dwelling units commenced in 2007–08 and the 152,200 dwelling units commenced in 2006–07 (NHSC 2010).
The NHSC identified that the net dwelling supply gap increased from 23,400 dwellings in 2002 to 178,400 dwellings in 2009 as shown Figure 5.6, and detailed in Table 5.3.
Figure 5.6 Change in dwelling demand and supply, Australia 2002 to 2009
2002
2003
2004
2005
2006
2007
2008
2009
Annual net dwelling supply gap
Annual net dwelling supply growth Annual underlying dwelling demand
Num
ber
of d
wel
lings
(th
ousa
nds)
0
50
100
150
200
250
Source: NHSC 2010

• 153 •
Chapter 5 Liveability • State of Australian Cities 2011
Table 5.3 Estimates of the net dwelling supply gap for 2002 to 2009 using 2001 as a base year, Australia
Change in underlying demand – number of dwelling units(‘000s)
Supply growth, net of demolitions, with allowance for unoccupied dwellings excluding 'Resident absent'
Net dwelling supply gap 2002–2009 based on the difference between change in underlying demand and supply adjusted for demolitions and unoccupied dwellings
2002 138.1 114.7 23.4
2003 139.7 132.9 30.2
2004 138.3 136.5 32
2005 137.1 139.5 29.6
2006 137.4 134.2 32.8
2007 162.1 128.4 66.5
2008 157.4 124.4 99.5
2009 205.9 127.1 178.4
Note: National Housing Supply Council est mates of underly ng demand for dwellings s nce June 2001.
Source: NHSC 2010
Not only has there been a national fall in dwelling approvals, there are also significant differences across States. Victoria and to a greater extent South Australia registered an above trend increase in both detached houses and medium and high density dwellings (Table 5.4). By contrast, Western Australian approvals fell for houses but rose for other dwelling types and Queensland approvals showed a significant fall in both housing types. The fall in approvals was most significant in New South Wales where approvals were well below the previous reporting period of State average monthly approvals and well below demand given the growth highlighted in Chapter 2.
Table 5.4 Houses and other dwellings, average monthly approvals and per cent change, January 1998 to December 2007 and January 2008 to December 2009
Houses Other dwelling types
Average monthly 1998-2007
Average monthly 2008-2009
Per cent change
Average monthly 1998-2007
Average monthly 2008-2009
Per cent change
NSW 1,927 1,253 -35 1,720 1,039 -40
Vic. 2,633 2,729 4 930 1,008 8
Qld. 2,112 1,907 -10 1,024 818 -20
SA 684 806 18 171 224 31
WA 1,514 1,441 -5 335 368 10
Subtotal for five States
9,208 8,554 -7 4,339 3,656 -16
Note: ‘Other dwelling types’ comprise apartments, terraced houses and other med um density dwell ngs as well as about one per cent non-residential dwell ngs (such as room ng house units).
Source: ABS 2010a

• 154 •
Department of Infrastructure and Transport • Major Cities Unit
Housing affordabilityGrowth in real house prices over the past decade has been strong both in capital cities and in other regions (Figure 5.7). Based on ABS House Price Index data (ABS 2011a), real house prices have more than doubled since 1995.
Figure 5.7 Growth in real house prices 1995 to 2009
Rest of AustraliaCapital Cities
Inde
x
50
100
150
200
250
300
200920082006200520042003200120001999199819961995
Note: Housing Price Index June 1995=100 deflated by CPI
Source: Unpublished data from ABS, APM (Australian Property Monitors), RBA (Reserve Bank of Australia)
A recent research discussion paper by the Reserve Bank of Australia (RBA) has confirmed that house prices within Australia’s major cities tend to be higher in closer proximity to city centres (Kulish, Richards and Gillitzer 2011). An analysis of selected suburbs in Sydney found that average land values for suburbs within four kilometres of the CBD were around 16 times higher than in suburbs more than 50 kilometres from the CBD. The report suggests that the rapid growth of house prices in inner suburbs reflects changes in population and incomes. It also proposes that these findings highlight changing preferences where households value proximity to the CBD due to poor transport infrastructure and higher transport costs, in addition to constraints in the supply of appropriately zoned land and well-located housing.
The paper also reported that house prices tend to be higher in waterfront suburbs. The ‘waterfront effect’ was reported to be largest in Sydney and Perth, adding around 50 per cent to house prices, and lowest in Brisbane and Adelaide (Kulish, Richards and Gillitzer 2011). This phenomenon was also recorded in cities outside of the capitals.

• 155 •
Chapter 5 Liveability • State of Australian Cities 2011
Prices in capital cities were found to have increased around one percentage point faster per year than those in cities outside of the capitals (Kulish, Richards and Gillitzer 2011). This was attributed to constraints in the construction of new housing in capital cities relative to non-capital cities. The cities with the largest populations – Sydney and Melbourne – had the highest house prices. On average house prices grew faster than apartment prices, which the paper suggested was due to an increase in the price of land in capital cities rather than the housing structures themselves.
The recent growth in house prices largely reflects increases in the prices of existing houses. Since the early 2000s, the real prices of houses (when compared to inflation) have increased substantially with real construction costs growing more modestly. Land has made up a growing share of house prices, increasing from 53 per cent to 61 per cent in the 15 years to March 2009. However, increasing construction costs are responsible for a higher proportion of the increase in house prices in some regional sub-markets, particularly in resource towns (ABS 2011a).
Whittlesea, Victoria

• 156 •
Department of Infrastructure and Transport • Major Cities Unit
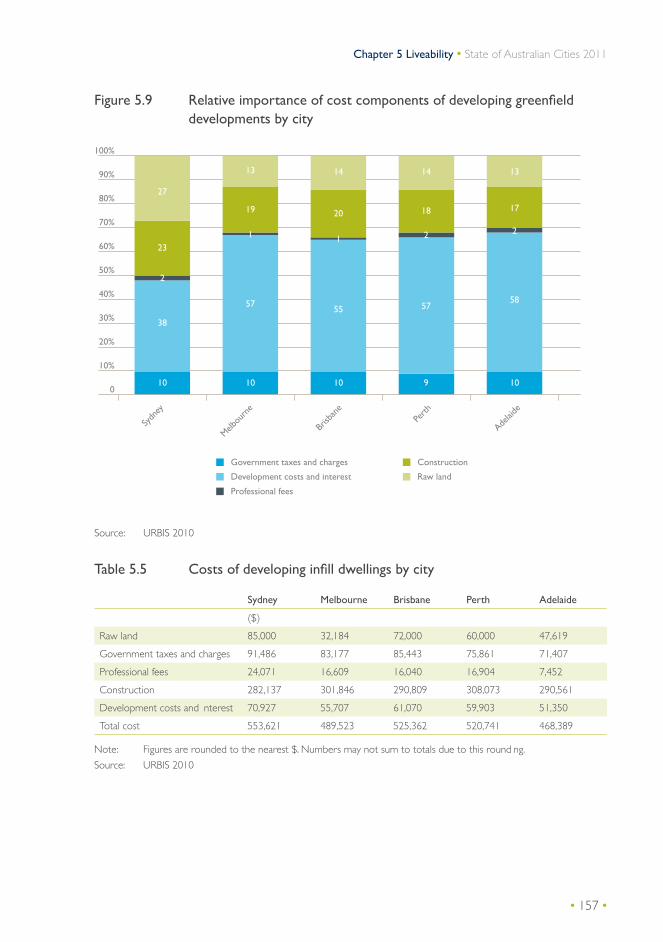
Government taxes and charges, local government fees and infrastructure charges form a major component of real house prices. Such costs have been calculated in the recent National Dwelling Costs Study Report 2010 (Urbis 2010). Areas with ageing inner urban infrastructure costs carry additional issues with a mix of historic and wider catchment servicing costs. Greenfield sites are more amenable to full cost recovery as part of new service infrastructure construction (Figure 5.8 and Figure 5.9).The report raises questions about the relative affordability and sustainability of infill compared to greenfield development.
Infill areas with ageing urban infrastructure may require additional costs of replacing and expanding capacity Greenfield sites, on the other hand, may be more amenable to full cost recovery (where costs of construction of new infrastructure are included in the dwelling sale price. (Figure 5.8 and Figure 5.9).
Figure 5.8 Relative importance of cost components of developing infill developments by city
0
10%
20%
30%
40%
50%
60%
70%
80%
100%
90%
Government taxes and charges Construction
Development costs and interest
Professional fees
Raw land
Sydn
ey
Melbou
rne
Brisb
ane
Perth
Adelai
de
157
17
3
62
11
14
16
3
55
12
12
15
3
58
12
10
15
2
62
11
17
4
51
13
Source: URBIS 2010
• 157 •
Chapter 5 Liveability • State of Australian Cities 2011
Figure 5.9 Relative importance of cost components of developing greenfield developments by city
0
10%
20%
30%
40%
50%
60%
70%
80%
100%
90%
Government taxes and charges Construction
Development costs and interest
Professional fees
Raw land
Sydn
ey
Melbou
rne
Brisb
ane
Perth
Adelai
de
27
13
19
1
57
10
14
20
1
55
10
14
18
2
57
9
13
17
2
58
10
23
2
38
10
Source: URBIS 2010
Table 5.5 Costs of developing infill dwellings by city
Sydney Melbourne Brisbane Perth Adelaide
($)
Raw land 85,000 32,184 72,000 60,000 47,619
Government taxes and charges 91,486 83,177 85,443 75,861 71,407
Professional fees 24,071 16,609 16,040 16,904 7,452
Construction 282,137 301,846 290,809 308,073 290,561
Development costs and nterest 70,927 55,707 61,070 59,903 51,350
Total cost 553,621 489,523 525,362 520,741 468,389
Note: Figures are rounded to the nearest $. Numbers may not sum to totals due to this round ng.
Source: URBIS 2010
• 158 •
Department of Infrastructure and Transport • Major Cities Unit
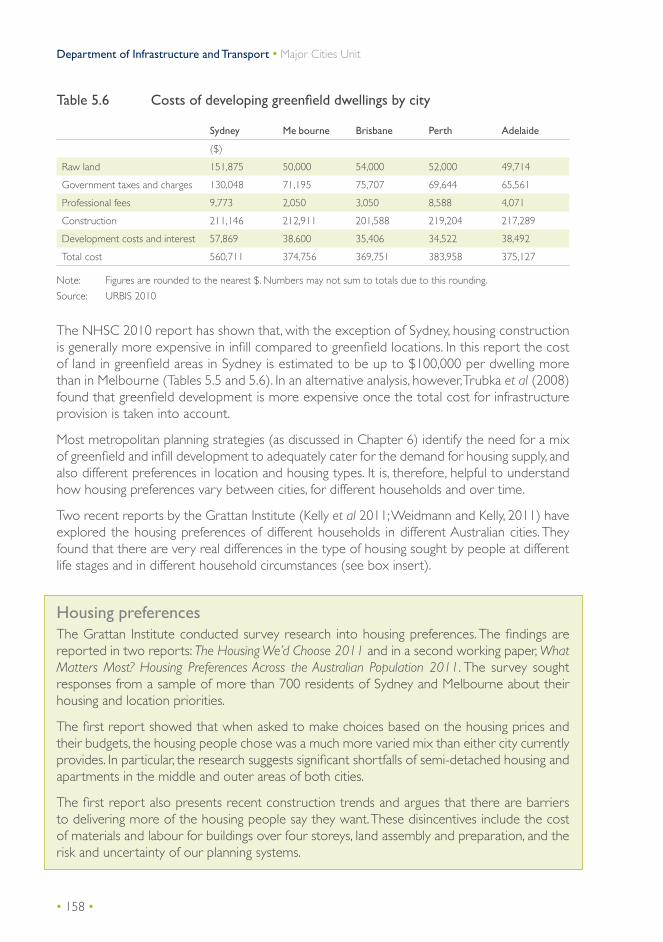
Table 5.6 Costs of developing greenfield dwellings by city
Sydney Me bourne Brisbane Perth Adelaide
($)
Raw land 151,875 50,000 54,000 52,000 49,714
Government taxes and charges 130,048 71,195 75,707 69,644 65,561
Professional fees 9,773 2,050 3,050 8,588 4,071
Construction 211,146 212,911 201,588 219,204 217,289
Development costs and interest 57,869 38,600 35,406 34,522 38,492
Total cost 560,711 374,756 369,751 383,958 375,127
Note: Figures are rounded to the nearest $. Numbers may not sum to totals due to this rounding.
Source: URBIS 2010
The NHSC 2010 report has shown that, with the exception of Sydney, housing construction is generally more expensive in infill compared to greenfield locations. In this report the cost of land in greenfield areas in Sydney is estimated to be up to $100,000 per dwelling more than in Melbourne (Tables 5.5 and 5.6). In an alternative analysis, however, Trubka et al (2008) found that greenfield development is more expensive once the total cost for infrastructure provision is taken into account.
Most metropolitan planning strategies (as discussed in Chapter 6) identify the need for a mix of greenfield and infill development to adequately cater for the demand for housing supply, and also different preferences in location and housing types. It is, therefore, helpful to understand how housing preferences vary between cities, for different households and over time.
Two recent reports by the Grattan Institute (Kelly et al 2011; Weidmann and Kelly, 2011) have explored the housing preferences of different households in different Australian cities. They found that there are very real differences in the type of housing sought by people at different life stages and in different household circumstances (see box insert).
Housing preferencesThe Grattan Institute conducted survey research into housing preferences. The findings are reported in two reports: The Housing We’d Choose 2011 and in a second working paper, What Matters Most? Housing Preferences Across the Australian Population 2011. The survey sought responses from a sample of more than 700 residents of Sydney and Melbourne about their housing and location priorities.
The first report showed that when asked to make choices based on the housing prices and their budgets, the housing people chose was a much more varied mix than either city currently provides. In particular, the research suggests significant shortfalls of semi-detached housing and apartments in the middle and outer areas of both cities.
The first report also presents recent construction trends and argues that there are barriers to delivering more of the housing people say they want. These disincentives include the cost of materials and labour for buildings over four storeys, land assembly and preparation, and the risk and uncertainty of our planning systems.

• 159 •
Chapter 5 Liveability • State of Australian Cities 2011
The second working paper found that although it is often assumed that living in a separate house on a large block of land is what most Australians want, ‘whether the house is detached’ was only the fifth most important variable while having a big garden was ranked 20th.
The data presented in the second report also suggests that there are real differences in priorities across the population. In particular, while young families were focused on house size and type, older and single-person households were much more likely to think that characteristics of where they live are more important. Given our ageing population and the growth of smaller households, these differences could result in significant shifts in the mix of dwelling stock (Kelly et al 2011; Weidmann and Kelly, 2011).
Multi-unit dwellingsAustralia is witnessing an increasing trend toward inner-city living and increased urban density. An ageing population, shrinking household sizes, lifestyle choices and government policies aimed at increasing urban density are all part of this trend.
State of Australian Cities 2010 described the composition of existing dwelling stock across each of the major cities in Australia. Multi-unit residential buildings (also known as flats, units or apartments) are mostly located in the older inner suburbs. In the most recent ABS Survey of Housing Occupancy and Costs 2007-08, Sydney had the highest proportion of apartment-dwellers of the capital cities. Almost one quarter (24 per cent) of Sydney’s resident population lived in flats, units or apartments.
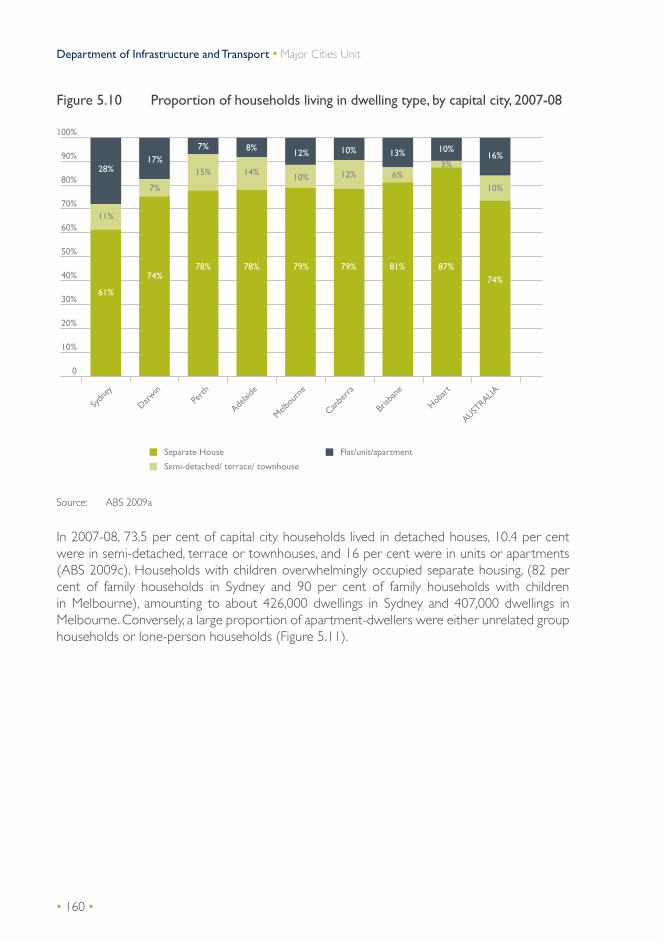
Multi-unit dwellings were home to 28 per cent of Sydney households. In contrast, just 7.1 per cent of households in Perth and 8.4 per cent of households in Adelaide lived in flats, units or apartments (ABS 2009a) (Figure 5.10).
• 160 •
Department of Infrastructure and Transport • Major Cities Unit
Figure 5.10 Proportion of households living in dwelling type, by capital city, 2007-08
0
10%
20%
30%
40%
50%
60%
70%
80%
100%
90%
Separate House Flat/unit/apartment
Semi-detached/ terrace/ townhouse
Sydn
ey
Darwin
Perth
Adelai
de
Melbou
rne
Canbe
rra
Brisb
ane
AUSTRALIA
Hobar
t
16%
10%
74%
10%
3%
87%
13%
6%
81%
10%
12%
79%
12%
10%
79%
8%
14%
78%
7%
15%
78%
17%
7%
74%
28%
11%
61%
Source: ABS 2009a
In 2007-08, 73.5 per cent of capital city households lived in detached houses, 10.4 per cent were in semi-detached, terrace or townhouses, and 16 per cent were in units or apartments (ABS 2009c). Households with children overwhelmingly occupied separate housing, (82 per cent of family households in Sydney and 90 per cent of family households with children in Melbourne), amounting to about 426,000 dwellings in Sydney and 407,000 dwellings in Melbourne. Conversely, a large proportion of apartment-dwellers were either unrelated group households or lone-person households (Figure 5.11).

• 161 •
Chapter 5 Liveability • State of Australian Cities 2011
Figure 5.11 Proportion of population and household types by dwelling type, Sydney and Melbourne, 2006
0 10 20 30 40 50 60 70 80 90 100
MELBOURNE - all households
Group household
Lone person household
One parent family
Couple family with children
Couple family with no children
SYDNEY - all households
Group household
Lone person household
One parent family
Couple family with children
Couple family with no children
Flat, unit or apartment
Household composition
Separate HouseSemi detached, town houses
14.811.3
73.3
23.411.8
64.1
17.814.1
67.5
49.815.9
33.142.6
14.641
9.58.7
23.511.7
64.2
81.5
3419.6
45.530.9
16.751.2
1110.6
78
12.711.8
75
3.86.3
89.6
Source: BITRE analysis of ABS Census of Population and Housing 2006
The importance of designing higher-density residential development to accommodate a greater diversity of households has been highlighted in recent research for the Victorian Department of Health into the experiences of 40 children growing up in high-rise housing in Melbourne (Whitzman and Mizrachi 2009). This research found that children who lived within an 800 metre radius from their school or within 300 metres of local green space were more likely to access those spaces independently than children who had to travel further. Accessibility and proximity to home, amenity and the range of play and socialisation opportunities are important influences on children’s environmental experience.

• 162 •
Department of Infrastructure and Transport • Major Cities Unit
Strata and community titleMulti-unit residential dwellings in Australian cities generally fall under strata or community title. Existing apartment buildings range in age from 1930s-style walk-up flats, to 1960s mid- to high-rise apartment blocks, to townhouse and high-rise blocks from the 1970s and 1980s. Newer apartment buildings are generally aimed at mid- to high-income households, while the more affordable options are available in older apartment buildings.
As these buildings age, the costs of maintenance and operations are of increasing concern to owner-occupiers and landlords. Sinking-fund and administrative costs are increasing, and many are hit with special levies to cover unexpected large costs such as concrete cancer, lift replacements or major structural repairs. Repairs and maintenance can increase the cost of housing for both owners and renters.
It is argued that no satisfactory process has yet been devised to deal with blocks that are at the end of their physical or economic life (Sherry, 2006).
TenureAs the average household size decreases, the number of households in Australia is growing at a faster rate than the population, resulting in greater demand for housing. Many Australians change housing at different life stages and move for education or employment, when they become partnered, when they have children and for lifestyle reasons.
Some households are compelled to move because of the cost of housing. The security of tenure of private renters is also influenced by the decisions of their landlords. In 2007–08, 56 per cent of private renters had a fixed period lease of six or 12 months and a further 20 per cent had either a month by month or other fixed period lease arrangement.
Renters from State or Territory housing authorities on the other hand were more likely to have an indefinite tenure arrangement (78 per cent).
Housing tenure is strongly associated with dwelling structure and other built forms. Data from the 2006 Census shows a substantially larger proportion of renters in attached dwellings (including both medium density dwellings like townhouses and villas and higher density flats, units and apartments) and a larger proportion of owner-occupiers live in detached dwellings (houses).
In Sydney and Melbourne there was also a large proportion of low income families who were renters in flats or high-density dwellings. Low-income households were defined as having a gross household weekly income of less than $1,200, approximately the median income based on the 2006 Census. A larger proportion of Sydney renters are in high density dwellings (61 per cent) than Melbourne renters (48 per cent).

• 163 •
Chapter 5 Liveability • State of Australian Cities 2011
Figure 5.12 Sydney dwelling tenure: Low income mobile households and total households
0
10%
20%
30%
40%
50%
60%
70%
80%
100%
90%
Separate House Low rise flat
Semi-detached High rise flat
Owne
r/Buy
er
Mobile
Hou
seho
ld
Owne
r/Buy
er To
tal
Renter
Mob
ile
House
hold
Renter
total
Oth
er te
nure
Mobile
Hou
seho
ld
Oth
er te
nure
Total
25%
16%
7%
52%
38%
23%
6%
33%
34%
22%
7%
37%
22%
22%
10%
46%
18%
22%
10%
51%
10%
8%
5%
77%
Source: BITRE analysis of Census of Population and Hous ng 2006.
• 164 •
Department of Infrastructure and Transport • Major Cities Unit
Figure 5.13 Melbourne dwelling tenure: Low income mobile households and total households
0
10%
20%
30%
40%
50%
60%
70%
80%
100%
90%
Separate House Low rise flat
Semi-detached High rise flat
Owne
r/Buy
er
Mobile
Hou
seho
ld
Owne
r/Buy
er To
tal
Renter
Mob
ile
House
hold
Renter
total
Oth
er te
nure
Mobile
Hou
seho
ld
Oth
er te
nure
Total
6% 2%8%
6%
84%
19% 16%
29%
13%
43% 52%
15%
21%
12% 7%
17%
16%
60%
30%
12%
39%
17%
10%
67%
Source: BITRE analysis of Census of Population and Housing 2006
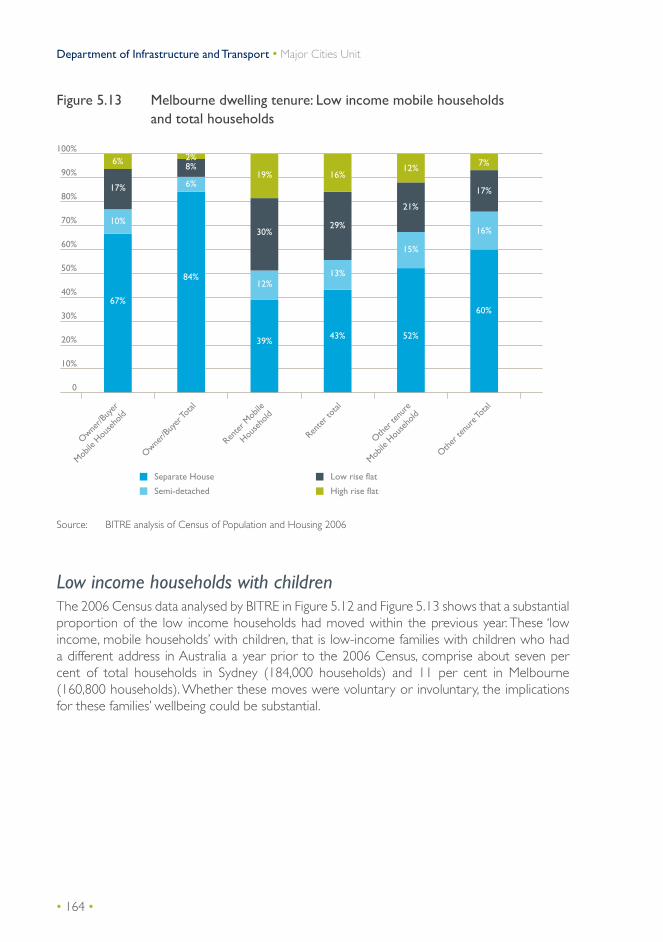
Low income households with childrenThe 2006 Census data analysed by BITRE in Figure 5.12 and Figure 5.13 shows that a substantial proportion of the low income households had moved within the previous year. These ‘low income, mobile households’ with children, that is low-income families with children who had a different address in Australia a year prior to the 2006 Census, comprise about seven per cent of total households in Sydney (184,000 households) and 11 per cent in Melbourne (160,800 households). Whether these moves were voluntary or involuntary, the implications for these families’ wellbeing could be substantial.

• 165 •
Chapter 5 Liveability • State of Australian Cities 2011
HomelessnessState of Australian Cities 2010 reported rates of homelessness based on the 2006 Census.
A new data collection, the Specialist Homelessness Services collection, is being developed by the Australian Institute of Health and Welfare (AIHW) to provide better information about people who are homeless, the pathways people take in and out of homelessness, and the types of work that homelessness agencies undertake. Information collected will include whether a client has a diagnosed mental illness or was undergoing treatment for mental health issues, and previous episodes of homelessness. People turned away from homelessness agencies will also be recorded and, for the first time, children will be counted as individual clients.
The Specialist Homelessness Services collection, jointly funded by Federal, State and Territory governments, is expected to be published in 2012 to provide more information for the Australian Government’s homelessness strategy.
Living affordabilityWhile housing comprises the largest proportion of household expenditure, there are other costs of living which influence the affordability of cities. The ABS Household Expenditure Survey, conducted every five years, collects information on household expenditure on housing, transport, energy, water and a range of consumer goods and services. This is an important source of information about the cost of living.
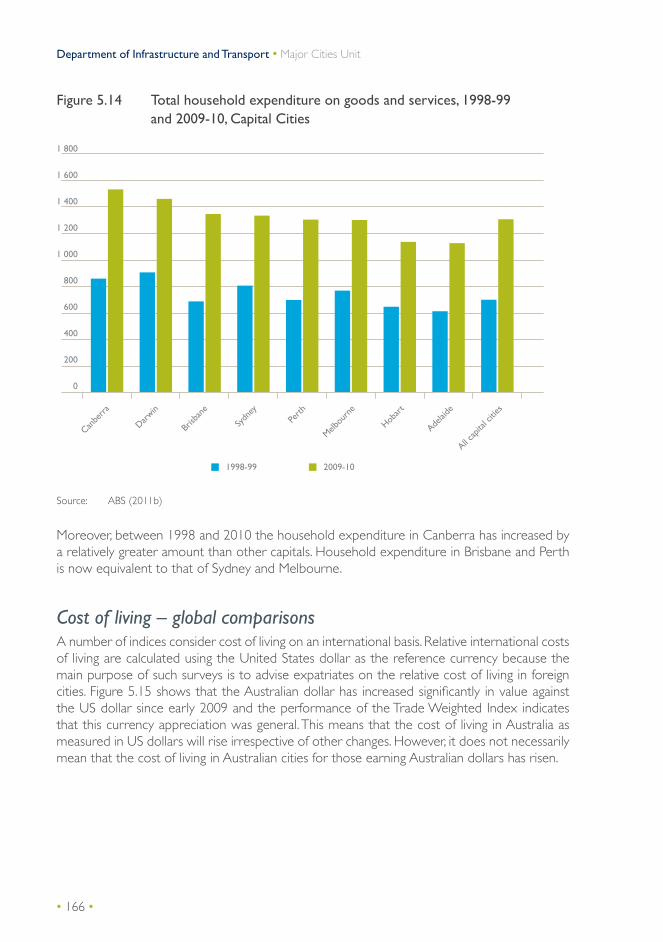
Data from the 2009–10 survey shows that Canberra households spend the most on goods and services in Australia, the average expenditure per household totalling $1,536 28 a week. Adelaide and Hobart had the lowest expenditure (Figure 5.14) (ABS 2011b).
• 166 •
Department of Infrastructure and Transport • Major Cities Unit
Figure 5.14 Total household expenditure on goods and services, 1998-99 and 2009-10, Capital Cities
1998-99 2009-10
Canbe
rra
Darwin
Brisb
ane
Sydn
eyPe
rth
Melbou
rne
Hobar
t
Adelai
de
All cap
ital c
ities
0
200
400
600
800
1 000
1 200
1 400
1 600
1 800
Source: ABS (2011b)
Moreover, between 1998 and 2010 the household expenditure in Canberra has increased by a relatively greater amount than other capitals. Household expenditure in Brisbane and Perth is now equivalent to that of Sydney and Melbourne.
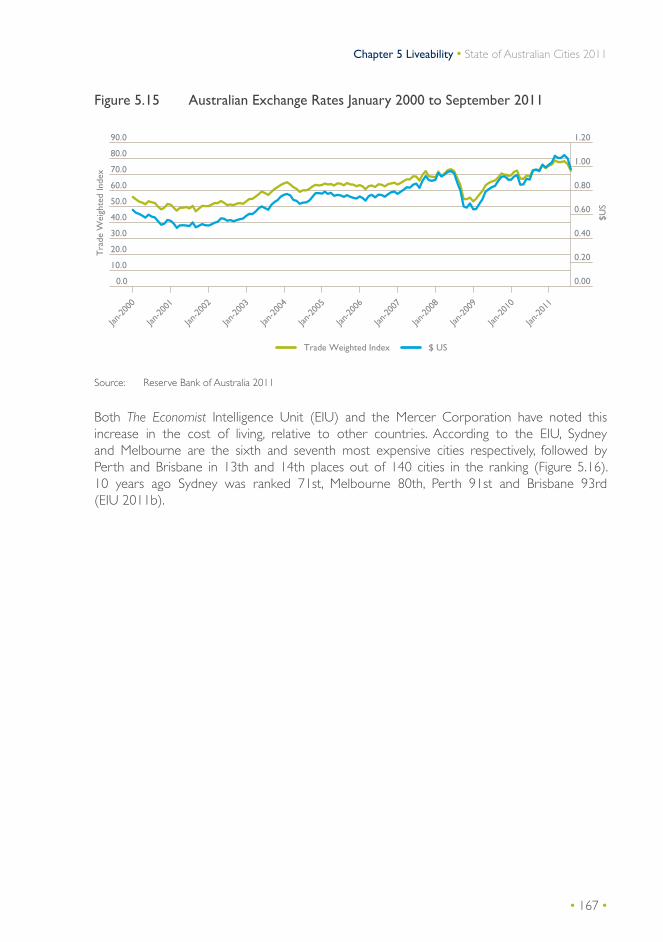
Cost of living – global comparisonsA number of indices consider cost of living on an international basis. Relative international costs of living are calculated using the United States dollar as the reference currency because the main purpose of such surveys is to advise expatriates on the relative cost of living in foreign cities. Figure 5.15 shows that the Australian dollar has increased significantly in value against the US dollar since early 2009 and the performance of the Trade Weighted Index indicates that this currency appreciation was general. This means that the cost of living in Australia as measured in US dollars will rise irrespective of other changes. However, it does not necessarily mean that the cost of living in Australian cities for those earning Australian dollars has risen.
• 167 •
Chapter 5 Liveability • State of Australian Cities 2011
Figure 5.15 Australian Exchange Rates January 2000 to September 2011
Trade Weighted Index $ US
$US
Tra
de W
eigh
ted
Inde
x
0.00
0.20
0.40
0.60
0.80
1.00
1.20
0.0
10.0
20.0
30.0
40.0
50.0
60.0
70.0
80.0
90.0
Jan-2
000
Jan-2
001
Jan-2
002
Jan-2
003
Jan-2
004
Jan-2
005
Jan-2
006
Jan-2
007
Jan-2
008
Jan-2
009
Jan-2
010
Jan-2
011
Source: Reserve Bank of Australia 2011
Both The Economist Intelligence Unit (EIU) and the Mercer Corporation have noted this increase in the cost of living, relative to other countries. According to the EIU, Sydney and Melbourne are the sixth and seventh most expensive cities respectively, followed by Perth and Brisbane in 13th and 14th places out of 140 cities in the ranking (Figure 5.16). 10 years ago Sydney was ranked 71st, Melbourne 80th, Perth 91st and Brisbane 93rd (EIU 2011b).

• 168 •
Department of Infrastructure and Transport • Major Cities Unit
Figure 5.16 The Economist’s relative cost of living index
0 20 40 60 80 100 120 140 160 180
Singapore - Singapore
Frankfurt - Germany
Melbourne - Australia
Sydney - Australia
Zurich - Switzerland
Paris - France
Osaka Kobe - Japan
Oslo - Norway
Tokyo - Japan
Geneva - Switzerland
123137
122138
133140
126141
128143
130148
145150
141153
147156
148161
Index in 2010 Current Index
Source: EIU 2011a
Mercer Corporation’s annual cost of living survey of 250 cities (2011) shows that the cost of living in Australian cities compared with cities in other countries has been rising over the past decade (Table 5.7 and Figure 5.17). The 2011 Mercer survey shows that since 2010, Sydney has jumped 10 places to be the 14th most expensive place to live. Melbourne moved from 33 to 21 and Perth jumped 30 places to be ranked 30th. Adelaide made the biggest jump to 46th, up 44 places. This recent movement corresponds to the recent strength of the Australian dollar, which appreciated by almost 14 per cent against the US dollar over the previous 12 months. In considering the cost of living it should be noted that the value of Australian wages, being paid in Australian dollars, has also increased.
The Mercer survey evaluates a range of goods and services, including housing, transport, food, clothing, household goods and entertainment. The main factors determining a city’s ranking are the relative strength or weakness of the national currency against the US dollar and price movements over the previous 12 months compared with those in New York City. As noted earlier in this section, Mercer’s analysis was developed primarily to advise on remuneration adjustments for United States expatriates.

• 169 •
Chapter 5 Liveability • State of Australian Cities 2011
Table 5.7 Mercer Cost of Living rankings 2010 and 2011
City 2010 rank 2011 rankChange in rank 2010-2011
Sydney 24 14 +10
Me bourne 33 21 +12
Perth 60 30 +30
Brisbane 55 31 +24
Canberra 74 34 +40
Adelaide 90 46 +44
Source: Mercer 2011
Figure 5.17 Change in Mercer cost of living rank, selected capital cities 2010 to 2011
1
91
81
71
61
51
41
31
21
101
14
21
30 3134
74
46
5560
33
24
11
Canberra AdelaideBrisbanePerthMelbourneSydney
March 2010 rank March 2011 rank
90
Note: Lower rank represents higher cost of living
Source: Mercer 2011

• 170 •
Department of Infrastructure and Transport • Major Cities Unit
Figure 5.18 Relative cost of one litre of unleaded 95 octane petrol, selected cities 2011
Cos
t in
$U
S
0.0
0.2
0.4
0.6
0.8
1.2
1.4
1.6
1.8
1.0
2.0
Luan
da
Mosco
w
New Yo
rk
Beijin
g
Van c
ouve
r
Buen
os A
ires
Johan
nes b
urg
Sydn
eyTo
kyo
Madrid
Dublin
Lond
onRom
ePa
ris
Note: Fuel prices fluctuate sign ficantly over short time periods, at time of writing Sydney’s petrol prices are closer to US$1.40
Source: Mercer 2010
Fuel as a commodity is less influenced by differences of local production and consumption, compared with other items included on the Mercer cost of living index like milk, coffee or a takeaway burger. As shown in Figure 5.18, the relative cost of fuel in Sydney is among the middle-ranked cities and notably less than the European cities apart from Moscow where there are national oil reserves. A large part of this difference is that as at September 2010, the tax component of the petrol price in Australia was the fourth lowest in the OECD (ACCC 2011).

• 171 •
Chapter 5 Liveability • State of Australian Cities 2011
HealthWhere people live, the lifestyles they lead and the types of housing and environments they inhabit, can affect their physical and mental health. Good health confers many benefits for individuals and their communities including better productivity, reduced health care costs, good social relations and increased life expectancy.
Urban living has both risks and benefits for human health. As noted in State of Australian Cities 2010 urban environments have a strong effect on public health concerns, with contributing factors being water and air quality, noise, temperature, access to open and green space, opportunities to exercise, and opportunities for social interaction. A higher proportion of people in the lowest socioeconomic groups suffer poor health, including obesity and mental illness.
Life expectancy is a standard measure of population health. In 2008, average life expectancy at birth in Australia was 81.5 years, more than two years higher than the OECD average (OECD 2011a). The life expectancy of Indigenous Australians is about 10 years less than those for non-Indigenous Australians (Figure 5.19).
Figure 5.19 Life expectancy for Aboriginal and Torres Strait Islander peoples and non-Indigenous peoples, 2005–2007
0
10
20
30
40
50
60
70
80
90
FemalesMales
Indigenous Australians Non-Indigenous People
67.2
78.7
72.9
82.6
Source: ABS 2009b
Chronic non-communicable diseases including cancer, cardiovascular disease, chronic respiratory conditions and diabetes are the main cause of death in OECD countries, accounting for three-quarters of all deaths in 2008 (OECD 2011a). It is a similar story in Australia with heart disease and stroke being the first and second most common causes of death (ABS 2011c).

• 172 •
Department of Infrastructure and Transport • Major Cities Unit
Many chronic diseases are strongly associated with modifiable lifestyles and behaviour. People who are physically active, drink moderately, do not smoke, eat plenty of fruit and vegetables, and have a normal weight have a much lower risk of early death than those with less healthy lifestyles.
These preventable diseases not only reduce overall life expectancy; they also lead to reduced productivity and ‘quality of life’ years and add a significant health burden to the economy.
The geographical distribution of risk behaviours and the incidence of chronic diseases within urban communities can be highly uneven, and greater detail on rates of incidence of chronic disease can be found in the Social Health Atlas of Australia 2011 published by the Public Health Information Development Unit (PHIDU) at the University of Adelaide.
Social Health Atlas of Australia The Social Health Atlas of Australia was first published in 1999 and uses data from the ABS National Health and related surveys. The website also hosts publications, interactive mapping and data sets on a broad range of health determinants across the life course. A major emphasis is on the development and publication of small area statistics for monitoring inequality in health and wellbeing. The Social Health Atlas of Australia adds to the body of evidence in Australia on the disparities in health that exist between groups in the population. People of low socioeconomic status (those who are relatively socially or economically deprived) experience worse health than those of higher socioeconomic status for almost every major cause of mortality and morbidity.
In a comprehensive review of literature concerned with the relationship between population health and built environments, Kent et al (2011) identify three domains of the built environment that support human health, namely;
• Physical activity – getting people active for travel and recreation
• Social interaction – connecting and strengthening communities through incidental interaction, planning and building community spaces and designing for crime prevention
• Nutrition – better access to healthy food and promoting responsible food advertising.
Where built environments do not support human health the outcomes are evident in the rates of the three major risk factors for chronic disease: physical inactivity, obesity and social isolation.

• 173 •
Chapter 5 Liveability • State of Australian Cities 2011
ObesityObesity rates are high in Australia relative to most OECD countries and have been increasing faster than in any other OECD country over the past two decades (Figure 5.20). More than 60 per cent of adults and 25 per cent of children are overweight or obese in Australia. The proportion of overweight people is projected by the OECD to rise a further 15 per cent over the next decade (OECD 2011b).
Figure 5.20 Past and projected overweight rates 1970 to 2020 for selected OECD countries
AustriaEnglandFranceSpainJapan (as measured, not self-reported)
USA
Projected ratesRecorded rates (self-reported)
AustraliaKoreaCanadaItaly
20%
30%
0%
40%
50%
60%
70%
80%
202020102000199019801970
Prop
ortio
n of
pop
ulat
ion
over
wei
ght
or o
bese
Source: OECD 2011b

• 174 •
Department of Infrastructure and Transport • Major Cities Unit
There is little difference between capital cities in the proportion of obese women but Darwin, Sydney and Melbourne stand out as having higher than average proportions of men who are obese as shown in Figure 5.21. Australian women with low education levels are 1.4 times more likely than more educated women to be overweight but this is a smaller risk than in many OECD countries. The gap is smaller, but not absent, in men (OECD 2011).
Figure 5.21 Proportion of overweight and obese males and females, over 18 years of age, for capital cities, 2007–08
Overweight Males Overweight Females
Obese Males Obese Females
0
10
20
30
40
50
60
70
HobartPerthMelbourneAdelaideCanberraSydneyBrisbaneDarwin
Perc
ent
of p
opul
atio
n
Note: Based on ABS 2009c
Source: PHIDU 2011
• 175 •
Chapter 5 Liveability • State of Australian Cities 2011
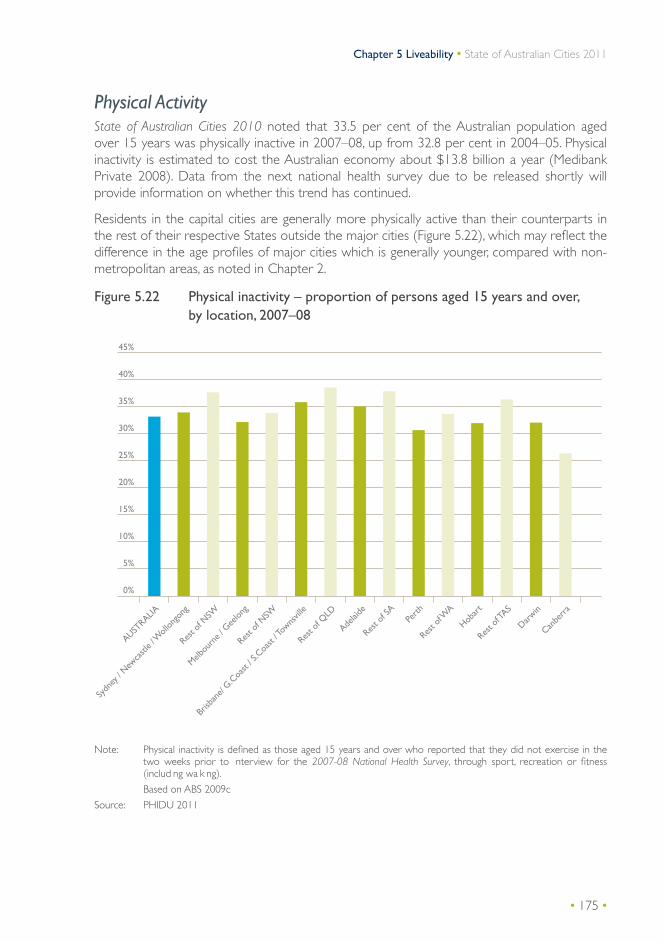
Physical ActivityState of Australian Cities 2010 noted that 33.5 per cent of the Australian population aged over 15 years was physically inactive in 2007–08, up from 32.8 per cent in 2004–05. Physical inactivity is estimated to cost the Australian economy about $13.8 billion a year (Medibank Private 2008). Data from the next national health survey due to be released shortly will provide information on whether this trend has continued.
Residents in the capital cities are generally more physically active than their counterparts in the rest of their respective States outside the major cities (Figure 5.22), which may reflect the difference in the age profiles of major cities which is generally younger, compared with non-metropolitan areas, as noted in Chapter 2.
Figure 5.22 Physical inactivity – proportion of persons aged 15 years and over, by location, 2007–08
0%
5%
10%
15%
20%
25%
30%
35%
40%
45%
Canbe
rra
Darwin
Rest o
f TAS
Hobar
t
Rest o
f WA
Perth
Rest o
f SA
Adelai
de
Rest o
f QLD
Brisb
ane/
G.Coa
st / S
.Coa
st / T
owns
ville
Rest o
f NSW
Melbou
rne /
Gee
long
Rest o
f NSW
Sydn
ey /
Newca
stle /
Woll
ongo
ng
AUSTRALIA
Note: Physical inactivity is defined as those aged 15 years and over who reported that they did not exercise in the two weeks prior to nterview for the 2007-08 National Health Survey, through sport, recreation or fitness (includ ng wa k ng).
Based on ABS 2009c
Source: PHIDU 2011

• 176 •
Department of Infrastructure and Transport • Major Cities Unit
Between the capitals, Canberra and Perth have the most physically active populations while the major cities of Queensland are the least active (Figure 5.23).
Figure 5.23 Physical inactivity – number and proportion of persons aged 15 years and over, capital cities, 2007-08
Number of People Percentage of Population
0
200 000
400 000
600 000
800 000
1 000 000
1 200 000
1 400 000
CanberraDarwinHobartPerthAdelaideBrisbaneMelbourneSydney
0
5
10
15
20
25
30
35
40
Popu
latio
n
Perc
enta
ge (
%)
Note: Physical nactivity is defined as those aged 15 years and over who reported that they did not exercise n the two weeks prior to interview for the 2007-08 National Health Survey, through sport, recreation or fitness (including walking).
Based on ABS 2009c
Source: PHIDU 2011
Social inclusionSocial inclusion refers to the degree to which people have access to opportunities and resources and can participate in civic life. Social inclusion is related to health because people who are socially included are more likely to have the resources (like healthy food, adequate housing, sufficient income) and opportunities to participate in education, employment and social and recreational activities that help to maintain good health.
The Social Inclusion Unit’s Compendium of Social Inclusion Indicators 2009 identifies poverty as among the most relevant factors that affect social inclusion. People with a low income are less likely to have the resources needed to participate in the activities, living conditions and amenities that are generally available to most people in society. Examining the level of inequality within and between cities and regions can help to understand which groups of people and which localities are more likely to be advantaged or disadvantaged in relation to the resources and opportunities available to them.
• 177 •
Chapter 5 Liveability • State of Australian Cities 2011
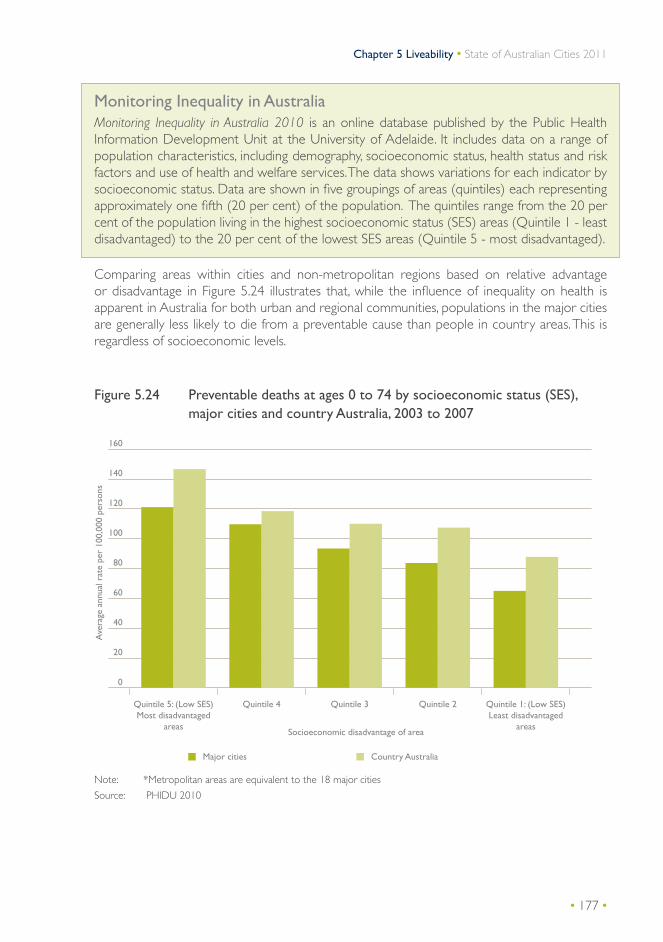
Monitoring Inequality in AustraliaMonitoring Inequality in Australia 2010 is an online database published by the Public Health Information Development Unit at the University of Adelaide. It includes data on a range of population characteristics, including demography, socioeconomic status, health status and risk factors and use of health and welfare services. The data shows variations for each indicator by socioeconomic status. Data are shown in five groupings of areas (quintiles) each representing approximately one fifth (20 per cent) of the population. The quintiles range from the 20 per cent of the population living in the highest socioeconomic status (SES) areas (Quintile 1 - least disadvantaged) to the 20 per cent of the lowest SES areas (Quintile 5 - most disadvantaged).
Comparing areas within cities and non-metropolitan regions based on relative advantage or disadvantage in Figure 5.24 illustrates that, while the influence of inequality on health is apparent in Australia for both urban and regional communities, populations in the major cities are generally less likely to die from a preventable cause than people in country areas. This is regardless of socioeconomic levels.
Figure 5.24 Preventable deaths at ages 0 to 74 by socioeconomic status (SES), major cities and country Australia, 2003 to 2007
Major cities Country Australia
Ave
rage
ann
ual r
ate
per
100,
000
pers
ons
Socioeconomic disadvantage of area
0
20
40
60
80
100
120
140
160
Quintile 1: (Low SES)Least disadvantaged
areas
Quintile 2Quintile 3Quintile 4Quintile 5: (Low SES)Most disadvantaged
areas
Note: *Metropolitan areas are equivalent to the 18 major cities
Source: PHIDU 2010

• 178 •
Department of Infrastructure and Transport • Major Cities Unit
Mental healthPoor mental health can result from, and increases an individual’s likelihood of, being socially excluded. Mental health problems are associated with unemployment, lower income and poor physical health. Levels of reported psychological distress in the metropolitan areas are related to income levels. Less than 10 per cent of people in the top fifth of incomes (quintile 1) in major cities report having high psychological distress compared with nearly 15 per cent of the people in the lowest income bracket (Figure 5.25).
Figure 5.25 High or very high psychological distress levels for adults* by socioeconomic status (SES), major cities, 2007-08
0
2
4
6
8
10
12
14
16
Quintile 1: (Low SES)Least disadvantaged
areas
Quintile 2Quintile 3Quintile 4Quintile 5: (Low SES)Most disadvantaged
areas
rate
per
100
Note: The data have been derived from the Kessler Psychological Distress Scale-10 items (K-10), which is a scale of non-specific psychological distress based on 10 questions asked of respondents about negative emotional states in the 4 weeks prior to interview for the 2007-08 National Health Survey. ‘High’ and ‘Very high’ distress are the two highest levels of distress categories (of a total of four categories).
Based on ABS 2009c
Source: PHIDU 2010
• 179 •
Chapter 5 Liveability • State of Australian Cities 2011
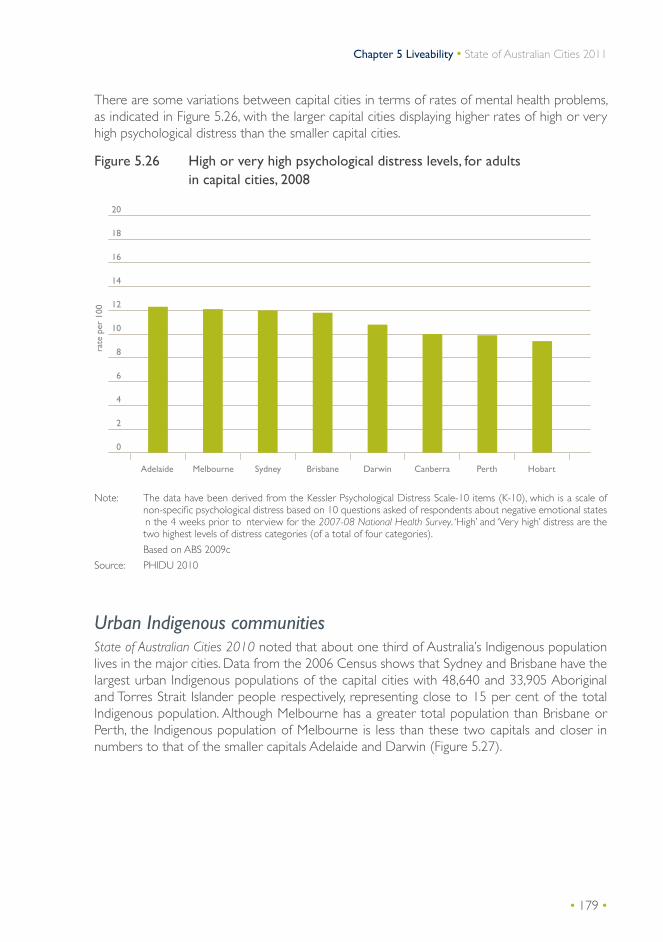
There are some variations between capital cities in terms of rates of mental health problems, as indicated in Figure 5.26, with the larger capital cities displaying higher rates of high or very high psychological distress than the smaller capital cities.
Figure 5.26 High or very high psychological distress levels, for adults in capital cities, 2008
rate
per
100
0
2
4
6
8
10
12
14
16
18
20
Adelaide Melbourne Sydney Brisbane Darwin Canberra Perth Hobart
Note: The data have been derived from the Kessler Psychological Distress Scale-10 items (K-10), which is a scale of non-specific psychological distress based on 10 questions asked of respondents about negative emotional states n the 4 weeks prior to nterview for the 2007-08 National Health Survey. ‘High’ and ‘Very high’ distress are the two highest levels of distress categories (of a total of four categories).
Based on ABS 2009c
Source: PHIDU 2010
Urban Indigenous communitiesState of Australian Cities 2010 noted that about one third of Australia’s Indigenous population lives in the major cities. Data from the 2006 Census shows that Sydney and Brisbane have the largest urban Indigenous populations of the capital cities with 48,640 and 33,905 Aboriginal and Torres Strait Islander people respectively, representing close to 15 per cent of the total Indigenous population. Although Melbourne has a greater total population than Brisbane or Perth, the Indigenous population of Melbourne is less than these two capitals and closer in numbers to that of the smaller capitals Adelaide and Darwin (Figure 5.27).

• 180 •
Department of Infrastructure and Transport • Major Cities Unit
Figure 5.27 Indigenous population in capital cities as a proportion of the total Indigenous population, 2006.
All Other Locations 56.8%
Sydney 9.6%
Brisbane 6.7%
Perth 4.7%
Melbourne 3.1%
Adelaide 2.7%
Newcastle 2.7%
Darwin 2.3%
Cairns 2.1%
Townsville 1.8%
Gold Coast-Tweed 1.7%
Other Major Cities 5.8%
Source: ABS 2006
As noted previously, one important indicator of equality and social inclusion is employment status. The report Overcoming Indigenous Disadvantage: Key Indicators 2011 shows that the unemployment rate for Indigenous people living in the major cities was 17 per cent in 2007, compared with the national unemployment rate of 4.2 per cent in 2007. Although a substantial gap remains between Indigenous and non-Indigenous unemployment rates, there has been a positive trend in the long-term unemployment rate in major cities for Indigenous 18 to 64-year-olds, which has decreased from 57 per cent in 1994 to 25 per cent in 2008 (Productivity Commission 2011).
Transport and social inclusion The connections between transport and social inclusion have recently been given greater consideration in urban research. Recent work in Victoria (Currie et al 2009; Delbosc and Currie, 2011 and Stanley et al 2011) has explored the spatial differences in measures of transport disadvantage, social exclusion and wellbeing in a survey of inner metropolitan, outer suburban, peri-urban and regional areas of Victoria. This showed very clear differences in mobility and car reliance between geographic locations. Car reliance peaked in Melbourne’s fringe, with regional areas showing slightly less car reliance.
Children and young peopleAccording to the OECD, Australia provides well for children as measured by material well-being, education and health. The child poverty rate has fallen over the past decade and is now below the OECD average; reading scores are above the OECD average; and older children are less likely to be out of education or employment (OECD 2011a).

• 181 •
Chapter 5 Liveability • State of Australian Cities 2011
A report on child disadvantage in Australia (NATSEM 2011) identifies the two most important factors affecting the social inclusion level for children and young people which are growing up in a jobless households and participation in tertiary education.
Joblessness among sole parent families is a significant problem. With just over half of sole parents in employment in 2009, Australia compares poorly with other OECD countries and results in above average poverty for these families. This issue is of particular concern as about one in five children live in such households, and projections show that the number is likely to increase by 20 per cent over the next 25 years.
For children living in households where no adult has been engaged in paid work over the past two years there is an increased likelihood that they will also become unemployed adults.
According to ABS 2006 Census data (Figure 5.28) the percentage of Australian children aged under 15 years in jobless families was 14.8 per cent. The proportion of children in jobless families is lower in capital cities compared to the Australian average and compared to non-metropolitan areas. There are notable differences between major cities. Adelaide has the highest proportion of children in jobless families (16.2 per cent) and Canberra the lowest (8.1 per cent).
Figure 5.28 Percentage of children 0 to 15 years in jobless households, 2006
Pere
ntag
e of
chi
ldre
n un
der
15 y
ears
Canbe
rra
Darwin
Perth
Adelai
de
Brisb
ane
Melbou
rne
Sydn
ey
Non-m
etrop
olitan
area
s
Capita
l citie
s
Austra
lia
0
2
4
6
8
10
12
14
16
18
Note: Based on ABS 2006 Census data (unpublished)
Source: PHIDU 2011

• 182 •
Department of Infrastructure and Transport • Major Cities Unit
In terms of participation in education or employment, ABS 2006 Census data shows that fewer young people from a low socioeconomic background and from regional and remote areas were learning or earning than other young people aged 15 to 19 years (Figure 5 29).
Figure 5.29 Percentage of young people aged 15 to 19 years who are learning or earning, by socioeconomic status 2006
Major cities Rest of Australia
Perc
ent
lear
ning
or
earn
ing
at a
ges
15 t
o 19
Socioeconomic disadvantage of area
Quintile 1: (High SES)Quintile 2Quintile 3Quintile 4Quintile 5: (Low SES)
0
10
20
30
40
50
60
80
70
90
Note: Based on ABS 2006 Census data (unpublished)
Source: Source PHIDU 2010
Older people Elderly and frail aged people have high rates of disability and are more likely to need health care and specialised community services. An ageing population will increase demand for these services in most cities and regions.
Some major cities will have greater need for services than others but an emerging issue for all cities will be the rapid increase in the number of older people who have some form of dementia.
Dementia and Alzheimer’s DiseaseIn 2009, dementia and Alzheimer’s disease were the third leading cause of death. The number of deaths in Australia from these causes has increased 126 per cent from 3,655 in 2000 to 8,277 in 2009. The impacts and increased need for support services will be felt in those cities with higher proportions of people over 65 years, especially in areas near regional cities where older people are relocating for retirement.

• 183 •
Chapter 5 Liveability • State of Australian Cities 2011
Not all people with dementia are older people, however. Newcastle and the Hunter region has become one of the few areas in Australia to address the need for specific support for people suffering from Younger Onset Dementia (ABC News Online 2011). The condition affects about 800 people under the age of 65 in the Hunter, which is about 10 per cent of the total number of people living with dementia and Alzheimer’s in the Hunter region (Alzheimer’s Australia 2010).
People with a disabilityPublic transport use by people with disabilities is a good measure of social inclusion related to a city’s transport services. When people with disabilities are restricted from using affordable and convenient local public transport, their ability to participate fully in the community is also significantly restricted.
State of Australian Cities 2010 reported on the steady increase in the proportion of people with a disability over the past four decades related to the ageing of the population. According to the results of the most recent ABS Survey of Disability, Ageing and Carers (ABS 2011d) four million people in Australia (18.5 per cent) reported having a disability in 2009.
Of all people with a reported disability, 82 per cent had public transport available in their local area and the less severe a person’s disability the more likely they were to use the available public transport. Figure 5.30 shows that 18 per cent of people with a profoundly limiting disability use public transport available locally compared with 38 per cent of those with a mildly limiting disability.
Figure 5.30 Use of locally available public transport, by disability status, 2009
Uses public transport - available locally Does not use public transport - available locally
Perc
enta
ge o
f peo
ple
with
a d
isab
ility
0
10
20
30
40
50
60
70
Schooling oremployment restriction
Mild limitationModerate limitationSevere limitationProfound limitation
Source: ABS 2011d
• 184 •
Department of Infrastructure and Transport • Major Cities Unit
Healthy built environments State of Australian Cities 2010 reported that people living in neighbourhoods which support physical activity are more likely to be physically active, whether for recreational purposes or through incidental exercise.
Active travel refers to walking and cycling for travel purposes, and may also include walking or cycling to reach public transport. Walking and cycling are recognised as sustainable modes of transport and involve incidental exercise that has benefits for health and wellbeing.
Mixed-use, compact development that is well connected to jobs, facilities and services makes active travel a more viable option by keeping trip distances shorter. Shorter distances for travel in local areas are also easier with connected street patterns.
The provision of suitable walking and cycling infrastructure enables more people to use active travel for short journeys. Research reviewed by Kent et al (2011) has found that well maintained footpaths and bicycle paths encourage active travel, as does the provision of places to rest, bicycle parking and other end of trip facilities.
Higher residential density is often considered conducive to active travel. The research reviewed by Kent et al (2011) suggests, however, that increasing residential density alone does not necessarily encourage physical activity. Rather, a mix of social, economic and built form elements including mixed use and good urban design, in some combination, are more likely to influence levels of physical activity.
Active travelState of Australian Cities 2010 used data collected in the 2006 Census to report on the types of transport people use to travel to work in the major cities. This Active Travel feature provides more detail on the non-motorised modes of travel in our cities.
Distance travelled by modeThe average distance that people commute to work or study differs across our cities. Some influencing factors include: the density and land use patterns of our cities; the attraction of the CBD as an employment centre; and the proximity of employment to residential communities. More than half the population in Hobart, for example, commutes less than 10 kilometres to work or study, compared with less than one third of the population in Perth (Figure 5.31).
For larger cities like Sydney, Melbourne and Brisbane there are significant differences in these factors across neighbourhoods and activity centres.

• 185 •
Chapter 5 Liveability • State of Australian Cities 2011
Figure 5.31 Proportion of all commutes that are less than 10 km by city
0-5km 5-10km
0
10
20
30
40
50
60
Capital cities (avg)HobartAdelaideBrisbaneMelbourneSydneyPerth
Source: ABS 2009d
There is much potential in our major cities to increase the mode share of active travel trips for trips of under five kilometres.
Figure 5.32 demonstrates that the majority of trips under five kilometres are currently undertaken by motorised transport (cars and public transport).
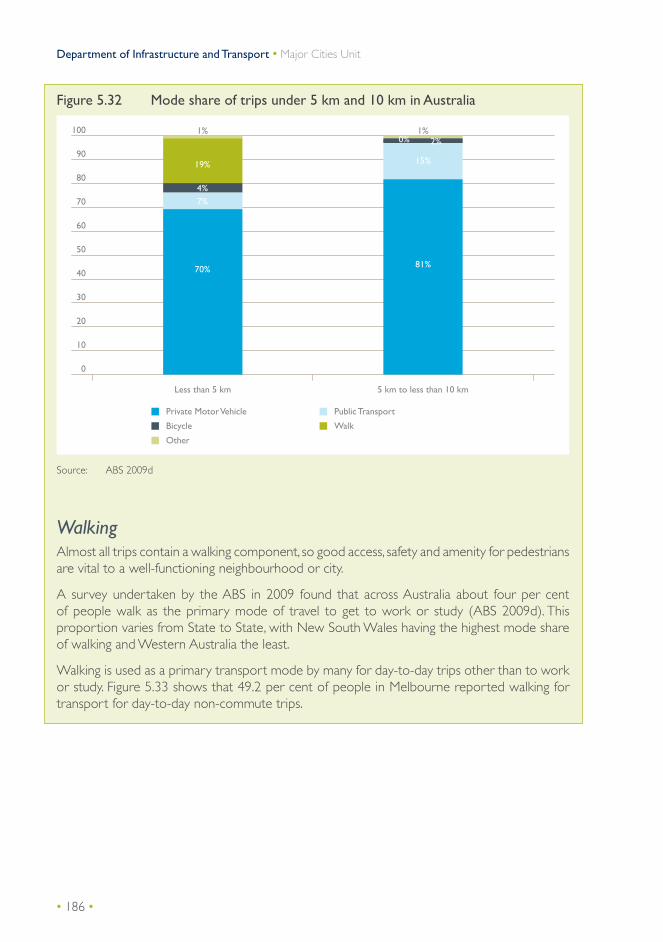
• 186 •
Department of Infrastructure and Transport • Major Cities Unit
Figure 5.32 Mode share of trips under 5 km and 10 km in Australia
Private Motor Vehicle Public Transport
Bicycle Walk
Other
0
10
20
30
40
50
60
70
80
90
100
5 km to less than 10 kmLess than 5 km
70%
7%4%
19%
1%
81%
15%
2%0%1%
Source: ABS 2009d
WalkingAlmost all trips contain a walking component, so good access, safety and amenity for pedestrians are vital to a well-functioning neighbourhood or city.
A survey undertaken by the ABS in 2009 found that across Australia about four per cent of people walk as the primary mode of travel to get to work or study (ABS 2009d). This proportion varies from State to State, with New South Wales having the highest mode share of walking and Western Australia the least.
Walking is used as a primary transport mode by many for day-to-day trips other than to work or study. Figure 5.33 shows that 49.2 per cent of people in Melbourne reported walking for transport for day-to-day non-commute trips.

• 187 •
Chapter 5 Liveability • State of Australian Cities 2011
Figure 5.33 Percent of people who reported walking for transport for day-to-day trips other than work or full time study
People who walk
Per
cent
0
10
20
30
40
50
60
AustraliaMelbournePerthAdelaideHobartSydneyBrisbane
Source: ABS 2009d
CyclingCycling is becoming increasingly popular in Australia although like the United States, Canada and the United Kingdom, it lags well behind other OECD countries such as the Netherlands, Denmark, Switzerland and Japan.
Bicycle OwnershipThe majority of households in our major cities have access to a bicycle with bicycle ownership rates ranging from 47 per cent in Sydney to 79 per cent in Cairns (Figure 5.34).
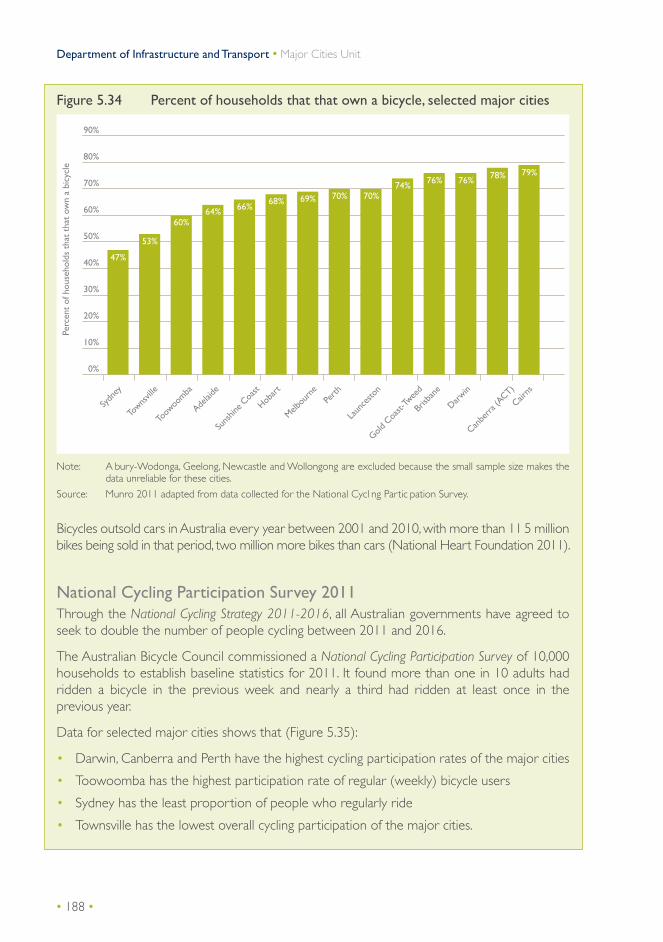
• 188 •
Department of Infrastructure and Transport • Major Cities Unit
Figure 5.34 Percent of households that that own a bicycle, selected major cities
Perc
ent
of h
ouse
hold
s th
at t
hat
own
a bi
cycl
e
0%
10%
20%
30%
40%
50%
60%
70%
80%
90%
Cairns
Canbe
rra (A
CT)
Darwin
Gold C
oast-
Twee
d
Brisb
ane
Laun
cesto
nPe
rth
Melbou
rne
Hobar
t
Suns
hine C
oast
Adelai
de
Toow
oomba
Towns
ville
Sydn
ey
47%
53%
60%64% 66%
68% 69% 70% 70%74% 76% 76% 78% 79%
Note: A bury-Wodonga, Geelong, Newcastle and Wollongong are excluded because the small sample size makes the data unreliable for these cities.
Source: Munro 2011 adapted from data collected for the National Cycl ng Partic pation Survey.
Bicycles outsold cars in Australia every year between 2001 and 2010, with more than 11 5 million bikes being sold in that period, two million more bikes than cars (National Heart Foundation 2011).
National Cycling Participation Survey 2011Through the National Cycling Strategy 2011-2016, all Australian governments have agreed to seek to double the number of people cycling between 2011 and 2016.
The Australian Bicycle Council commissioned a National Cycling Participation Survey of 10,000 households to establish baseline statistics for 2011. It found more than one in 10 adults had ridden a bicycle in the previous week and nearly a third had ridden at least once in the previous year.
Data for selected major cities shows that (Figure 5.35):
• Darwin, Canberra and Perth have the highest cycling participation rates of the major cities
• Toowoomba has the highest participation rate of regular (weekly) bicycle users
• Sydney has the least proportion of people who regularly ride
• Townsville has the lowest overall cycling participation of the major cities.

• 189 •
Chapter 5 Liveability • State of Australian Cities 2011
Figure 5.35 Cycling participation as a proportion of resident population of selected major cities
Last 7 days Last month Last year
0%
10%
20%
30%
40%
50%
60%
Darwin
Canbe
rra (A
CT)Pe
rth
Toow
oomba
Gold C
oast-
Twee
d
Suns
hine C
oast
Melbou
rne
Brisb
ane
Hobar
t
Adelai
de
Laun
cesto
n
Cairns
Sydn
ey
Towns
ville
Note: Albury-Wodonga, Geelong, Newcastle and Wollongong are excluded because the small sample size makes the data unreliable for these cities.
Source: Munro 2011 adapted from data collected for the National Cycl ng Partic pation Survey.
Cycling for transportThere is also evidence that more people are riding to work. Of the people who regularly ride their bicycles, 38 per cent of people living in capital cities do so for transport purposes, compared with 29 per cent in regional areas (Figure 5.36).
Data from Sydney, Melbourne, Brisbane, Perth and Adelaide showed annual increases of up to 18.3 per cent on main cycle route use between 2005 and 2009. In Perth almost three million bicycle movements were recorded commuting to and from the CBD during 2010, three times more than in 1998 (Western Australia Department of Transport 2011). Despite this, a comparison between the 2001 and 2006 Census shows that while the number of people commuting to work increased, cycling’s mode share of the national commute to work actually declined from 1.4 to 1.3 per cent. This was accompanied by growth in public transport patronage. It should be noted that the five-yearly Australian Census is held in August when weather can be inclement in some cities and therefore less conducive to active travel.

• 190 •
Department of Infrastructure and Transport • Major Cities Unit
Figure 5.36 Proportion of regular bicycle riders who ride for transport purposes
0%
10%
20%
30%
40%
50%
60%
Sydn
ey
Gold C
oast-
Twee
dPe
rth
Adelai
de
Hobar
t
Brisb
ane
Melbou
rne
Canbe
rra (A
CT)
Darwin
Source: Adapted from data collected for the Australian Bicycle Council 2011 National Cycl ng Partic pation Survey
SafetyA perception that a city is safe for people and their property was the most highly rated attribute of liveability in the survey of Australian residents referred to earlier in this chapter (PCA 2011). Two main factors that contribute to people’s sense of safety are their perceived risk of injury and their perceived risk of being a victim of crime. In Australia the incidence of crime is lower than the OECD average (OECD 2011).
Road SafetyOn average, four people are killed and 90 are seriously injured every day on Australia’s roads.
The major cities have much lower rates of road deaths than regional and remote areas with four deaths per 100,000 people in major cities compared with 16 deaths and nearly 25 deaths per 100,000 for regional and remote areas respectively (Australian Transport Council (ATC) 2011).
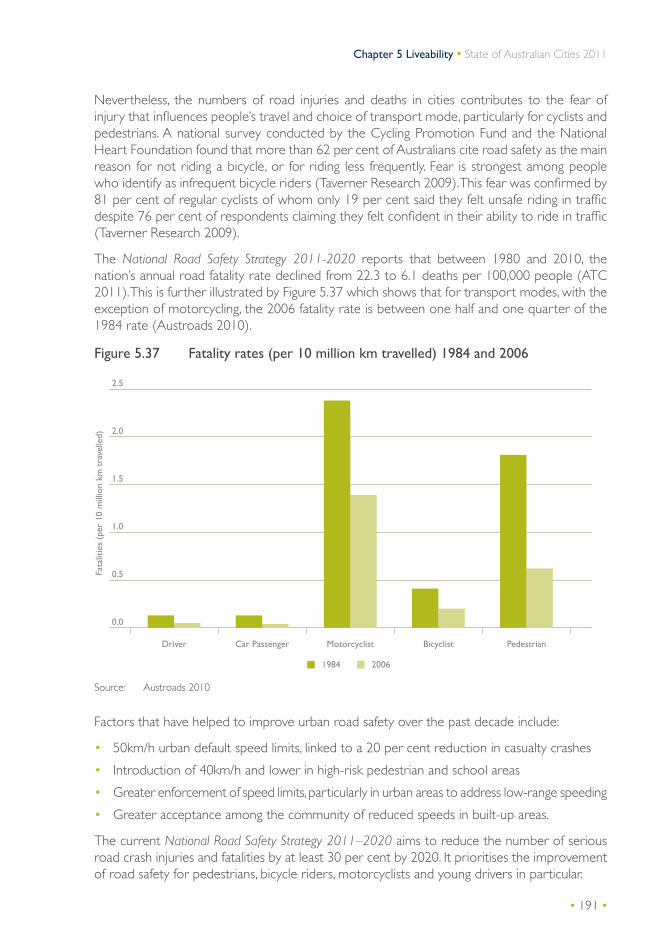
• 191 •
Chapter 5 Liveability • State of Australian Cities 2011
Nevertheless, the numbers of road injuries and deaths in cities contributes to the fear of injury that influences people’s travel and choice of transport mode, particularly for cyclists and pedestrians. A national survey conducted by the Cycling Promotion Fund and the National Heart Foundation found that more than 62 per cent of Australians cite road safety as the main reason for not riding a bicycle, or for riding less frequently. Fear is strongest among people who identify as infrequent bicycle riders (Taverner Research 2009). This fear was confirmed by 81 per cent of regular cyclists of whom only 19 per cent said they felt unsafe riding in traffic despite 76 per cent of respondents claiming they felt confident in their ability to ride in traffic (Taverner Research 2009).
The National Road Safety Strategy 2011-2020 reports that between 1980 and 2010, the nation’s annual road fatality rate declined from 22.3 to 6.1 deaths per 100,000 people (ATC 2011). This is further illustrated by Figure 5.37 which shows that for transport modes, with the exception of motorcycling, the 2006 fatality rate is between one half and one quarter of the 1984 rate (Austroads 2010).
Figure 5.37 Fatality rates (per 10 million km travelled) 1984 and 2006
1984 2006
Fata
litie
s (p
er 1
0 m
illio
n km
tra
velle
d)
0.0
0.5
1.0
1.5
2.0
2.5
PedestrianBicyclistMotorcyclistCar PassengerDriver
Source: Austroads 2010
Factors that have helped to improve urban road safety over the past decade include:
• 50km/h urban default speed limits, linked to a 20 per cent reduction in casualty crashes
• Introduction of 40km/h and lower in high-risk pedestrian and school areas
• Greater enforcement of speed limits, particularly in urban areas to address low-range speeding
• Greater acceptance among the community of reduced speeds in built-up areas.
The current National Road Safety Strategy 2011–2020 aims to reduce the number of serious road crash injuries and fatalities by at least 30 per cent by 2020. It prioritises the improvement of road safety for pedestrians, bicycle riders, motorcyclists and young drivers in particular.
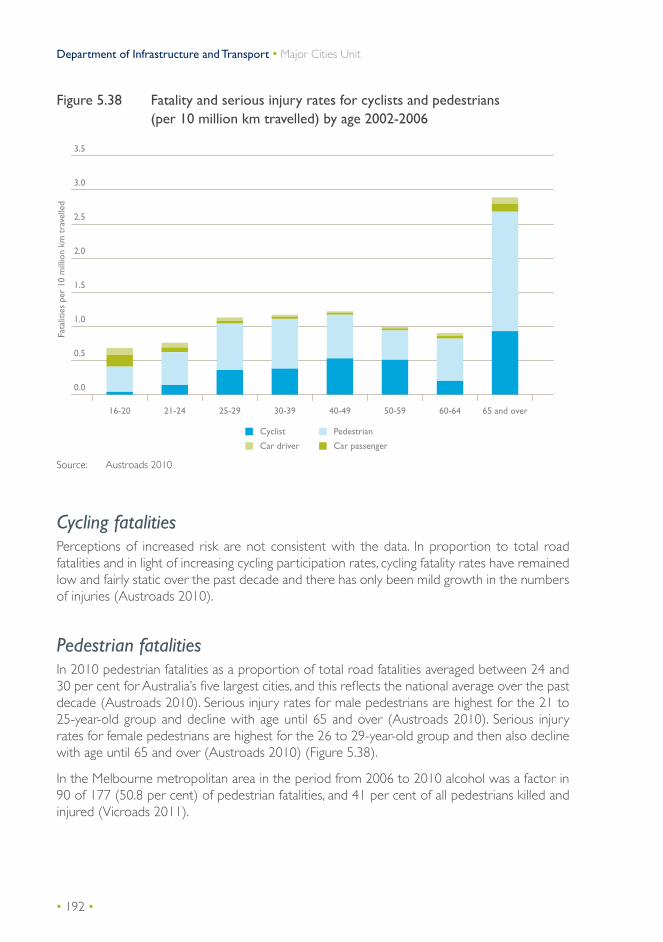
• 192 •
Department of Infrastructure and Transport • Major Cities Unit
Figure 5.38 Fatality and serious injury rates for cyclists and pedestrians (per 10 million km travelled) by age 2002-2006
Cyclist Pedestrian
Car driver Car passenger
Fata
litie
s pe
r 10
mill
ion
km t
rave
lled
0.0
0.5
1.0
1.5
2.0
2.5
3.0
3.5
65 and over60-6450-5940-4930-3925-2921-2416-20
Source: Austroads 2010
Cycling fatalitiesPerceptions of increased risk are not consistent with the data. In proportion to total road fatalities and in light of increasing cycling participation rates, cycling fatality rates have remained low and fairly static over the past decade and there has only been mild growth in the numbers of injuries (Austroads 2010).
Pedestrian fatalitiesIn 2010 pedestrian fatalities as a proportion of total road fatalities averaged between 24 and 30 per cent for Australia’s five largest cities, and this reflects the national average over the past decade (Austroads 2010). Serious injury rates for male pedestrians are highest for the 21 to 25-year-old group and decline with age until 65 and over (Austroads 2010). Serious injury rates for female pedestrians are highest for the 26 to 29-year-old group and then also decline with age until 65 and over (Austroads 2010) (Figure 5.38).
In the Melbourne metropolitan area in the period from 2006 to 2010 alcohol was a factor in 90 of 177 (50.8 per cent) of pedestrian fatalities, and 41 per cent of all pedestrians killed and injured (Vicroads 2011).

• 193 •
Chapter 5 Liveability • State of Australian Cities 2011
Safety using public transportIn contrast to the risk of personal injury which is the main safety concern for road users, fear of crime is frequently referred to as a safety concern for public transport users. International research has shown that fear of crime is now widely recognised as a barrier to public transport use (Booz and Company 2008; Crime Concern 2002). However, Australian studies have shown that very few men or women cited concerns about personal safety as a reason for not using public transport for their usual journey to work or study (ABS 2008; Transport Data Centre 2009).
Surveys of customer satisfaction in Sydney and Perth suggest that more than 90 per cent of bus and train passengers are satisfied with their level of safety (Transport Data Centre 2009; Transperth 2010). Transperth states that while 98 per cent of train passengers indicate they feel safe during the day, there are still reasonably high figures for nights with 75 per cent saying they felt safe on board a train at night while 70 per cent said they felt safe at stations at night. Similar figures applied to buses (Western Australia Public Transport Authority 2010). In Melbourne a recent report focusing on concerns for personal safety for people using public transport suggested that media coverage itself is acting to influence perceptions (Currie et al 2010).
AccessibilityUrban accessibility refers to the ease with which people can reach employment and training opportunities, facilities, services and social activities within cities. Good accessibility means that a majority of people in an urban area are able to take advantage of these resources and opportunities within a reasonable amount of time and cost.
The way our cities and neighbourhoods are planned and the extent and reliability of transport infrastructure largely determines urban accessibility.
Access to employmentNearly 72 per cent of the working-age population aged 15 to 64 has a paid job, considerably higher than the OECD average of 65 per cent. Australia escaped the worst of the global recession and, as noted in Chapter 3, the Australian unemployment rate is one of the lowest in the OECD.
Despite the strength of the national economy, there remain specific localities and cities where large groups of people are either unemployed or underutilised, that is, people who are working below their skill level or for fewer hours than they would prefer. More than 60 per cent of involuntary part-time workers have no post-school qualifications and one-third of them are aged under 25. A challenge for cities and communities is to address spatial concentration of under-utilised labour by improving access to better education, training and employment opportunities and transport to link people to these opportunities.
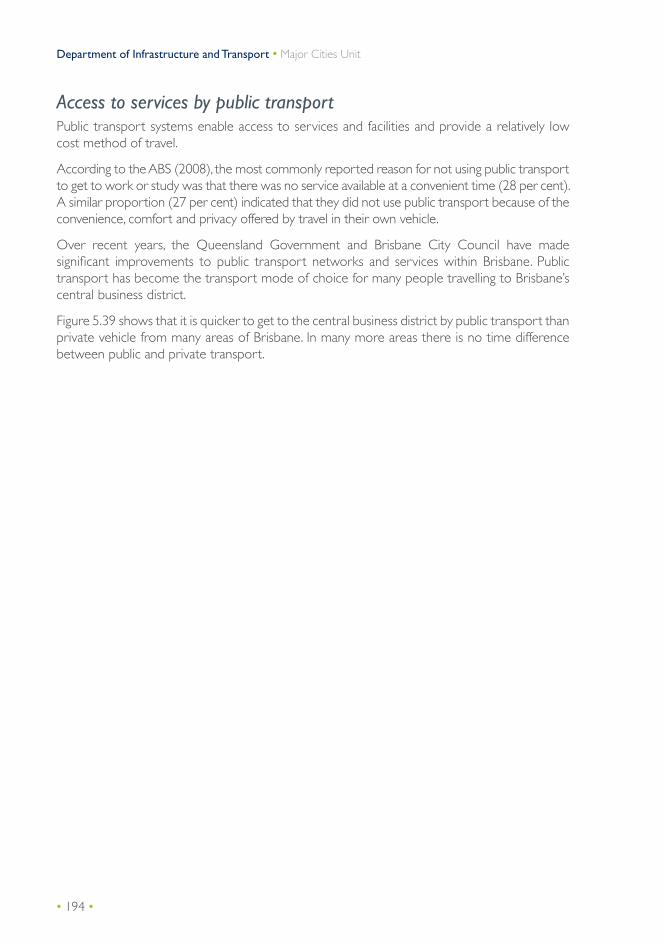
• 194 •
Department of Infrastructure and Transport • Major Cities Unit
Access to services by public transportPublic transport systems enable access to services and facilities and provide a relatively low cost method of travel.
According to the ABS (2008), the most commonly reported reason for not using public transport to get to work or study was that there was no service available at a convenient time (28 per cent). A similar proportion (27 per cent) indicated that they did not use public transport because of the convenience, comfort and privacy offered by travel in their own vehicle.
Over recent years, the Queensland Government and Brisbane City Council have made significant improvements to public transport networks and services within Brisbane. Public transport has become the transport mode of choice for many people travelling to Brisbane’s central business district.
Figure 5.39 shows that it is quicker to get to the central business district by public transport than private vehicle from many areas of Brisbane. In many more areas there is no time difference between public and private transport.
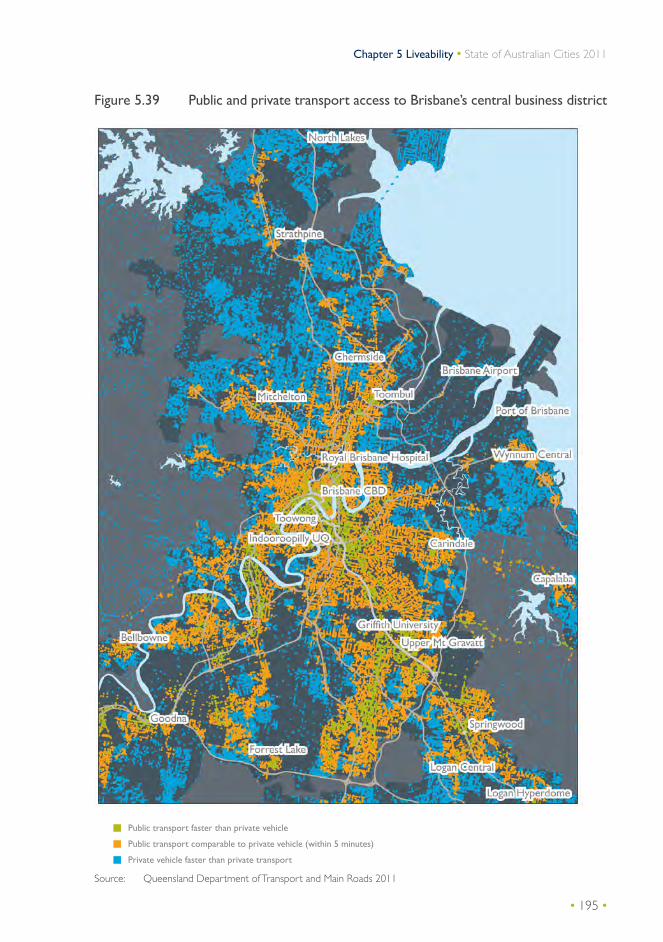
• 195 •
Chapter 5 Liveability • State of Australian Cities 2011
Figure 5.39 Public and private transport access to Brisbane’s central business district
Public transport faster than private vehicle
Public transport comparable to private vehicle (within 5 minutes)
Private vehicle faster than private transport
Source: Queensland Department of Transport and Main Roads 2011
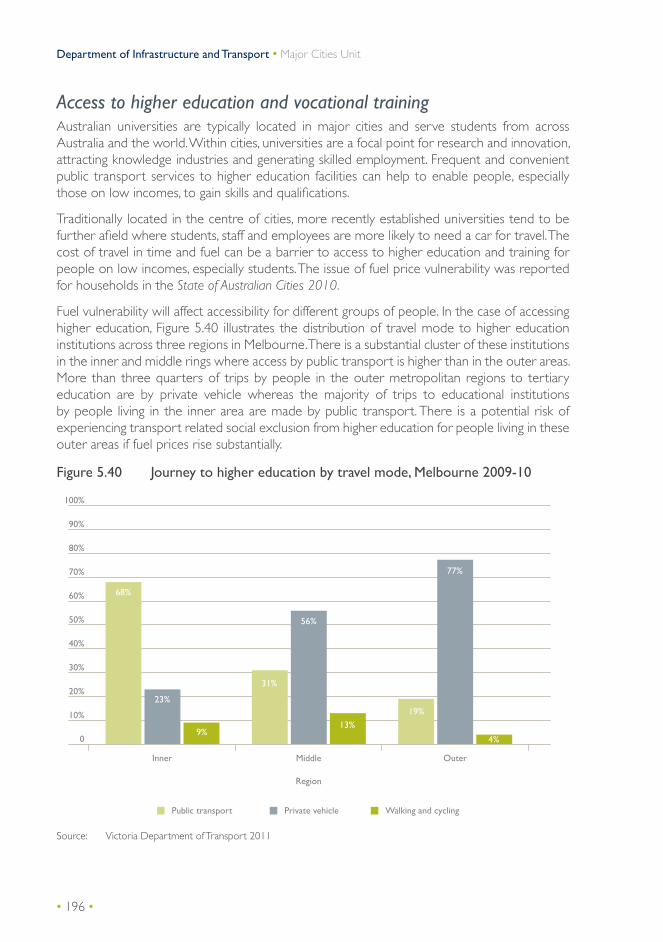
• 196 •
Department of Infrastructure and Transport • Major Cities Unit
Access to higher education and vocational trainingAustralian universities are typically located in major cities and serve students from across Australia and the world. Within cities, universities are a focal point for research and innovation, attracting knowledge industries and generating skilled employment. Frequent and convenient public transport services to higher education facilities can help to enable people, especially those on low incomes, to gain skills and qualifications.
Traditionally located in the centre of cities, more recently established universities tend to be further afield where students, staff and employees are more likely to need a car for travel. The cost of travel in time and fuel can be a barrier to access to higher education and training for people on low incomes, especially students. The issue of fuel price vulnerability was reported for households in the State of Australian Cities 2010.
Fuel vulnerability will affect accessibility for different groups of people. In the case of accessing higher education, Figure 5.40 illustrates the distribution of travel mode to higher education institutions across three regions in Melbourne. There is a substantial cluster of these institutions in the inner and middle rings where access by public transport is higher than in the outer areas. More than three quarters of trips by people in the outer metropolitan regions to tertiary education are by private vehicle whereas the majority of trips to educational institutions by people living in the inner area are made by public transport. There is a potential risk of experiencing transport related social exclusion from higher education for people living in these outer areas if fuel prices rise substantially.
Figure 5.40 Journey to higher education by travel mode, Melbourne 2009-10
0
10%
20%
30%
40%
50%
60%
70%
80%
100%
Inner Middle
Region
Outer
90%
Public transport Walking and cyclingPrivate vehicle
68%
56%
31%
13%
19%
77%
4%
23%
9%
Source: Victoria Department of Transport 2011
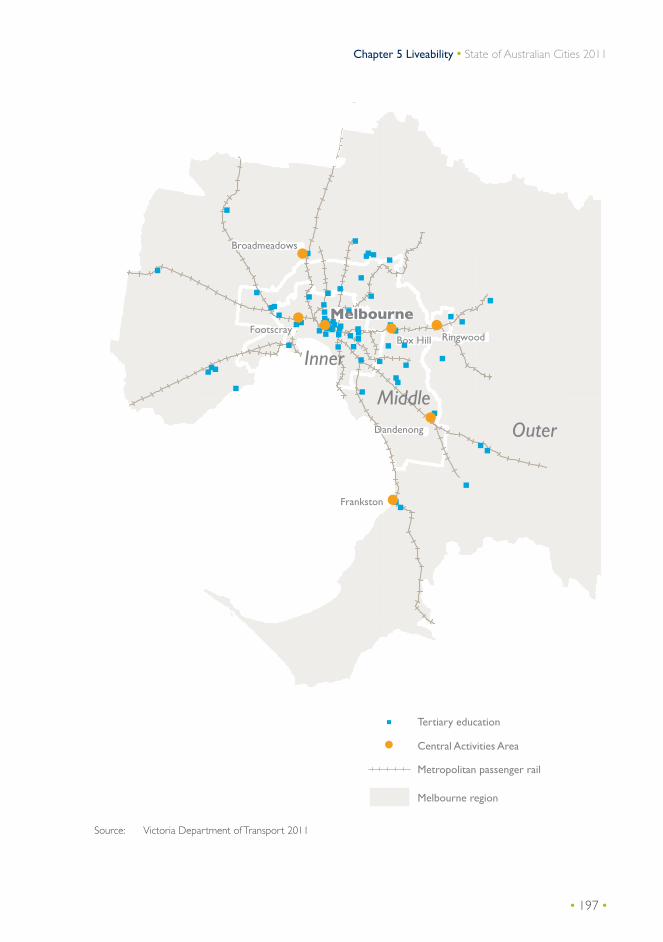
• 197 •
Chapter 5 Liveability • State of Australian Cities 2011
nnn
e na e nd od oD n n gnn n ga e na na eDandenonga denongDandeno g
llB B l x H x H o i B x Hi l B l l H l H l Box Hill Box H lB Hi l Fo tscrayc yr ytF tscrayF tsc y
Br dr dda wa wo d e o sd e o so sr ar arB m dm dm do a wo a wa wBroadmeadowsBroadmeadowsBro d adows
R g og ddw oww oR ngwoodg og o ddi o dRingwoodRi gwood
M uMM oulle eneM ourMM urllMel ourneel uMelbourne
nnn
e na e nd od oD n n gnn n ga e na na eDandenonga denongDandeno g
llB B l x H x H o i B x Hi l B l l H l H l Box Hill Box H lc yr ytF tscrayF tsc y
r dda wo d e o so sr ar m dm do a wa wBroadmeadowsBro d adows
R g og ddw oww oR ngwoodg og o ddRingwoodRingwoodRi gwood
M uMM oulle eneM ourMM urllMel ourneel uMelbourne
Source: Victoria Department of Transport 2011

• 198 •
Department of Infrastructure and Transport • Major Cities Unit
Community WellbeingIn line with a broader global movement to redefine the meaning and measurement of the progress of societies ‘beyond GDP’ a number of Australian States and local governments have developed measures of community wellbeing. Community wellbeing brings together economic, social and environmental factors with democratic, spiritual, emotional and cultural dimensions. It values healthy individuals as well as healthy communities; reflects new and traditional learning; and seeks to increase both the equity and sustainability of well-being (West et al 2010).
The Community Indicators Victoria Survey (2007) is a new data set derived from survey of approximately 24,000 Victorians involving 300 residents in all 79 local government areas across Victoria. Local governments in other States are drawing from the Victorian Community Indicators framework to develop similar data sets, though there is no uniform set that is applied nationally.
Volunteering is one of the indicators of community connectedness and wellbeing. The Victorian Community Survey found that there was a strong correlation between the rate of volunteering within a local government area and the degree to which people felt they were part of the community. Figure 5.41 shows the rate of volunteering in the capital cities for 2006 compared to the national average and to non-metropolitan areas. Volunteering is generally higher in non-metropolitan areas than the capital cities. However, Canberra stands out as the city with the highest rate of volunteering, higher than the national average and even higher than in non-metropolitan areas.
Figure 5.41 Percentage of population aged 15 years and over who participated in voluntary work
Canbe
rra
Darwin
Hobar
tPe
rth
Adelai
de
Brisb
ane
Melbou
rne
Sydn
ey
Non-m
etrop
olitan
area
s
Capita
l citie
s
Austra
lia
0
5
10
15
20
25
Note: Based on ABS 2006
Source: PHIDU 2011

• 199 •
Chapter 5 Liveability • State of Australian Cities 2011
ConclusionThe characteristics of liveable cities are mutually reinforcing. A city that offers good amenity and quality urban design will also be healthier. A city that is affordable and accessible will support social inclusion and equality. A city that is planned to support social cohesion will be safer, with higher levels of wellbeing and quality of life for its residents. In turn, the liveability of cities will contribute to their productive potential.
Chapter 5 ReferencesABC News Online 2011, ‘Newcastle gets young dementia support program’, 20 September, http://www.abc.net.au/news/2011-09-20/newcastle-young-dementia-suppor t/2907304 [Accessed 22.09.2011]
Access Economics 2011, Caring Places: planning for aged care and dementia 2010-2050: A report prepared for Alzheimer’s Australia, Alzheimer’s Australia Canberra.
Alzheimer’s Australia 2010, HOPE: Helping other possibilities emerge, Newsletter, July, Alzheimer’s Australia, Canberra.
Australian Bureau of Statistics (ABS) 2006, Census of Population and Housing, cat. no. 2069.0, Canberra.
ABS 2008, Australian Social Trends, Public Transport Use for Work and Study, cat. no. 4102.0, Canberra.
ABS 2009a, Housing Occupancy and Costs 2007-08, cat. no. 4130.0, Canberra.
ABS 2009b, Experimental Life Tables for Aboriginal and Torres Strait Islander Australians, 2005–2007, cat. no. 3302.0.55.003, Canberra.
ABS 2009c, National Health Survey: Summary of Results, 2007-2008 (Reissue), cat. no. 4364.0, Canberra.
ABS 2009d Environmental Issues: Waste Management and Transport Use, March 2009, cat. no. 4602.0, Canberra.
ABS 2009e, Housing and Mobility Conditions, cat. no. 4130.0.55.02, Canberra.
ABS 2010, Yearbook Australia 2009-10, cat. no. 1301.0, Canberra.
ABS 2011a, House Price Indexes, eight capital cities, cat. no. 6416.0, Canberra.
ABS 2011b, Household Expenditure Survey, Australia 2009-10: Summary of Results, cat. no. 6530.0, Canberra.
ABS 2011c, Causes of Death, Australia, 2009 cat. no. 3303.0, Canberra.
ABS 2011d, Disability, Australia, 2009, cat. no. 4446.0, Canberra.
ABS 2011e, Motor Vehicle Census 2010, cat. no. 9309.0, Canberra.
Australian Competition and Consumer Commission (ACCC) 2010, ACCC reports on unleaded petrol prices costs and profits, Canberra. http://www.accc.gov.au/content/index.phtml/itemId/962278 [Accessed 20.09.2011]
Australian Department of Infrastructure, Transport, Regional Development and Local Government, 2008, Fatal and serious road crashes involving motorcyclists, Monograph 20, Commonwealth of Australia, Canberra.

• 200 •
Department of Infrastructure and Transport • Major Cities Unit
Australian Transport Council (ATC) 2011, National Road Safety Strategy 2011-2020, Canberra. http://www.infrastructure.gov.au/roads/safety/national_road_safety_strategy/index.aspx [Accessed 15.09.2011]
Austroads 2010, The Road Safety Consequences of Changing Travel Modes, Austroads Publication No. AP–R361/10, Sydney.
Austroads 2011, Australian National Cycling Strategy 2011-2016, Australian Bicycle Council, Sydney.
Baum, S & Gleeson, B 2010, ‘Space and Place: Social Exclusion in Australia’s Suburban Heartlands’, Urban Policy and Research 28 2:135-159.
Bauman A, Rissel C, Garrard J, Ker, I, Speidel, R & Fishman, E 2008, Cycling: Getting Australia Moving: Barriers, facilitators and interventions to get more Australians physical active through cycling, Cycling Promotion Fund, Melbourne
Booz and Company 2008, Personal Security in Public Transport Travel in NZ: Problems Issues and Solutions, Land Transport New Zealand Research Report 344, Land Transport New Zealand, Wellington http://www.nzta.govt.nz/resources/research/reports/344/index.html [Accessed 15.09.2011]
Box, S, Hale, C & Andrews, G 1988, ‘Explaining Fear of Crime’, British Journal of Criminology, 28 3:340-356.
Bunker, R, Holloway, D & Randolph, B 2005, The social outcomes of urban consolidation in Sydney, City Futures Research Centre University of New South Wales, Sydney.
Bureau of Meterology 2011, Climate data online. http://www.bom.gov.au/climate/data/ [Accessed 11.10.2011]
Council of Australian Governments (COAG) 2011, COAG Meeting Canberra 19 August 2011 Communiqué, http://www.coag.gov.au/coag_meeting_outcomes/2011-08-19/index.cfm [Accessed 19.09.2011]
Crime Concern 2002, People Perceptions of Personal Security and Their Concerns about Crime on Public Transport: Literature review, Department for Transport (UK), London.
Currie, G, Richardson, T, Smyth, P, Vella-Brodrick, D, Hine, J, Lucas, K, Stanley, J, Morris, J, Kinnear, R, Stanley, J, 2009. ‘Investigating links between transport disadvantage, social exclusion and well-being in Melbourne – preliminary results. Transport Policy 13:3.
Currie, G, Delbosc, A & Mahmoud, S 2010, ‘Perceptions and Realities of Personal Safety on Public Transport for Young People in Melbourne’, paper delivered at the Australasian Transport Research Forum 29 September to 1 October 2010, Canberra.
Delbosc, A & Currie, G 2011, ‘The spatial context of transport disadvantage, social exclusion and well-being’, Journal of Transport Geography, 19 6:1130–1137.
The Economist Intelligence Unit (EIU) 2011a, Worldwide cost of living 2011, The Economist, London.
EIU 2011b, Cities’ Liveability 2011, The Economist, London.
Henley, G & Harrison, J 2011, Trends in serious injury due to land transport accidents, Australia 2000–01 to 2007–08, Injury research and statistics series no. 54, Australian Institute of Health and Welfare, Canberra.
• 201 •
Chapter 5 Liveability • State of Australian Cities 2011
Kent, J, Thompson, SM & Jalaludin, B 2011 Healthy Built Environments: A review of the literature, Healthy Built Environments Program, City Futures Research Centre, University of New South Wales, Sydney. http://www.fbe.unsw.edu.au/cf/hbep/publications/ [Accessed 12.09 2011]
Kelly, JF, Weidmann, B & Walsh, M 2011, The Housing We’d Choose, Grattan Institute, Melbourne.
Kulish, M, Richards, A & Gillitzer, C 2011 Urban structure and housing prices: some evidence from Australian cities Research Discussion Paper 2011-03 September 2011, Economic Group, Reserve Bank of Australia, Sydney.
Medibank Private 2008, The cost of physical inactivity. http://www.medibank.com.au [Accessed 03.10.2011]
Mercer Corporation 2010, Worldwide Quality of living highlights. http://www.mercer.com/surveys/quality-of-living-report [Accessed 28.08 2011]
Mercer Corporation 2011, Mercer Cost of Living Survey Highlights. http://www.mercer.com/costofliving [Accessed 28.08.2011]
Minnery, J, Adkins, B, Grimbeek, P, Summerville, J, Mead, E & Guthrie, D 2002, Tenure security and its impact on private renters in Queensland, Australian Housing and Urban Research Institute (AHURI), Melbourne.
Munro, C 2011, National Cycling Participation Survey 2011, Australian Bicycle Council, Sydney.
National Heart Foundation 2011 Riding a Bike for Transport 2011 Survey Findings National Heart Foundation and Cycling Promotion Fund. http://www.cyclingpromotion.com.au [Accessed 04.10.2011]
National Housing Supply Council (NHSC) 2010, 2nd State of Supply Report 2010, Commonwealth of Australia, Canberra.
National Centre for Social and Economic Modelling (NATSEM 2011) Unequal Opportunities: Life chances for children in the ‘Lucky Country’ The Smith Family, Sydney.
Organisation for Economic Cooperation and Development (OECD) 2011a, Better Life Index, OECD, Geneva. http://www.oecdbetterlifeindex.org/ [Accessed 29.09.2011.]
OECD 2011b Obesity and the Economics of Prevention: Fit not Fat - Australia Key Facts http://www.oecd.org/documentprint/0,3455,en_33873108_33873229_46038593_1_1_1_1,00.html [Accessed 29.09.2011]
PricewaterhouseCoopers (PwC) 2011, Cities of Opportunity 2011, The Partnership for New York City, New York.
Productivity Commission 2011, Overcoming Indigenous Disadvantage: Key Indicators 2011. http://www.pc.gov.au/gsp/reports/indigenous/key-indicators-2011 [Accessed 23.09.2011]
Property Council of Australia (PCA) 2011 My city: the people’s verdict. Report prepared by Auspoll for the Property Council of Australia, Sydney.
Public Health Information Development Unit (PHIDU) 2010 Monitoring Inequality in Australia, 2010 Online Data http://www.publichealth.gov.au/inequality-graphs/monitoring-inequality-in-australia-introduction.html [Accessed 11.10.2011]
PHIDU 2011 A Social health atlas of Australia, 2011, http://www.publichealth.gov.au/interactive-mapping/a-social-health-atlas-of-australia_-2011.html [Accessed 11.10.2011]
Queensland Department of Transport and Main Roads 2011 ‘Public and private access to Brisbane’s central business district’, Unpublished data courtesy of Data & Analysis Centre, Queensland Department of Transport and Main Roads, Brisbane.
• 202 •
Department of Infrastructure and Transport • Major Cities Unit
Randolph, B 2007, ‘The Changing Australian City: New Patterns, New Policies and New Research Needs’, Urban Policy and Research 22 4:481-493.
Reserve Bank of Australia 2011, Exchange Rates, Reserve Bank of Australia, Sydney. http://www.rba.gov.au/statistics/hist-exchange-rates/index.html [Accessed 04.10 2011]
Sherry, C 2006, ‘Termination of Strata Schemes in New South Wales – Proposals for reform’, Australian Property Law 13:227-239.
Social Inclusion Unit 2009 How’s Australia faring? Social inclusion: A compendium of social inclusion indicators. A compilation of comparative data undertaken by the Australian Social Inclusion Board, Social Inclusion Unit, Department of the Prime Minister and Cabinet, Canberra.
Stanley, JK, Hensher D, Stanley, JR, Vella-Brodrick, D, 2011 Mobility, social exclusion and well-being: Exploring the links Transportation Research Part A 45:789–801.
Taverner Research 2009, Sydney Cycling Research. http://www.taverner.com.au/index.htm [Accessed 23.09.2011]
Transport Data Centre 2009, 2007 household travel survey summary report, NSW Ministry of Transport, Sydney.
The Treasury 2009, Australia’s future tax system: Report to the Treasurer December 2009, Part Two Detailed analysis, Vol 2, Canberra.
Trubka, R, Newman, P & Bilsborough, D 2008, Assessing the costs of alternative development paths in Australian Cities. Report commissioned by Parsons Brinckerhoff, Curtin University Sustainability Policy Institute, Perth.
UN HABITAT 2011, State of the World’s Cities 2010-2011: Bridging the urban divide, United Nations Human Settlements Programme, London.
URBIS 2010, National Dwelling Costs Study Report, National Housing Supply Council, Canberra.
Vicroads 2011 Crashstats. http://www.vicroads.vic.gov.au/Home/SafetyAndRules/AboutRoadSafety/StatisticsAndResearch/CrashStats.htm [Accessed 11.09.2011]
Victoria Department of Transport 2011 Unpublished data from 2009/10 Victorian Integrated Survey of Travel and Activity (VISTA), courtesy of The State of Victoria, Department of Transport, Melbourne.
Weidmann, B & Kelly, J-F 2011, What Matters Most? Housing preferences across the population, Grattan Institute, Melbourne.
Western Australia Department of Transport 2011 Monitoring of Perth Bicycle Network. Report prepared for the Department of Transport:Bikewest by Painted Dog Research, June 2011, Government of Western Australia, Perth. http://www.transport.wa.gov.au/cycling/20051.asp [Accessed 10.09.2011]
Western Australia Public Transport Authority 2010, Annual Report 2009-10 http://www.pta.wa.gov.au/Portals/0/annualreports/2010/transperth/key-service-measures/index.html
Whitzman, C & Mizrachi, D 2009, Vertical Living Kids: creating supportive high rise environments for children in Melbourne, Australia: A Report to the Victorian Health Promotion Foundation, Faculty of Architecture, Building and Planning, University of Melbourne Melbourne.
Wilkinson, R, & Pickett, K 2010, The Spirit Level: why equality is better for everyone, Penguin, London.