Embed Size (px)
Citation preview
LIVE WELL SAN DIEGODATA WORKSHOP SERIES:INTRODUCTION TO LOCAL
PUBLIC HEALTH DATA ONLINE
Dale Fleming
Director, Office of Strategy and Innovation
Health and Human Services
February 26, 2015
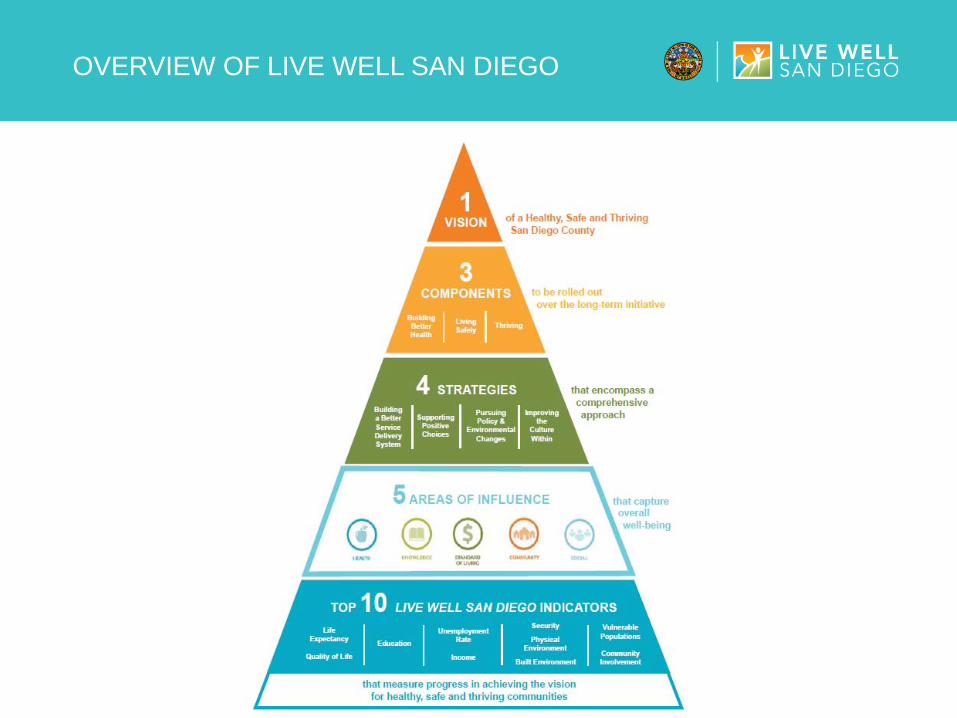
OVERVIEW OF LIVE WELL SAN DIEGO
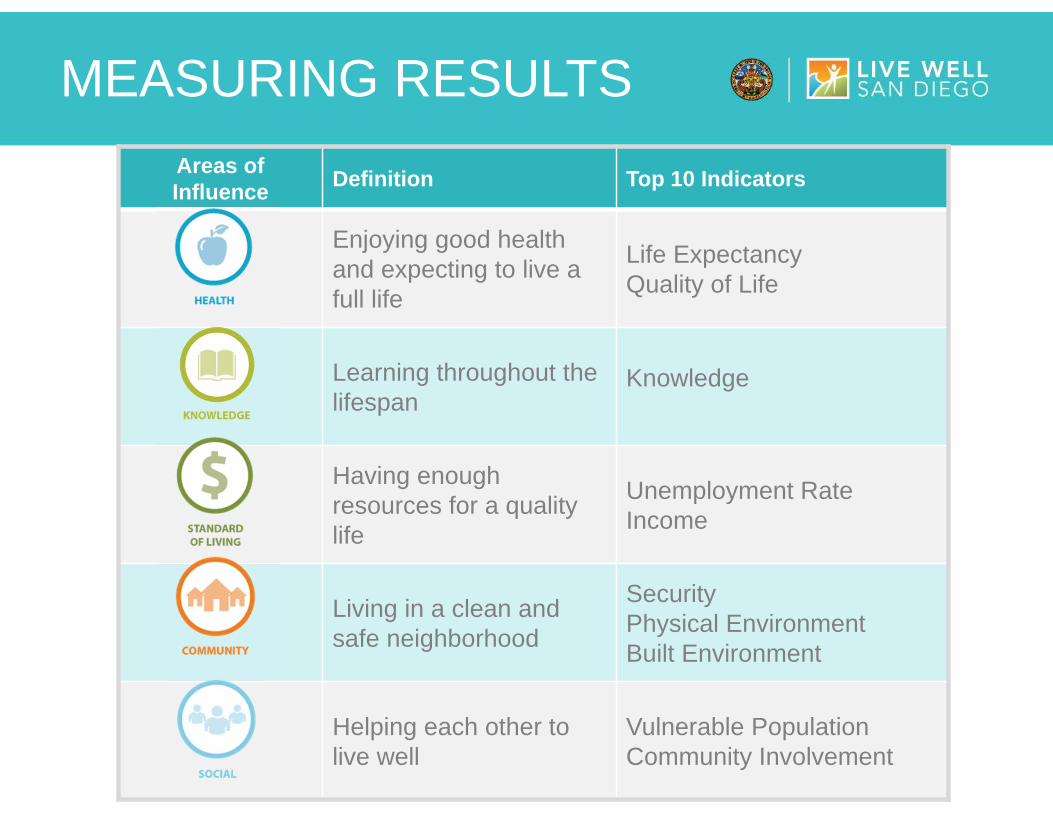
MEASURING RESULTSAreas of Influence Definition Top 10 Indicators
Enjoying good health and expecting to live a full life
Life ExpectancyQuality of Life
Learning throughout the lifespan
Knowledge
Having enough resources for a quality life
Unemployment RateIncome
Living in a clean and safe neighborhood
SecurityPhysical EnvironmentBuilt Environment
Helping each other to live well
Vulnerable PopulationCommunity Involvement
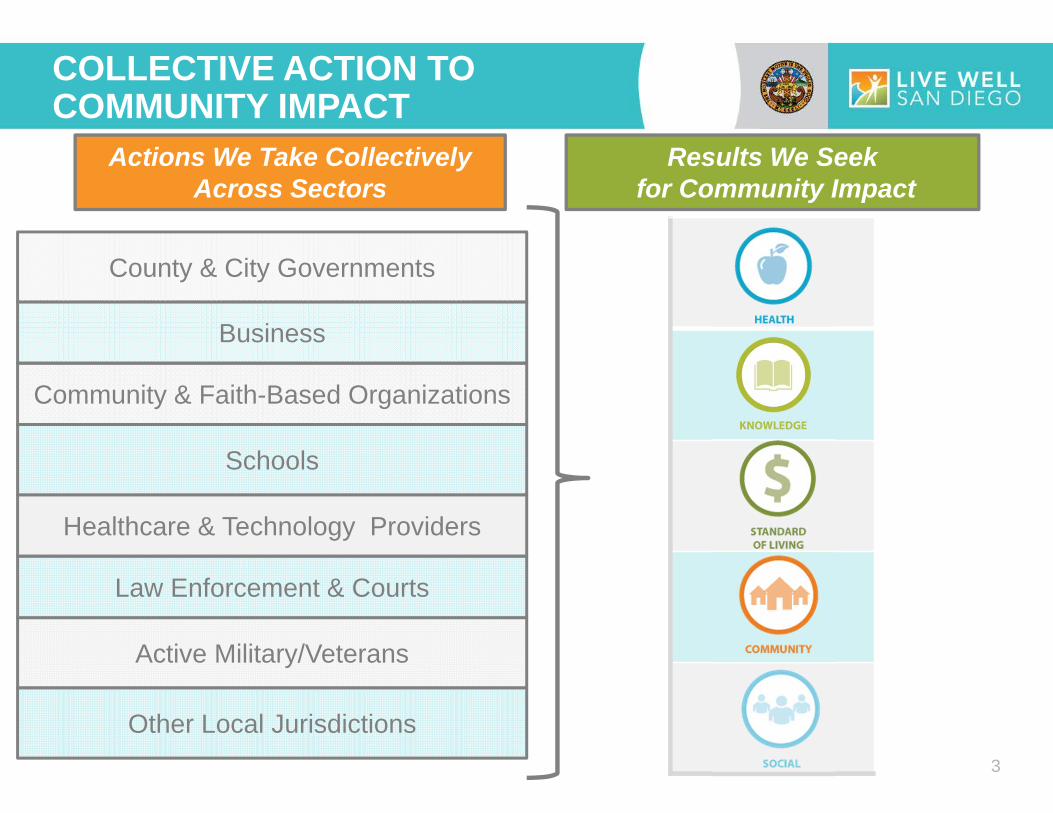
COLLECTIVE ACTION TO COMMUNITY IMPACT
Active Military/Veterans
Community & Faith-Based Organizations
Healthcare & Technology Providers
Schools
Other Local Jurisdictions
Law Enforcement & Courts
Business
County & City Governments
Actions We Take CollectivelyAcross Sectors
Results We Seekfor Community Impact
3
LIVE WELL SAN DIEGO DATA WORKSHOP SERIES:INTRODUCTION TO LOCAL
PUBLIC HEALTH DATA ONLINE
Leslie Ray, MPH, MPPA, MAHealth and Human Services Agency
Public Health ServicesCommunity Health Statistics Unit
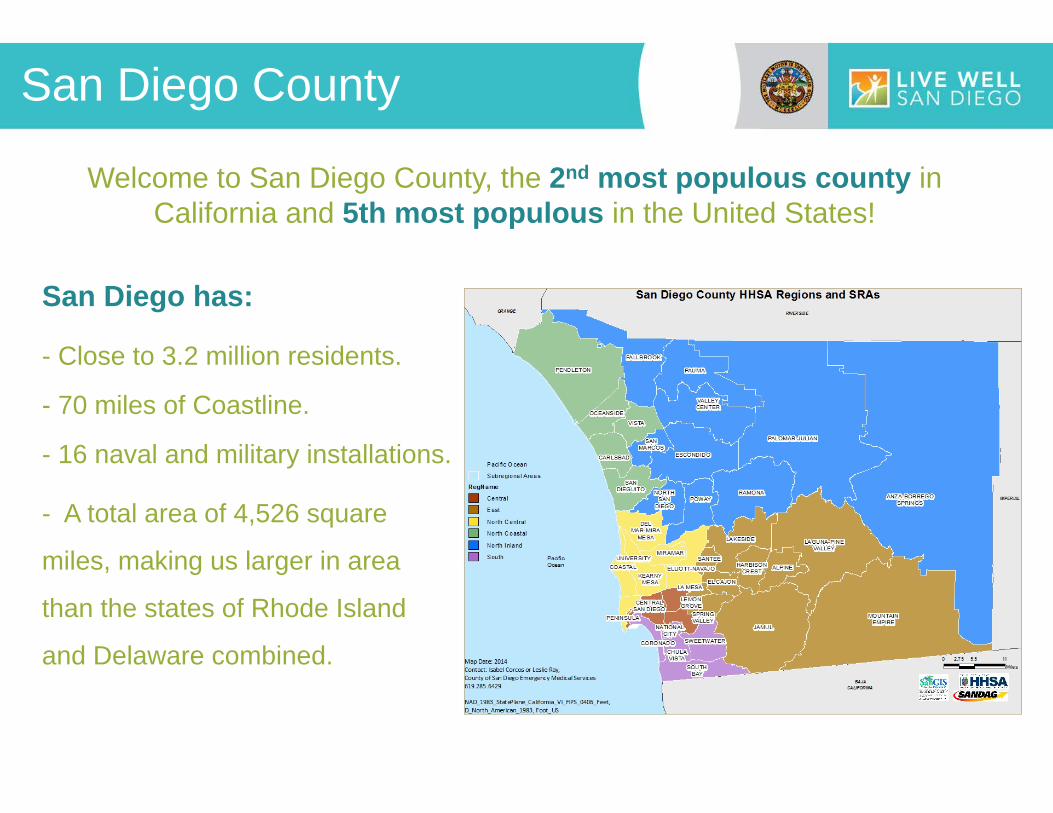
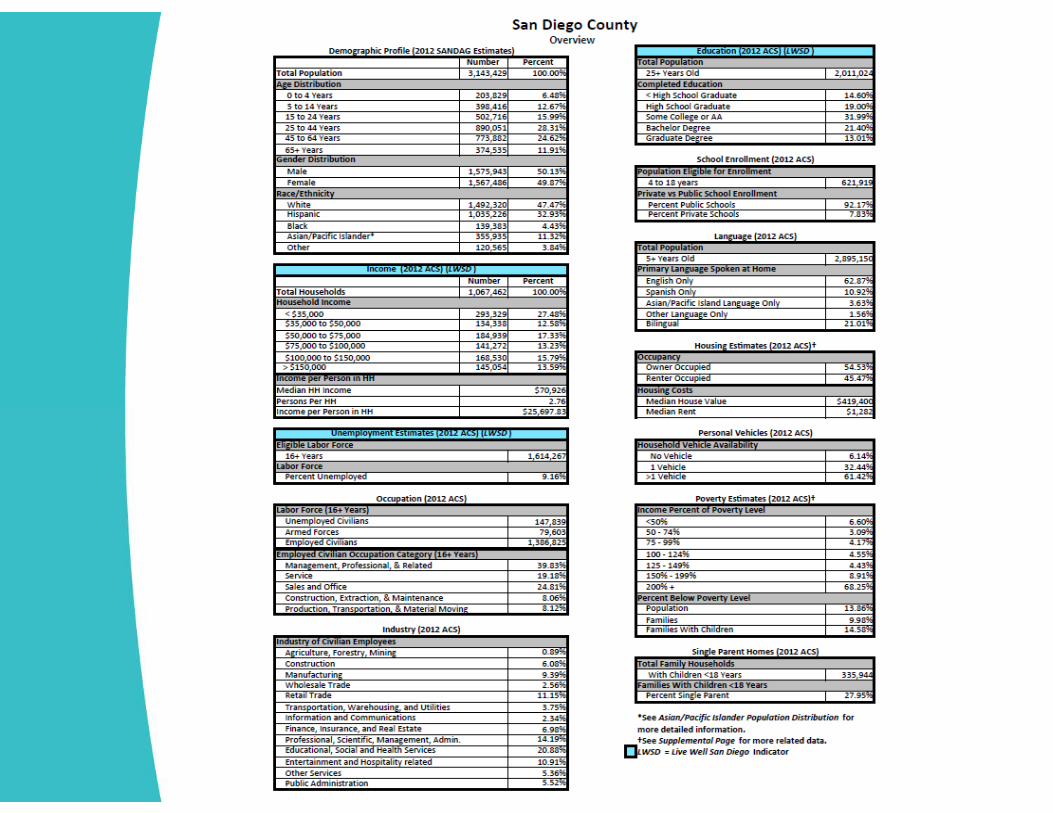
Welcome to San Diego County, the 2nd most populous county in California and 5th most populous in the United States!
San Diego County
San Diego has:
- Close to 3.2 million residents.
- 70 miles of Coastline.
- 16 naval and military installations.
- A total area of 4,526 square
miles, making us larger in area
than the states of Rhode Island
and Delaware combined.
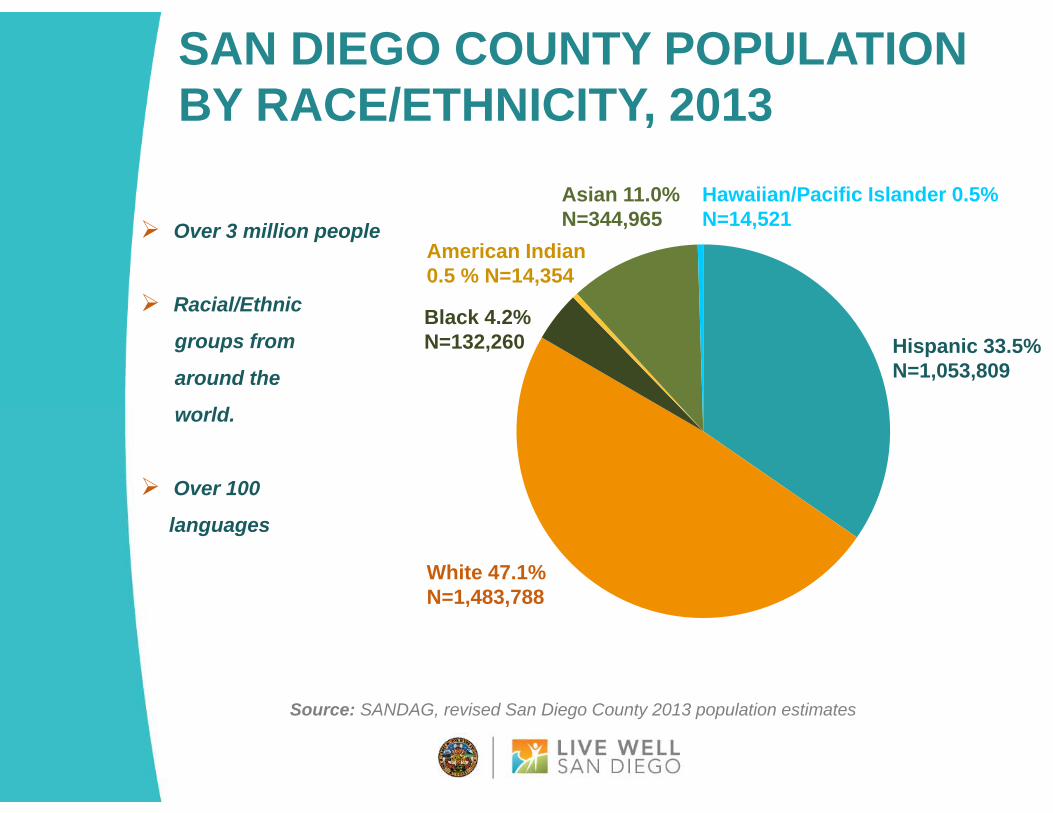
Over 3 million people
Racial/Ethnic
groups from
around the
world.
Over 100
languages
Source: SANDAG, revised San Diego County 2013 population estimates
Asian 11.0%N=344,965
White 47.1%N=1,483,788
Black 4.2%N=132,260 Hispanic 33.5%
N=1,053,809
Hawaiian/Pacific Islander 0.5%N=14,521
American Indian 0.5 % N=14,354
SAN DIEGO COUNTY POPULATIONBY RACE/ETHNICITY, 2013
WHAT TYPES OF DATA ARE AVAILABLE?
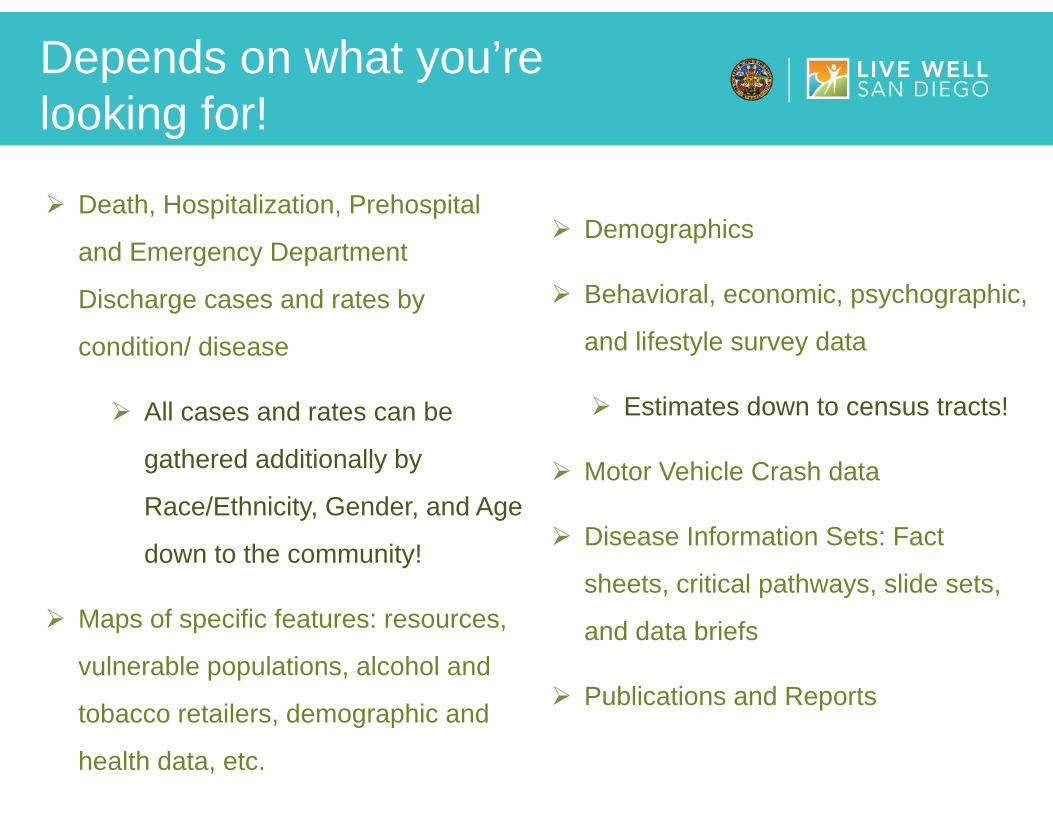
Depends on what you’re looking for!
Death, Hospitalization, Prehospital
and Emergency Department
Discharge cases and rates by
condition/ disease
All cases and rates can be
gathered additionally by
Race/Ethnicity, Gender, and Age
down to the community!
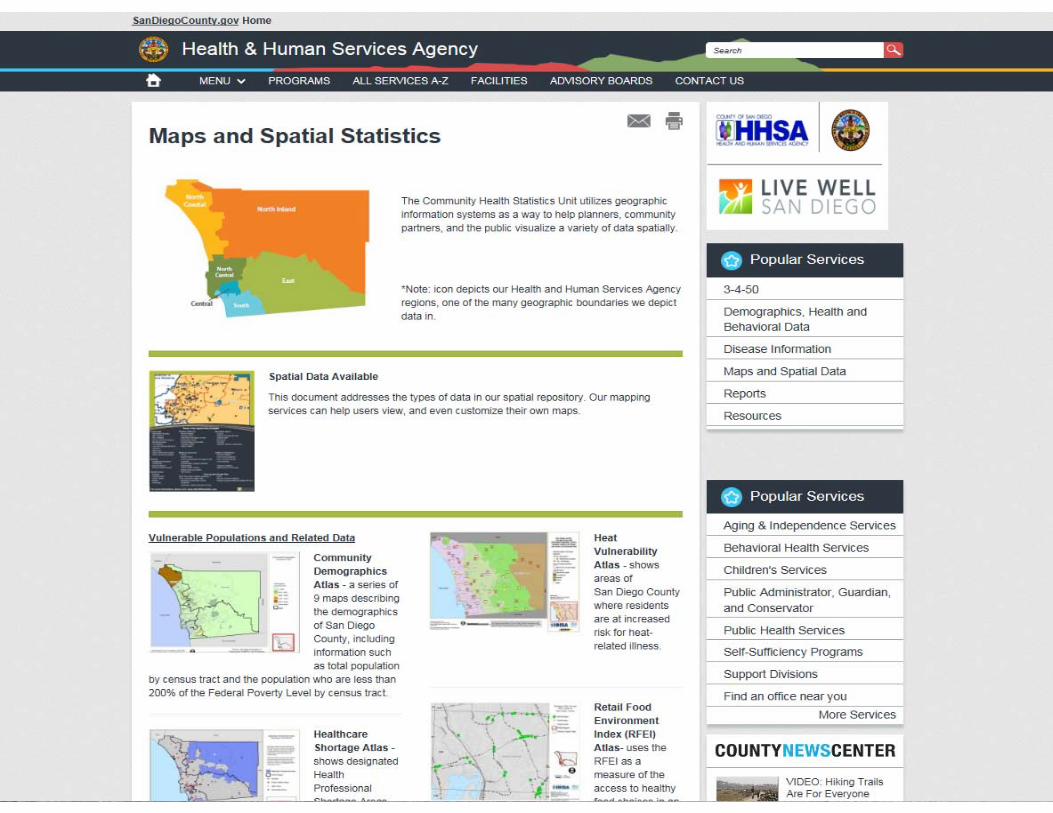
Maps of specific features: resources,
vulnerable populations, alcohol and
tobacco retailers, demographic and
health data, etc.
Demographics
Behavioral, economic, psychographic,
and lifestyle survey data
Estimates down to census tracts!
Motor Vehicle Crash data
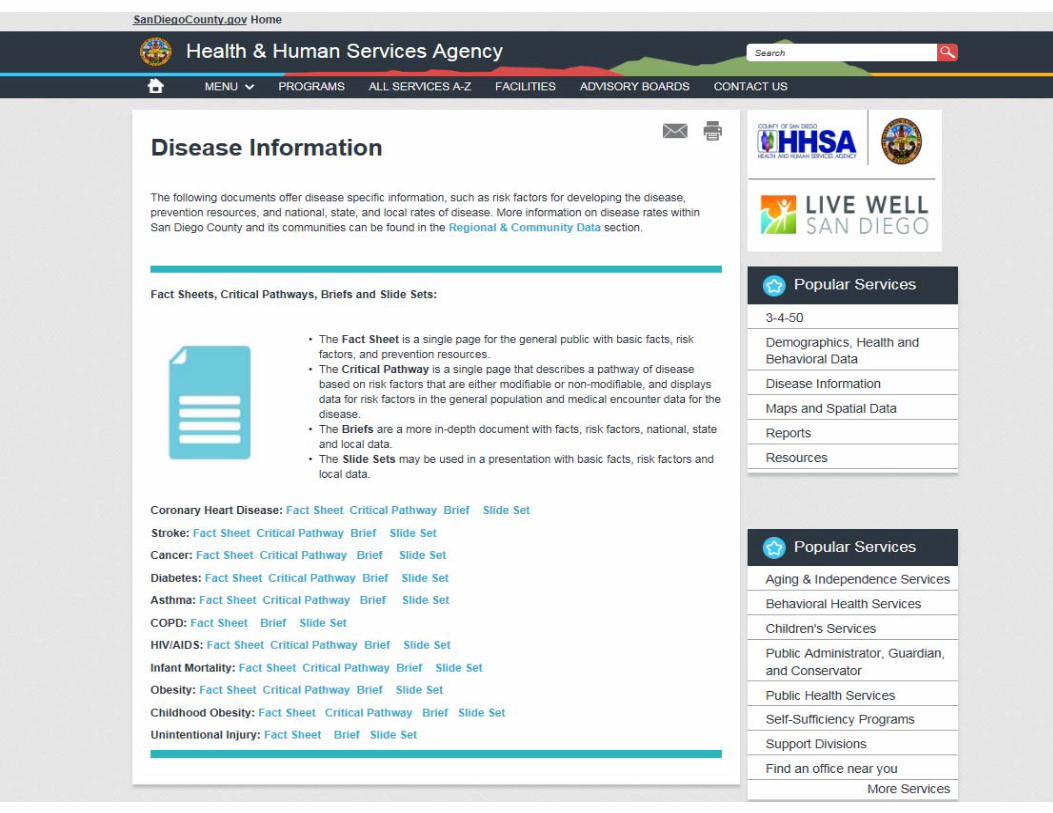
Disease Information Sets: Fact
sheets, critical pathways, slide sets,
and data briefs
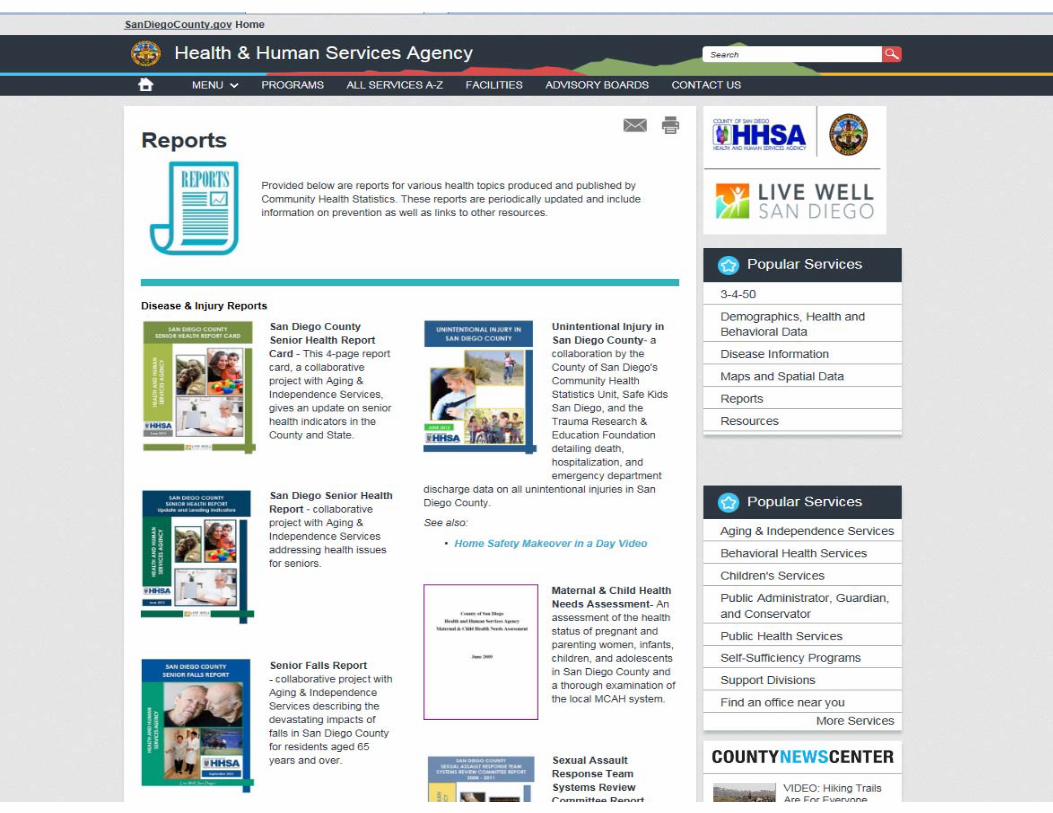
Publications and Reports
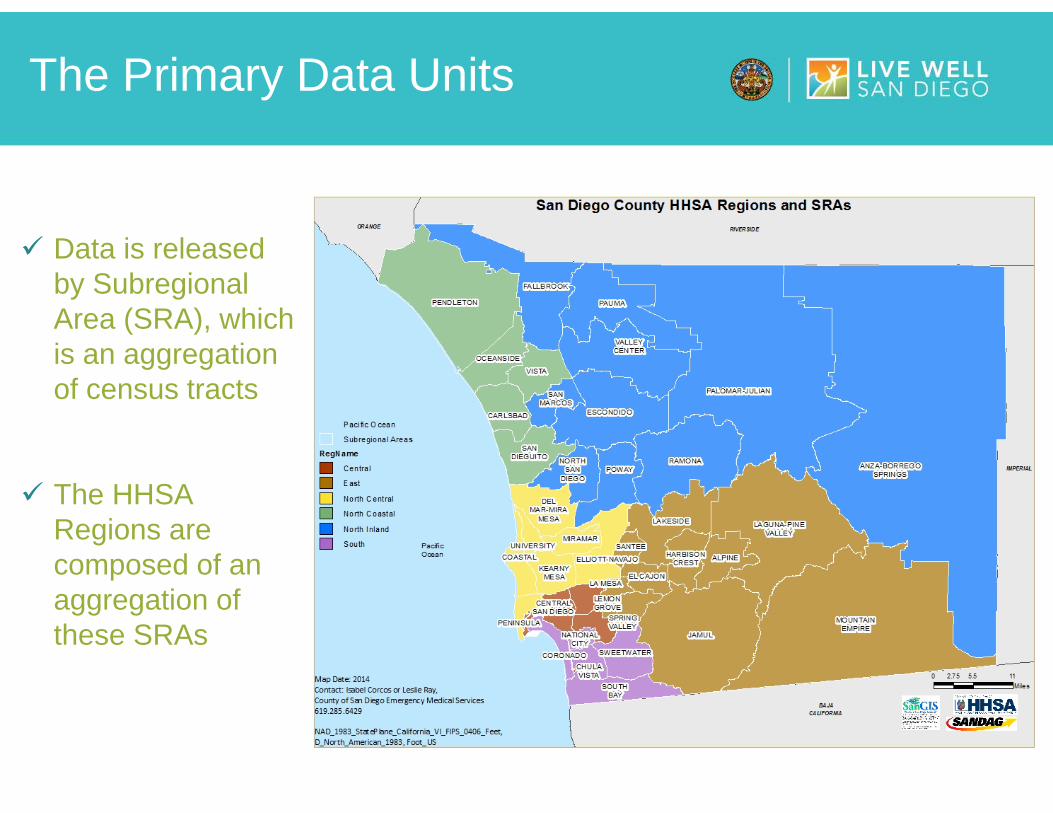
The Primary Data Units
Data is released by SubregionalArea (SRA), which is an aggregation of census tracts
The HHSA Regions are composed of an aggregation of these SRAs
NEW DATA
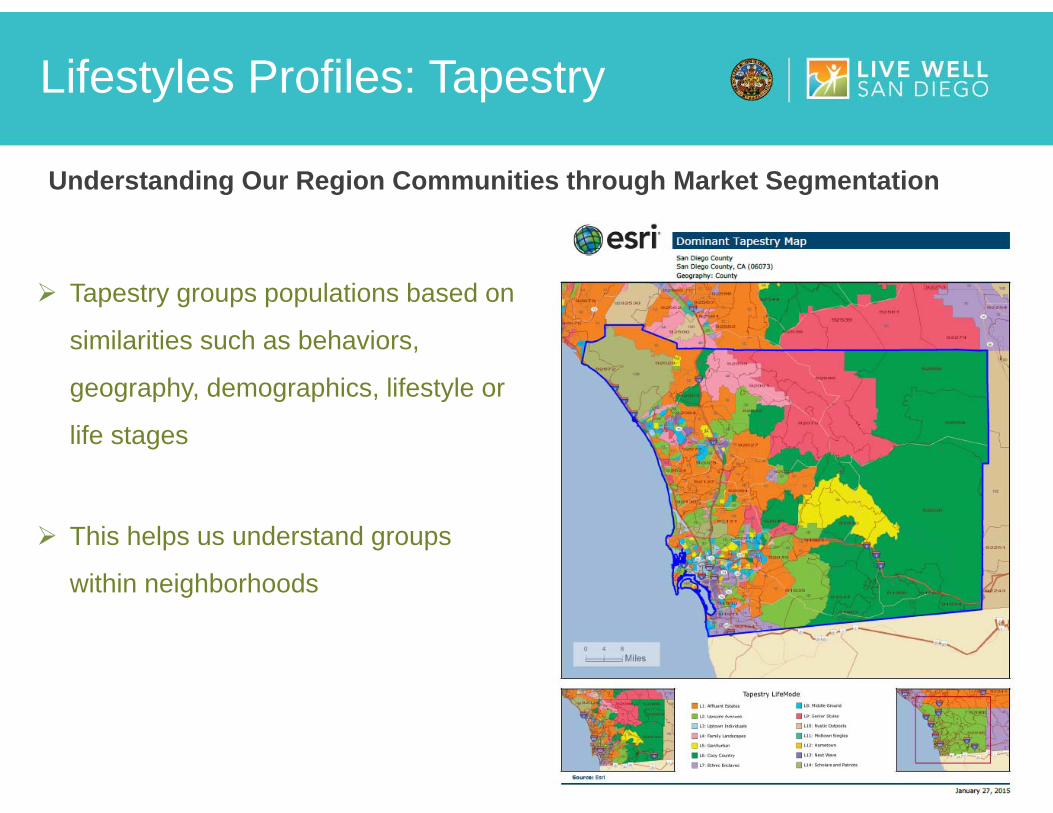
Lifestyles Profiles: Tapestry
Understanding Our Region Communities through Market Segmentation
Tapestry groups populations based on
similarities such as behaviors,
geography, demographics, lifestyle or
life stages
This helps us understand groups
within neighborhoods
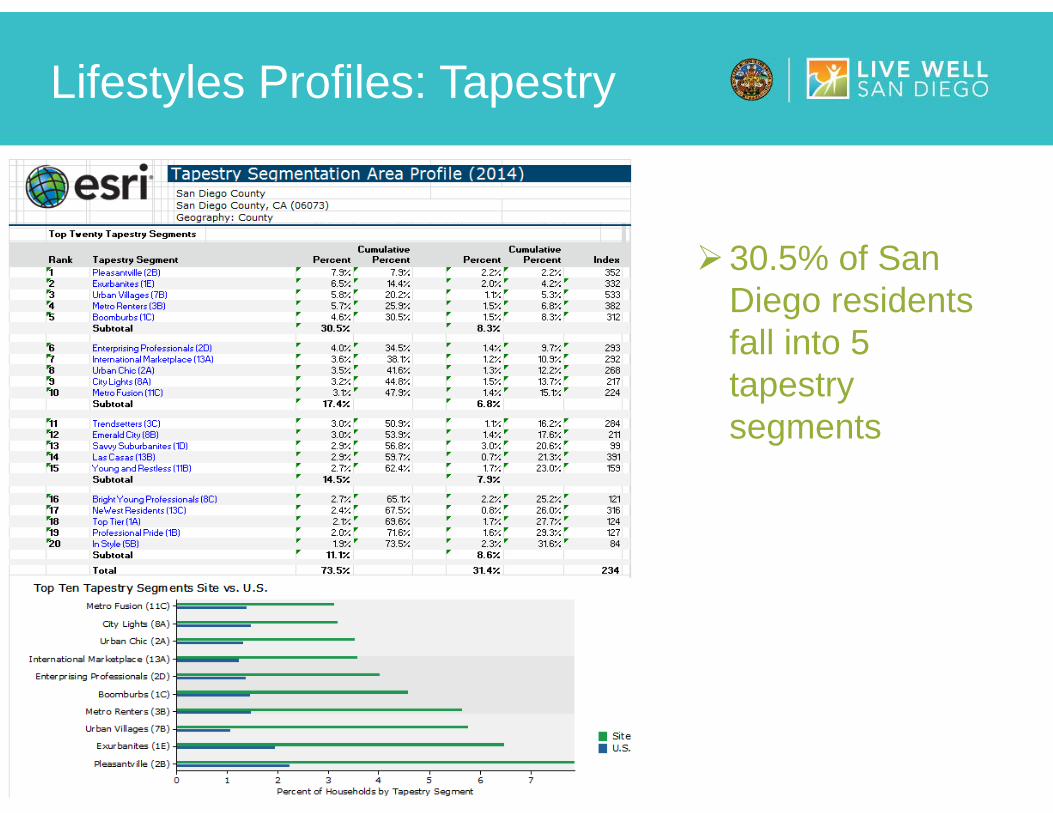
Lifestyles Profiles: Tapestry
30.5% of San Diego residents fall into 5 tapestry segments
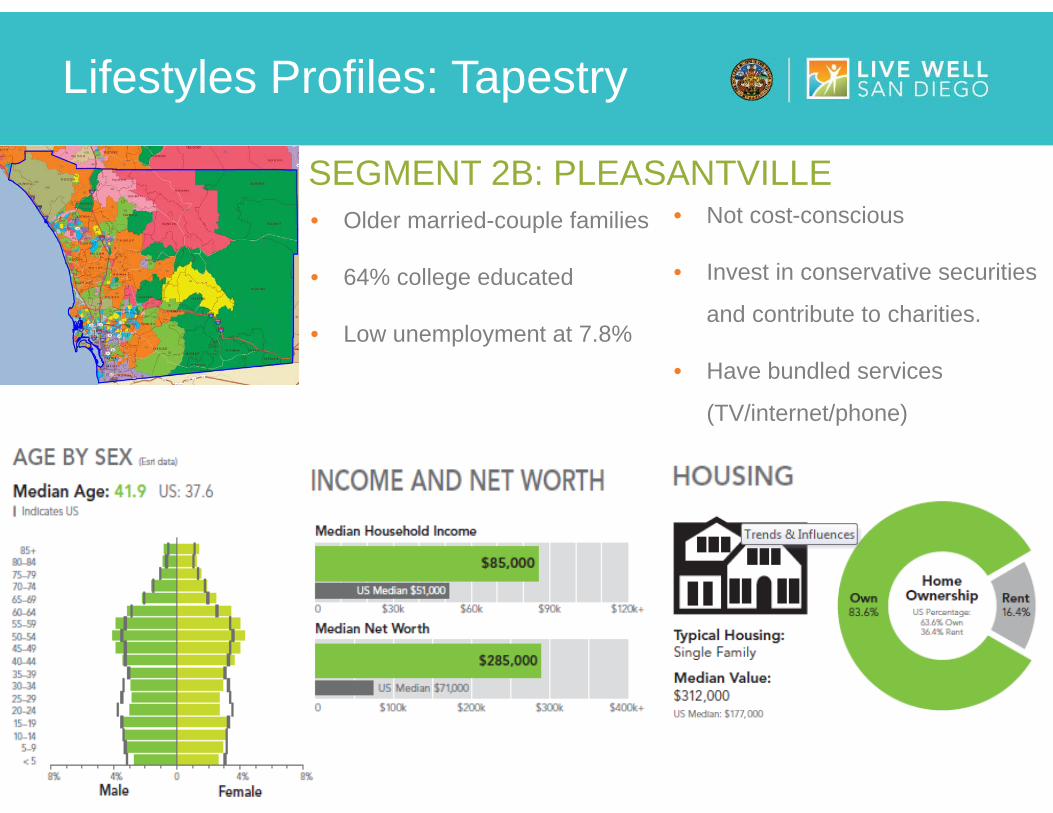
SEGMENT 2B: PLEASANTVILLE• Older married-couple families
• 64% college educated
• Low unemployment at 7.8%
• Not cost-conscious
• Invest in conservative securities
and contribute to charities.
• Have bundled services
(TV/internet/phone)
Lifestyles Profiles: Tapestry
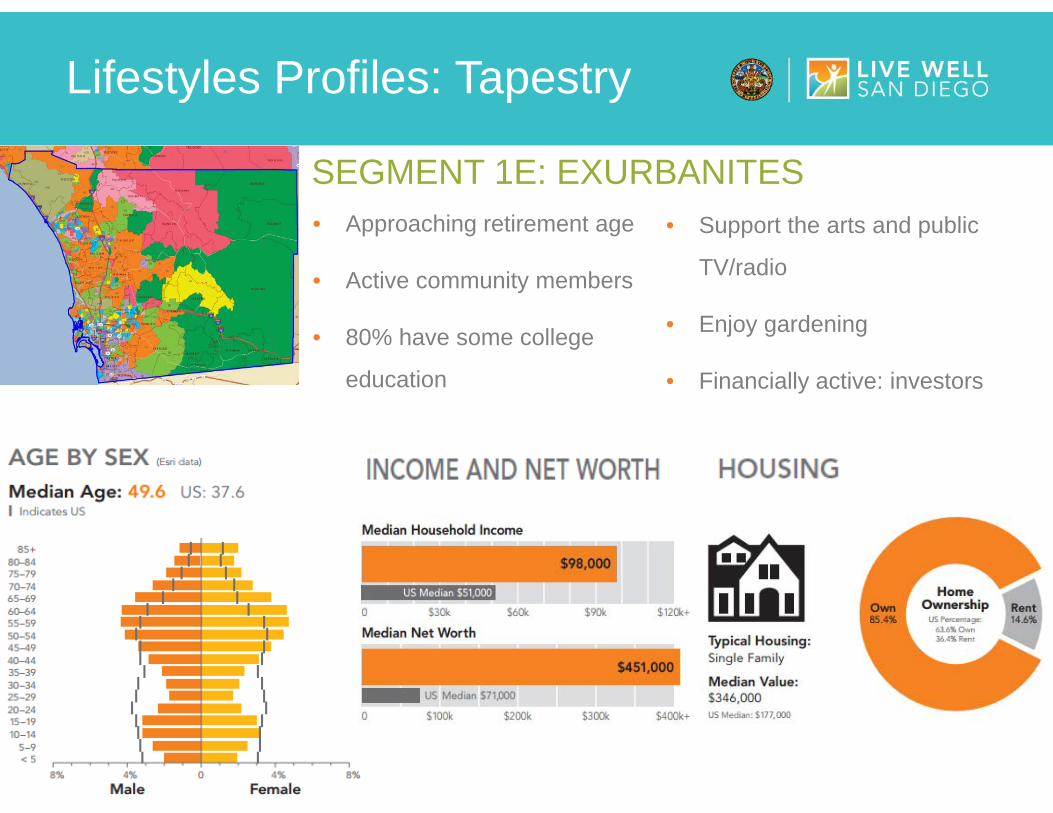
SEGMENT 1E: EXURBANITES• Approaching retirement age
• Active community members
• 80% have some college
education
• Support the arts and public
TV/radio
• Enjoy gardening
• Financially active: investors
Lifestyles Profiles: Tapestry
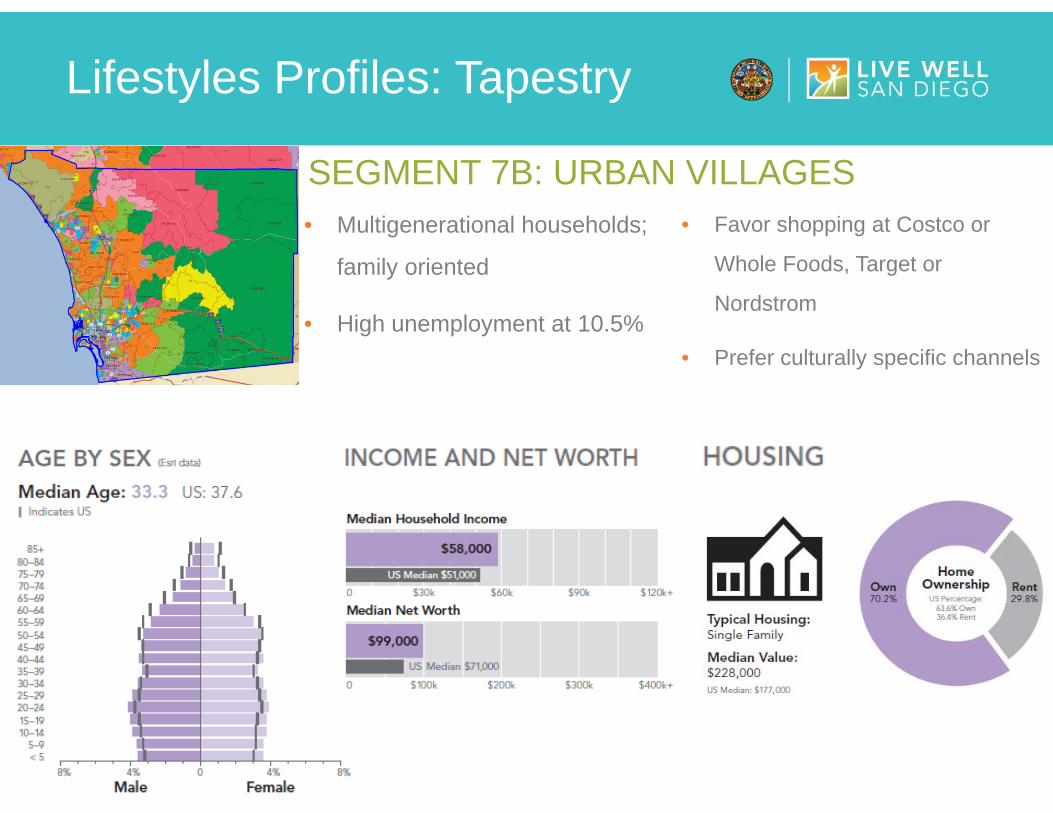
SEGMENT 7B: URBAN VILLAGES• Multigenerational households;
family oriented
• High unemployment at 10.5%
• Favor shopping at Costco or
Whole Foods, Target or
Nordstrom
• Prefer culturally specific channels
Lifestyles Profiles: Tapestry
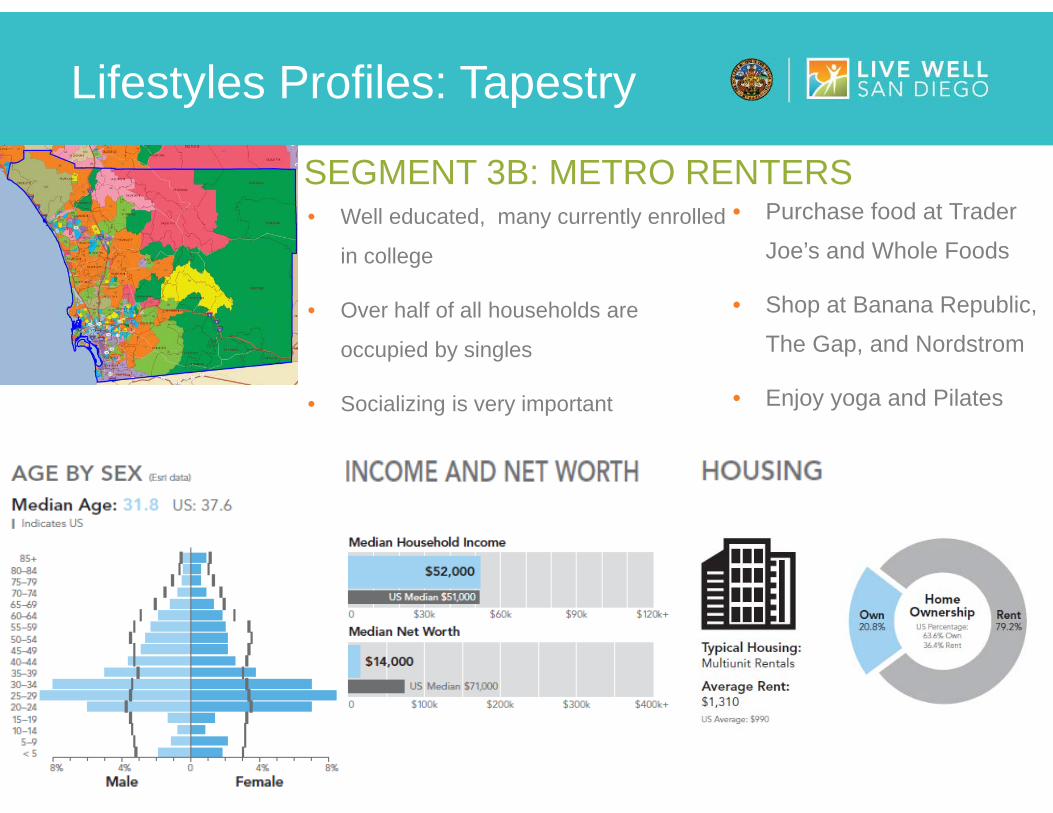
SEGMENT 3B: METRO RENTERS• Well educated, many currently enrolled
in college
• Over half of all households are
occupied by singles
• Socializing is very important
• Purchase food at Trader
Joe’s and Whole Foods
• Shop at Banana Republic,
The Gap, and Nordstrom
• Enjoy yoga and Pilates
Lifestyles Profiles: Tapestry
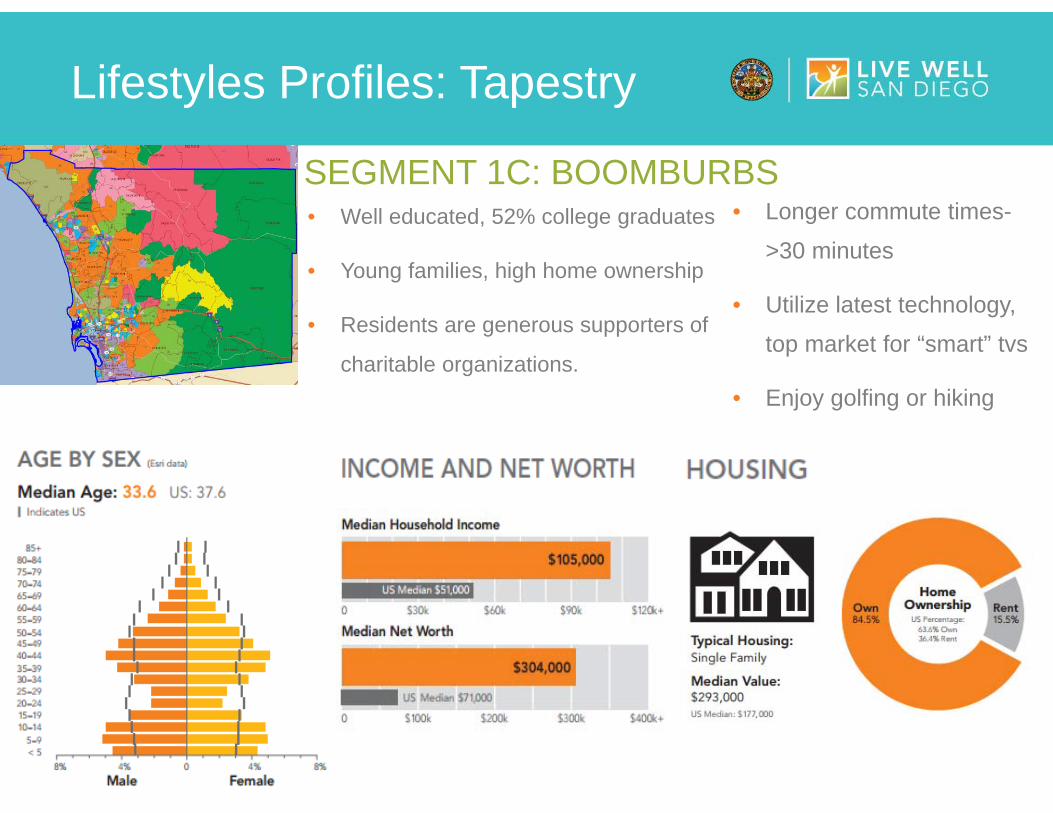
SEGMENT 1C: BOOMBURBS• Well educated, 52% college graduates
• Young families, high home ownership
• Residents are generous supporters of
charitable organizations.
• Longer commute times-
>30 minutes
• Utilize latest technology,
top market for “smart” tvs
• Enjoy golfing or hiking
Lifestyles Profiles: Tapestry
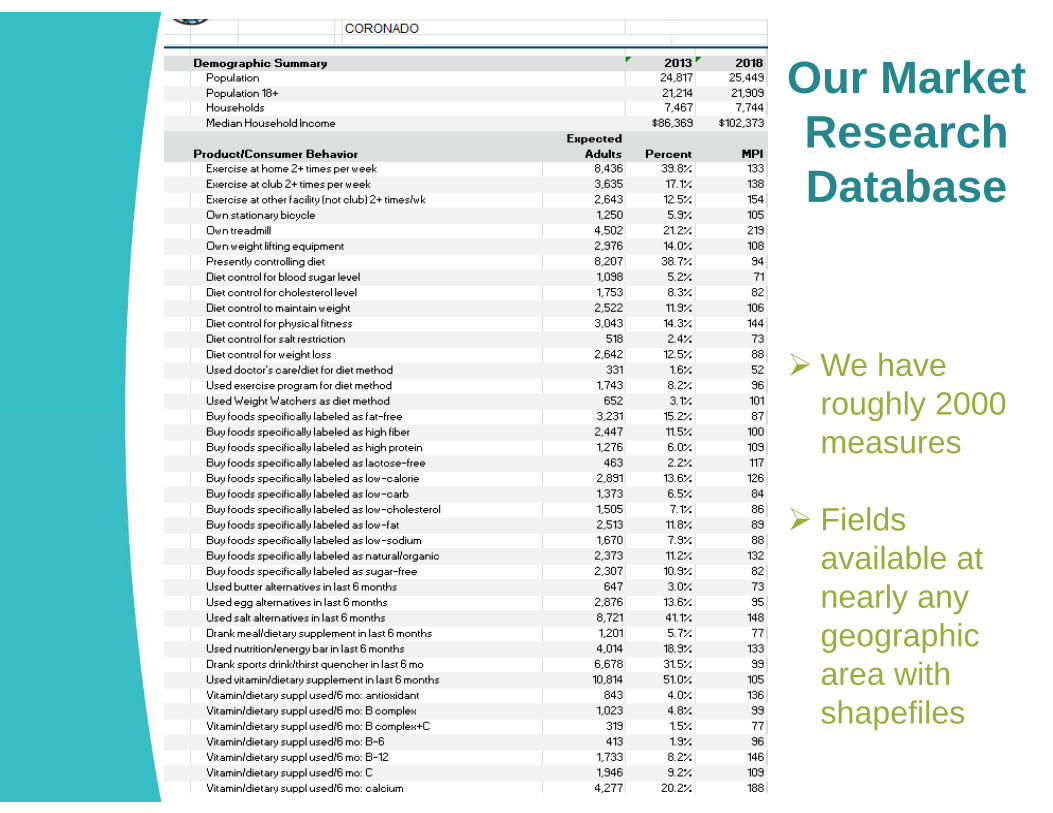
We have roughly 2000 measures
Fields available at nearly any geographic area with shapefiles
Our Market Research Database
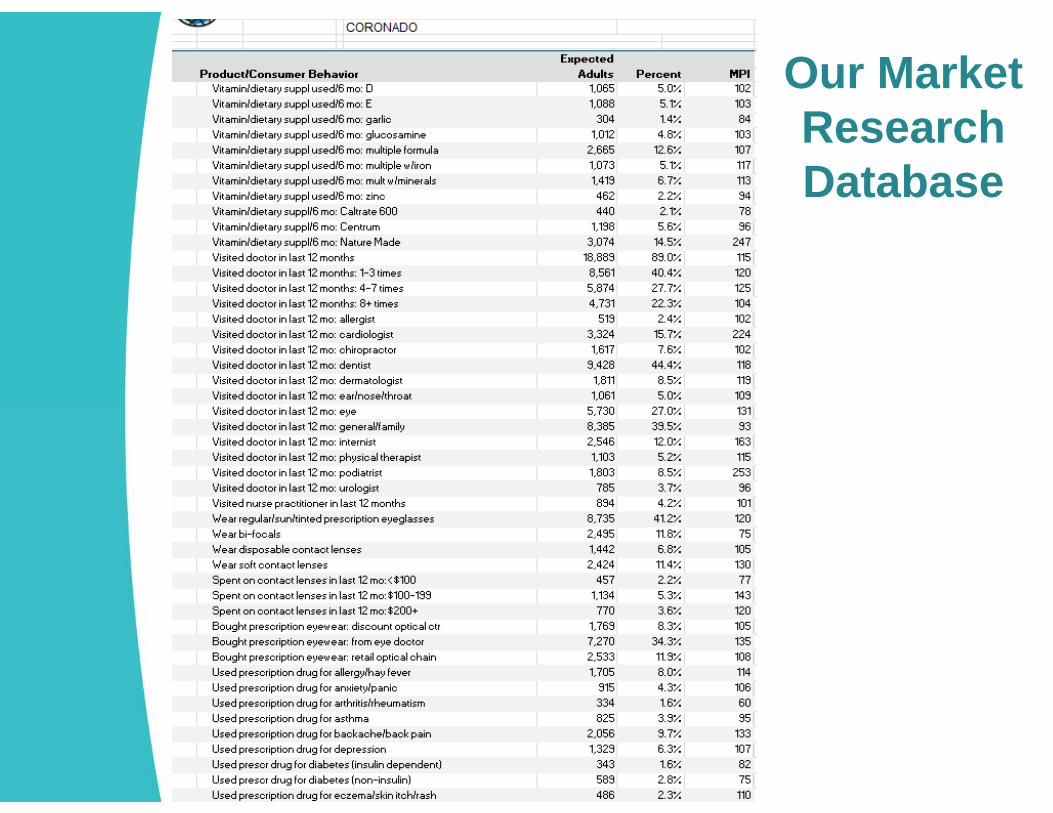
Our Market Research Database
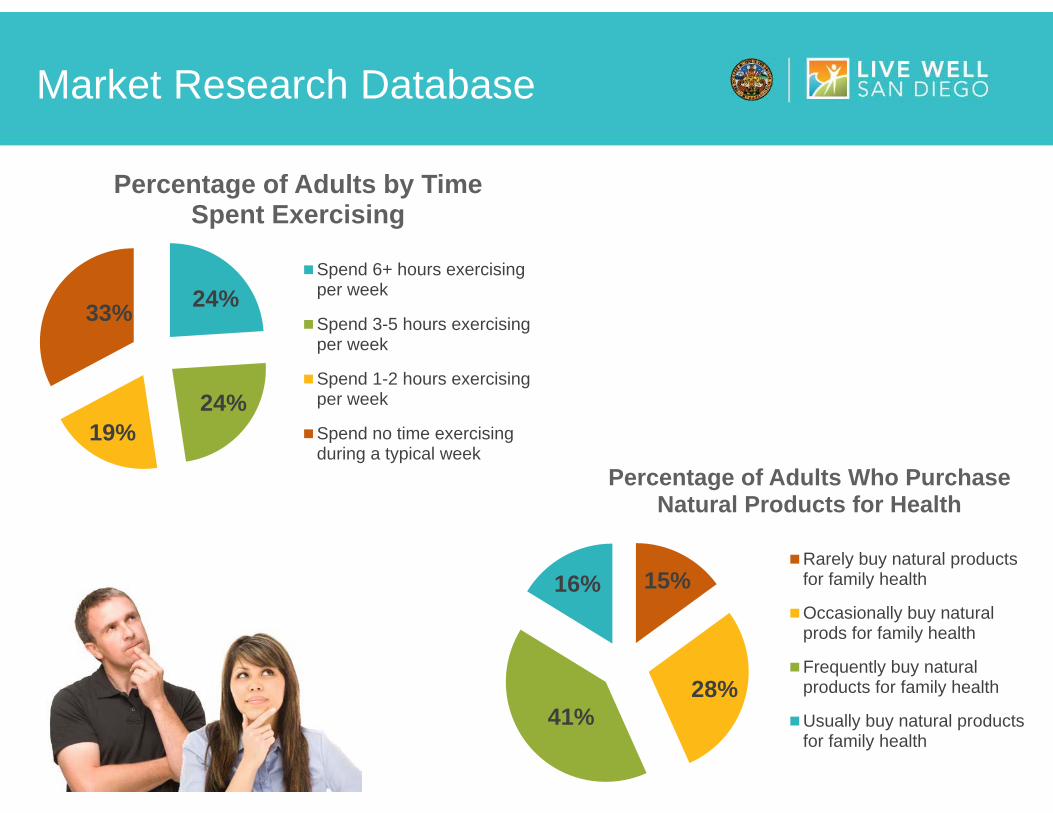
Market Research Database
24%
24%19%
33%
Percentage of Adults by Time Spent Exercising
Spend 6+ hours exercisingper week
Spend 3-5 hours exercisingper week
Spend 1-2 hours exercisingper week
Spend no time exercisingduring a typical week
15%
28%41%
16%
Percentage of Adults Who Purchase Natural Products for Health
Rarely buy natural productsfor family health
Occasionally buy naturalprods for family health
Frequently buy naturalproducts for family health
Usually buy natural productsfor family health
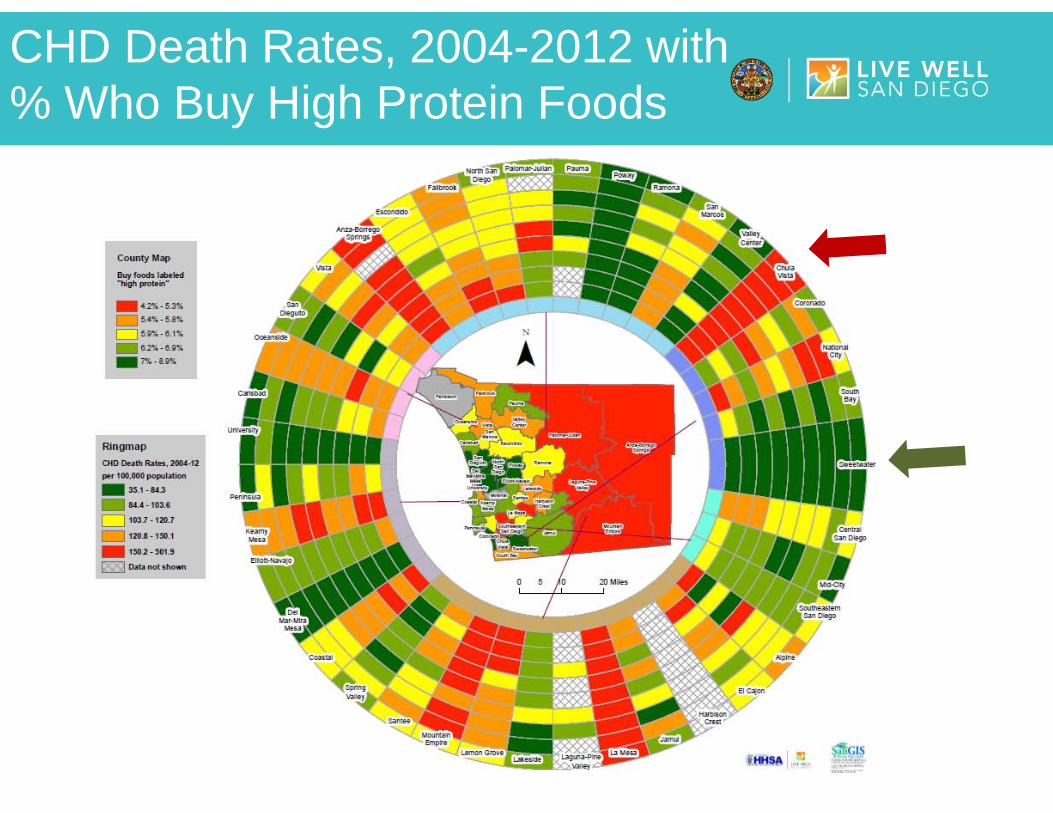
CHD Death Rates, 2004-2012 with % Who Buy High Protein Foods

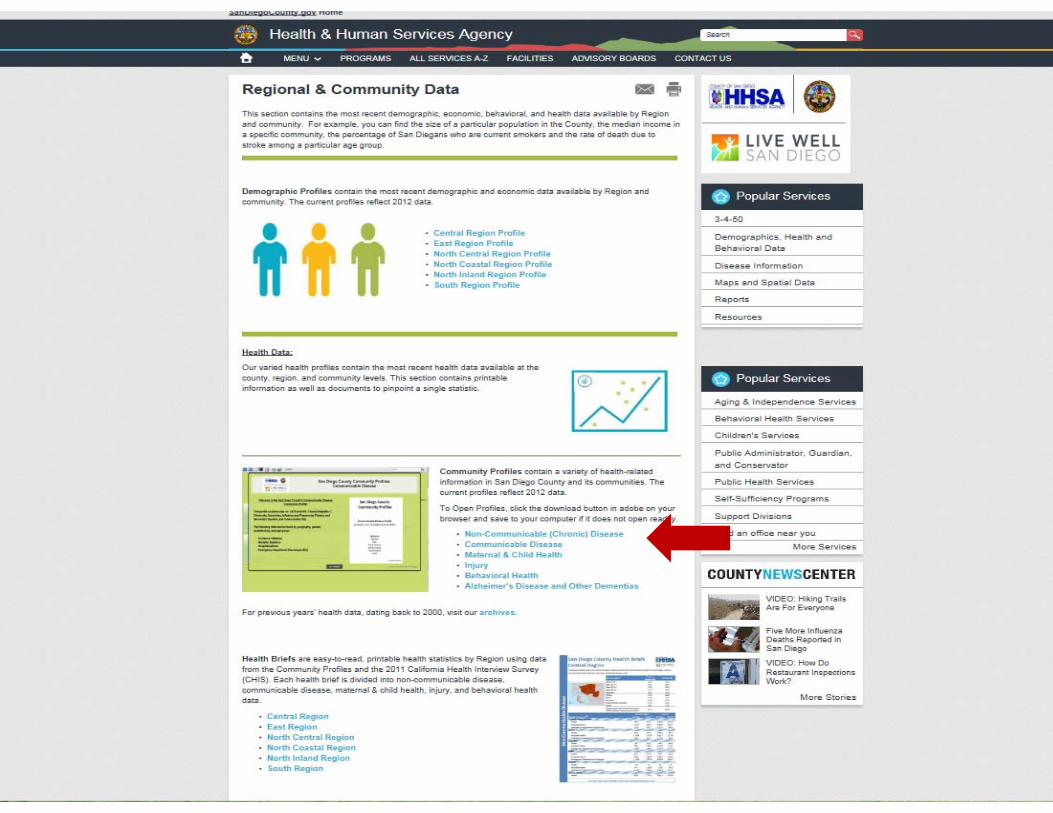
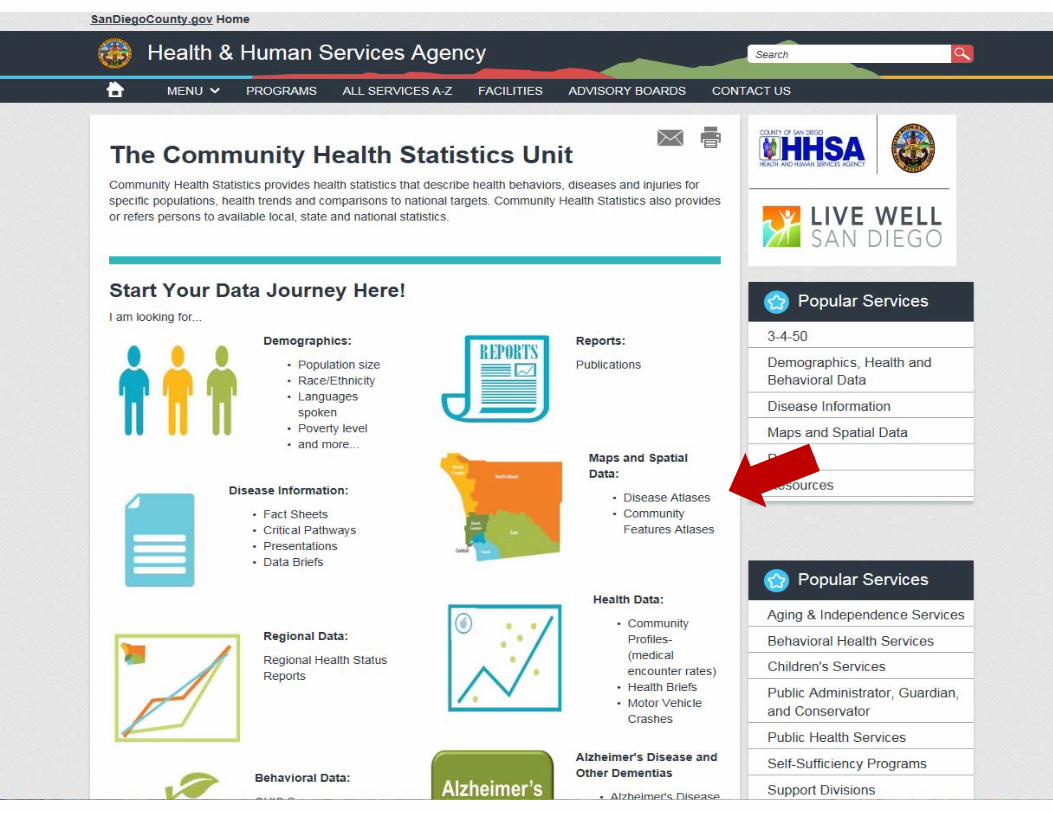
NAVIGATING THE WEBSITE
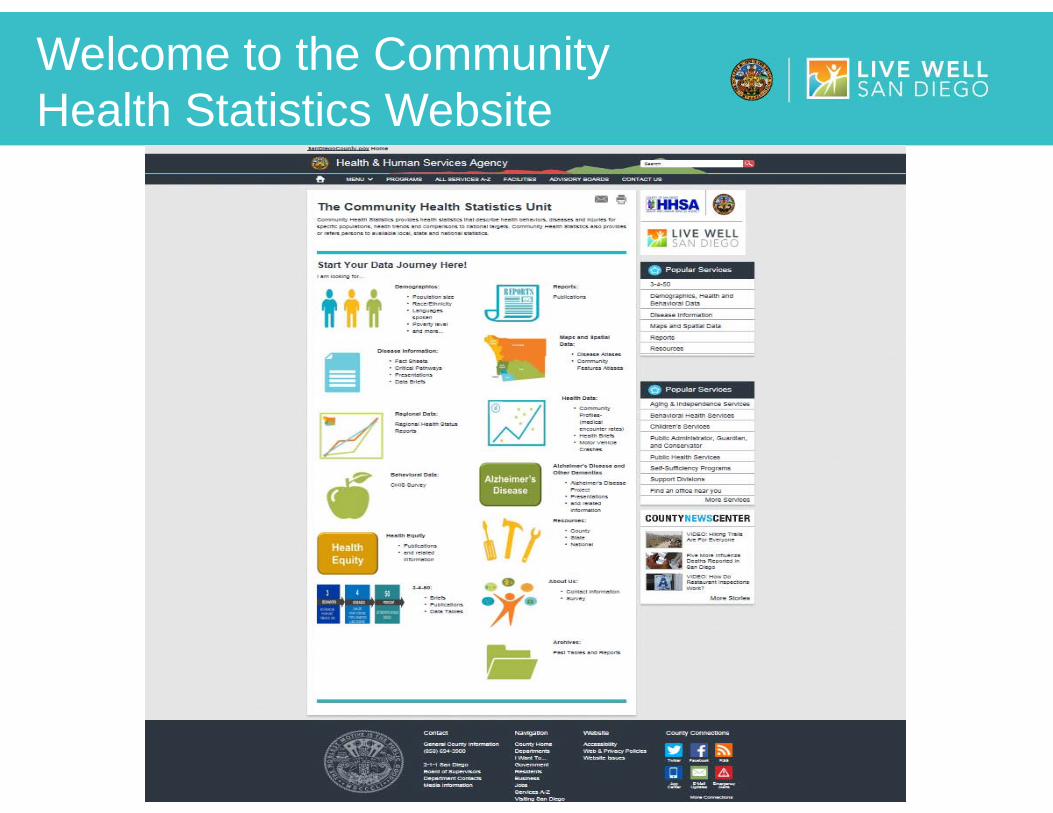
Welcome to the Community Health Statistics Website
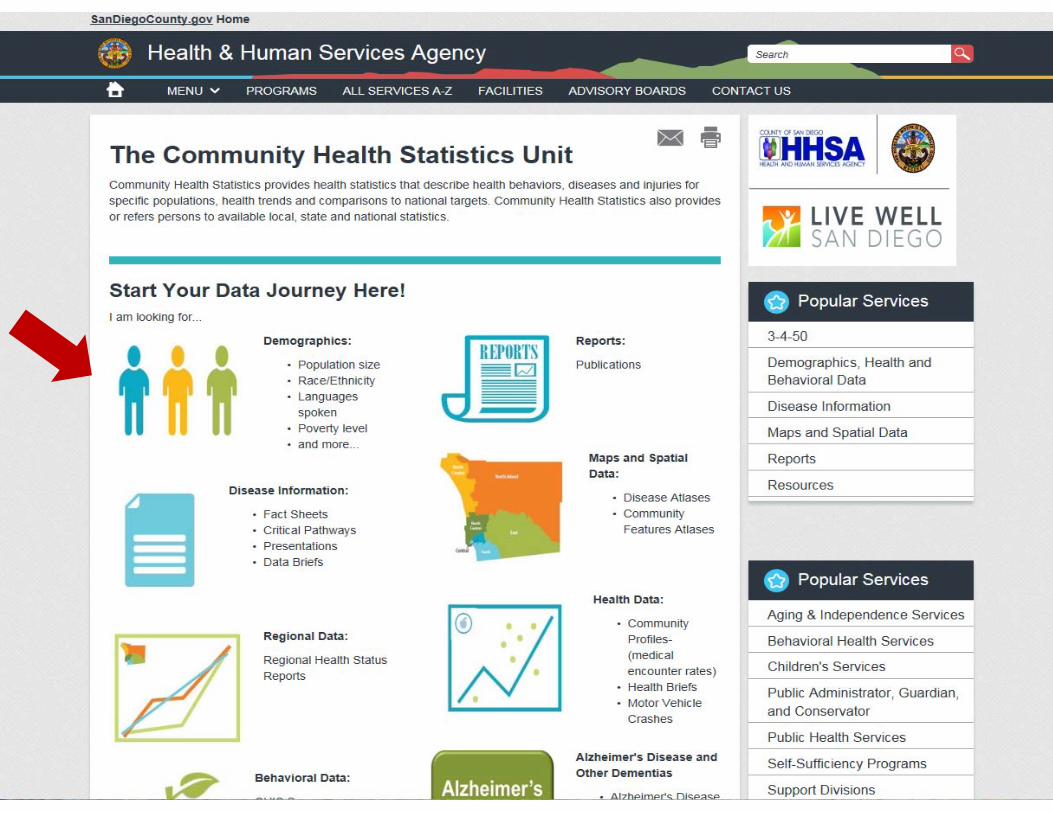
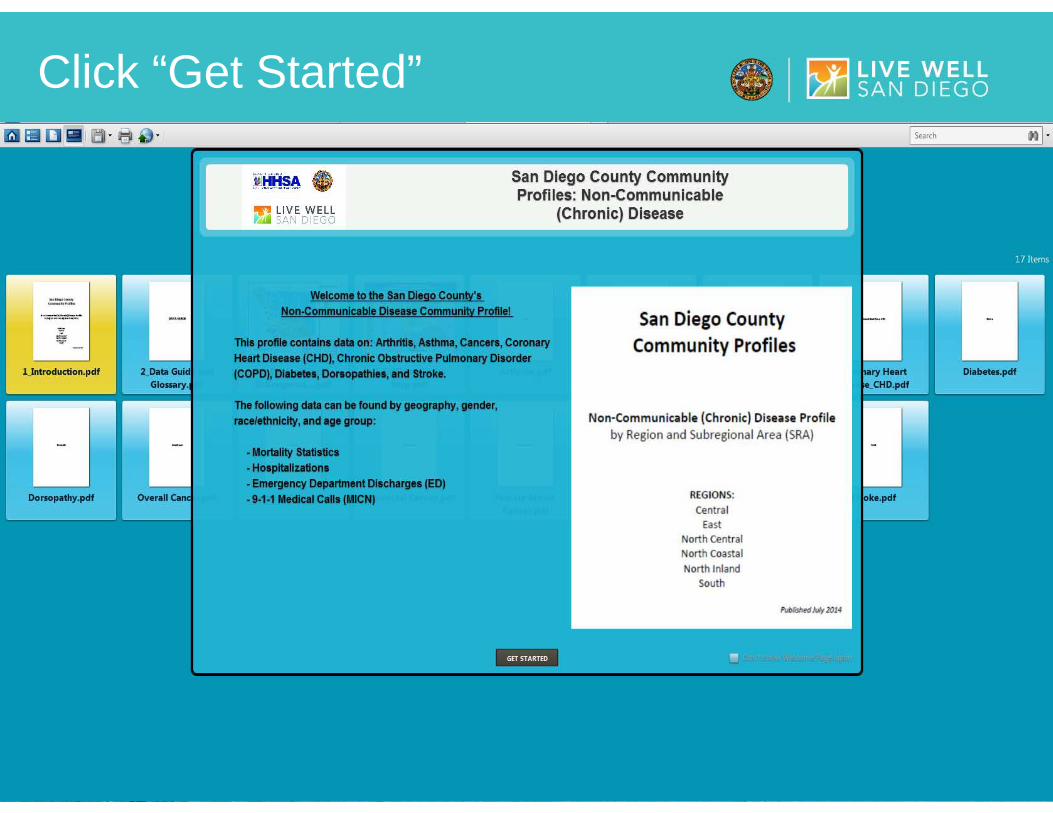
Click “Get Started”
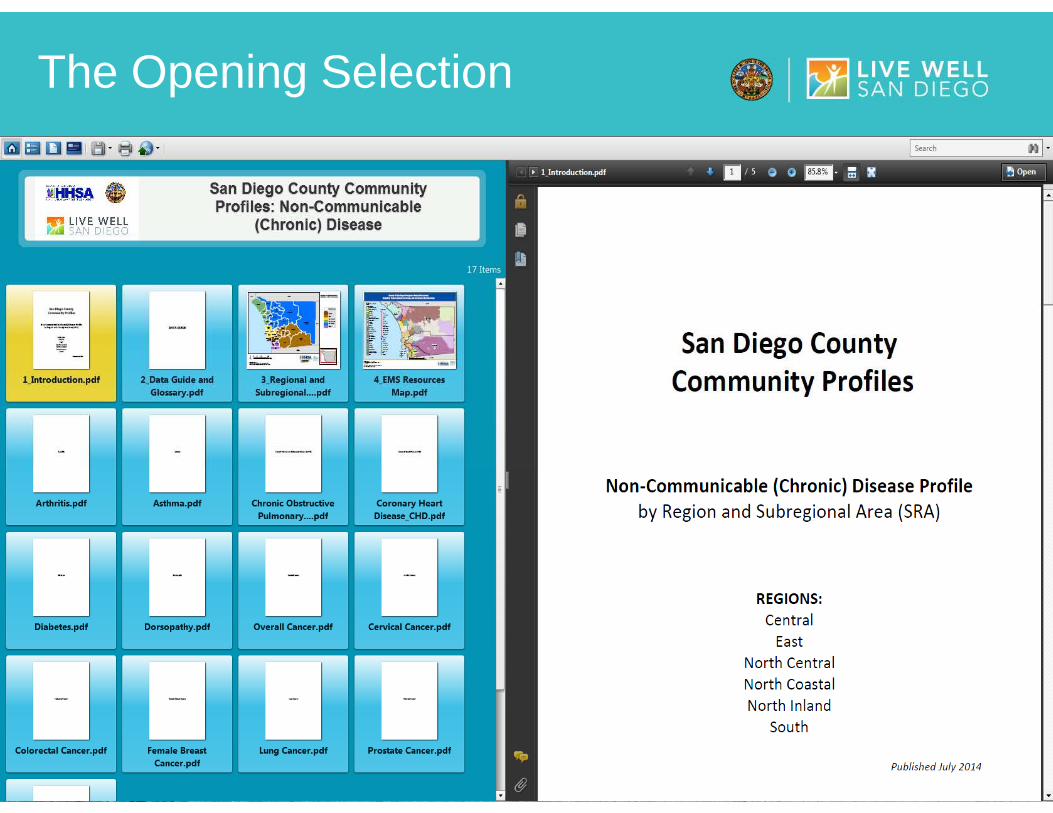
The Opening Selection
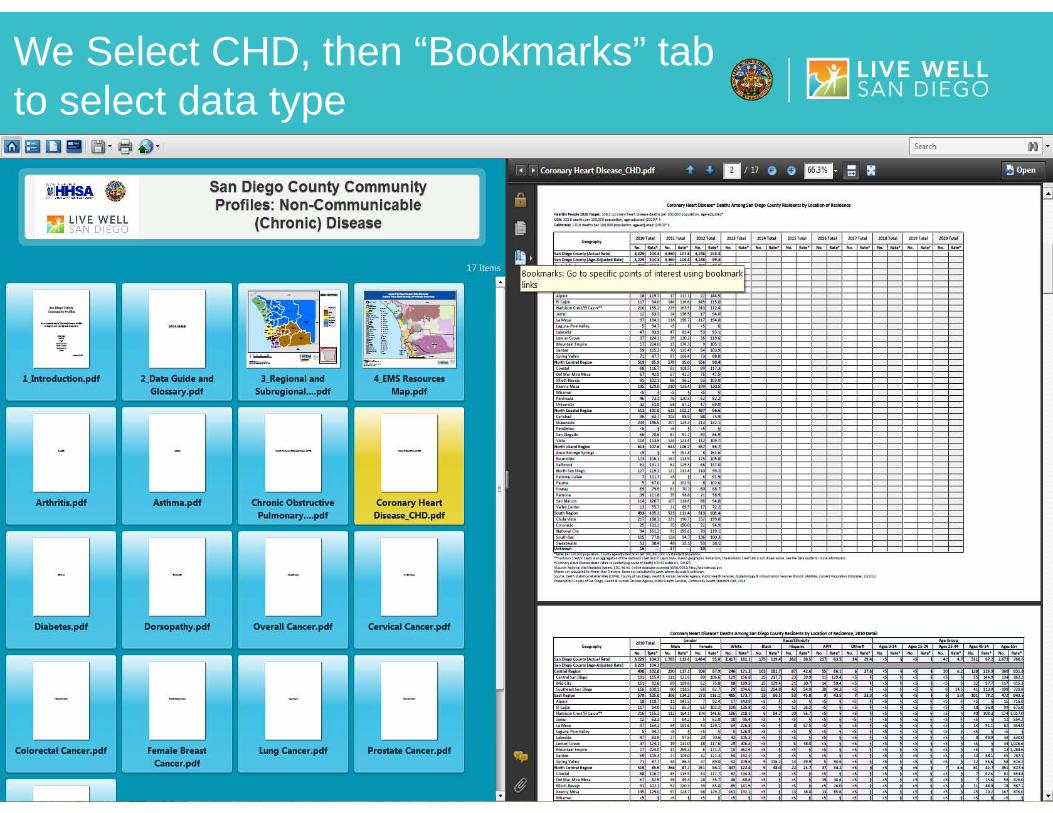
We Select CHD, then “Bookmarks” tab to select data type
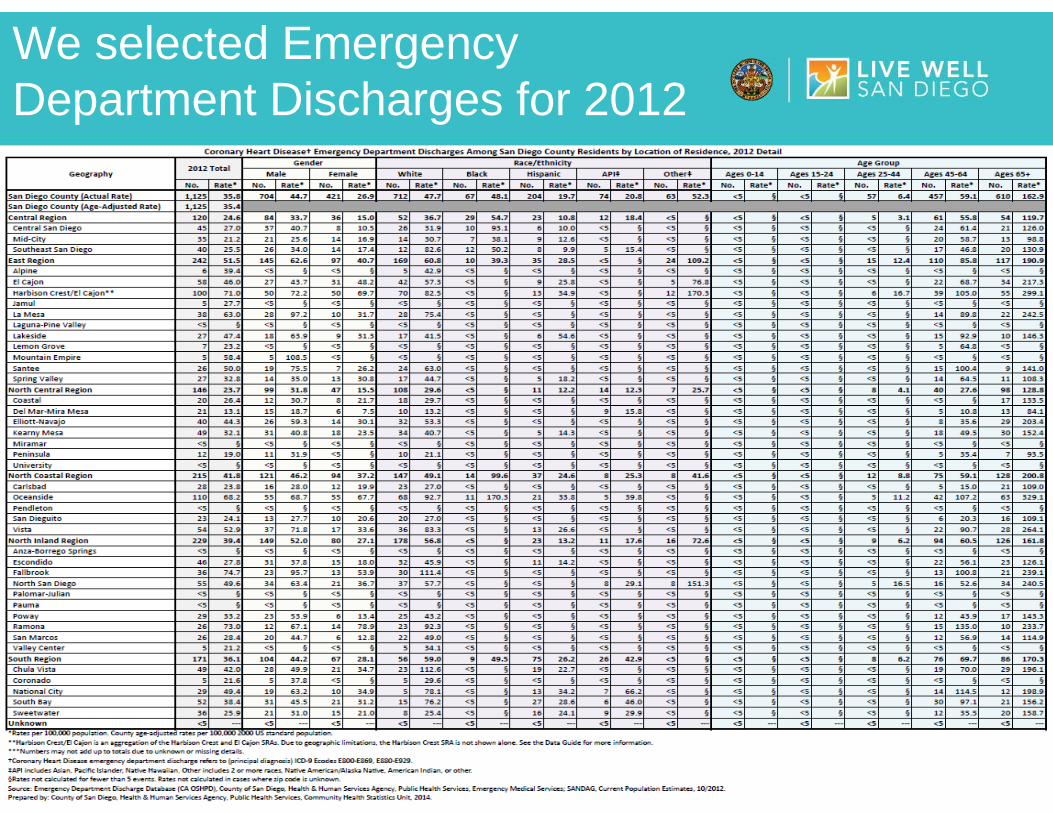
We selected Emergency Department Discharges for 2012
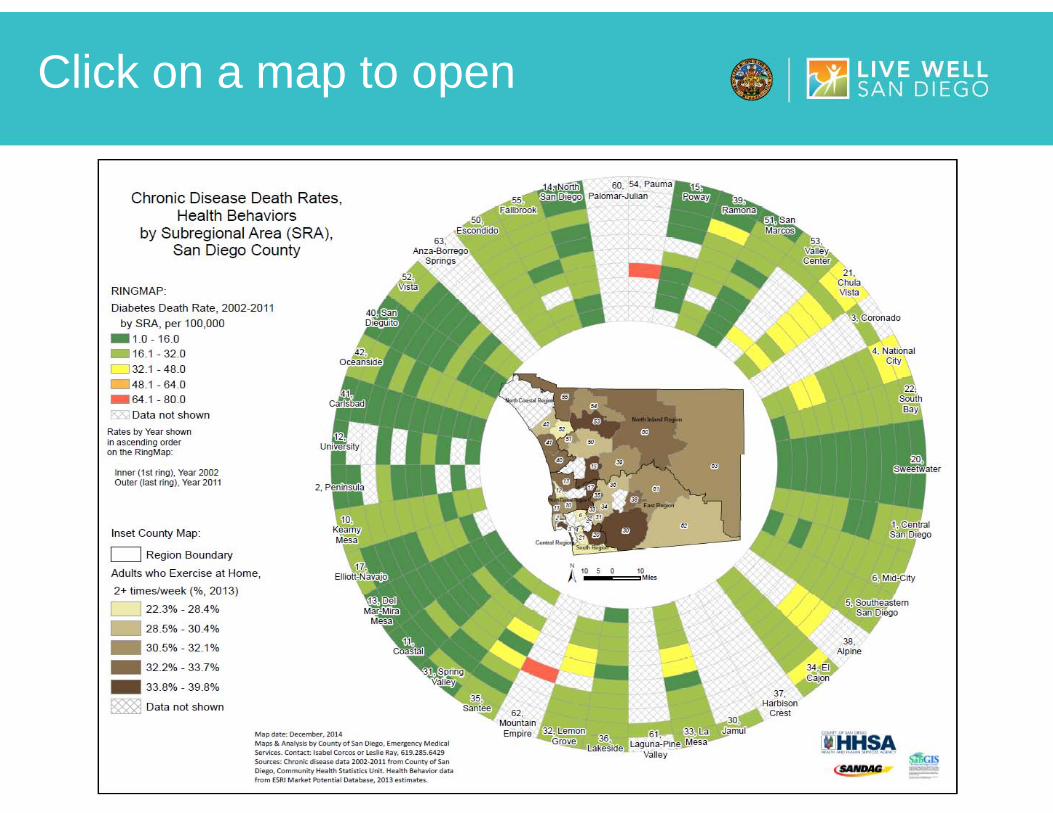
Click on a map to open
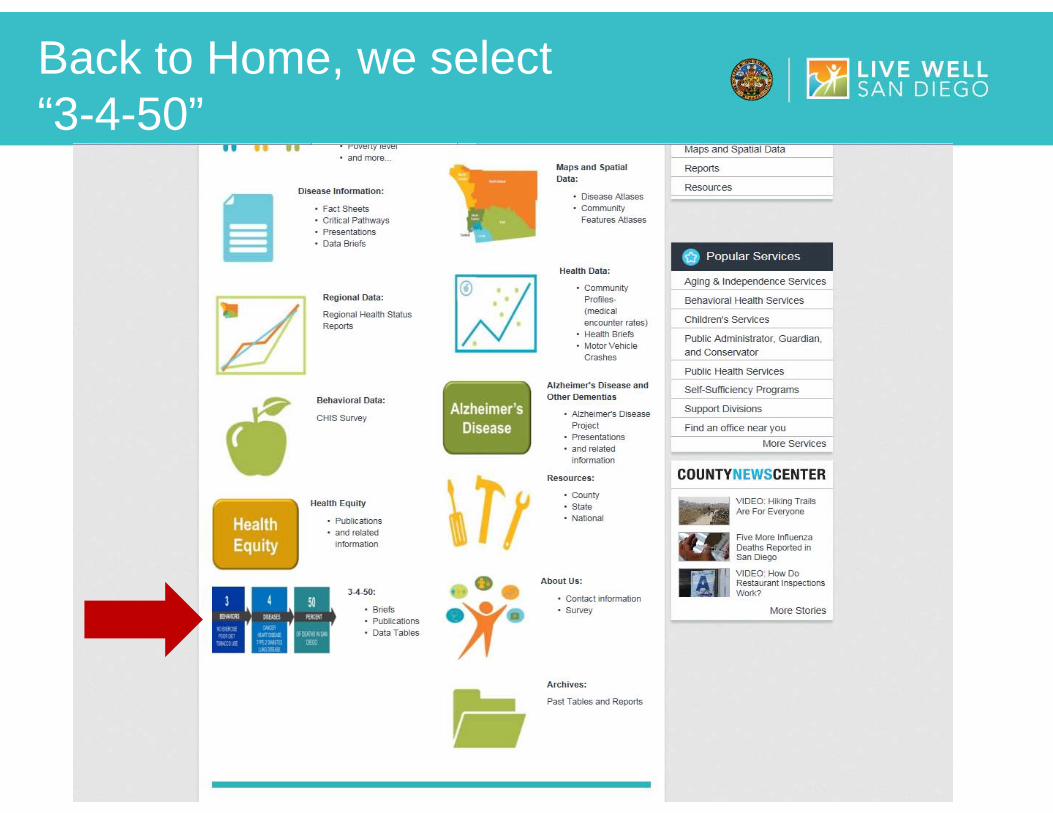
Back to Home, we select “3-4-50”
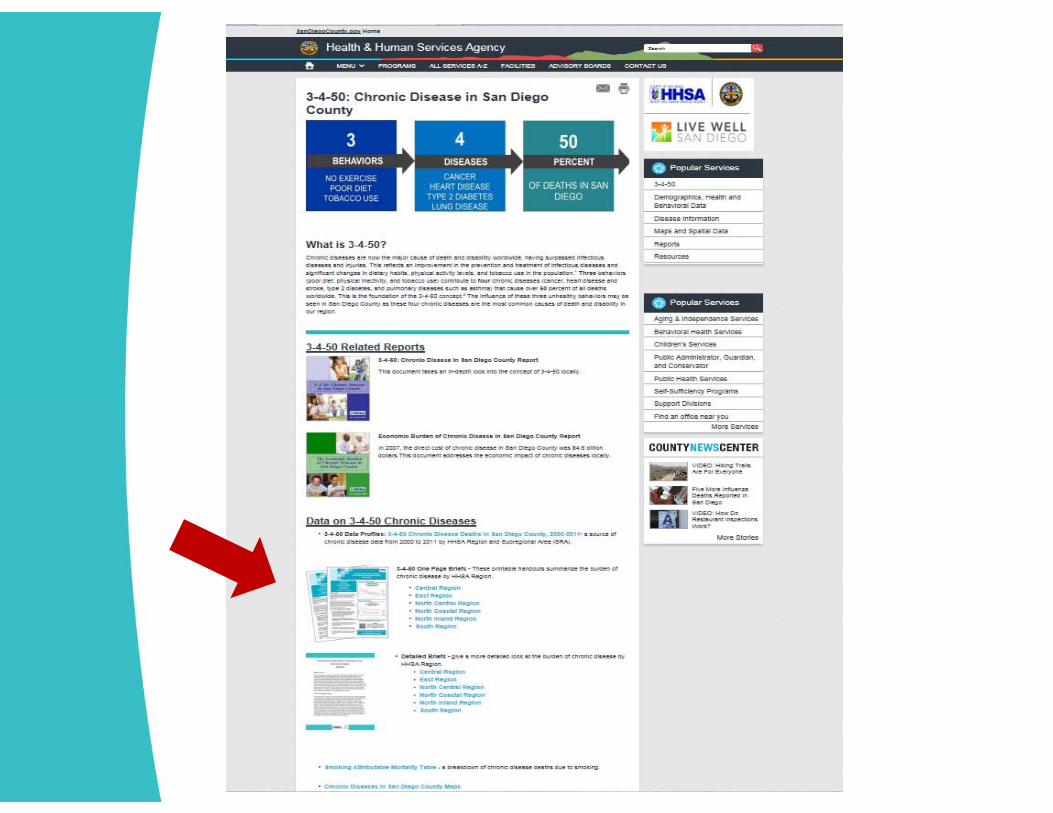
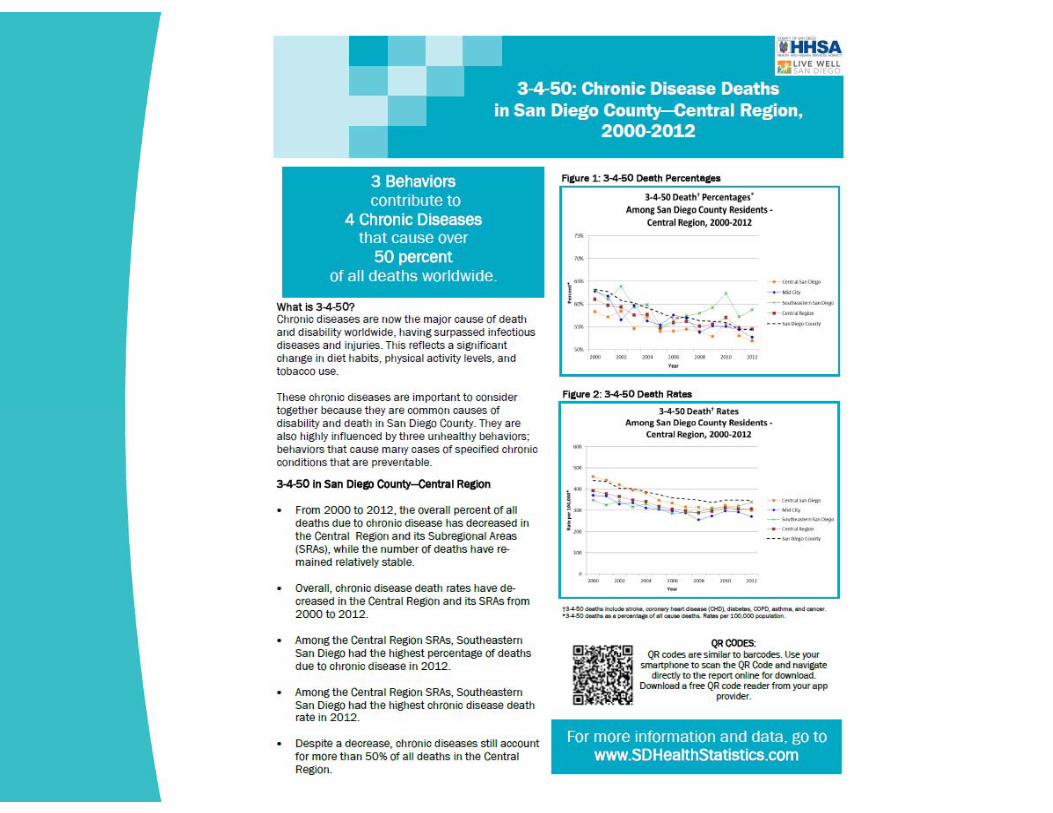
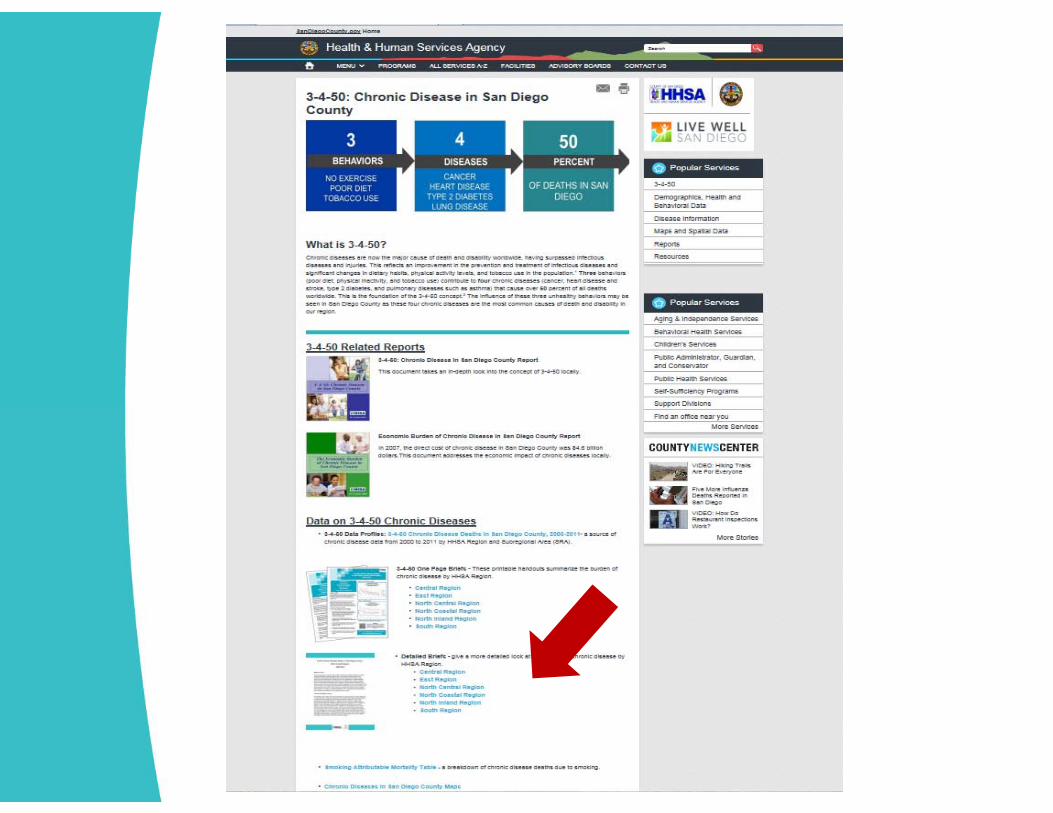
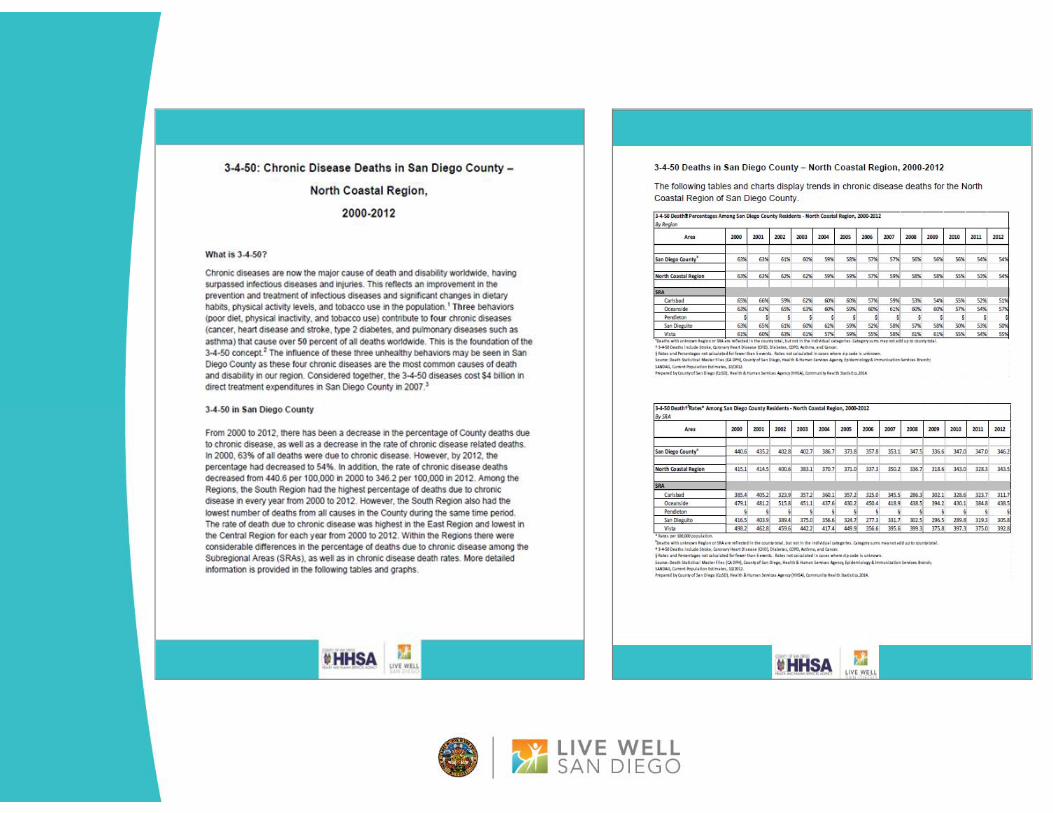
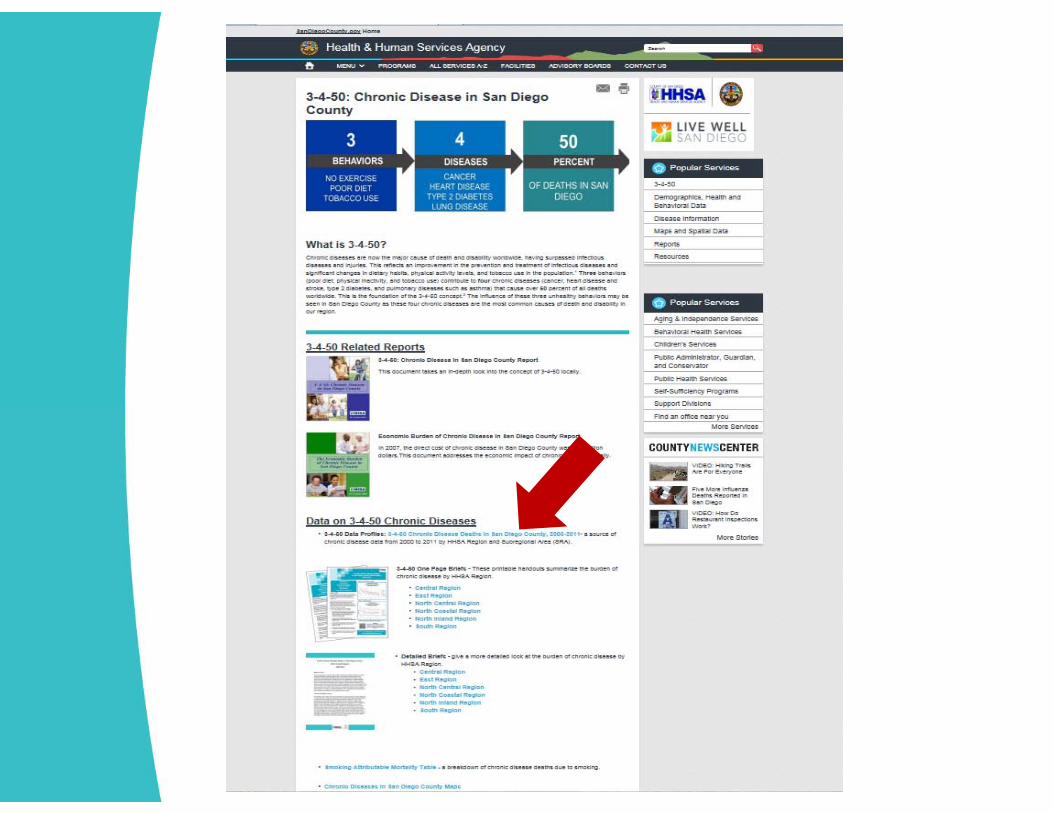
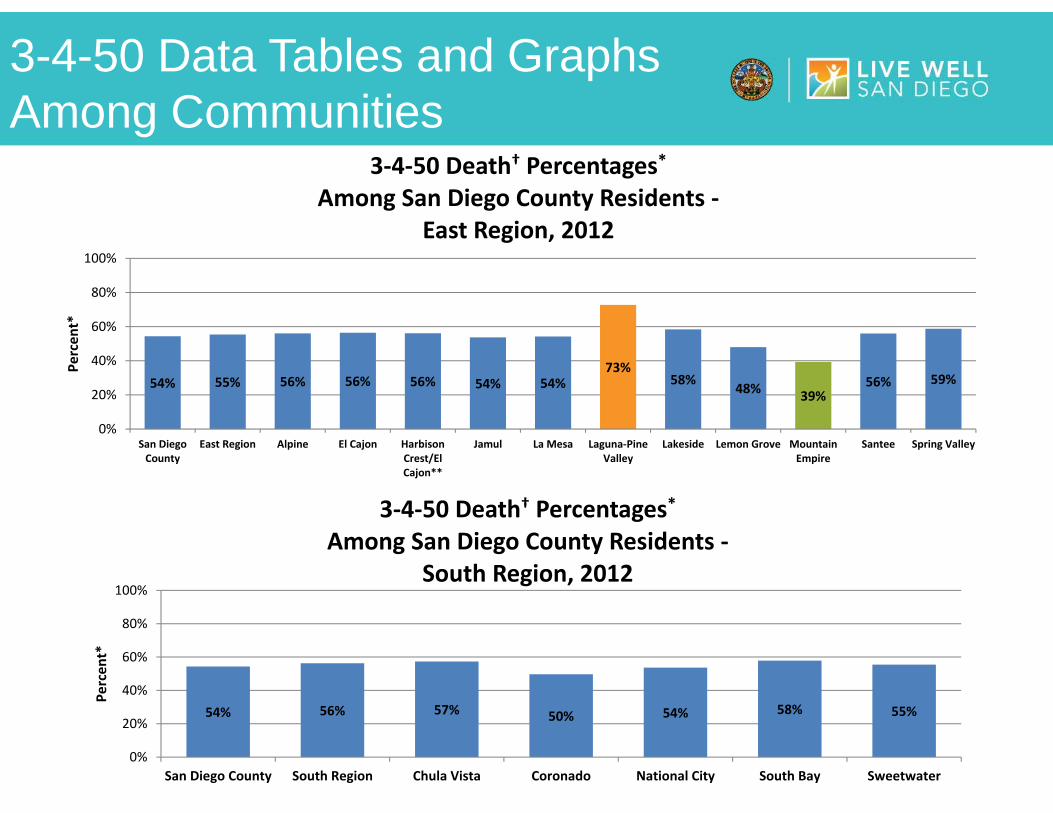
3-4-50 Data Tables and Graphs Among Communities
54% 56% 57% 50% 54% 58% 55%
0%
20%
40%
60%
80%
100%
San Diego County South Region Chula Vista Coronado National City South Bay Sweetwater
Percen
t*
3‐4‐50 Death† Percentages*Among San Diego County Residents ‐
South Region, 2012
54% 55% 56% 56% 56% 54% 54%73%
58% 48% 39%56% 59%
0%
20%
40%
60%
80%
100%
San DiegoCounty
East Region Alpine El Cajon HarbisonCrest/ElCajon**
Jamul La Mesa Laguna‐PineValley
Lakeside Lemon Grove MountainEmpire
Santee Spring Valley
Percen
t*
3‐4‐50 Death† Percentages*Among San Diego County Residents ‐
East Region, 2012
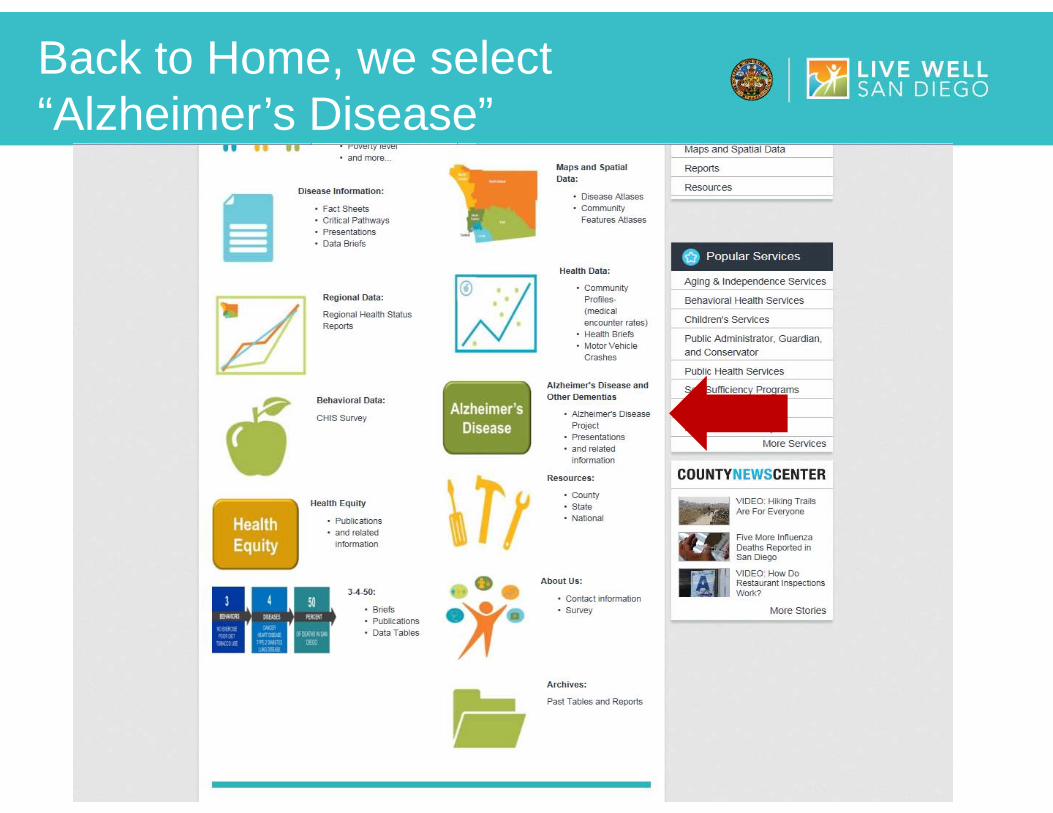
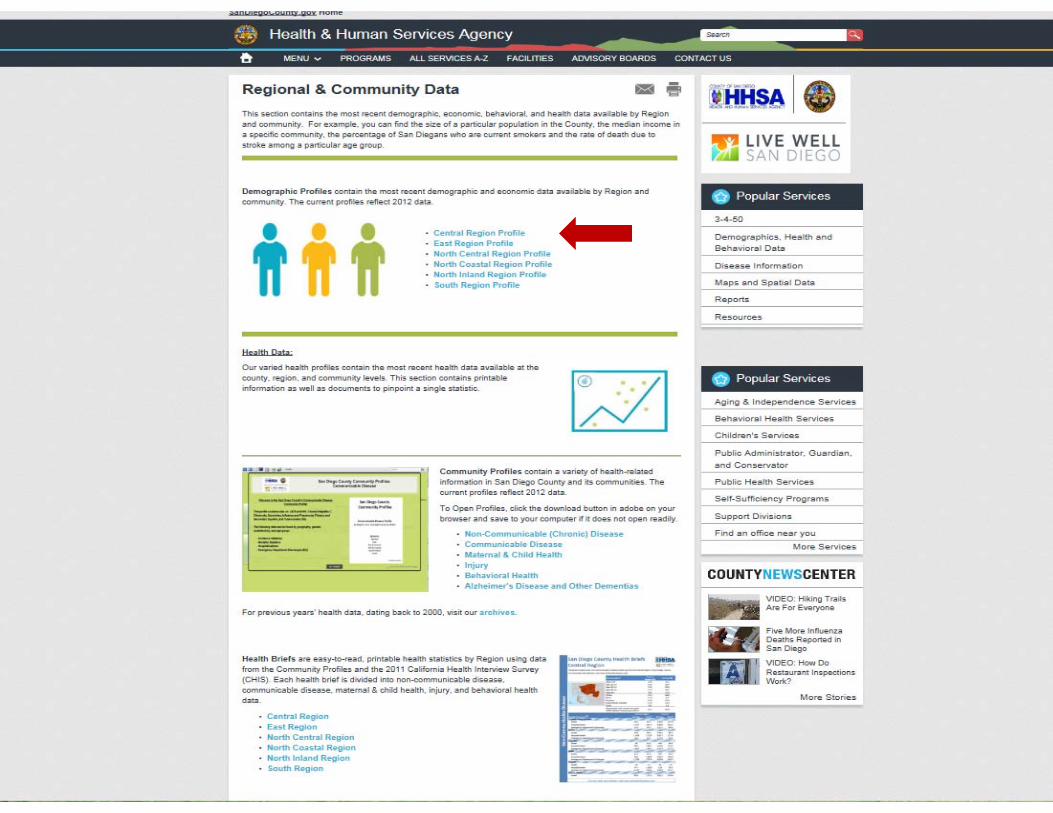
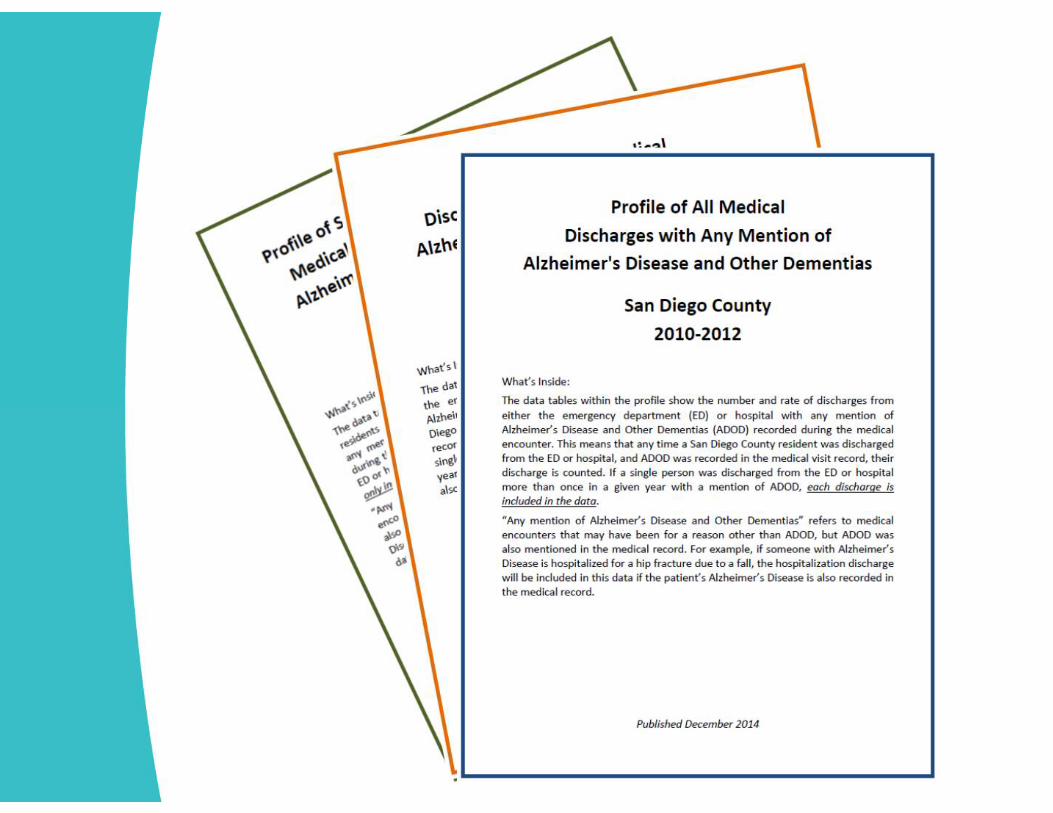
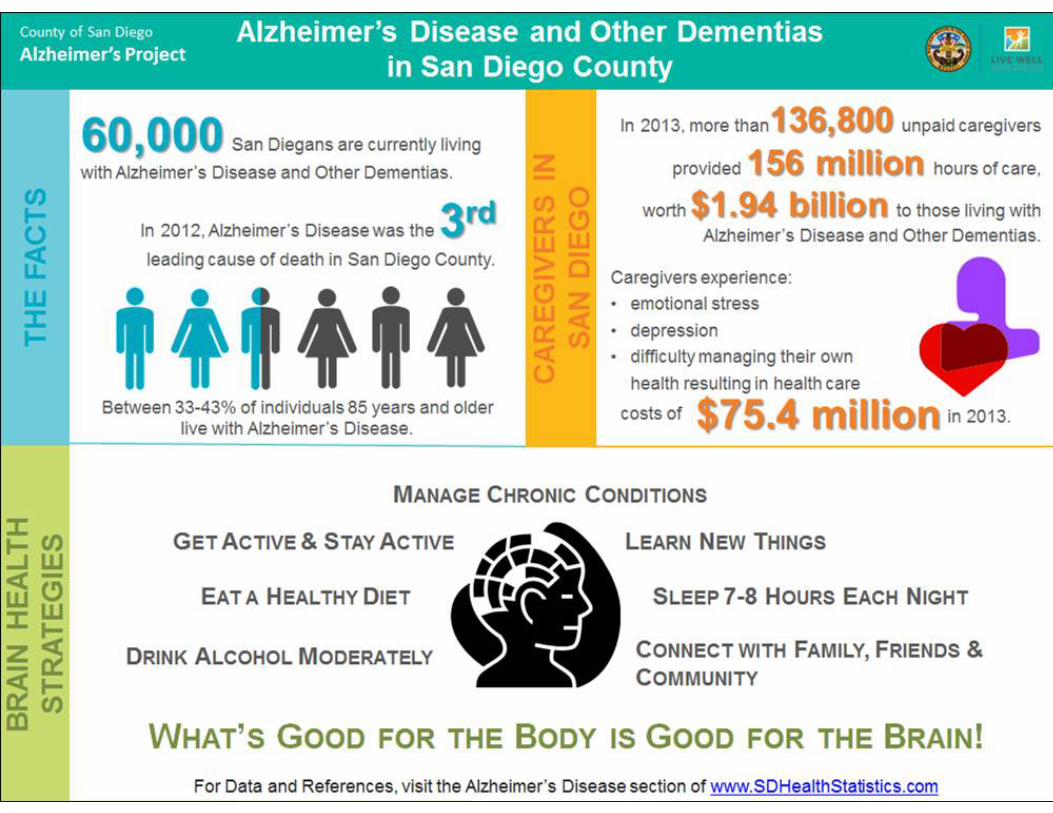
Back to Home, we select “Alzheimer’s Disease”
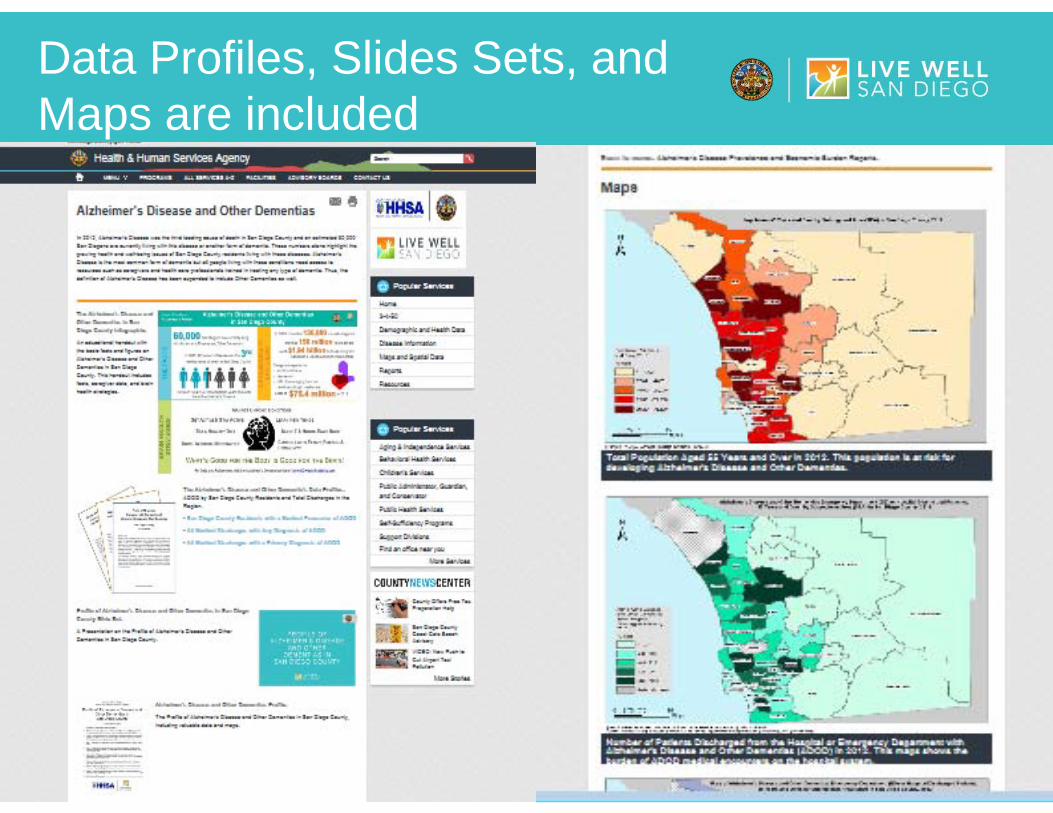
Data Profiles, Slides Sets, and Maps are included
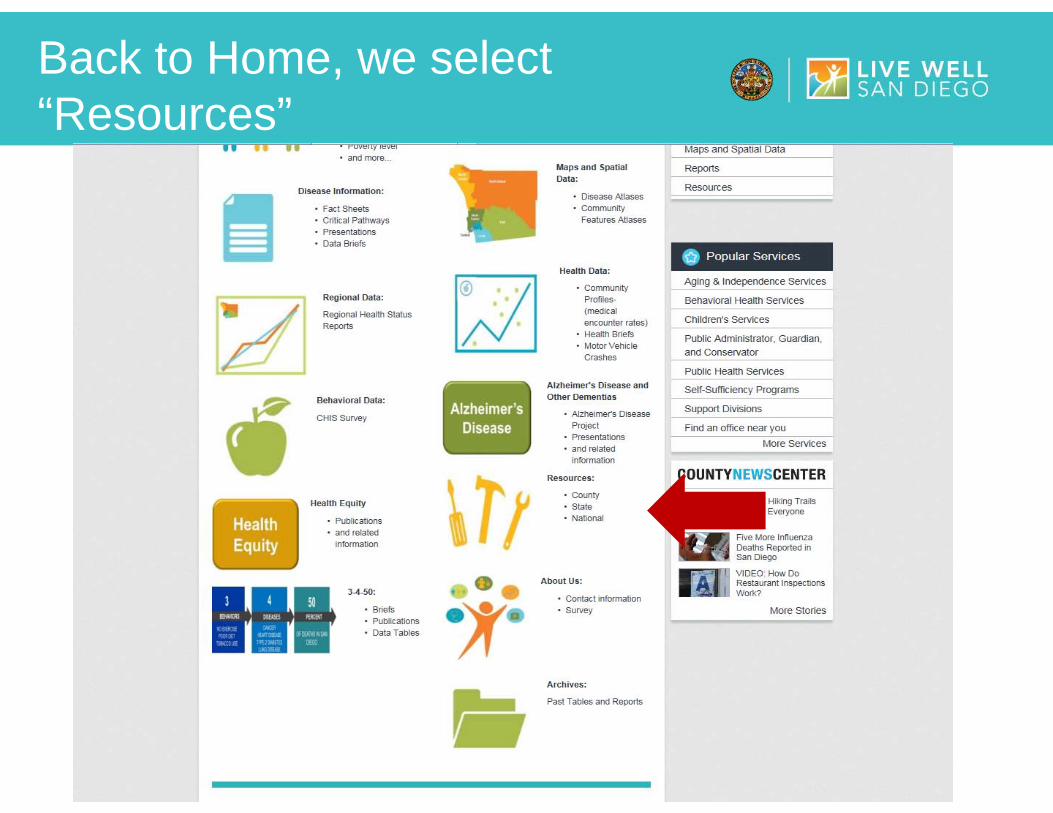
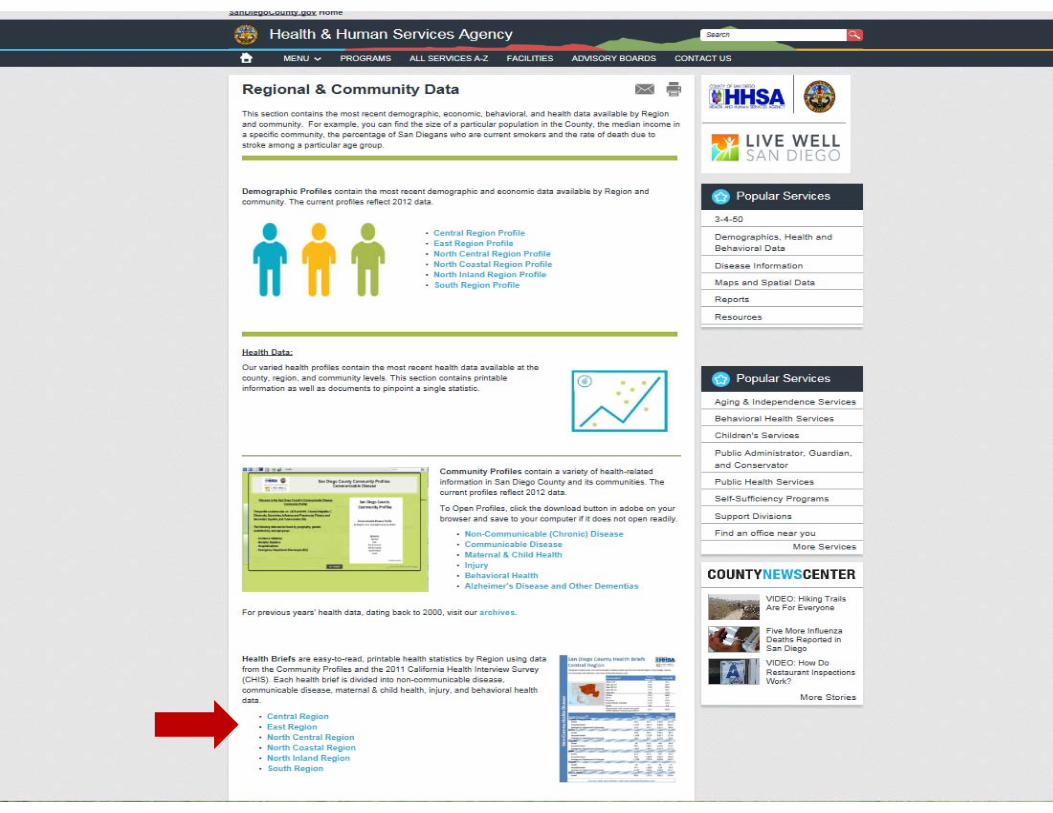
Back to Home, we select “Resources”
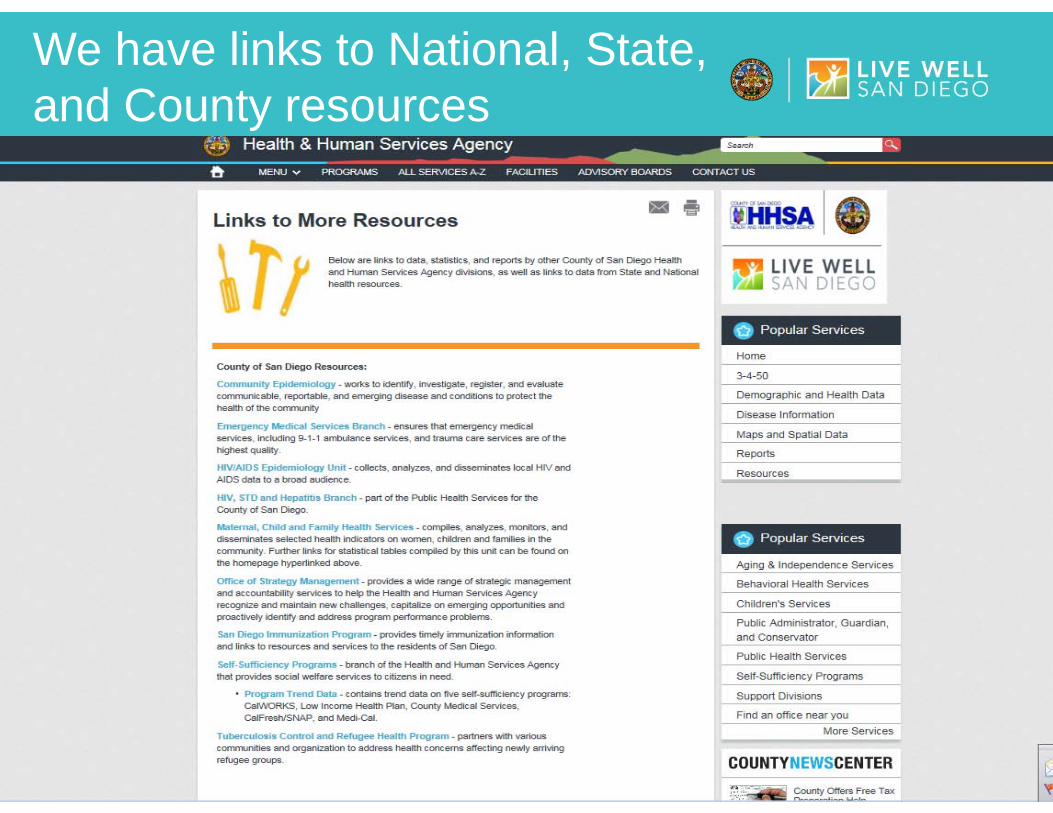
We have links to National, State, and County resources
The Public Health Services page has links to more data!