Embed Size (px)
Citation preview
Live Reorderable Accordion Drawing (LiveRAC)
Peter McLachlanMSc Thesis Presentation
September, 2006
2
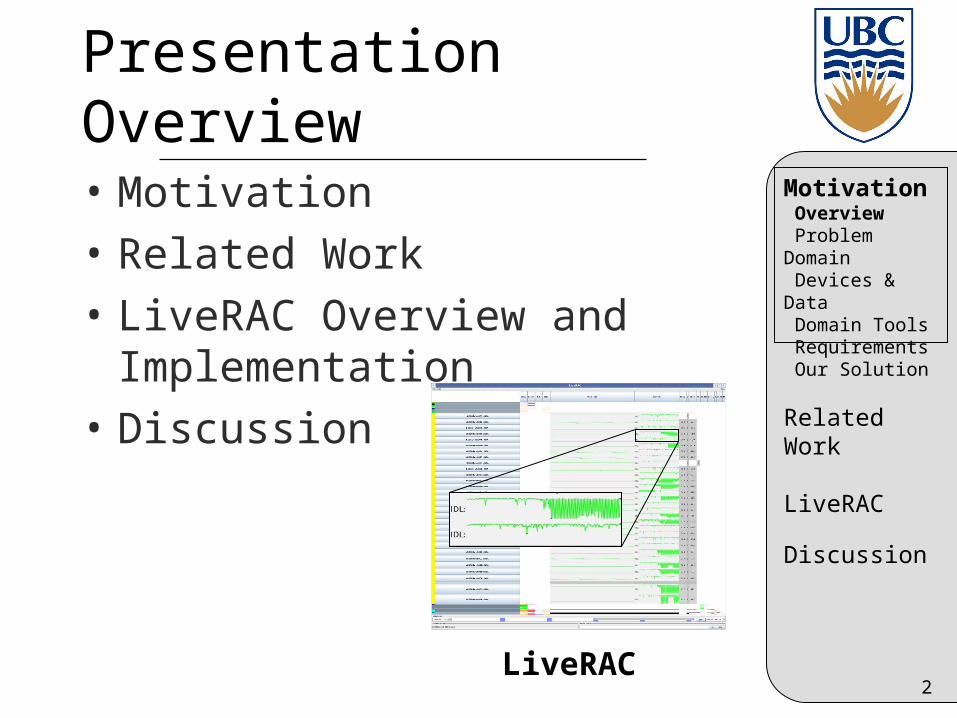
Presentation Overview
• Motivation
• Related Work
• LiveRAC Overview and Implementation
• Discussion
LiveRAC
Motivation Overview Problem Domain Devices & Data Domain Tools Requirements Our Solution
Related Work
LiveRAC
Discussion
3
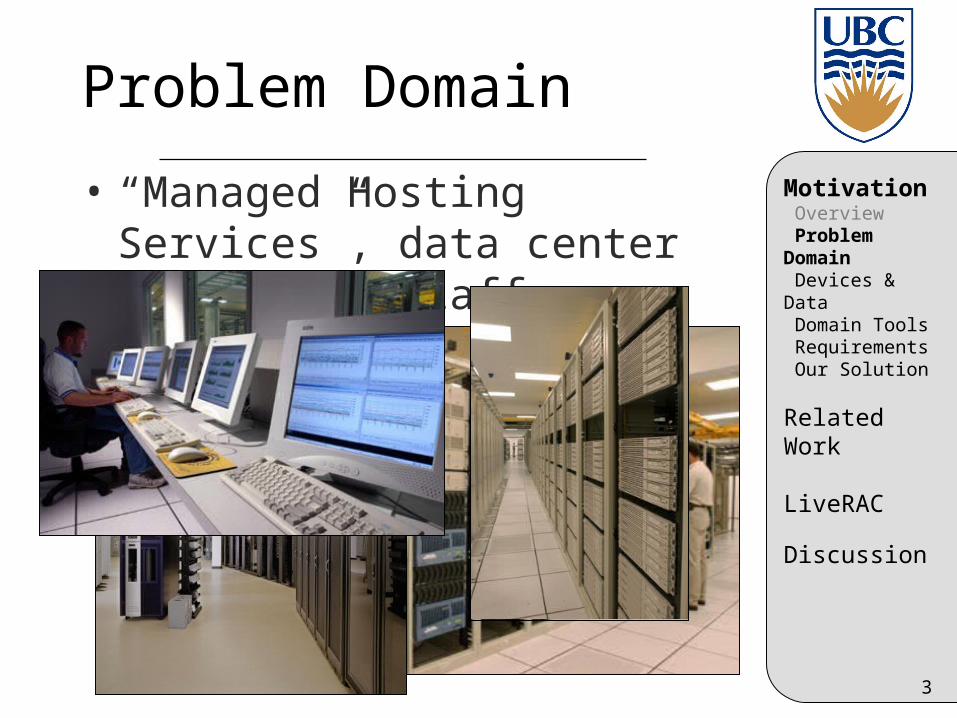
Problem Domain
• “Managed Hosting Services”, data center operations staff
Motivation Overview Problem Domain Devices & Data Domain Tools Requirements Our Solution
Related Work
LiveRAC
Discussion
4
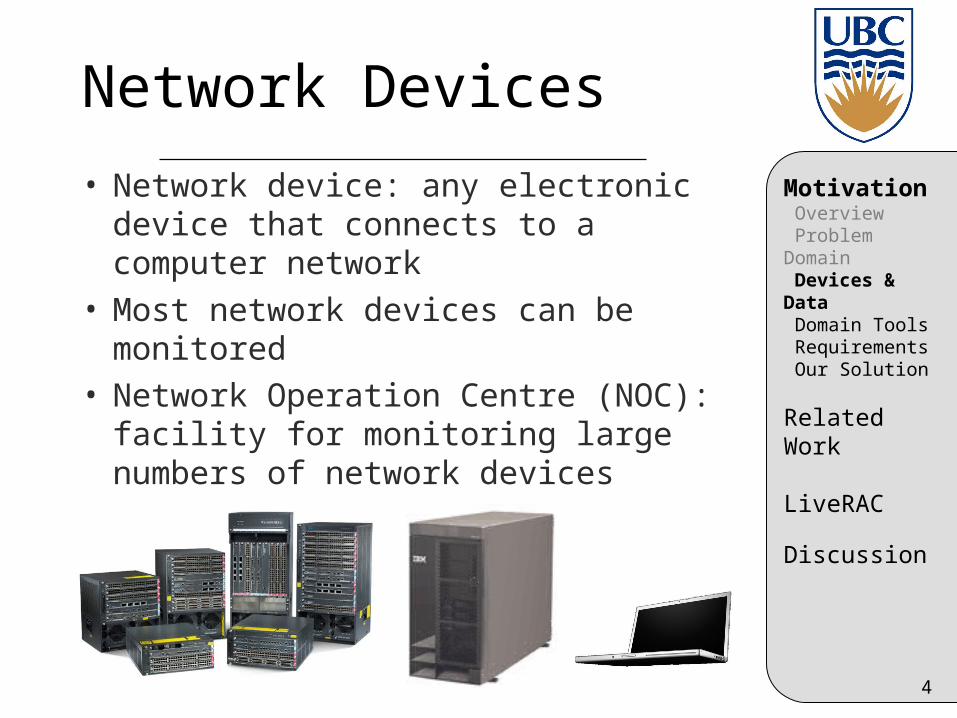
Network Devices
• Network device: any electronic device that connects to a computer network
• Most network devices can be monitored
• Network Operation Centre (NOC): facility for monitoring large numbers of network devices
Motivation Overview Problem Domain Devices & Data Domain Tools Requirements Our Solution
Related Work
LiveRAC
Discussion
5
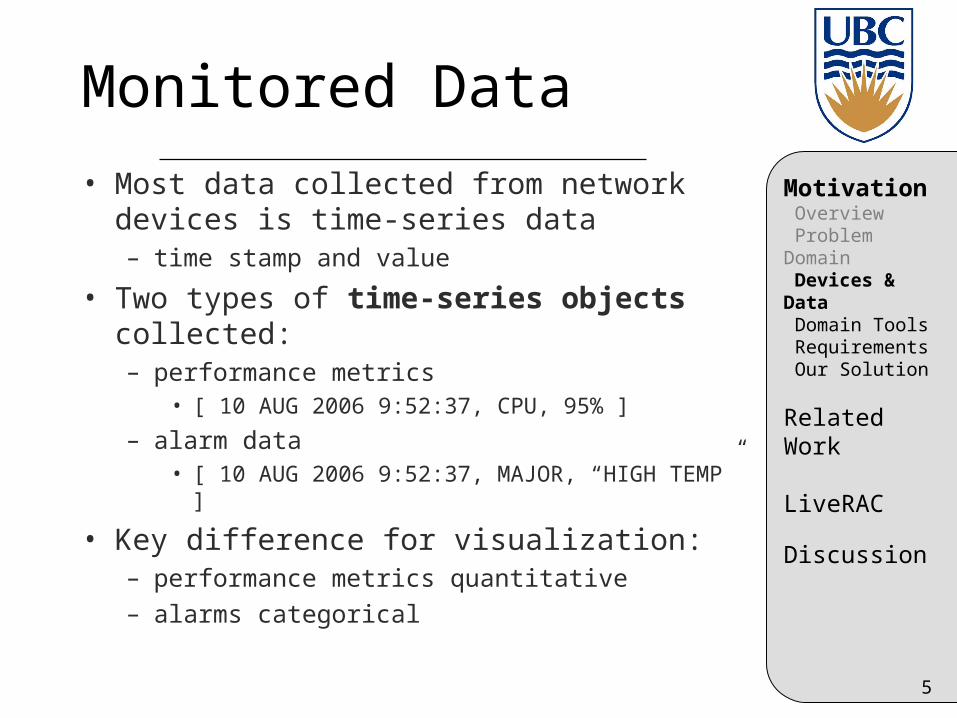
Monitored Data
• Most data collected from network devices is time-series data – time stamp and value
• Two types of time-series objects collected:– performance metrics
• [ 10 AUG 2006 9:52:37, CPU, 95% ]
– alarm data• [ 10 AUG 2006 9:52:37, MAJOR, “HIGH TEMP” ]
• Key difference for visualization:– performance metrics quantitative– alarms categorical
Motivation Overview Problem Domain Devices & Data Domain Tools Requirements Our Solution
Related Work
LiveRAC
Discussion
6
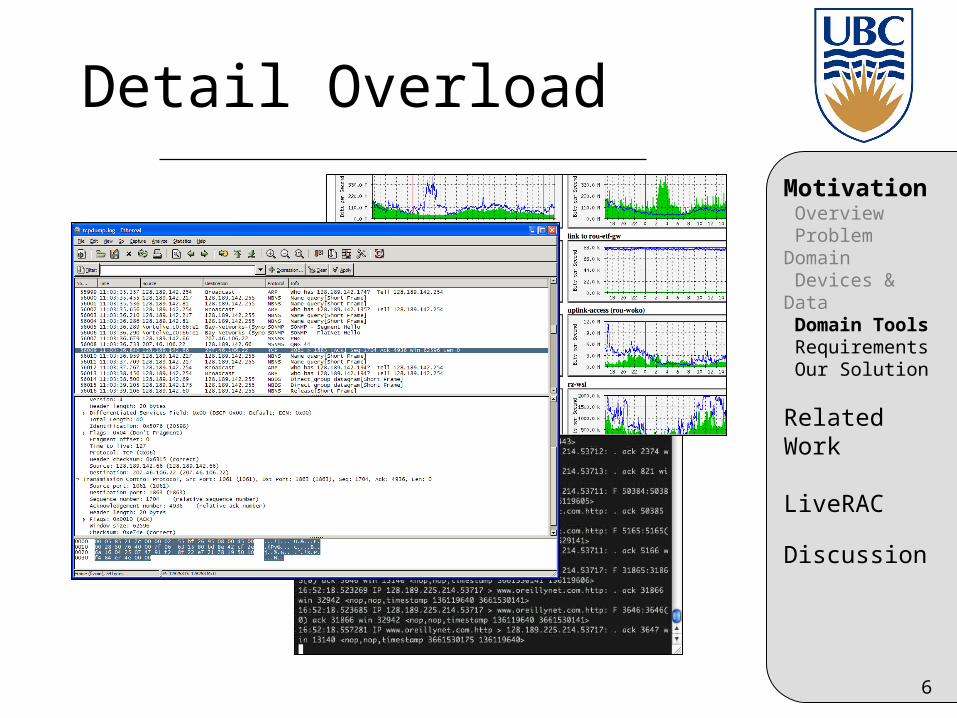
Detail Overload
Motivation Overview Problem Domain Devices & Data Domain Tools Requirements Our Solution
Related Work
LiveRAC
Discussion
7
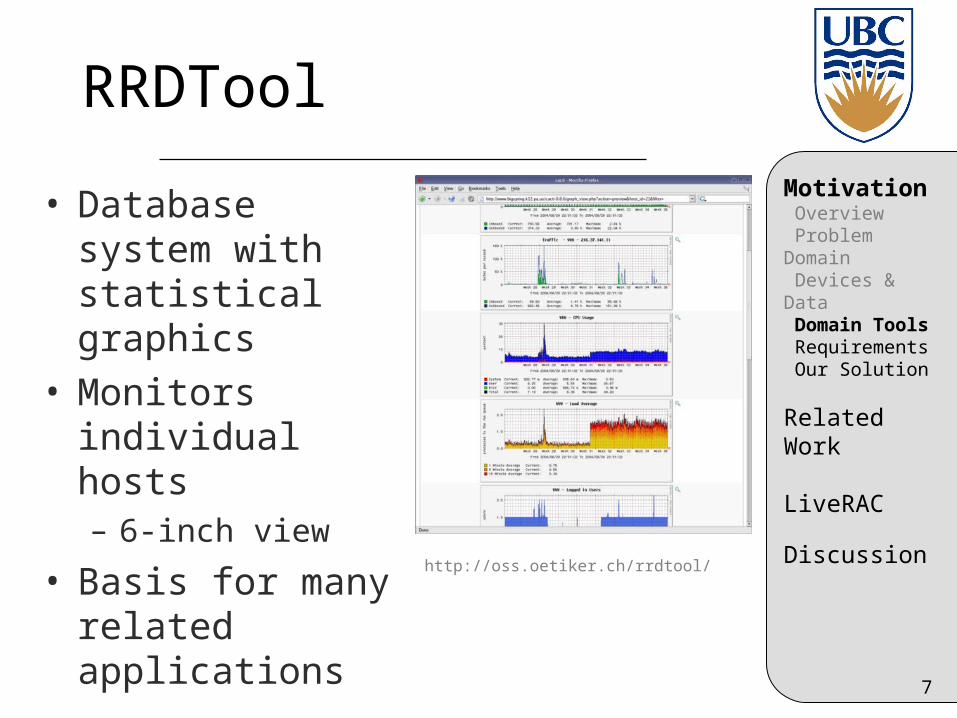
RRDTool
• Database system with statistical graphics
• Monitors individual hosts– 6-inch view
• Basis for many related applications
http://oss.oetiker.ch/rrdtool/
Motivation Overview Problem Domain Devices & Data Domain Tools Requirements Our Solution
Related Work
LiveRAC
Discussion
8
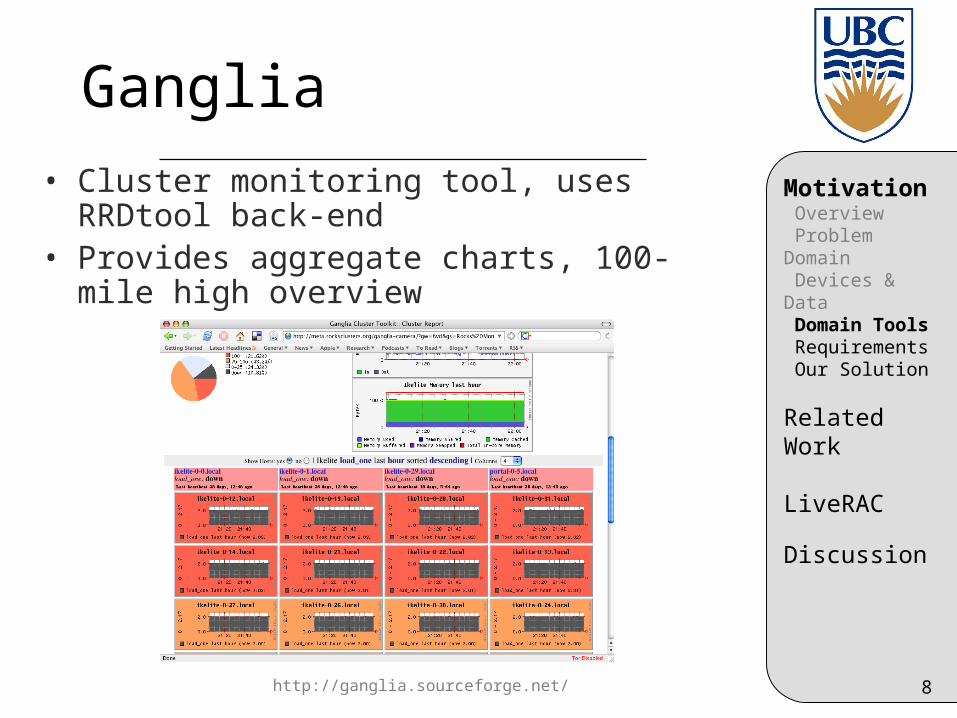
Ganglia
• Cluster monitoring tool, uses RRDtool back-end
• Provides aggregate charts, 100-mile high overview
http://ganglia.sourceforge.net/
Motivation Overview Problem Domain Devices & Data Domain Tools Requirements Our Solution
Related Work
LiveRAC
Discussion
9
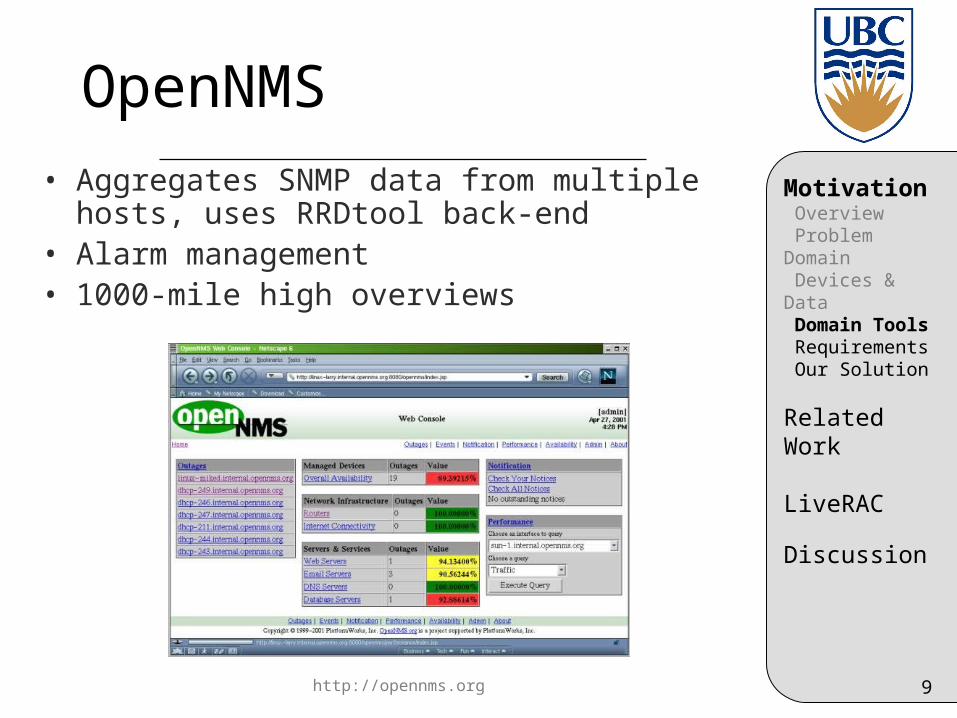
OpenNMS
• Aggregates SNMP data from multiple hosts, uses RRDtool back-end
• Alarm management• 1000-mile high overviews
http://opennms.org
Motivation Overview Problem Domain Devices & Data Domain Tools Requirements Our Solution
Related Work
LiveRAC
Discussion
10
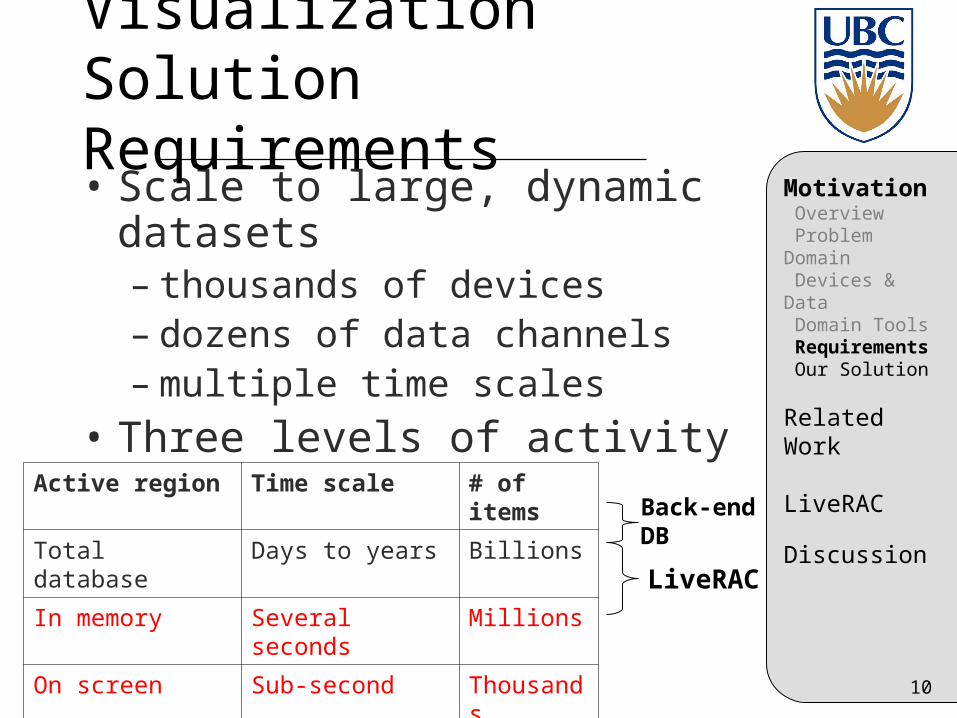
• Scale to large, dynamic datasets – thousands of devices– dozens of data channels– multiple time scales
• Three levels of activity
Visualization Solution Requirements
Motivation Overview Problem Domain Devices & Data Domain Tools Requirements Our Solution
Related Work
LiveRAC
DiscussionActive region Time scale # of items
Total database Days to years Billions
In memory Several seconds Millions
On screen Sub-second ThousandsLiveRAC
Back-end DB
11
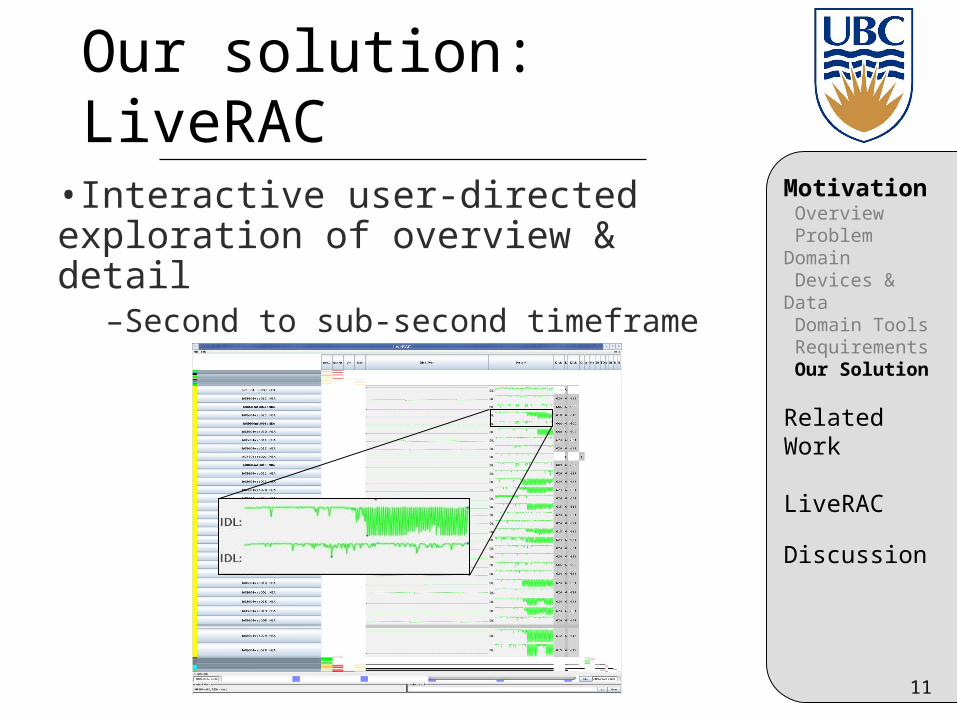
Our solution: LiveRAC
Motivation Overview Problem Domain Devices & Data Domain Tools Requirements Our Solution
Related Work
LiveRAC
Discussion
•Interactive user-directed exploration of overview & detail
–Second to sub-second timeframe
12
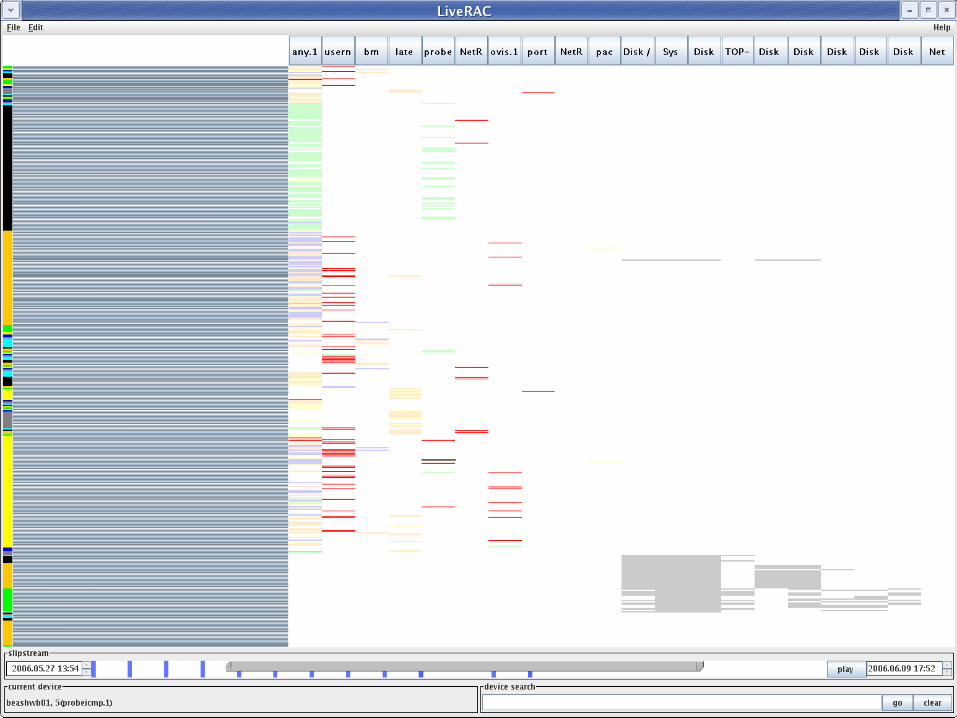
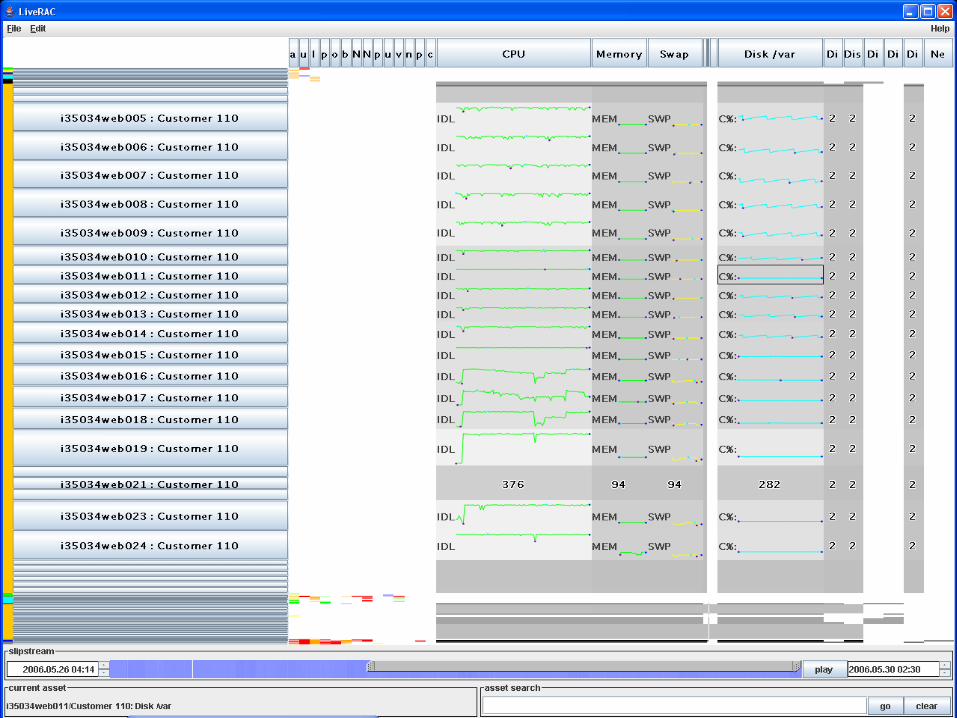
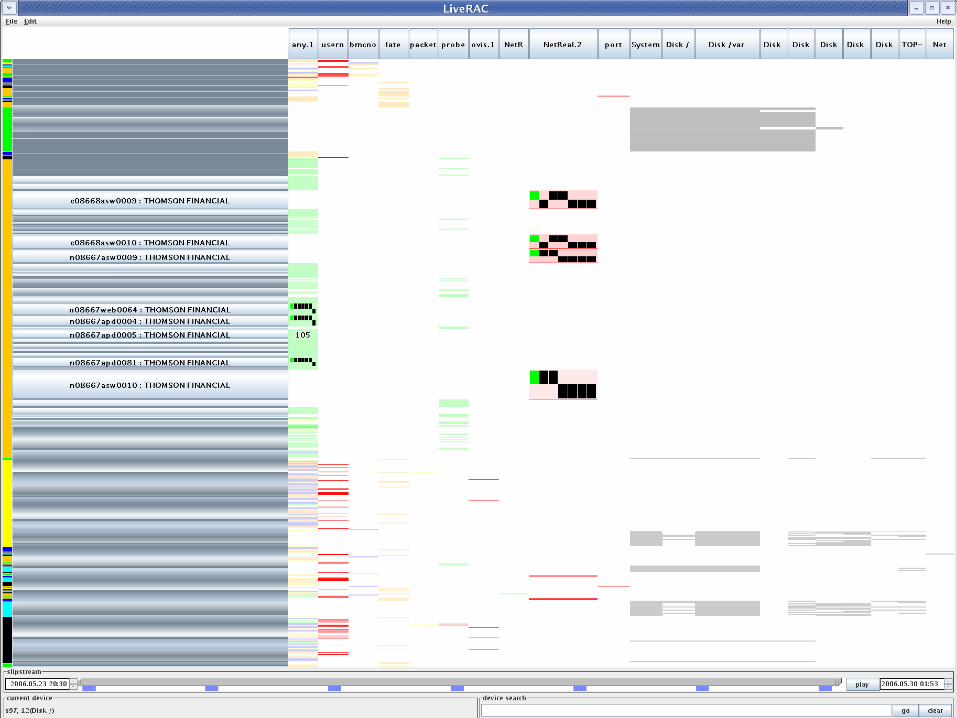
Our solution: LiveRAC
• Reorderable matrix– rows of network devices– columns of time-series objects
• Semantic zooming and aggregation for cells– large cells show time-series charts– compact representations in reduced
areas– aggregate spatial representation shown
in highly compressed regions
Motivation Overview Problem Domain Devices & Data Domain Tools Requirements Our Solution
Related Work
LiveRAC
Discussion

13
Visual Introduction to LiveRAC
QuickTime™ and aTechSmith EnSharpen decompressor
are needed to see this picture.

14
Research Contributions
• A scalable visualization system called LiveRAC using real world data
• Algorithms and code to support dynamic and reorderable data elements in accordion drawing
• Infrastructure and algorithms for user-definable semantic zoom in accordion drawing
Motivation Overview Problem Domain Devices & Data Domain Tools Requirements Our Solution
Related Work
LiveRAC
Discussion
15
Information Visualization
• Human visual channel is highest-bandwidth perceptual system [Norretranders, 1999]
• Information visualization: field of study whose object is to aid cognition through the graphic representation of abstract data– displays relevant information graphically to
assist in memory tasks– supports data exploration through direct
interaction – assists in pattern finding through the display
of overview and detail, search, and user-directed reordering
Motivation
Related Work InfoVis Time-series Statistical Graphics Reorderable Vis Semantic Zoom Accordion Drawing SWIFT
LiveRAC
Discussion
16
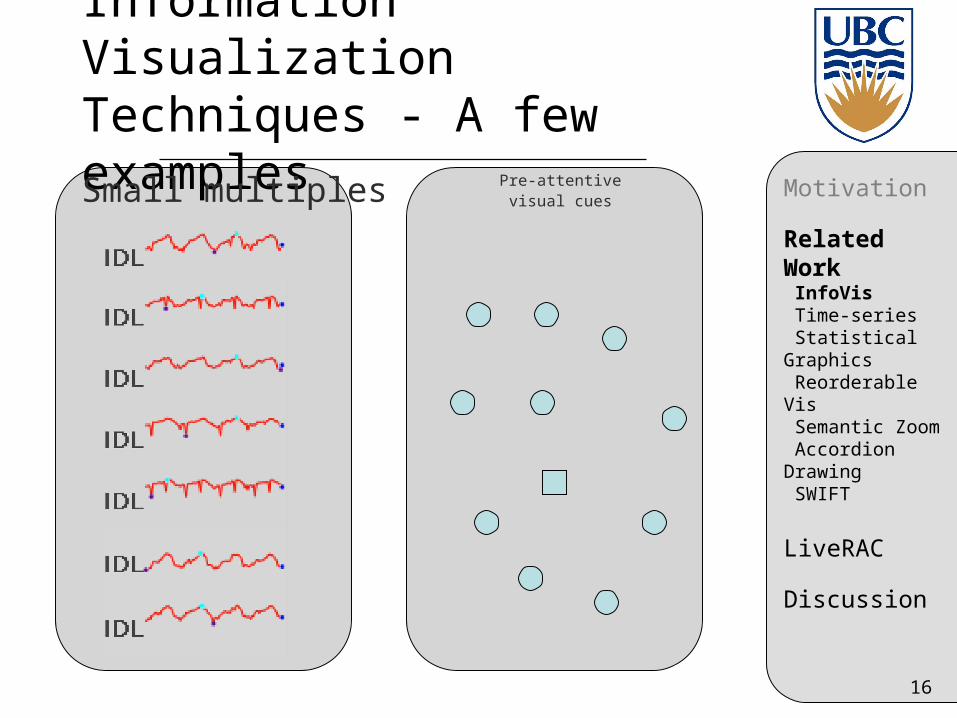
Information Visualization Techniques - A few examples
Small multiples Pre-attentivevisual cues
Motivation
Related Work InfoVis Time-series Statistical Graphics Reorderable Vis Semantic Zoom Accordion Drawing SWIFT
LiveRAC
Discussion
17
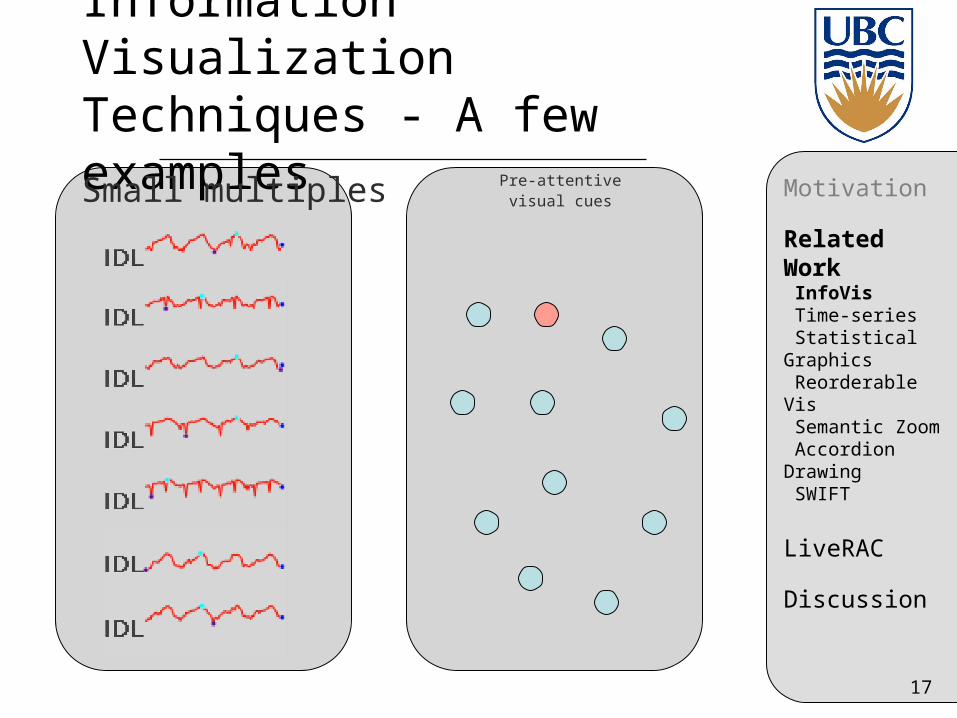
Information Visualization Techniques - A few examples
Small multiples Pre-attentivevisual cues
Motivation
Related Work InfoVis Time-series Statistical Graphics Reorderable Vis Semantic Zoom Accordion Drawing SWIFT
LiveRAC
Discussion
18
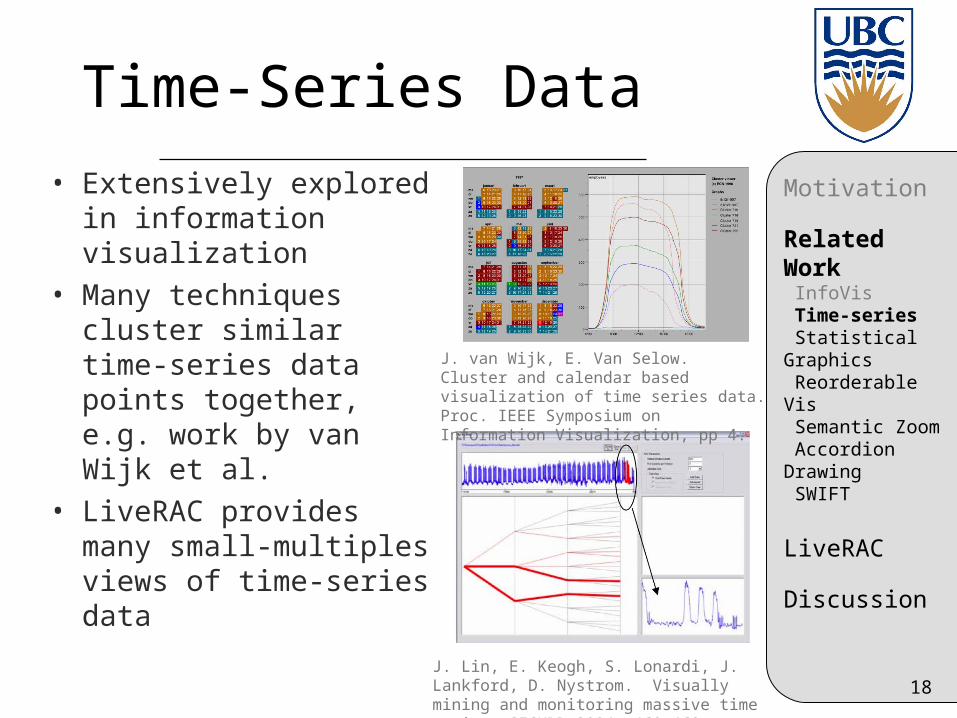
Time-Series Data
• Extensively explored in information visualization
• Many techniques cluster similar time-series data points together, e.g. work by van Wijk et al.
• LiveRAC provides many small-multiples views of time-series data
J. van Wijk, E. Van Selow. Cluster and calendar based visualization of time series data. Proc. IEEE Symposium on Information Visualization, pp 4.
J. Lin, E. Keogh, S. Lonardi, J. Lankford, D. Nystrom. Visually mining and monitoring massive time series. SIGKDD 2004, 460-469.
Motivation
Related Work InfoVis Time-series Statistical Graphics Reorderable Vis Semantic Zoom Accordion Drawing SWIFT
LiveRAC
Discussion
19
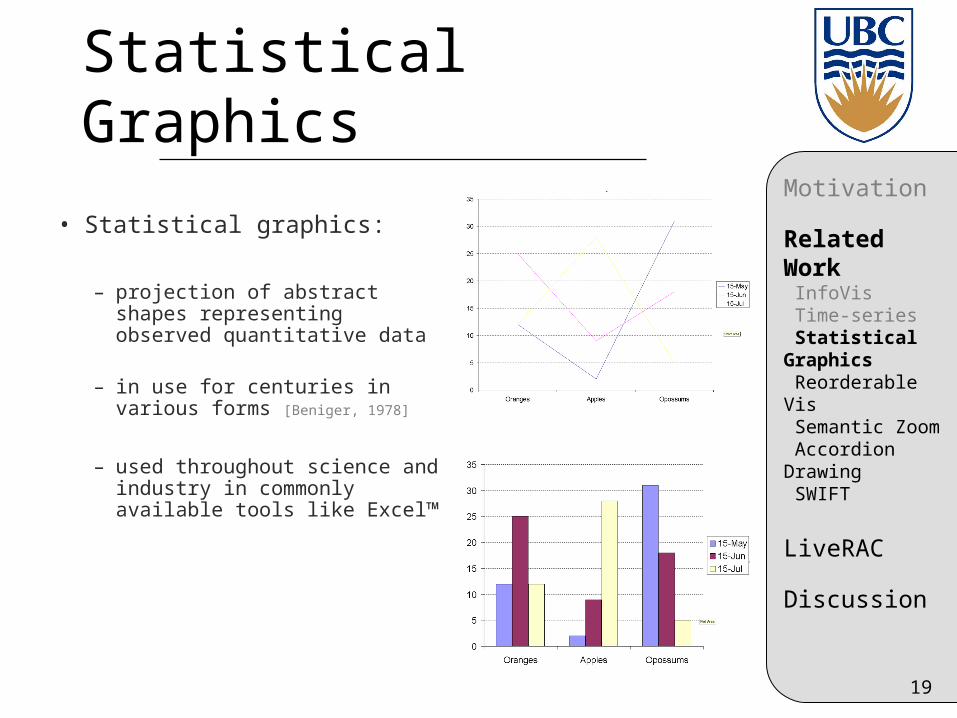
Statistical Graphics
• Statistical graphics:
– projection of abstract shapes representing observed quantitative data
– in use for centuries in various forms [Beniger, 1978]
– used throughout science and industry in commonly available tools like Excel™
Motivation
Related Work InfoVis Time-series Statistical Graphics Reorderable Vis Semantic Zoom Accordion Drawing SWIFT
LiveRAC
Discussion
20
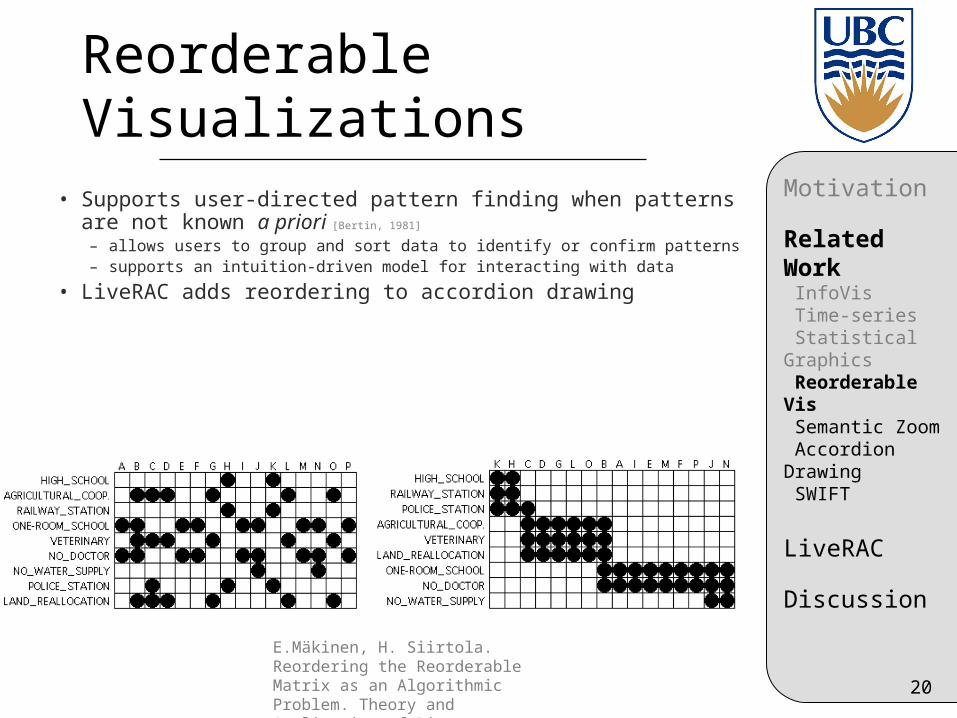
Reorderable Visualizations
• Supports user-directed pattern finding when patterns are not known a priori [Bertin, 1981]
– allows users to group and sort data to identify or confirm patterns– supports an intuition-driven model for interacting with data
• LiveRAC adds reordering to accordion drawing
E.Mäkinen, H. Siirtola. Reordering the Reorderable Matrix as an Algorithmic Problem. Theory and Application of Diagrams. 2000, 453–467.
Motivation
Related Work InfoVis Time-series Statistical Graphics Reorderable Vis Semantic Zoom Accordion Drawing SWIFT
LiveRAC
Discussion
21
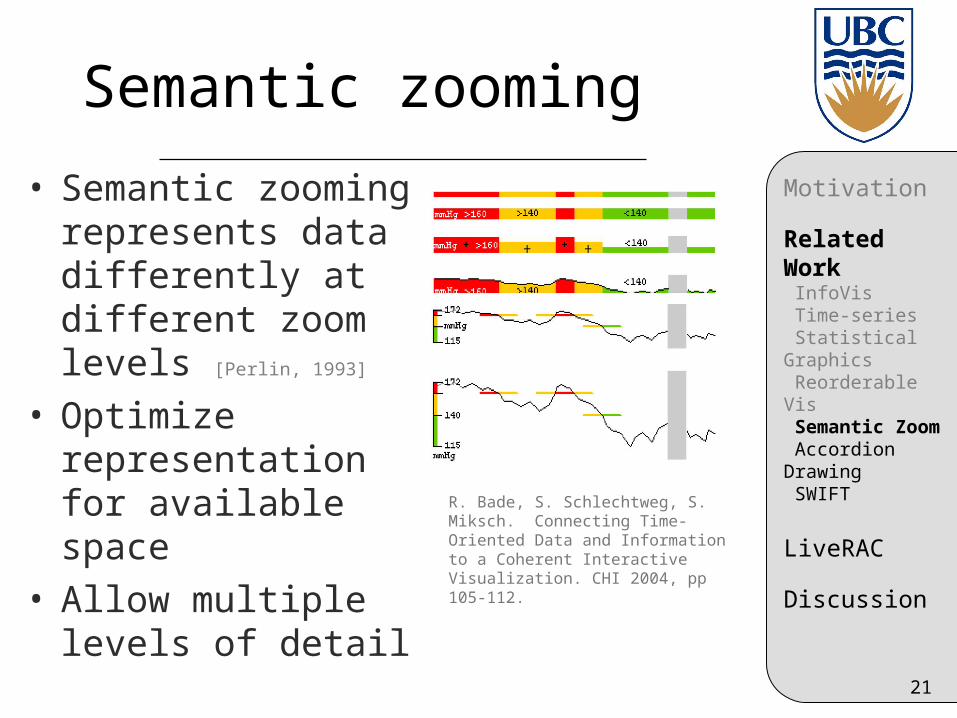
Semantic zooming
• Semantic zooming represents data differently at different zoom levels [Perlin, 1993]
• Optimize representation for available space
• Allow multiple levels of detail
R. Bade, S. Schlechtweg, S. Miksch. Connecting Time-Oriented Data and Information to a Coherent Interactive Visualization. CHI 2004, pp 105-112.
Motivation
Related Work InfoVis Time-series Statistical Graphics Reorderable Vis Semantic Zoom Accordion Drawing SWIFT
LiveRAC
Discussion
22
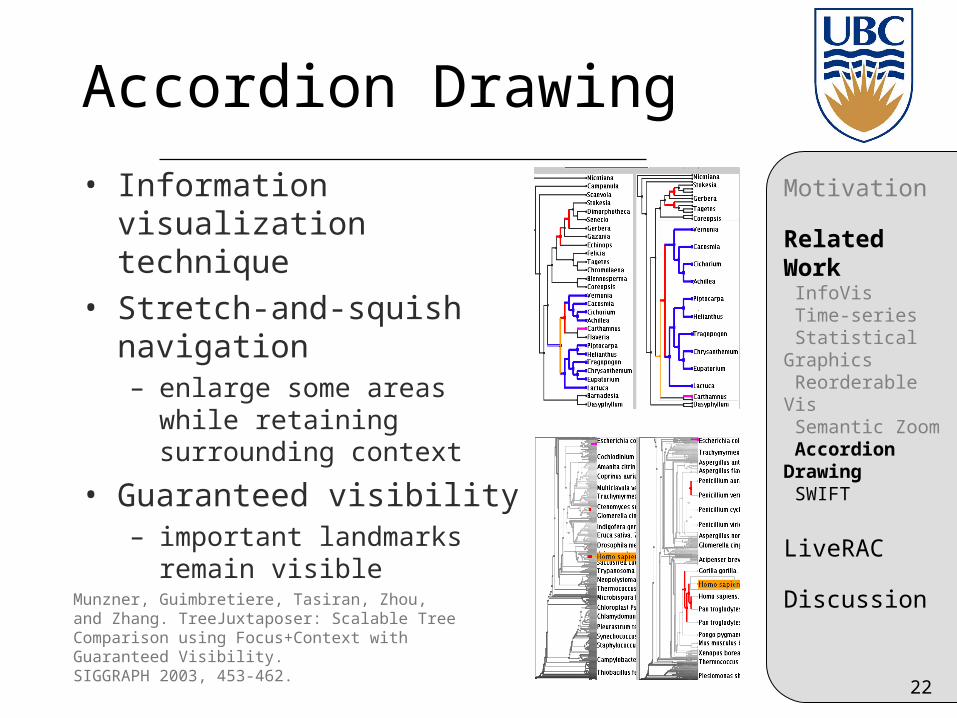
Accordion Drawing
• Information visualization technique
• Stretch-and-squish navigation– enlarge some areas while
retaining surrounding context
• Guaranteed visibility– important landmarks remain
visible
Munzner, Guimbretiere, Tasiran, Zhou, and Zhang. TreeJuxtaposer: Scalable Tree Comparison using Focus+Context with Guaranteed Visibility. SIGGRAPH 2003, 453-462.
Motivation
Related Work InfoVis Time-series Statistical Graphics Reorderable Vis Semantic Zoom Accordion Drawing SWIFT
LiveRAC
Discussion
23
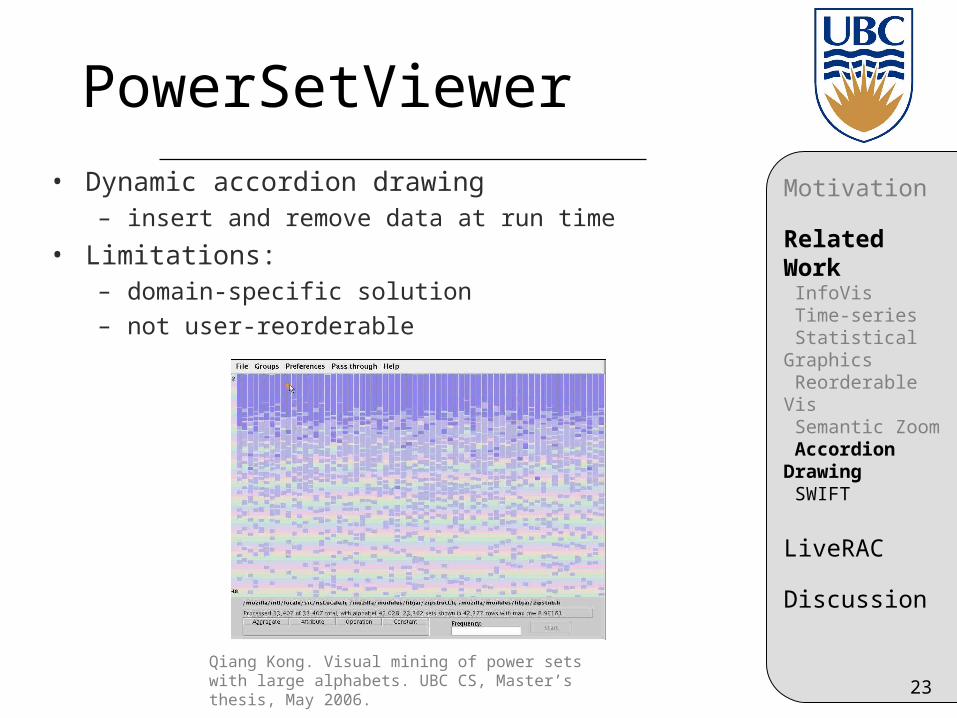
PowerSetViewer
• Dynamic accordion drawing– insert and remove data at run time
• Limitations:– domain-specific solution
– not user-reorderable
Qiang Kong. Visual mining of power sets with large alphabets. UBC CS, Master’s thesis, May 2006.
Motivation
Related Work InfoVis Time-series Statistical Graphics Reorderable Vis Semantic Zoom Accordion Drawing SWIFT
LiveRAC
Discussion
24
PRISAD
• Introduces the concept of per-frame partitioning of data into screen-visible regions
• Reduces n data nodes to p where p is bounded by the number of display pixels
• Provides an API for developing accordion drawing applications
• Limitation: – static data structures
Slack, Hildebrand, and Munzner.Partitioned Rendering Infrastructure for Scalable Accordion Drawing (Extended Version) Information Visualization, 5(2), p. 137-151, 2006.
Motivation
Related Work InfoVis Time-series Statistical Graphics Reorderable Vis Semantic Zoom Accordion Drawing SWIFT
LiveRAC
Discussion
25
SWIFT
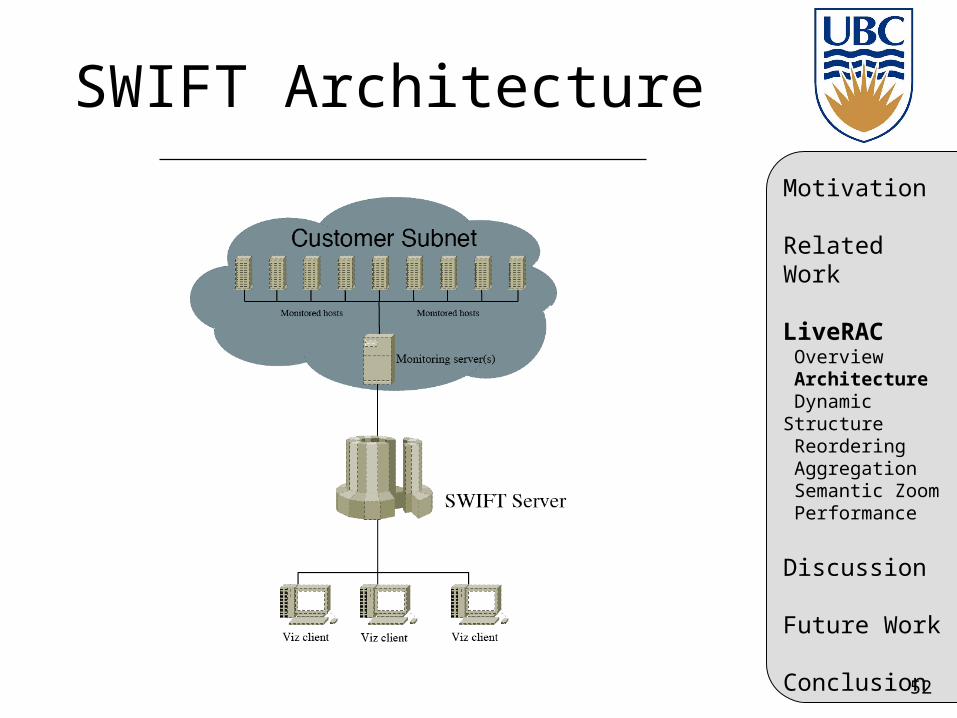
• SWIFT is a set of data storage, aggregation and visualization tools that integrate multiple data sources [Koutsofios, 1999]
• Developed at AT&T Labs, fully deployed in a production role
• Data sources include SNMP, intrusion detection systems, Windows system monitors, and custom written daemons
• Highly scalable• Optimized for streaming data
Motivation
Related Work InfoVis Time-series Statistical Graphics Reorderable Vis Semantic Zoom Accordion Drawing SWIFT
LiveRAC
Discussion
26
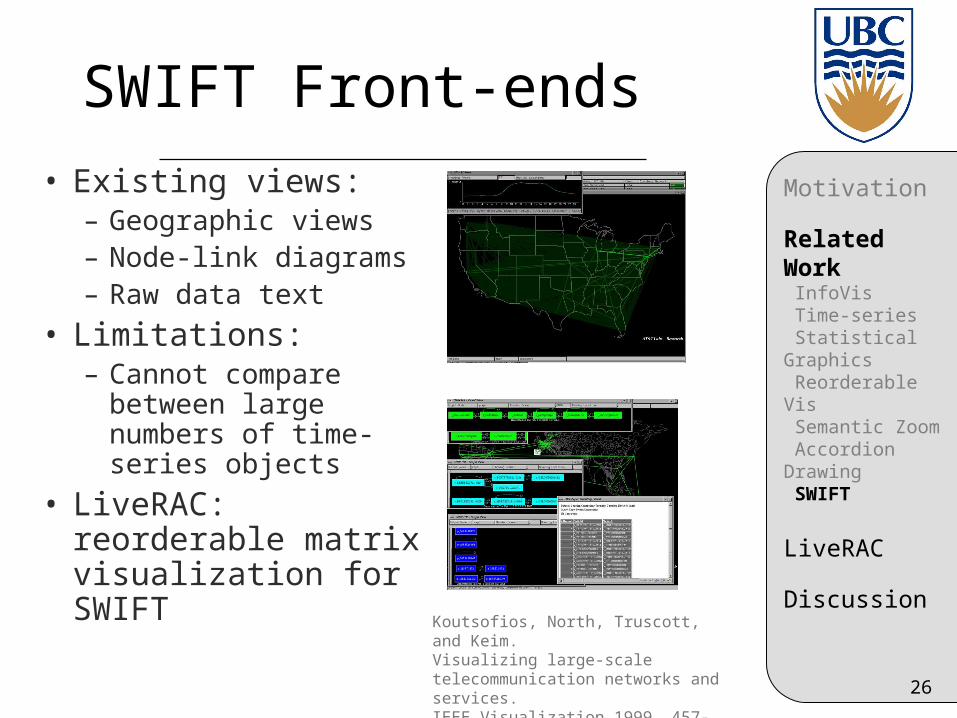
SWIFT Front-ends
Koutsofios, North, Truscott, and Keim. Visualizing large-scale telecommunication networks and services.IEEE Visualization 1999, 457-461
• Existing views:– Geographic views– Node-link diagrams– Raw data text
• Limitations: – Cannot compare
between large numbers of time-series objects
• LiveRAC: reorderable matrix visualization for SWIFT
Motivation
Related Work InfoVis Time-series Statistical Graphics Reorderable Vis Semantic Zoom Accordion Drawing SWIFT
LiveRAC
Discussion
27
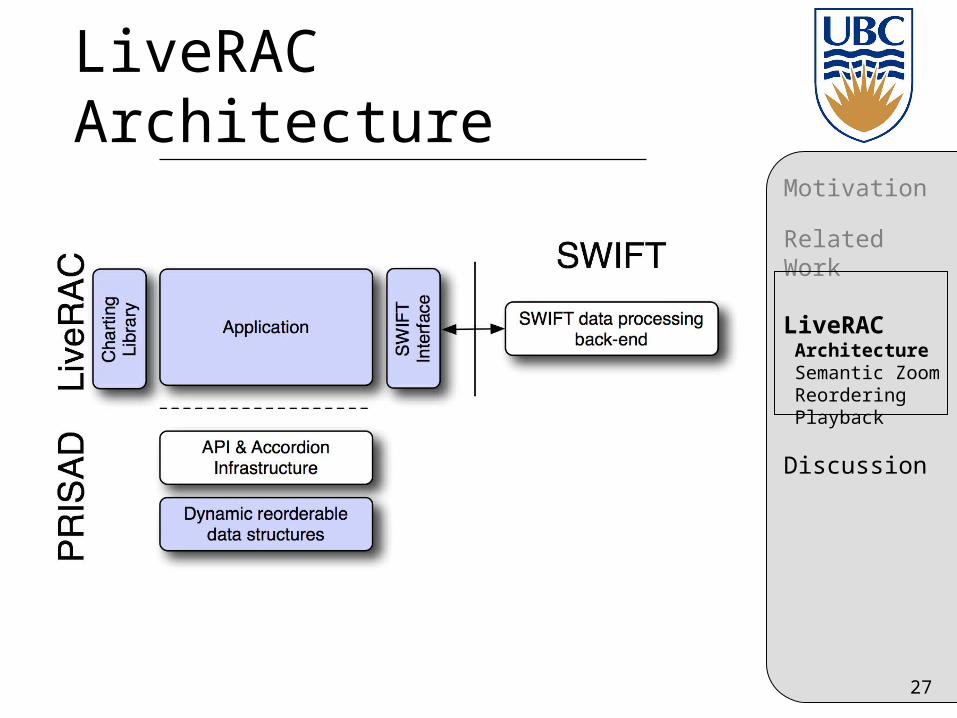
LiveRAC Architecture
Motivation
Related Work
LiveRAC Architecture Semantic Zoom Reordering Playback
Discussion
28
LiveRAC Architecture - PRISAD• Uses and enhances the PRISAD
accordion drawing API– PRISAD provides:
• well-established scalability• pixel-bounded rendering performance• extensive infrastructure
• Contributions: – fully dynamic generic data structures
• add, remove and reorder
Motivation
Related Work
LiveRAC Architecture Semantic Zoom Reordering Playback
Discussion
29
LiveRAC Architecture - SWIFT• SWIFT back-end provides:
– unified interface for multiple collected data sources
– temporal aggregation
• Separate rendering and data-service threads allow interaction during data retrieval
• Time window can be selected to display historical or live data
Motivation
Related Work
LiveRAC Architecture Semantic Zoom Reordering Playback
Discussion
30
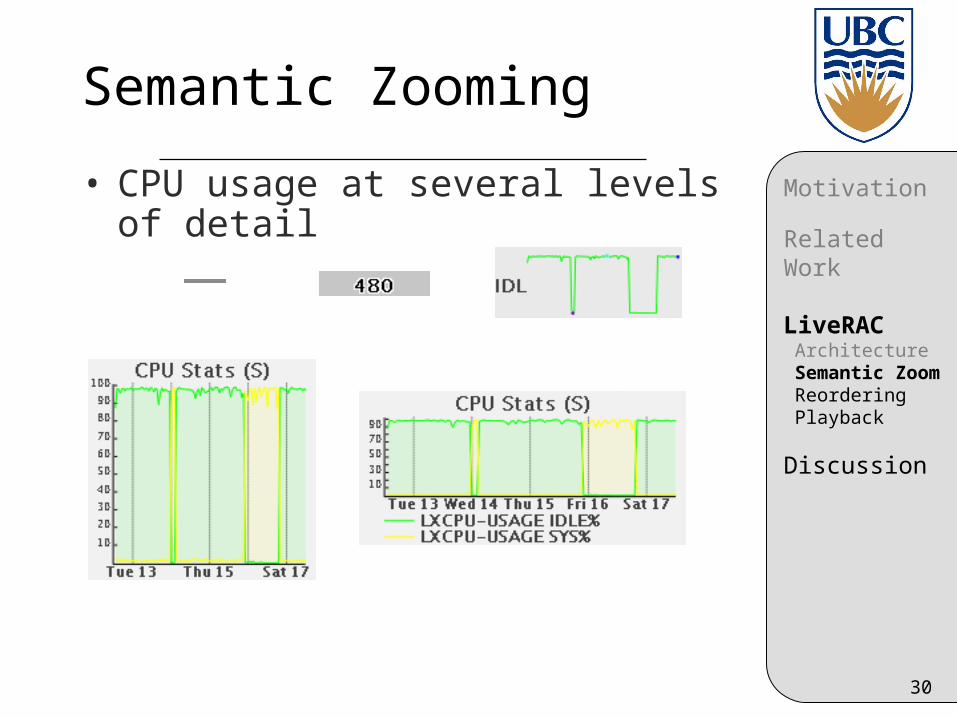
Semantic Zooming
• CPU usage at several levels of detail Motivation
Related Work
LiveRAC Architecture Semantic Zoom Reordering Playback
Discussion
31
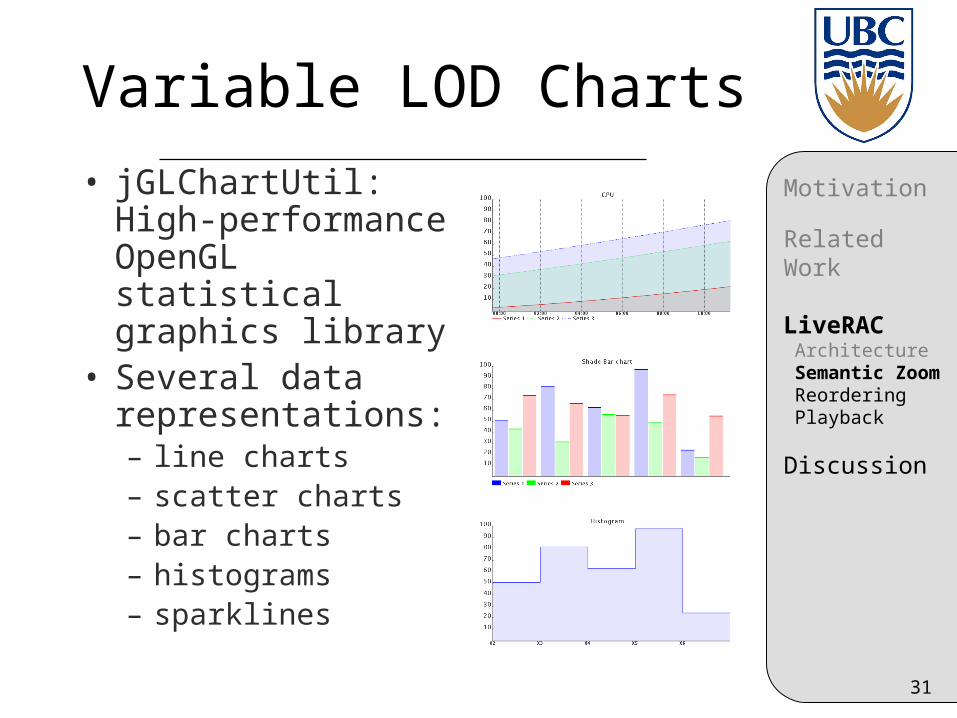
Variable LOD Charts
• jGLChartUtil: High-performance OpenGL statistical graphics library
• Several data representations: – line charts– scatter charts– bar charts– histograms– sparklines
Motivation
Related Work
LiveRAC Architecture Semantic Zoom Reordering Playback
Discussion
32
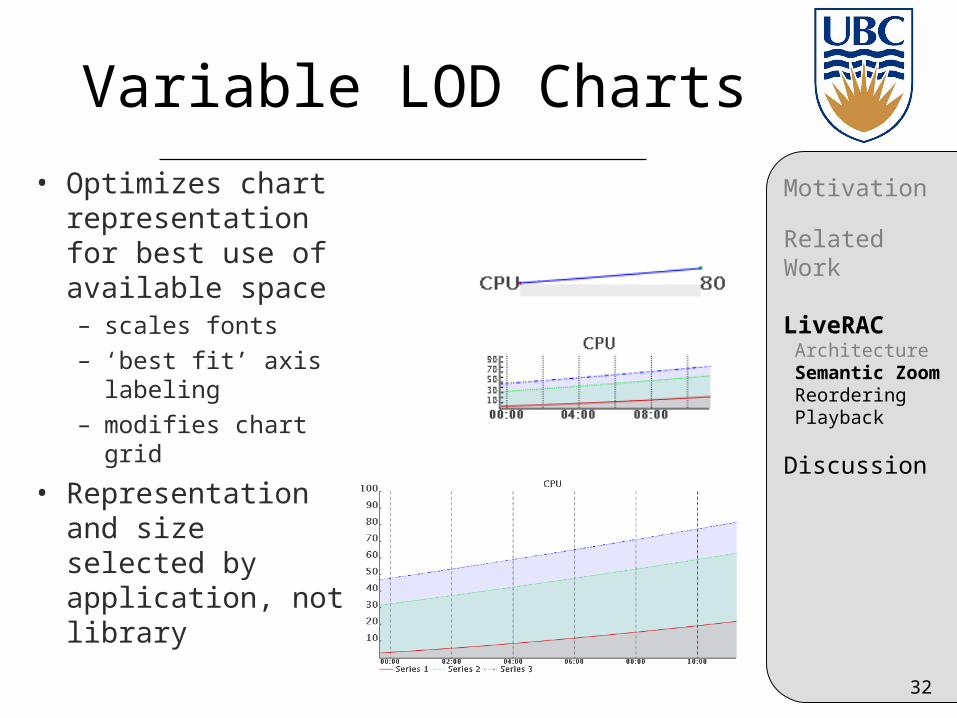
Variable LOD Charts
• Optimizes chart representation for best use of available space– scales fonts– ‘best fit’ axis
labeling– modifies chart grid
• Representation and size selected by application, not library
Motivation
Related Work
LiveRAC Architecture Semantic Zoom Reordering Playback
Discussion
33
Defining Semantic Zoom Levels
• Bundle: specification of how to draw cells in a column– defines graphical representation at
different cell sizes– can contain single or multiple time-
series objects– pre-defined in configuration file
• Generic bundles provide defaults
Motivation
Related Work
LiveRAC Architecture Semantic Zoom Reordering Playback
Discussion
34
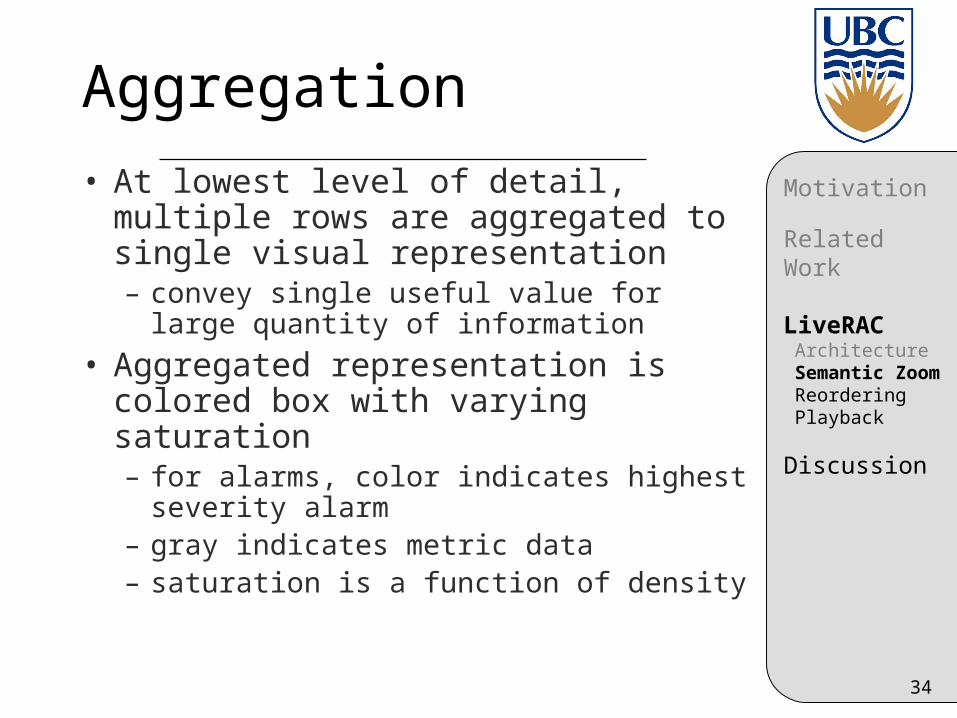
Aggregation
• At lowest level of detail, multiple rows are aggregated to single visual representation– convey single useful value for large
quantity of information
• Aggregated representation is colored box with varying saturation– for alarms, color indicates highest
severity alarm – gray indicates metric data– saturation is a function of density
Motivation
Related Work
LiveRAC Architecture Semantic Zoom Reordering Playback
Discussion

35
LiveRAC Semantic Zooming
Semantic Zooming Video
QuickTime™ and aTechSmith EnSharpen decompressor
are needed to see this picture.

36
Reordering
• LiveRAC allows rows and columns to be reordered– rows sorted by device name, or by customer
identifier and sub-sorted by device name, or ordered arbitrarily
– columns ordered arbitrarily, locations specified by user
• Required significant extensions to PRISAD to provide dynamic data structures
Motivation
Related Work
LiveRAC Architecture Semantic Zoom Reordering Playback
Discussion

37
Reordering Rows and Columns - Visual Example
Motivation
Related Work
LiveRAC Overview Architecture Dynamic Structure Reordering Aggregation Semantic Zoom Performance
Discussion
Future Work
ConclusionReordering Video
QuickTime™ and aTechSmith EnSharpen decompressor
are needed to see this picture.
38
LiveRAC Data Playback
• Playback consists of advancing the time window by a configurable duration at regular intervals
• Historical data can be viewed faster than real-time
• Current data can be viewed in real-time
Motivation
Related Work
LiveRAC Architecture Semantic Zoom Reordering Playback
Discussion

39
QuickTime™ and aTechSmith EnSharpen decompressor
are needed to see this picture.
40
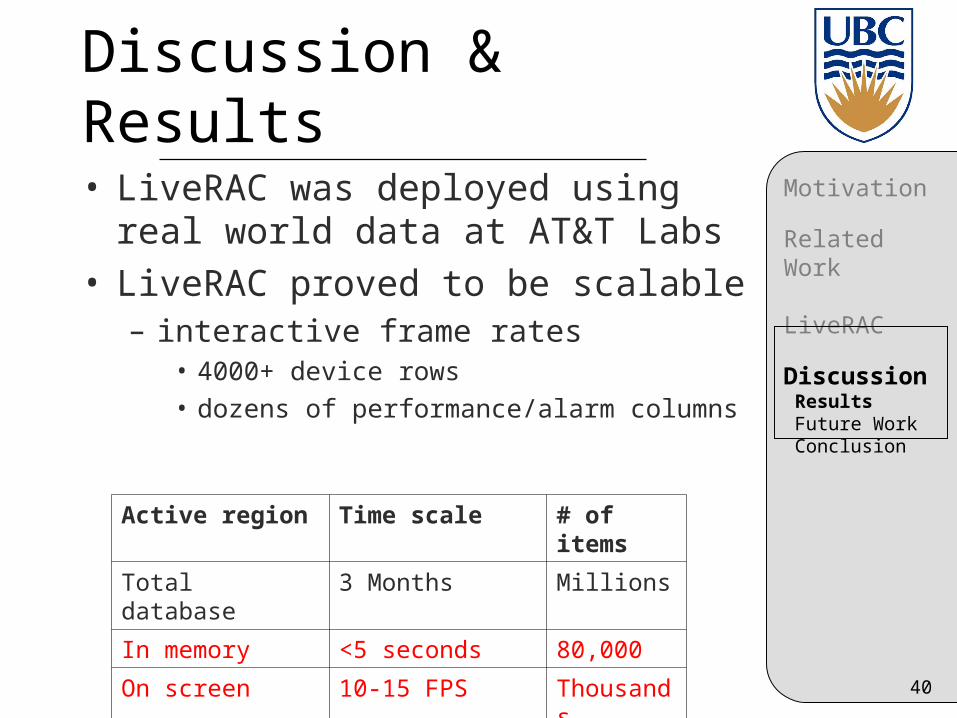
Discussion & Results
• LiveRAC was deployed using real world data at AT&T Labs
• LiveRAC proved to be scalable– interactive frame rates
• 4000+ device rows• dozens of performance/alarm columns
Motivation
Related Work
LiveRAC
Discussion Results Future Work Conclusion
Active region Time scale # of items
Total database 3 Months Millions
In memory <5 seconds 80,000
On screen 10-15 FPS Thousands

41
LiveRAC Case Study
Case study video
QuickTime™ and aTechSmith EnSharpen decompressor
are needed to see this picture.
42
User Feedback
• Demo feedback was positive:– users familiar with the old system were able to
quickly recognize customers based on familiarity with the data
– LiveRAC identified by domain managers as possible next-generation tool for data center usage
– users had numerous suggestions for the system, a good indication that they were excited by the possibilities
Motivation
Related Work
LiveRAC
Discussion Results Future Work Conclusion
43
Future Work
• Interaction:– field study LiveRAC in real-world environment– support alternative navigation options
• auto-expanding search region
• hot-keying groups of devices or metrics
– expand data representation library
• Data processing:– computational correlation of alarm and metric
data
• Performance:– lazy evaluation during reordering
Motivation
Related Work
LiveRAC
Discussion Results Future Work Conclusion
44
Conclusion
• Contributions: – working system for interactive
visualization of large real-world time-series data sets
– algorithms for reorderable accordion drawing
– infrastructure for semantic zoom in accordion drawing
Motivation
Related Work
LiveRAC
Discussion Results Future Work Conclusion
45
46
47
48
Targeted User Activities
• Overview: – Situational awareness– Critical alarm notification
• Detail:– Incident investigation – Capacity planning – Trend analysis
Motivation
Related Work
LiveRAC Architecture Visual Encoding Aggregation Semantic Zoom Reordering Playback
Discussion
Future Work
Conclusion
49
Monitoring Large-scale Systems: A Difficult Problem
• Many disparate data sources– Different platforms– Different protocols– Different services– Lack of integrated solutions
• Lack of context in standard tools
• Shortage of integrated visualization solutions
Motivation
Related Work
LiveRAC Architecture Visual Encoding Aggregation Semantic Zoom Reordering Playback
Discussion
Future Work
Conclusion
51
SWIFT Limitations
• Visualizations for SWIFT only provide node-link and geographic views
• These views are good for mapping physical relationships
Motivation
Related Work
LiveRAC Architecture Visual Encoding Aggregation Semantic Zoom Reordering Playback
Discussion
Future Work
Conclusion
52
SWIFT Architecture
Motivation
Related Work
LiveRAC Overview Architecture Dynamic Structure Reordering Aggregation Semantic Zoom Performance
Discussion
Future Work
Conclusion
53
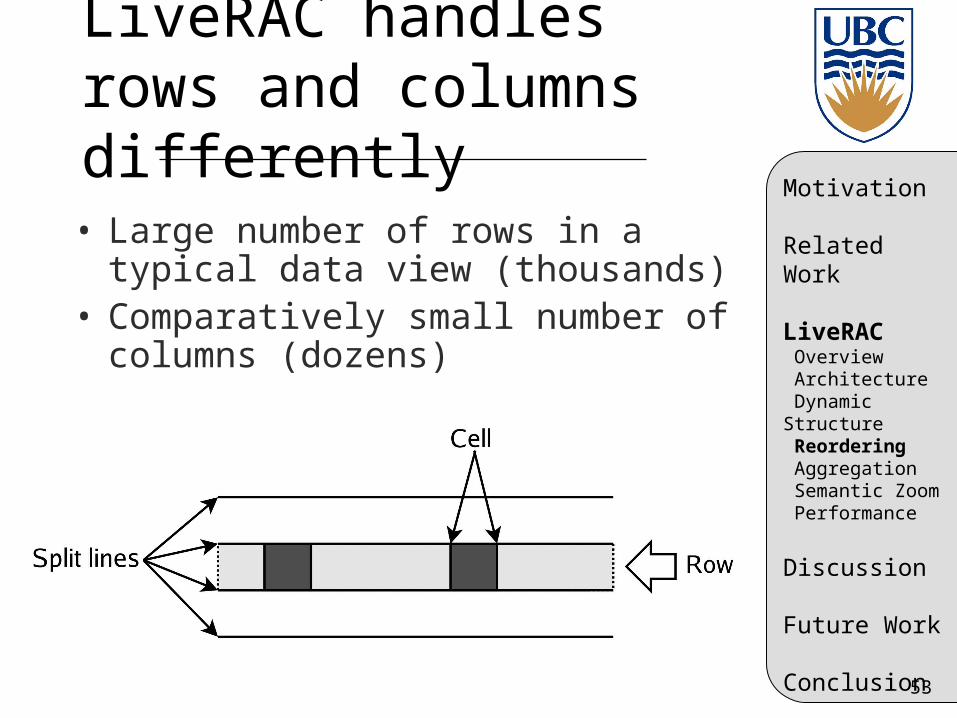
LiveRAC handles rows and columns differently
• Large number of rows in a typical data view (thousands)
• Comparatively small number of columns (dozens)
Motivation
Related Work
LiveRAC Overview Architecture Dynamic Structure Reordering Aggregation Semantic Zoom Performance
Discussion
Future Work
Conclusion
54
Performance Requirements
• LiveRAC must maintain interactive frame rates while modifications to the grid are taking place
• We need to draw guaranteed visible zones first to provide landmarks
• The system needs to scale to thousands of devices, and tens of categories of monitored alarms & metrics
• The system must support a large number of data points for alarms & metrics
Motivation
Related Work
LiveRAC Overview Architecture Dynamic Structure Reordering Aggregation Semantic Zoom Performance
Discussion
Future Work
Conclusion
55
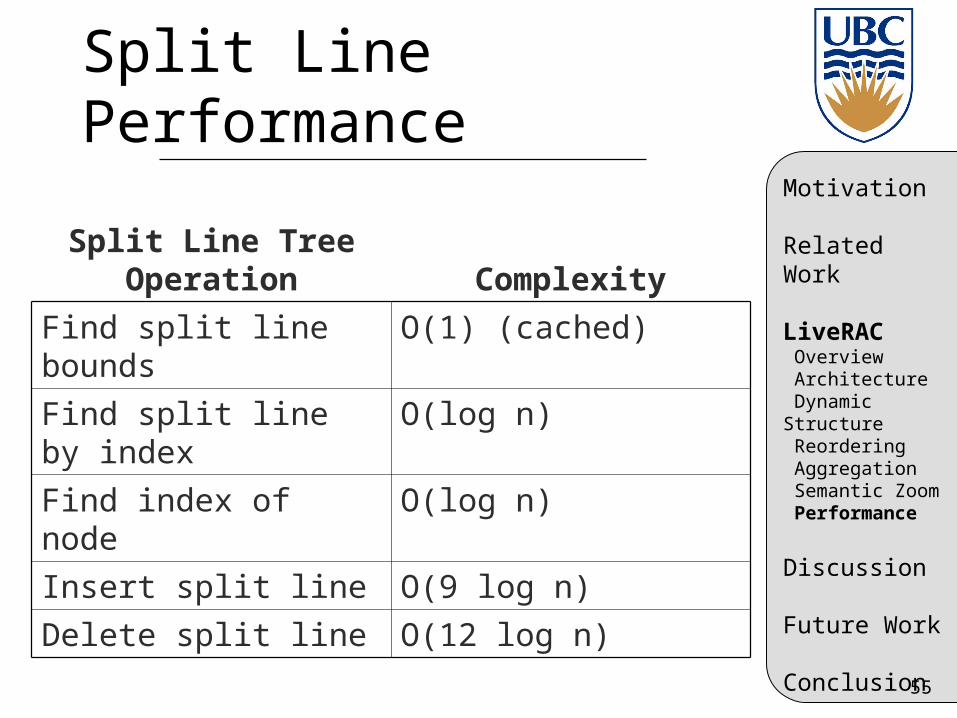
Split Line Performance
Split Line Tree Operation Complexity
Find split line bounds O(1) (cached)
Find split line by index O(log n)
Find index of node O(log n)
Insert split line O(9 log n)
Delete split line O(12 log n)
Motivation
Related Work
LiveRAC Overview Architecture Dynamic Structure Reordering Aggregation Semantic Zoom Performance
Discussion
Future Work
Conclusion
56
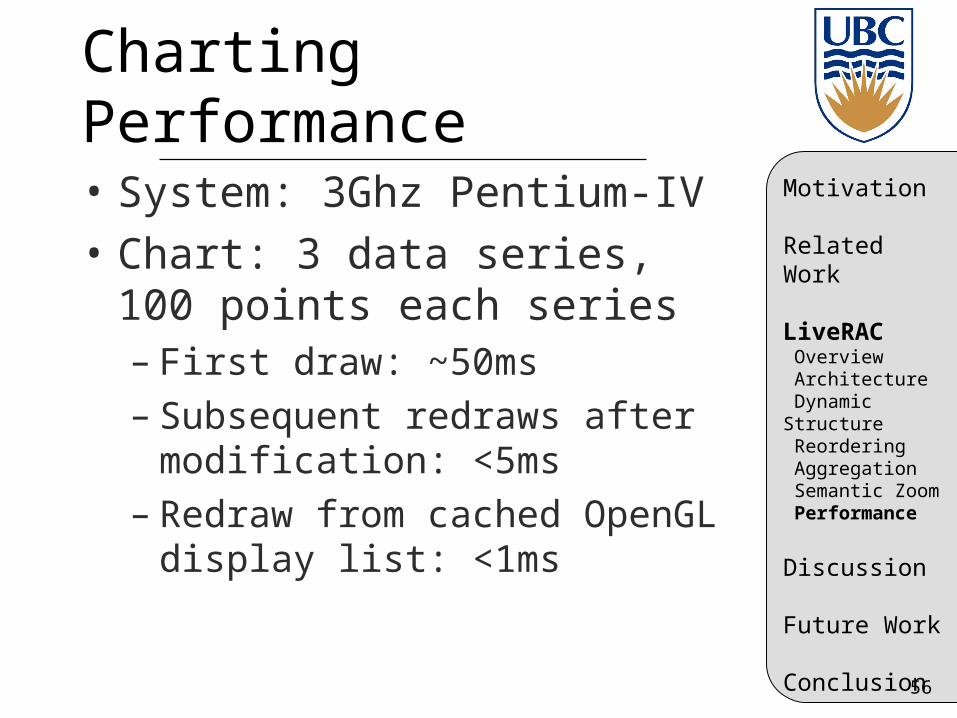
Charting Performance
• System: 3Ghz Pentium-IV
• Chart: 3 data series, 100 points each series– First draw: ~50ms– Subsequent redraws after
modification: <5ms– Redraw from cached OpenGL
display list: <1ms
Motivation
Related Work
LiveRAC Overview Architecture Dynamic Structure Reordering Aggregation Semantic Zoom Performance
Discussion
Future Work
Conclusion
57
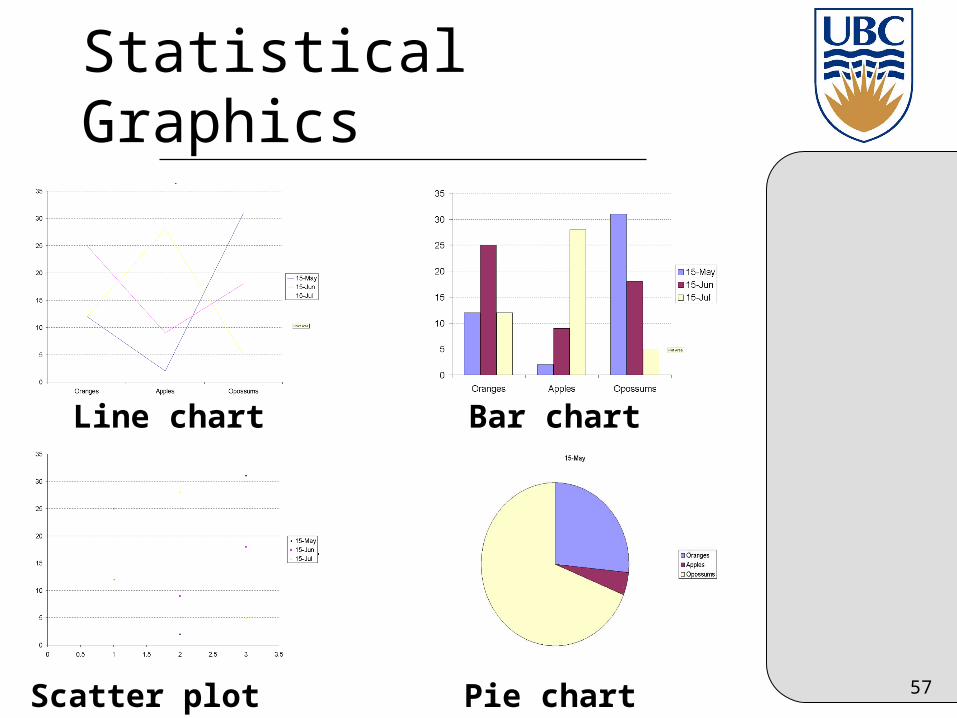
Statistical Graphics
Line chart Bar chart
Scatter plot Pie chart
58
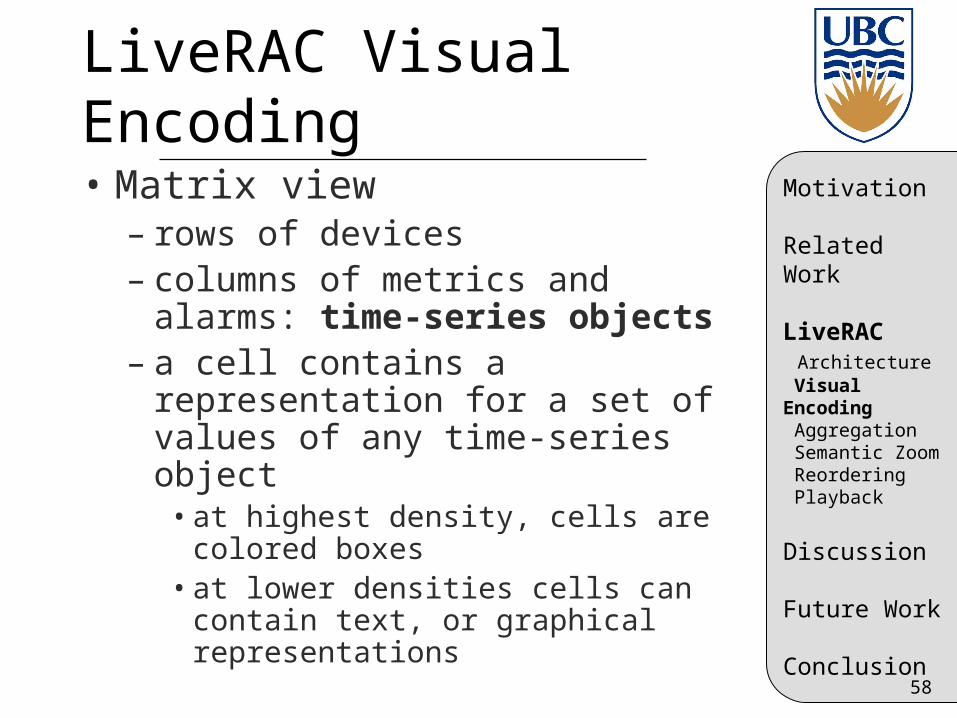
LiveRAC Visual Encoding• Matrix view
– rows of devices– columns of metrics and alarms:
time-series objects– a cell contains a representation for
a set of values of any time-series object
• at highest density, cells are colored boxes
• at lower densities cells can contain text, or graphical representations
Motivation
Related Work
LiveRAC Architecture Visual Encoding Aggregation Semantic Zoom Reordering Playback
Discussion
Future Work
Conclusion
59
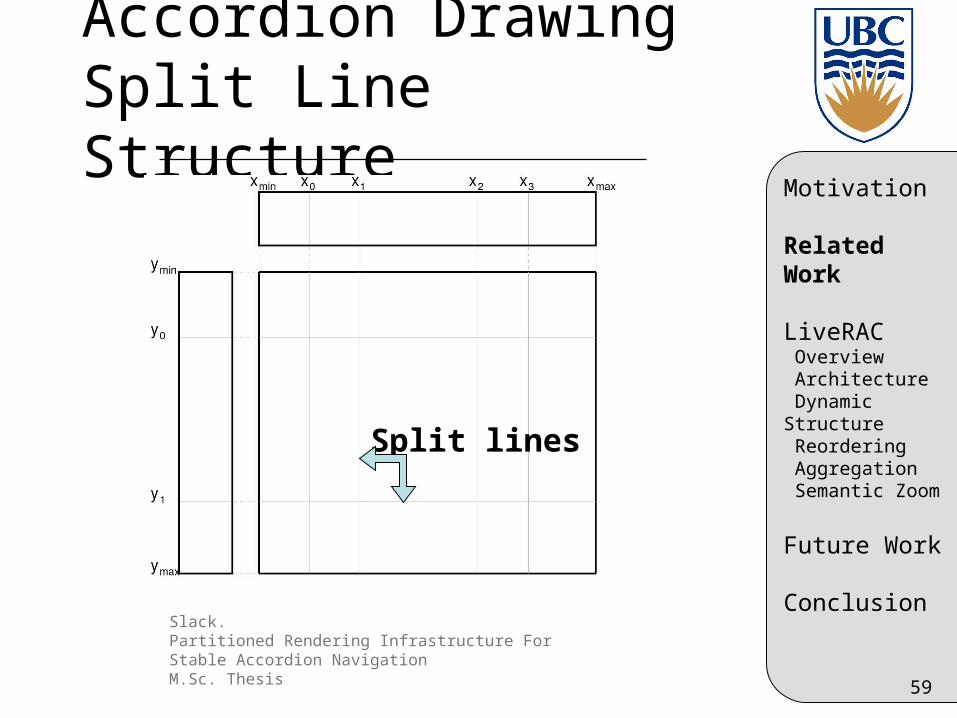
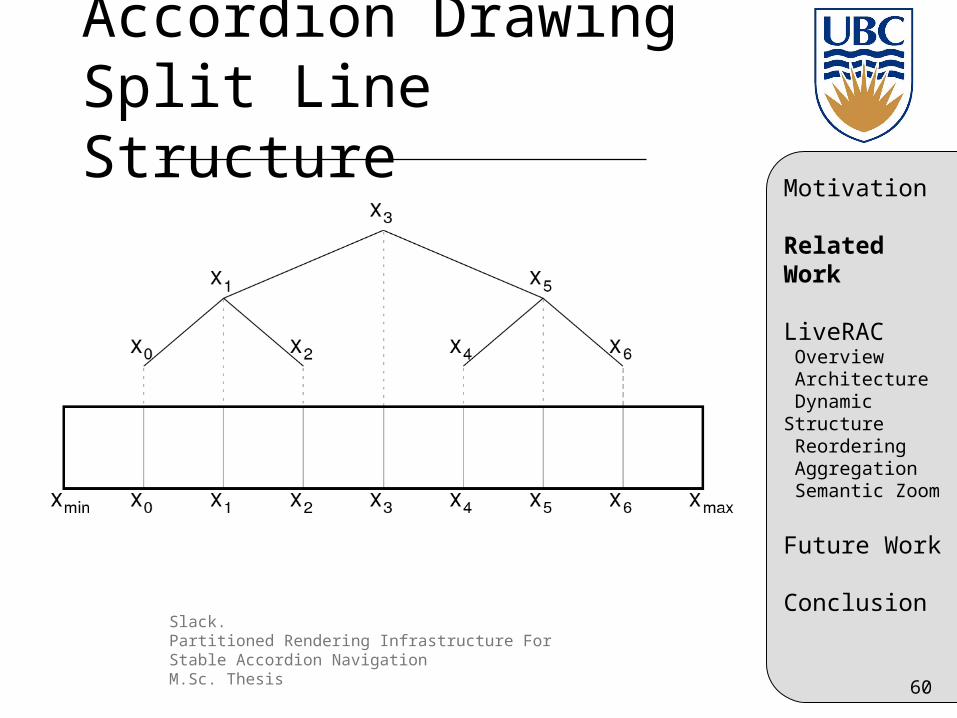
Accordion Drawing Split Line Structure
Slack. Partitioned Rendering Infrastructure For Stable Accordion NavigationM.Sc. Thesis
Split lines
Motivation
Related Work
LiveRAC Overview Architecture Dynamic Structure Reordering Aggregation Semantic Zoom
Future Work
Conclusion
60
Accordion Drawing Split Line Structure
Slack. Partitioned Rendering Infrastructure For Stable Accordion NavigationM.Sc. Thesis
Motivation
Related Work
LiveRAC Overview Architecture Dynamic Structure Reordering Aggregation Semantic Zoom
Future Work
Conclusion
61
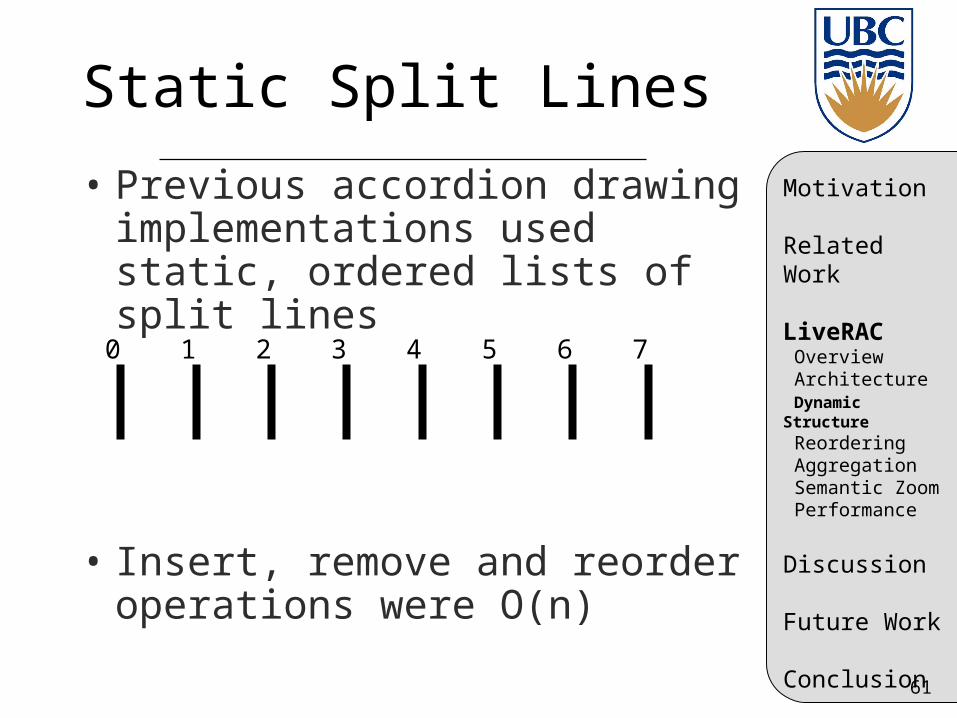
Static Split Lines
• Previous accordion drawing implementations used static, ordered lists of split lines
• Insert, remove and reorder operations were O(n)
0 1 2 3 4 5 6 7
Motivation
Related Work
LiveRAC Overview Architecture Dynamic Structure
Reordering Aggregation Semantic Zoom Performance
Discussion
Future Work
Conclusion
62
Dynamic Split Lines
• Dynamic split lines are required for maintaining interactive frame rates while adding/removing rows or columns to the matrix
• Client-server streaming architecture implies that new devices, alarms and metrics will be a common occurrence
• Dynamic split lines support reordering of data
• In the future, direct user modification of the data set can be supported
Motivation
Related Work
LiveRAC Overview Architecture Dynamic Structure
Reordering Aggregation Semantic Zoom Performance
Discussion
Future Work
Conclusion
63
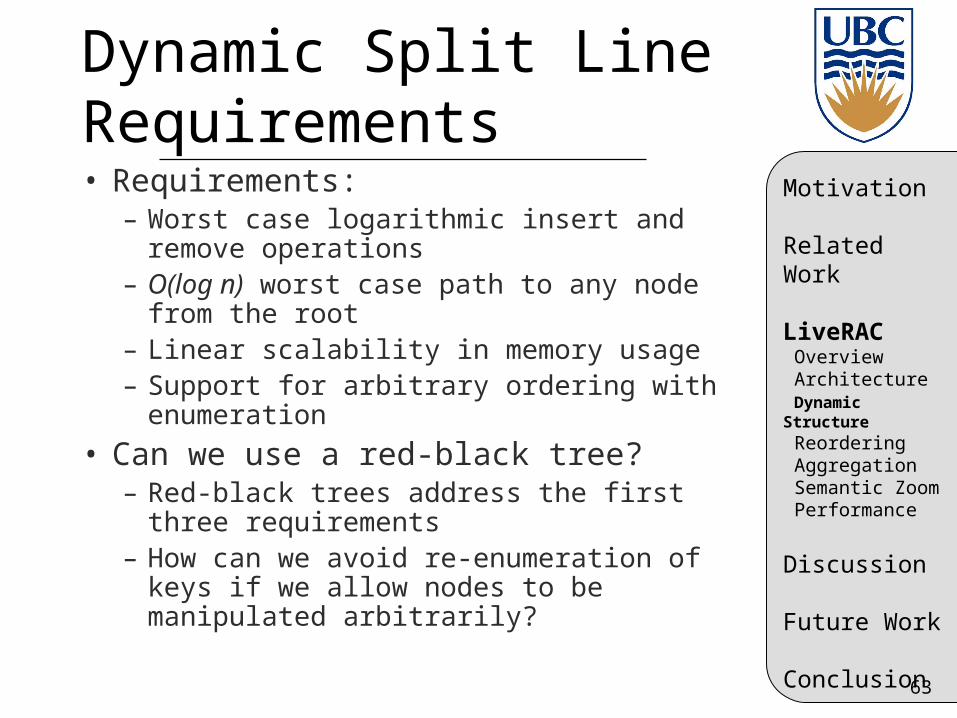
Dynamic Split Line Requirements• Requirements:
– Worst case logarithmic insert and remove operations
– O(log n) worst case path to any node from the root
– Linear scalability in memory usage– Support for arbitrary ordering with
enumeration
• Can we use a red-black tree? – Red-black trees address the first three
requirements– How can we avoid re-enumeration of keys if
we allow nodes to be manipulated arbitrarily?
Motivation
Related Work
LiveRAC Overview Architecture Dynamic Structure
Reordering Aggregation Semantic Zoom Performance
Discussion
Future Work
Conclusion
64
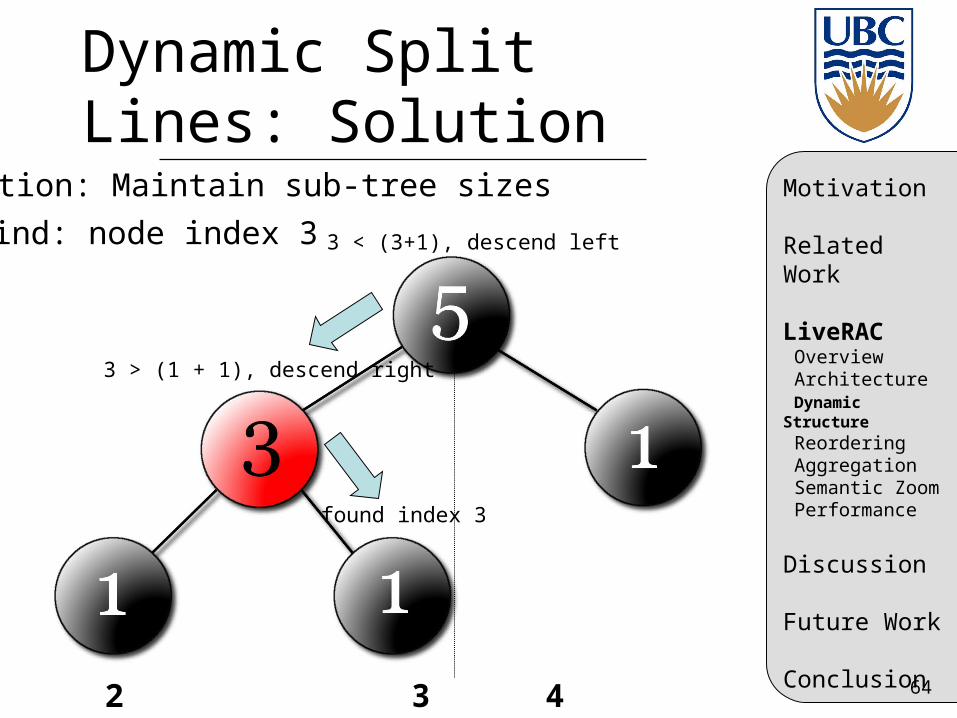
Dynamic Split Lines: Solution
Solution: Maintain sub-tree sizes
Find: node index 3 3 < (3+1), descend left
3 > (1 + 1), descend right
found index 3
Motivation
Related Work
LiveRAC Overview Architecture Dynamic Structure
Reordering Aggregation Semantic Zoom Performance
Discussion
Future Work
Conclusion
1 2 3 4 5
65
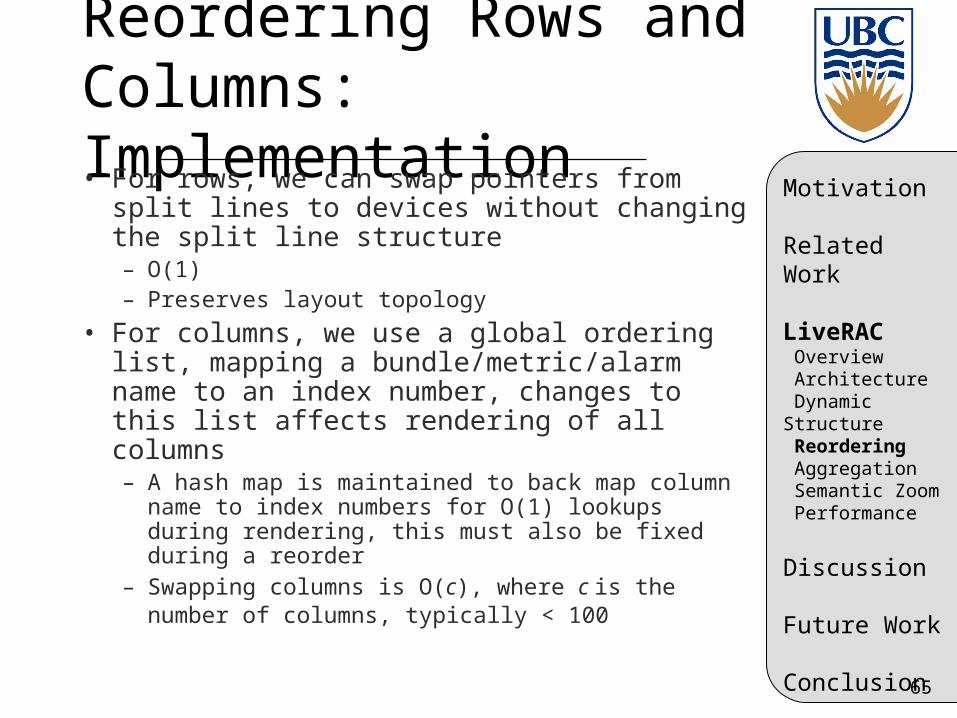
Reordering Rows and Columns: Implementation• For rows, we can swap pointers from split
lines to devices without changing the split line structure– O(1)– Preserves layout topology
• For columns, we use a global ordering list, mapping a bundle/metric/alarm name to an index number, changes to this list affects rendering of all columns– A hash map is maintained to back map column
name to index numbers for O(1) lookups during rendering, this must also be fixed during a reorder
– Swapping columns is O(c), where c is the number of columns, typically < 100
Motivation
Related Work
LiveRAC Overview Architecture Dynamic Structure Reordering Aggregation Semantic Zoom Performance
Discussion
Future Work
Conclusion
66


![I Love You - Sarah McLachlan[1]](https://img.pdfslide.us/doc/110x75/577cdcba1a28ab9e78ab405f/i-love-you-sarah-mclachlan1.jpg)