Embed Size (px)
Citation preview
Littleton, MA Littleton, MA –– Smart Sewering Strategy:Smart Sewering Strategy:
Affordable Green Sewering, FitAffordable Green Sewering, Fit--ForFor--PurposePurpose
Paul KnowlesPaul Knowles
Green First:
December 8, 2011 Falmouth MA

Introduction
• Intro to Littleton challenge and principles of
smart sewering
• The six steps of smart sewering analysis
• Opportunities for green decentralized
solutions for the cape, provided by a
Responsible Management Entity

Motivation for sewer in Littleton
• Affordable at
small-scale
• Concentrate
growth in the
commercial
center
• Consider social
and ecological
benefits
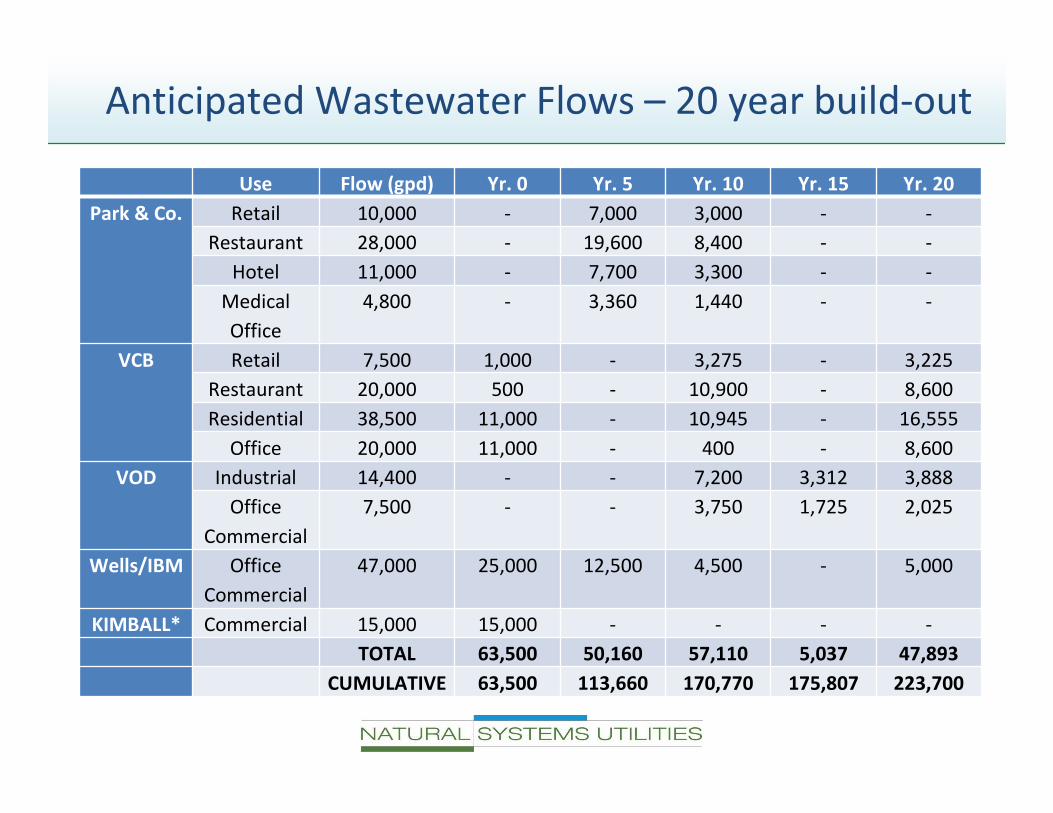
Anticipated Wastewater Flows – 20 year build-out
Use Flow (gpd) Yr. 0 Yr. 5 Yr. 10 Yr. 15 Yr. 20
Park & Co. Retail 10,000 - 7,000 3,000 - -
Restaurant 28,000 - 19,600 8,400 - -
Hotel 11,000 - 7,700 3,300 - -
Medical
Office
4,800 - 3,360 1,440 - -
VCB Retail 7,500 1,000 - 3,275 - 3,225
Restaurant 20,000 500 - 10,900 - 8,600
Residential 38,500 11,000 - 10,945 - 16,555
Office 20,000 11,000 - 400 - 8,600
VOD Industrial 14,400 - - 7,200 3,312 3,888
Office
Commercial
7,500 - - 3,750 1,725 2,025
Wells/IBM Office
Commercial
47,000 25,000 12,500 4,500 - 5,000
KIMBALL* Commercial 15,000 15,000 - - - -
TOTAL 63,500 50,160 57,110 5,037 47,893
CUMULATIVE 63,500 113,660 170,770 175,807 223,700

Smart Sewering Case Study: Littleton, MA
Q) How do we keep a 185,000 gpd system affordable
without requiring a larger sewer disctrict?
A) Perform a Smart Sewering Study which considers:
1. Community values
2. Environmental issues
3. Minimizing risk to tax base
4. Appropriate technology
5. Improving affordability for users
6. Economic Feasibility Analysis

Community Values
20 Parameters: Environmental, Economic and Social

Community Values
232 responses: top 4 parameters by score

Environmental Issues
3 town wells in Merrimack River Watershed
CONCORD
RIVER
WATERSHED
MERRIMACK
RIVER
WATERSHED
I-495
STUDY
AREA

Environmental Issues
• Water distribution in Littleton
• Recharges are on-lot septic system
• Net transfer of water from Merrimack to Concord
The Massachusetts Executive Office of Environmental Affairs (EOEA) and the Charles River Watershed
Association/ESS Group (2007), Community Water Budget Report, Town of Littleton
CONCORD
RIVER
WATERSHE
D
MERRIMACK
RIVER
WATERSHED
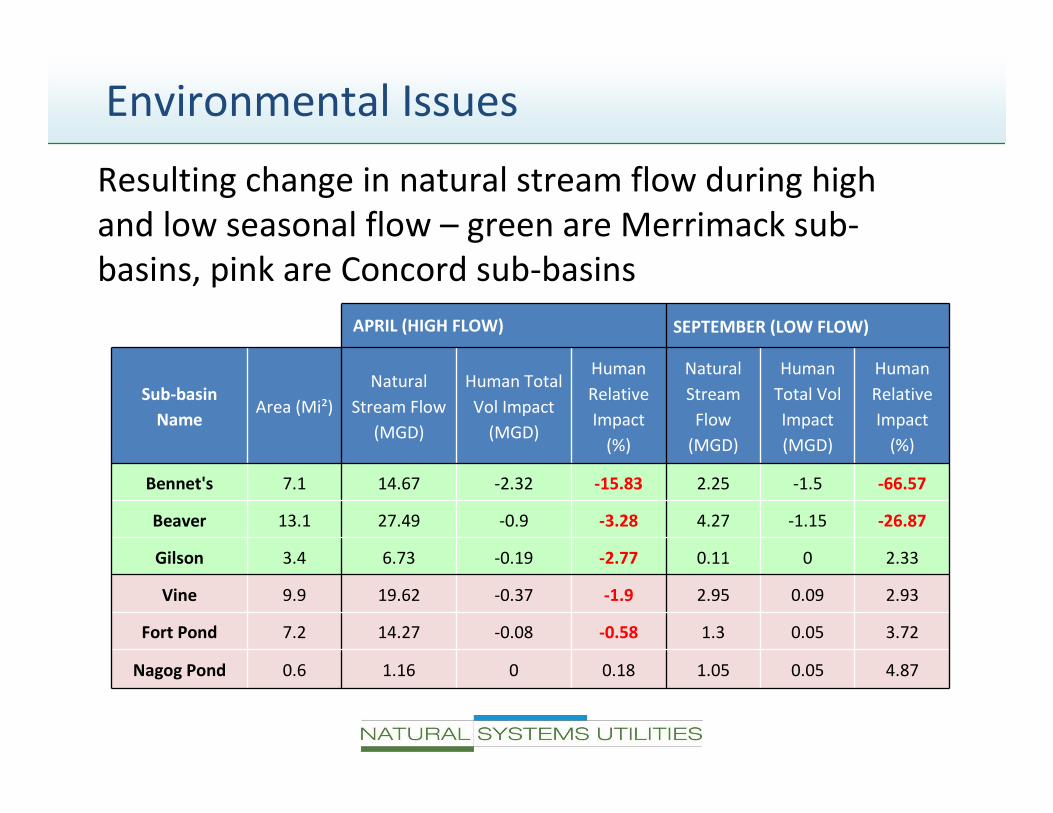
Environmental Issues
APRIL (HIGH FLOW) SEPTEMBER (LOW FLOW)
Sub-basin
NameArea (Mi²)
Natural
Stream Flow
(MGD)
Human Total
Vol Impact
(MGD)
Human
Relative
Impact
(%)
Natural
Stream
Flow
(MGD)
Human
Total Vol
Impact
(MGD)
Human
Relative
Impact
(%)
Bennet's 7.1 14.67 -2.32 -15.83 2.25 -1.5 -66.57
Beaver 13.1 27.49 -0.9 -3.28 4.27 -1.15 -26.87
Gilson 3.4 6.73 -0.19 -2.77 0.11 0 2.33
Vine 9.9 19.62 -0.37 -1.9 2.95 0.09 2.93
Fort Pond 7.2 14.27 -0.08 -0.58 1.3 0.05 3.72
Nagog Pond 0.6 1.16 0 0.18 1.05 0.05 4.87
Resulting change in natural stream flow during high
and low seasonal flow – green are Merrimack sub-
basins, pink are Concord sub-basins

Environmental Issues
Considered when locating recharge facilities
MERRIMACK
WATERSHED
Alternative
recharge area
1.5 miles away
Suitable
recharge area
within study
area
72 acres within
Zone III. Mix of
I-495 DOT and
developer land

Minimizing Financial Risk - Phasing
Reducing carrying costs by using technologies that are
affordable at small scale and then installing capacity in
phases to match growth
Large carrying
costs – higher
risk of tax
increase to
subsidize user
rate
Small carrying
costs – reduced
risk to tax base
and user
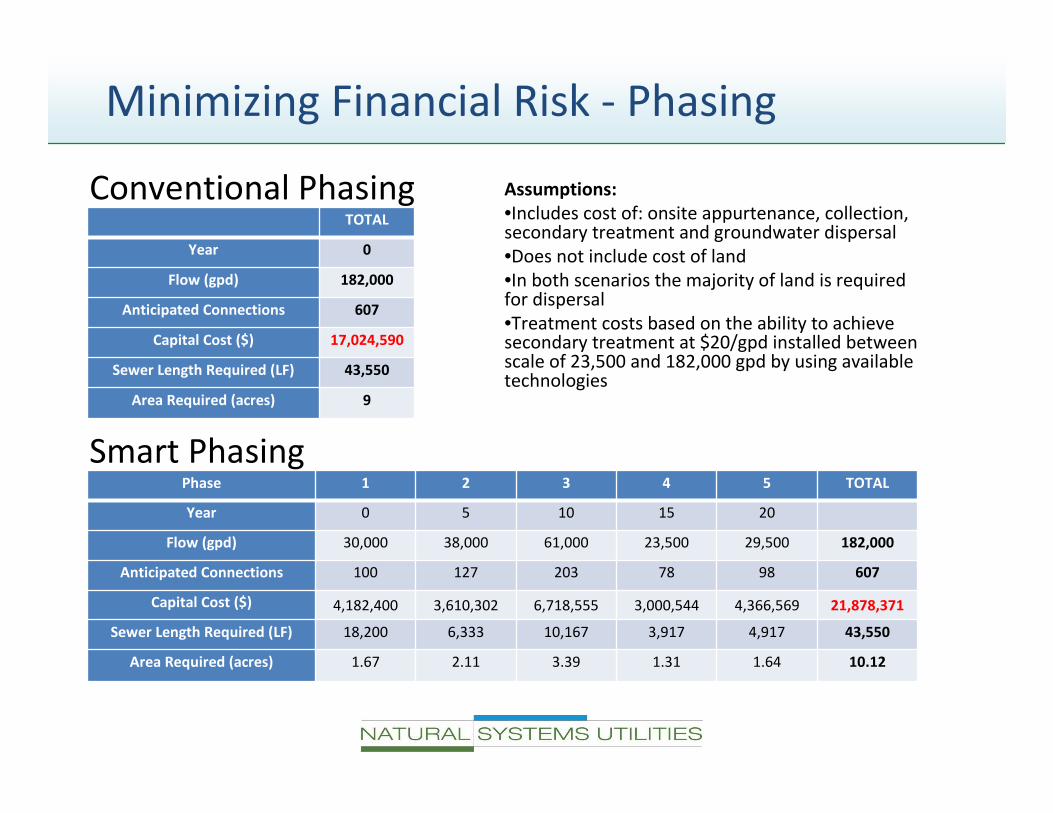
Minimizing Financial Risk - Phasing
Phase 1 2 3 4 5 TOTAL
Year 0 5 10 15 20
Flow (gpd) 30,000 38,000 61,000 23,500 29,500 182,000
Anticipated Connections 100 127 203 78 98 607
Capital Cost ($) 4,182,400 3,610,302 6,718,555 3,000,544 4,366,569 21,878,371
Sewer Length Required (LF) 18,200 6,333 10,167 3,917 4,917 43,550
Area Required (acres) 1.67 2.11 3.39 1.31 1.64 10.12
TOTAL
Year 0
Flow (gpd) 182,000
Anticipated Connections 607
Capital Cost ($) 17,024,590
Sewer Length Required (LF) 43,550
Area Required (acres) 9
Smart Phasing
Conventional Phasing Assumptions:
•Includes cost of: onsite appurtenance, collection, secondary treatment and groundwater dispersal
•Does not include cost of land
•In both scenarios the majority of land is required for dispersal
•Treatment costs based on the ability to achieve secondary treatment at $20/gpd installed between scale of 23,500 and 182,000 gpd by using available technologies
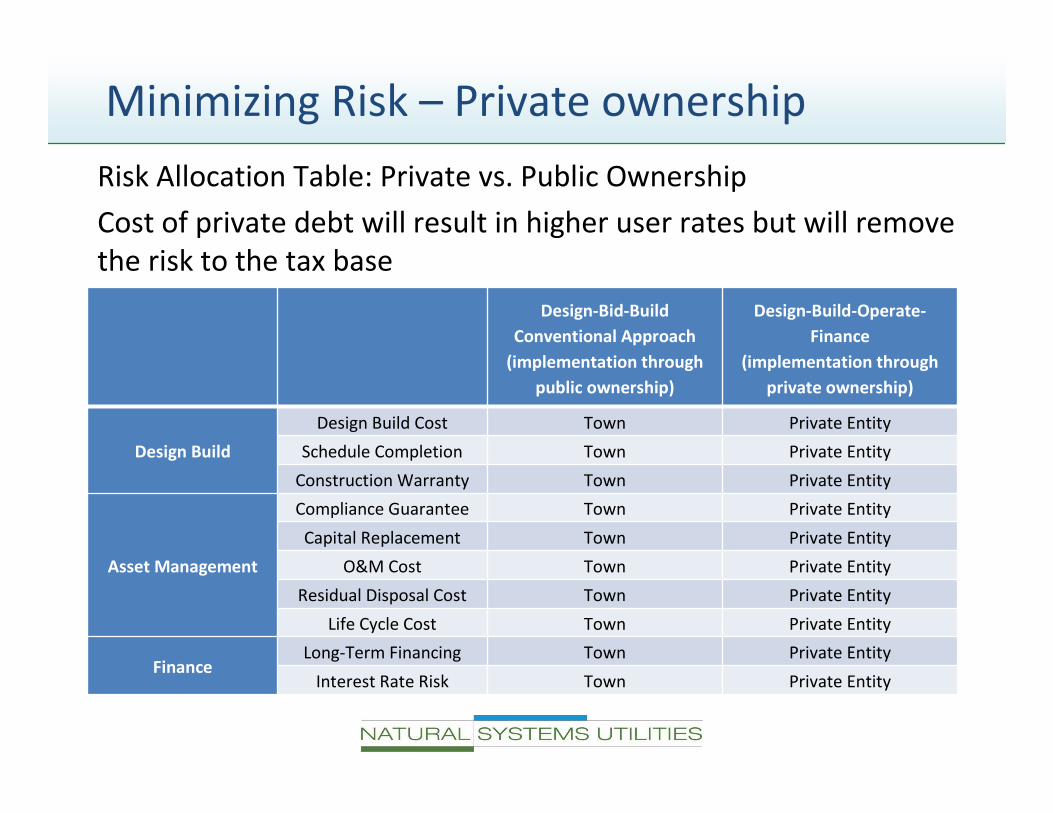
Minimizing Risk – Private ownership
Design-Bid-Build
Conventional Approach
(implementation through
public ownership)
Design-Build-Operate-
Finance
(implementation through
private ownership)
Design Build
Design Build Cost Town Private Entity
Schedule Completion Town Private Entity
Construction Warranty Town Private Entity
Asset Management
Compliance Guarantee Town Private Entity
Capital Replacement Town Private Entity
O&M Cost Town Private Entity
Residual Disposal Cost Town Private Entity
Life Cycle Cost Town Private Entity
FinanceLong-Term Financing Town Private Entity
Interest Rate Risk Town Private Entity
Risk Allocation Table: Private vs. Public Ownership
Cost of private debt will result in higher user rates but will remove
the risk to the tax base

Minimizing Risk – Private Ownership
Conventional WW Ownership Options in MA:
• Governmental - Municipal/County
• Quasi-Governmental Authority, Special District, Public Nonprofit
• Private Nonprofit Cooperative or Association
Alternative WW Ownership Options in MA:
• Private For-Profit Utility
• Public Private Partnerships – P3
Minimizing Risk – Private ownership
Private For-Profit Utility:In MA Private wastewater entities are not regulated by the
Department of Public Utilities. MassDEP regulates Privately
Owned Wastewater Treatment Facilities (PWTF) under 314 CMR
5.15 based on conditions which are aimed towards Homeowners
Associations etc.
Public Private Partnerships (P3):The town retains ownership and transfers operation and financial
obligations to a private entity under a long term contract,
generally 20 years or longer. It appears that special state
legislation would be required for a municipality to procure a
design-build-operate type contract.

Responsible Management of Infrastructure
17
Ownership/Financing-Debt/Equity
Design Construction
Existing Utility/ Govt EntityAssociation/Co-Op/etc
IPP WWTP – Co-Owned by SPV
Responsible Management Entity
(RME) $
ServicesFees $
GroundLease/SiteServices
Design Build
Operations Repair & Replace
Own/Operate
Regulators
RME Assets
$
Water/Energy/Nutrient
Services

RME – Decentralized water reuse in MA
MA Case Study: Gillette
Stadium
• MBR technology with design flow of 1.3 MGD. Capital cost in
2005 was $5.2M
• Recycles flush water from 69,000 football fans on game day.
• Sewer enabled economic expansion around the stadium –
multi-user private for-profit utility operation
• 20 year DBO contract with performance risk – reduces
recharge by reuse

Appropriate Technology
Subsurface Flow
Treatment WetlandsPackaged Activated
Sludge Process systems
Relationship between capacity in gallons per day (gpd) and unit capital cost ($/gpd capacity) for five small-
scale wastewater treatment technologies: Activated Sludge Plant (ASP), Sequencing Batch Reactor (SBR),
Oxidation Dith (Oxi-Ditch), Membrane Bioreactor (MBR) and Subsurface Flow Treatment Wetland (SSF TW).
Capital costs for small-scale treatment technologies

Appropriate Technology
Relationship between capacity in gallons per day (gpd) and unit operating cost ($/1000 gallons treated) for five
small-scale wastewater treatment technologies: Activated Sludge Plant (ASP), Sequencing Batch Reactor (SBR),
Oxidation Dith (Oxi-Ditch), Membrane Bioreactor (MBR) and Subsurface Flow Treatment Wetland (SSF TW).
Subsurface
Flow
Treatment
Wetlands
Packaged
Activated Sludge
Process systems
Operating costs for small-scale treatment technologies

Appropriate Technology
“The system is not an unsightly eyesore, does not emit
odors and emits no loud noise”
Subsurface technologies Open surface technologies
Appropriate Technology
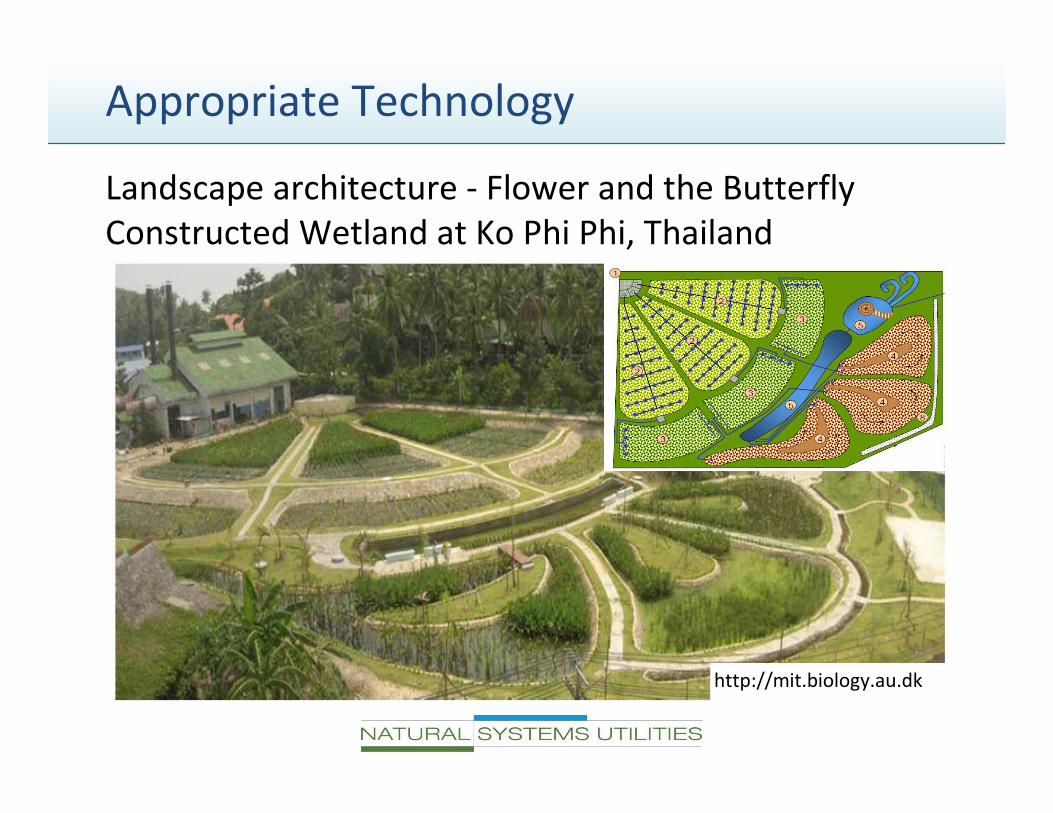
Landscape architecture - Flower and the Butterfly
Constructed Wetland at Ko Phi Phi, Thailand
http://mit.biology.au.dk
Appropriate Technology
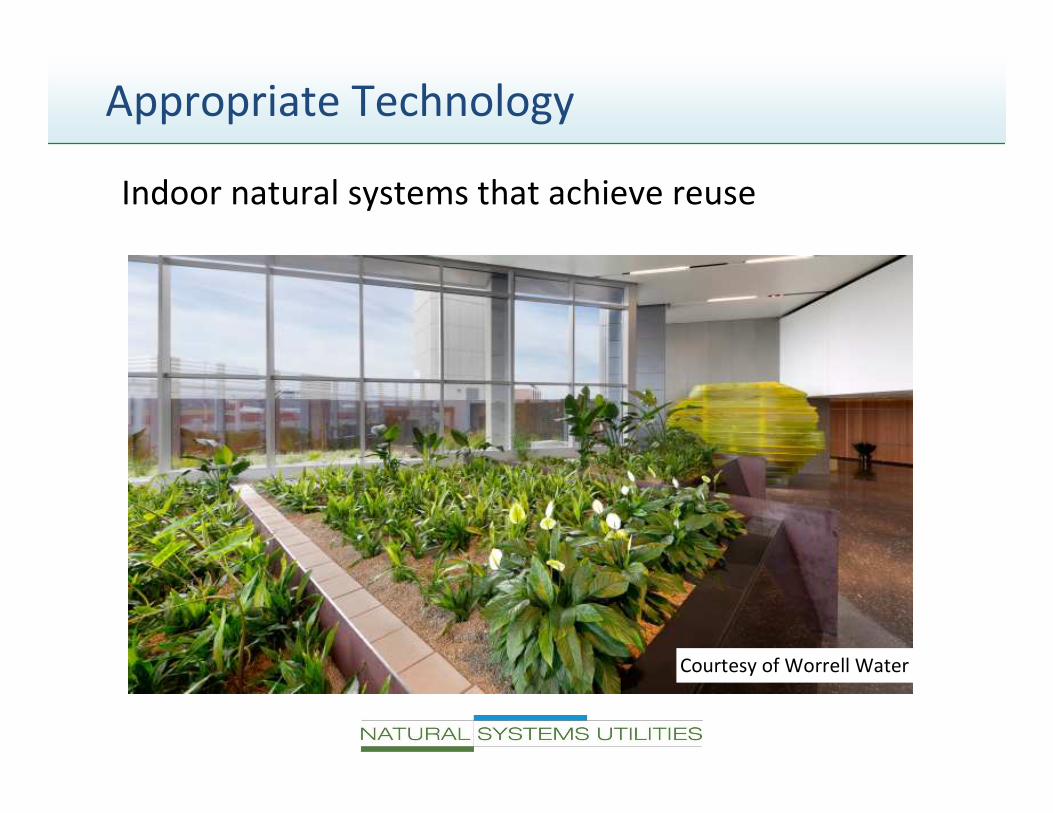
Courtesy of Worrell Water
Indoor natural systems that achieve reuse

Advanced Treatment with Natural Systems
Living Machine by Worrell Water TechnologiesPort of Portland building, OR
Appropriate Technology
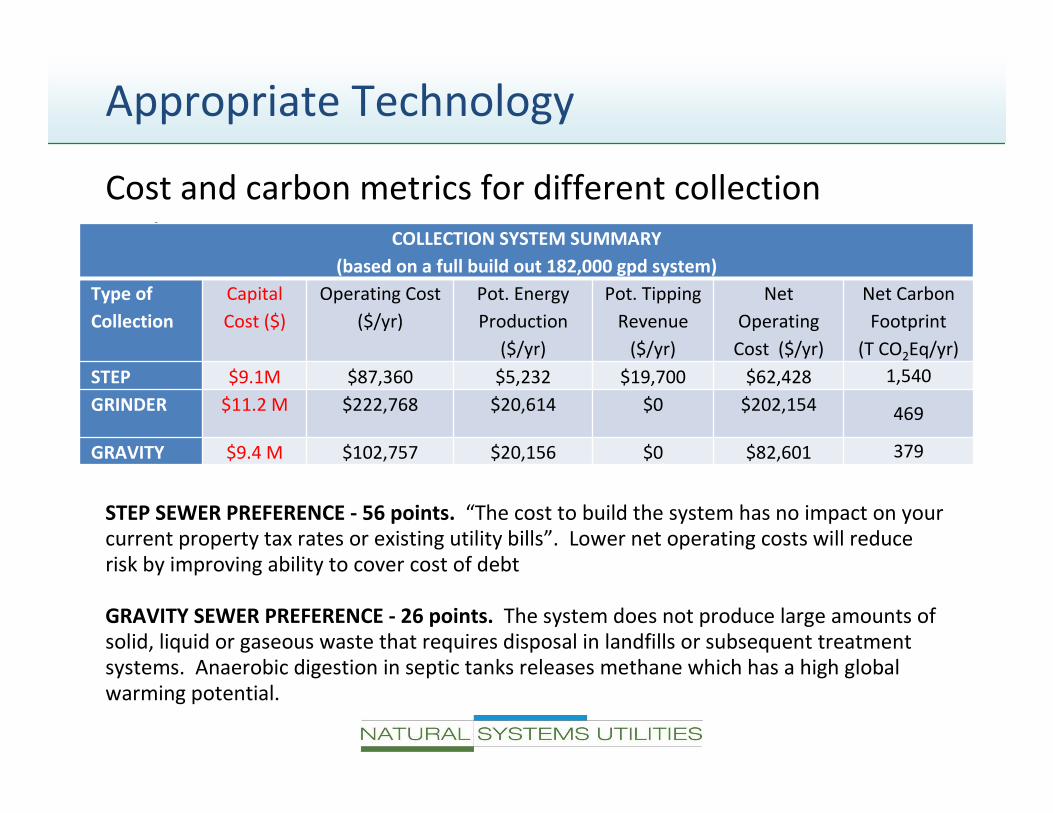
Cost and carbon metrics for different collection
systems COLLECTION SYSTEM SUMMARY
(based on a full build out 182,000 gpd system)
Type of
Collection
Capital
Cost ($)
Operating Cost
($/yr)
Pot. Energy
Production
($/yr)
Pot. Tipping
Revenue
($/yr)
Net
Operating
Cost ($/yr)
Net Carbon
Footprint
(T CO2Eq/yr)
STEP $9.1M $87,360 $5,232 $19,700 $62,428 1,540
GRINDER $11.2 M $222,768 $20,614 $0 $202,154 469
GRAVITY $9.4 M $102,757 $20,156 $0 $82,601 379
STEP SEWER PREFERENCE - 56 points. “The cost to build the system has no impact on your current property tax rates or existing utility bills”. Lower net operating costs will reduce risk by improving ability to cover cost of debt
GRAVITY SEWER PREFERENCE - 26 points. The system does not produce large amounts of solid, liquid or gaseous waste that requires disposal in landfills or subsequent treatment systems. Anaerobic digestion in septic tanks releases methane which has a high global warming potential.
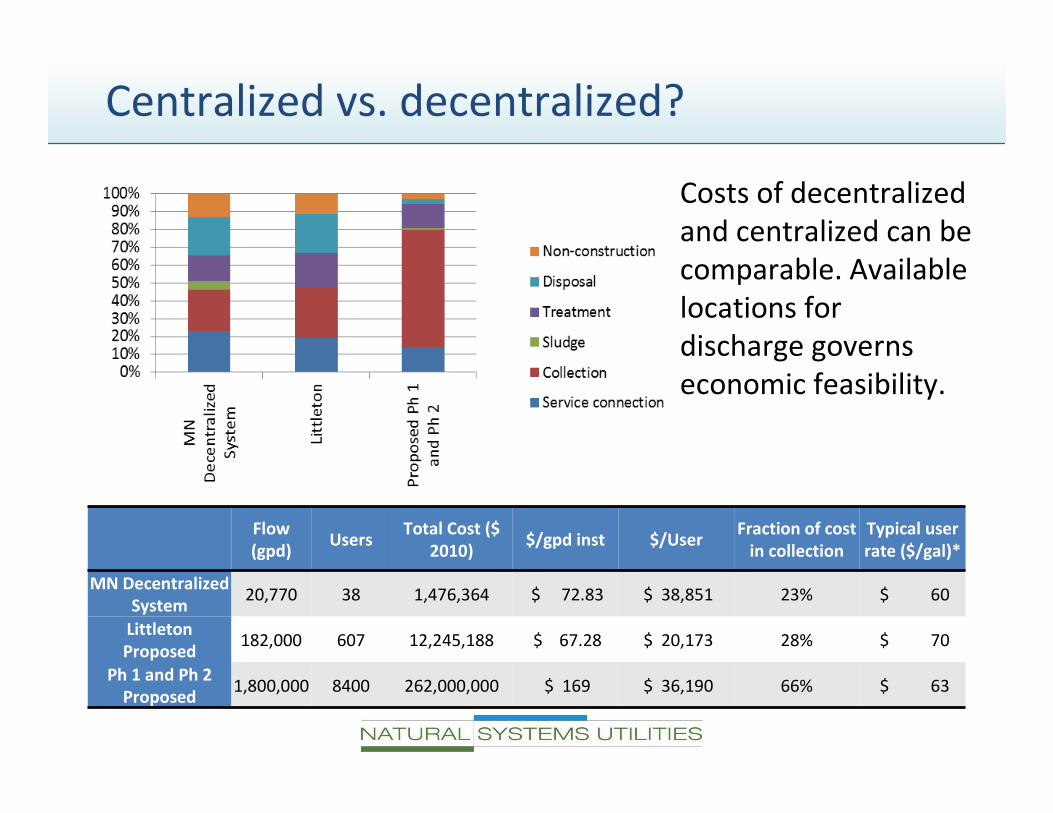
Centralized vs. decentralized?
Costs of decentralized
and centralized can be
comparable. Available
locations for
discharge governs
economic feasibility.
Flow
(gpd)Users
Total Cost ($
2010)$/gpd inst $/User
Fraction of cost
in collection
Typical user
rate ($/gal)*
MN Decentralized
System20,770 38 1,476,364 $ 72.83 $ 38,851 23% $ 60
Littleton
Proposed182,000 607 12,245,188 $ 67.28 $ 20,173 28% $ 70
Ph 1 and Ph 2
Proposed1,800,000 8400 262,000,000 $ 169 $ 36,190 66% $ 63

Cape: Feasible locations for decentralized
discharge
Zone II recharge requires less than 3 mg/L TOC. Needs advanced tech not affordable at decentralized scale… get out of Zone II if possibleFrom Sterns and Wheler CWMP

Improving Affordability
Integrate infrastructure to turn waste into resources which can
provide a source of revenue to offset sewer costs
WATER
POWER
FOOD
COLLECTION
TREATMENT
DISPOSAL
RESOURCE
SUPPLYWASTE
PROCESSING
FROM
OUTSIDETO OUTSIDE
CARBON
DOLLARS
WATER
NUTRIENTS

Improving Affordability
2.0 Dry Ton
ANAEROBIC
DIGESTER
WETLAND
TREATMENT
STEP
COLLECTION
SYSTEM
REUSE WATER
DISCHARGE
POWER
607 EDU
COMMUNITY
FERTILIZER
2.74 Tons
food waste
4,100 gpd
sludge 182,000 gpd
85,000 gpd
97,000 gpd
-$16/EDU month-$14/EDU month-$6/EDU month
2,600 kWh
Integrate infrastructure to turn waste into resources which can provide a
source of revenue to offset sewer costs

Improving Affordability – water reuse
Can reduce potable water needs by 40% and save on utility costs
REUSE NETWORK NATURAL TREATMENT SYSTEM

Improving Affordability – Energy Integration
Dry COD
(tons/day)Capital Cost ($)
O+M cost
($/yr)kWh/yr
Revenue
Tipping Fees
($/yr)
Revenue
REC sales
($/yr)
Revenue
Power sales*
($/yr)
Net
Operating
Profit ($/yr)
0.5 1,801,584 7,500 238,710 36,875 3,581 17,903 50,859
1 2,362,095 15,000 477,419 73,750 7,161 35,806 101,718
2 3,016,601 30,000 954,838 147,500 14,323 71,613 203,435
3 3,832,880 45,000 1,432,257 221,250 21,484 107,419 305,153
5 5,192,057 75,000 2,387,095 368,750 35,806 179,032 508,589
Survey priority number 3: “Reduce waste disposal”:
Anaerobic digester to produce electricity from organic waste.
•Multiple revenue sources
•Economic feasibility depends on local availability of waste
•Littleton has Rate 71 to enable purchase from micro-generators
Assumes power is sold to Littleton Electric Light Department at 0.07 $/kWh and REC value is 0.015 $kWh

Source Type of Source Tons per year Chemical
Oxygen Demand
Smart sewer network Projected Wastewater Solids 112*
Littleton Septage Residential Septic Systems 438
Littleton Food Waste Residential Food Waste 218
Nashoba Valley Life Care Center Institutional Health Facility 12
Tre Amici Restaurant 9
Yangtze River Restaurant Restaurant 8
Donelan’s Supermarket Grocery Store 27
TOTAL 711
Data for non-residential sources from Draper/Lennon, Inc., 2002, Identification, Characterization, and Mapping of Food Waste
and Food Waste Generators in Massachusetts.
Additional sources exist in town not accounted for in this table include schools and Veryfine Sunny Delight Food Processing.
Veryfine produces 6,000 tons per year of Chemical Oxygen Demand but this is not readily available. There are 235 food waste
generators within a 10 mile radius of the study area that produce 16,000 Tons per year of food waste
Survey performed to identify realistic local availability of organic
material (approximately 2 dry tons COD per day).
Improving Affordability – Energy Integration

Economic Feasibility Analysis – Public
Ownership
SCENARIO PHASING
PRIVATE
DEVELOPER
CONT.
SOURCE OF
FINANCING
COST OF
LAND
($/SF)
HOOK
UP FEE
($)
SUBSIDY
FRACTION OF
BUILD-OUT
ACHIEVED
PHASE 1 CAP
REQ FROM
FINANCING
($)
TYPICAL
USER RATE
($/MON)
RISK OF
TAX
INCREASE
Baseline Smart $2M Municipal 0 5,000 BG+TF+WR 100% 7,078,381 37 LOW
Conv. Conv. $0 Municipal 2 13,000 None 100% 11,578,240 101 HIGH
1 Conv. $2M Municipal 0 5,000 BG+TF+WR 100% 14,239,768 78 HIGH
2 Smart $0 Municipal 0 5,000 BG+TF+WR 100% 9,078,381 43 LOW
3 Smart $2M Municipal 2 5,000 BG+TF+WR 100% 7,193,581 38 LOW
4 Smart $2M Municipal 0 1,000 BG+TF+WR 100% 7,078,381 43 LOW
5 Smart $2M Municipal 0 10,000 BG+TF+WR 100% 7,078,381 29 LOW
6 Smart $2M Municipal 0 5,000 None 100% 2,182,400 70 LOW
7 Smart $2M Municipal 0 5,000 WR 100% 3,869,438 56 LOW
8 Smart $2M Municipal 0 5,000 BG + TF 100% 5,391,344 51 LOW
9 Smart $2M Municipal 0 5,000 BG+TF+WR 50% 7,078,381 61 LOW
10 Conv. $2M Municipal 0 5,000 BG+TF+WR 50% 13,883,221 127 V HIGH

Economic Feasibility Analysis – Private Ownership
SCENARIO PHASING
PRIVATE
DEVELOPER
CONT.
SOURCE OF
FINANCING
COST OF
LAND
($/SF)
HOOK
UP FEE
($)
SUBSIDY
FRACTION OF
BUILD-OUT
ACHIEVED
PHASE 1 CAP
REQ FROM
FINANCING
($)
TYPICAL
USER RATE
($/MON)
RISK OF
TAX
INCREASE
Baseline Smart $2M Municipal 0 5,000 BG+TF+WR 100% 7,078,381 37 LOW
Conv. Conv. $0 Municipal 2 13,000 None 100% 11,578,240 101 HIGH
1 Smart. $2M SRF 0 10,000 BG+TF+WR 100%7,078,381
90 NONE
2 Smart $2 M Private 0 10,000 None 100%7,078,381
148 NONE
• High-capital cost of biogas and water reuse and low hook-up make less
sense under private financing
• Rates are 4 times higher if risk is completely removed from tax-base
and only those that are served by the system have to pay for the
system
• SRF provides an affordable way of removing risk from the town

Conclusions for Littleton
• System designed to remove risk to tax-base, minimize waste, be affordable and non-offensive
• At small scale natural systems and STEP sewer were most affordable.
• This enabled modular, low-risk expansion
• Subsidy via biogas and water reuse provides a very affordable service if public financing is secured
• These subsidies are not affordable if private finance is used to remove all risk to tax-base
• A P3 or SRF funded project will allow the best of worlds but will require special legislation

Relevance to Cape Cod
Cape Cod Commission presentation in April, 2011
Feasibility of a
green and
decentralized
treatment
network for the
Cape needs
studying.

Relevance to Cape
• Green tech (and other tech) that performs enhanced nutrient removal is affordable at scale of decentralized-utility
• Proper feasibility study of decentralized sewer costs versus disposal options should be performed – need to get out of Zone II discharge
• Mechanism for RME to provide long-term operations, risk management, ownership and financing exists in MA. An economic feasibility study would be required
• RME can configure utility to single goal of the region. DBO is key for the RME to undertake risk

Relevance to Cape
• Solution for Littleton was tailor-made to needs of the town
• Motivations in the Cape are different
• Natural systems are affordable at small-scale and can be phased according to priorities
• Decentralized sewer costs should be based on the right sewer technology and specific scenario
• Economic advantage of subsidy, alternative ownership and management should be investigated

Littleton, MA Littleton, MA –– Smart Sewering Strategy:Smart Sewering Strategy:
Affordable Green Sewering, FitAffordable Green Sewering, Fit--ForFor--PurposePurpose
Thank you for your attentionThank you for your attention
Green First:
December 8, 2011 Falmouth MA

Decentralized systems are not new
Salveson et al. report on about 240 small-scale systems.
There are many more
Map adapted from information presented in:
Salveson A., Zhou, Z., Finney B.A., Burke, M., Chan Ly, J., 2009, Low-Cost Treatment
Technologies for Small-Scale Water Reclamation Plants, Water Reuse Foundation

Advanced Treatment with Natural Systems
SAGR with patented FBA technology, by Nelson Environmental CanadaSteinbach Manitoba Aerated Lagoon nitrogen polishing

RME - Distributed utility in MN
Morrison Mille
Lacs
Pine
Kanabec
Benton
IsantiChisago
Anoka
Sherburne
Washington
Meeker
Wright
Mc Leod Carver
HennepinRamsey
Scott
Dakota
Sibley
St. Paul
Minneapolis

RME Distributed utility in MN
Typical range of monthly user fees for 21 systems

RME - Waste to energy in NJ
Ridgewood, NJ
– Retrofit
existing plant
to be carbon
neutral
• DBOF P3 with Middlesex water with buyout option. Utility
assumes all performance risk
• Optimizing Renewable Energy via Solar + Internal and
External Carbon Sources. Goal = Net Zero Energy