Embed Size (px)
Citation preview
3433 Oakwood Hills Parkway Eau Claire, WI 54701-7698
715.834.3161 • Fax: 715.831.7500 www.AyresAssociates.com
Ayres Associates Project No. 26-0827.00
File: k:\water resource eng\dfd\2014 little falls dam reconstruct\report\final submittal\little falls dam reconstruction pre-design feasibility study-april 2015.docx
Little Falls Dam
Reconstruction Pre-Design Feasibility Study Prepared for: Wisconsin Department of Administration Madison, WI April 2015
File: k:\water resource eng\dfd\2014 little falls dam reconstruct\report\final submittal\little falls dam reconstruction pre-design
feasibility study-april 2015.docx i
Contents Page No.
Executive Summary ................................................................................................................... 1
1. Introduction ....................................................................................................................... 2
2. History ............................................................................................................................... 2
3. Existing Hydrology .......................................................................................................... 12
4. Existing Hydraulics .......................................................................................................... 13
5. Stability Analyses ............................................................................................................ 14
a. 1934 Stability Analysis ................................................................................................ 14
b. 1979 Stability Analysis ................................................................................................ 15
c. 1984 Stability Analysis ................................................................................................ 15
d. 1987 Stability Analysis ................................................................................................ 16
e. Stability Analysis Conclusions .................................................................................... 16
6. Spillway Capacity Improvement Alternatives ................................................................... 17
a. Alternative #1 ............................................................................................................. 18
b. Alternative #2 ............................................................................................................. 19
c. Alternative #3. ............................................................................................................ 20
d. Alternative #4 ............................................................................................................. 21
e. Alternative #5 ............................................................................................................. 22
f. Alternative #6 ............................................................................................................. 23
g. Alternative #7 ............................................................................................................. 24
h. Alternative #8 ............................................................................................................. 24
i. Additional Alternatives Considered ............................................................................. 25
7. Discussion of Drawdown ................................................................................................. 25
8. Summary......................................................................................................................... 27
9. Recommendations .......................................................................................................... 29
List of Appendices
Appendix A Existing Conditions
Appendix B Alternatives Drawings
Appendix C Alternatives Opinions of Estimated Costs
Appendix D Alternatives Hydraulics
1
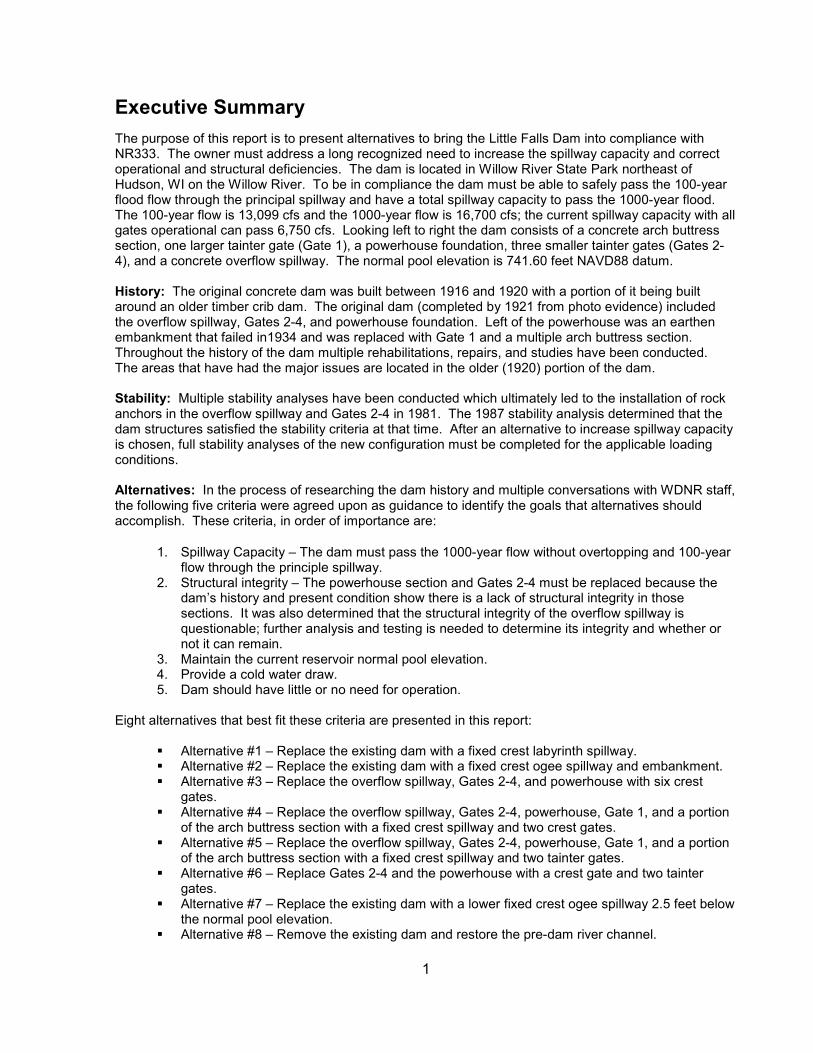
Executive Summary
The purpose of this report is to present alternatives to bring the Little Falls Dam into compliance with NR333. The owner must address a long recognized need to increase the spillway capacity and correct operational and structural deficiencies. The dam is located in Willow River State Park northeast of Hudson, WI on the Willow River. To be in compliance the dam must be able to safely pass the 100-year flood flow through the principal spillway and have a total spillway capacity to pass the 1000-year flood. The 100-year flow is 13,099 cfs and the 1000-year flow is 16,700 cfs; the current spillway capacity with all gates operational can pass 6,750 cfs. Looking left to right the dam consists of a concrete arch buttress section, one larger tainter gate (Gate 1), a powerhouse foundation, three smaller tainter gates (Gates 2-4), and a concrete overflow spillway. The normal pool elevation is 741.60 feet NAVD88 datum. History: The original concrete dam was built between 1916 and 1920 with a portion of it being built around an older timber crib dam. The original dam (completed by 1921 from photo evidence) included the overflow spillway, Gates 2-4, and powerhouse foundation. Left of the powerhouse was an earthen embankment that failed in1934 and was replaced with Gate 1 and a multiple arch buttress section. Throughout the history of the dam multiple rehabilitations, repairs, and studies have been conducted. The areas that have had the major issues are located in the older (1920) portion of the dam. Stability: Multiple stability analyses have been conducted which ultimately led to the installation of rock anchors in the overflow spillway and Gates 2-4 in 1981. The 1987 stability analysis determined that the dam structures satisfied the stability criteria at that time. After an alternative to increase spillway capacity is chosen, full stability analyses of the new configuration must be completed for the applicable loading conditions. Alternatives: In the process of researching the dam history and multiple conversations with WDNR staff, the following five criteria were agreed upon as guidance to identify the goals that alternatives should accomplish. These criteria, in order of importance are:
1. Spillway Capacity – The dam must pass the 1000-year flow without overtopping and 100-year flow through the principle spillway.
2. Structural integrity – The powerhouse section and Gates 2-4 must be replaced because the dam’s history and present condition show there is a lack of structural integrity in those sections. It was also determined that the structural integrity of the overflow spillway is questionable; further analysis and testing is needed to determine its integrity and whether or not it can remain.
3. Maintain the current reservoir normal pool elevation. 4. Provide a cold water draw. 5. Dam should have little or no need for operation.
Eight alternatives that best fit these criteria are presented in this report:
� Alternative #1 – Replace the existing dam with a fixed crest labyrinth spillway. � Alternative #2 – Replace the existing dam with a fixed crest ogee spillway and embankment. � Alternative #3 – Replace the overflow spillway, Gates 2-4, and powerhouse with six crest
gates. � Alternative #4 – Replace the overflow spillway, Gates 2-4, powerhouse, Gate 1, and a portion
of the arch buttress section with a fixed crest spillway and two crest gates. � Alternative #5 – Replace the overflow spillway, Gates 2-4, powerhouse, Gate 1, and a portion
of the arch buttress section with a fixed crest spillway and two tainter gates. � Alternative #6 – Replace Gates 2-4 and the powerhouse with a crest gate and two tainter
gates. � Alternative #7 – Replace the existing dam with a lower fixed crest ogee spillway 2.5 feet below
the normal pool elevation. � Alternative #8 – Remove the existing dam and restore the pre-dam river channel.
2
1. Introduction
The purpose of this report is to present alternatives to increase the spillway capacity at the Little Falls Dam. The Little Falls Dam is classified as a High Hazard Dam, due to the potential for loss of life in the event of failure, and as such must be able to safely pass the 1000-year flood flow (16,700 cfs). Additionally, the 100-year flood flow (13,099 cfs) must be able to be passed through the principal spillway to bring the dam into compliance with NR 333. As currently configured, the existing structure can pass 6,750 cfs and is not in compliance with NR 333. The history, stability, structural integrity, and condition of the structure must be considered before selecting an alternative to increase the spillway capacity.
All elevations listed in the report are in feet and NAVD88 datum. The normal pool level is 741.60.
Little Falls Dam is located in Willow River State Park, 8.5 miles northeast of Hudson, WI, on the Willow River. The Little Falls Dam is a combination of designs and components of different vintages. From left to right when looking downstream, the dam includes:
1934 vintage • 117 foot concrete arch buttress non-overflow section which also serves as the walkway
to the observation deck. • Gate 1 (22.0 feet wide by 12.0 feet tall tainter gate)
1920 vintage
• 43 foot wide powerhouse section which serves as the observation deck. • Gates 2-4 (three – 12.0 foot wide by 9.0 foot tall tainter gates) • 72 foot gravity form or mass design overflow spillway.
Appendix A includes a plan view drawing of the existing site.
2. History
An in-depth review of the Wisconsin Department of Natural Resources (WDNR) field files was completed to compile a condensed history while presenting as much pertinent detail as practicable for the Little Falls Dam. The Little Falls Dam has been subjected to numerous floods and has had significant changes and repairs throughout its history. The following is a summary of events and timeline of the major repairs and investigations, as described in the WDNR field files:
• 1892 – A wood crib dam and powerhouse was constructed at the site of the Little Falls Dam.
• 1916 – 1920 The wood crib dam was partially removed and a concrete dam was built around the lower cribbing of the old dam. The concrete dam consisted of an overflow spillway and three tainter gates (Gates 2-4). The original design had an overflow spillway that was 92 feet long, but the final configuration was 72 feet long. (9/17/1935, Failure of the Little Falls Dam on the Willow River Owned by the Willow River Power Company)
• 1920 – High flows broke through the flume section damaging the turbine and powerhouse; the plant and flume were rebuilt.
3
• 1934 – High flows, estimated between 6,900 and 7,500 cfs, washed out the left earth embankment. The embankment was on rock foundation with no core wall, once overtopped, the failure occurred quickly. The earth embankment was replaced with a 22.0 feet wide by 12.0 feet tall tainter gate (Gate 1) and non-overflow arch buttress section.
• 1938 – Repairs were done to the concrete overflow spillway and Gates 2-4. It was suggested that the tailrace of the powerhouse, downstream of Gate 1, and downstream of the arch buttress section be armored to protect the sandstone foundation.
• 1938 – A concrete apron was placed below the spillway. • 1947 – An inspection noted the overflow spillway was badly cracked, the abutment at the
right tainter gate was badly cracked, the right wing wall was very badly cracked and falling apart. Slight seepage was observed coming through the right retaining wall and it was observed on the left side of the dam coming under the arch buttress section at ground level.
• 1959 – An inspection noted that the overflow spillway has deteriorated to the extent that water was passing through the overflow spillway section several feet below the crest. The right training wall broke off at the lower end; during periods of high water it was possible for water to undercut the sandstone bank on the right side of the overflow spillway.
• 1961 – The overflow spillway was in very poor condition. The top six feet of the overflow spillway and right wing wall were replaced.
• 1967 – Ownership of the dam was transferred to the WDNR. An inspection noted that the concrete on the left side was in good condition and the concrete on the right side of the dam was in fair condition with cracks observed in the buttresses and wing walls, the seals and sills were in poor condition, seepage was noted on the left “earth dike” and the gates needed paint.
• 1970 – An inspection noted that the new cracks in the right portion of the dam were repaired, the gates need to be painted, the gates need seal improvements, and Gates 3 and 4 leak through the bottom. Seepage was noted flowing along the left base of the dam coming from the concrete base as well as through the right canyon wall around dam.
• 1979 – National Dam Safety Program Inspection Report o This inspection report was sponsored by the Department of the Army – St. Paul
District Corps of Engineers and the inspection was performed by Warzyn Engineering Inc.
o The report provides a brief history and general summary of the dam; the following facts are the major points from the report:
� The dam was originally built in 1920 (1916 in other reports) and the overflow spillway section was constructed over a rock filled timber crib.
� A major flood washed out the left embankment in 1934. The embankment was replaced with a tainter gate (Gate 1) section and arch buttress section; the original overflow spillway, tainter gate section (Gates 2-4), and powerhouse remained in place.
� In 1938 a concrete apron was placed downstream of the overflow spillway.
� In 1961 new ogee concrete was placed on the 1920 section of the dam. � In 1966 the ownership was transferred from a private owner to the
WDNR; the dam’s purpose transitioned from a power producing dam to a recreational impoundment.
4
� Downstream of the (approximately between one and two miles downstream) 12 residences are located in the floodplain slightly above the normal river level.
� Based on the past history of significant economic damage and possibility for loss of life due to a failure the dam continues to be classified as high hazard.
o The report provided conclusions and recommendations based on the findings during the inspection. The major conclusion and recommendations are as follows:
� The total discharge capacity of the dam is 9,600 cfs which in 1979 was slightly higher than the 100-year flood. This is far less than the recommended 1.0 of the probable maximum flood, PMF.
� The capacity of the overflow spillway is 1,300 cfs, which is approximately a 1.25-year flood. It is very important that the gates are operated properly in the event of a flood.
� One of the 12 foot gates was inoperable at the time of the inspection and it was recommended in the report that it be repaired quickly.
� The report also recommended that spillway capacity of the dam be increased so that it can pass between 0.5 and 1.0 of the PMF.
� The normal pool elevation is 741.6 feet NAVD88; four tainter gates are operated to maintain the pool elevation.
� The tainter gate openings can be stop logged. The spillway is slightly higher than the top of the gates and minor amounts of flow overtop the gates when they are closed.
� The sluice gate was not designed to be operated until the pool is lowered by the tainter gates; it is generally not used.
� The dam is visited daily, the dam was not lighted at the time of the inspection, and there is no formal flood warning system.
� The report recommended that lights be installed and a formal flood warning system be implemented.
� At the time of the inspection there was no regular maintenance plan in place for the dam.
� The report recommended that informal inspections be documented and formal inspections occur annually and during or after unusually high water events. It was also recommended that the tainter gates be extended so water is not allowed to overtop them.
� Previous inspections indicated a misalignment of the right pier. This was thought to indicate an unstable foundation condition, since sliding and overturning stability did not meet current design criteria.
� The maximum bearing stress on the rock was approximately eight tons per square foot which was tolerable.
� It was recommended that further investigation into the foundation stability be performed.
� Seeps were noted to exist at the base of the arch section. The owner indicated that occasional vortices are observed in the impoundment which may indicate under seepage and/or piping. The possibility of under seepage exists and may affect the stability of the dam.
� It was recommended that further investigation into the seepage and vortices be done.
� Scour has been a problem at the dam due to a soft rock foundation and lack of energy dissipation. Downstream local scour has been over ten
5
feet. Scour may pose a threat to dam safety and it is recommended that further investigation and mitigation be done.
� The older (1920) portions of the dam had marginal stability against overturning and sliding from hydrostatic and silt loading. Overturning and sliding are less than adequate when ice loading is added.
� The newer portion (1934) of the dam meets the 1979 criteria for overturning and sliding when resistance, from the foundation keys, is considered.
� The 1920 portion of the dam is badly deteriorated and exhibited structural strength problems.
� The 1934 portion of the dam appeared to be sound. � It was recommended that additional testing be performed to evaluate the
strength of the dam. Soundings were also recommended to determine the extent of the scour and gather more data that could be utilized to evaluate the stability and strength of the dam.
o Project Information and Typical Drawings – This section of the report provides descriptions of each portion of the dam, the dam’s drainage area, the flood of record, spillway capacities, critical elevations, and typical drawings.
o Background Engineering Data – This section provides a brief history of the dam. o Hydraulics and Hydrologic Evaluation – A spillway design hydrograph table,
spillway rating curve, tailwater rating curve, elevation-storage-area graph, flood frequency analysis graph, and spillway design hydrograph are available in this section.
o Evaluation of Physical Aspects of Operation and Maintenance – The standard operation, maintenance, and inspection practices are described in this section.
o Geotechnical Evaluation � General Geology – The river valley is deeply cut through a combination of
glacial deposits and the underlying Ordovician and Cambrian age rock foundations. The bedrock is primarily dolomite and sandstone. The watershed is primarily glaciated areas of ground moraine, end moraine, and pitted outwash. The topography of the watershed varies from rolling to gently sloping and is primarily farmland and woodland.
� Site Geology – The dam abutments and foundations are on fine grained sandstone which can be described as medium bedded, dipping upstream at five to seven degrees. The bedding planes are closed and joints widely spaced; the rock is relatively soft and poorly cemented.
� Assessment of Foundation Stability – The right pier of Gate 4 is misaligned which may indicate unstable foundation conditions. The sliding and overturning did not meet 1979 design criteria. The maximum bearing stress on the bedrock is eight tons per square foot which was determined to be tolerable.
� Assessment Against Uncontrolled Seepage – Seeps were noted at the base of the multiple arch buttress section. Occasional vortices have been observed by the owner which may have been related to seepage and/or piping.
� Slope Protection – There is no upstream slope protection but it was not thought to be critical.
� Scour Protection – Scour was present at the structure and was thought it may pose a threat to stability. It was recommended that remedial action be implemented.
6
o Structural Evaluation � Assessment of Structural Stability – Gates 2-4 and the overflow spillway
were found to have marginally adequate stability for overturning and sliding with hydrostatic pressure and silt loading. The overturning and sliding stability for this section were less than adequate when ice forces were added. The stability of the powerhouse was not evaluated due to lack of structural information. The stability of the arch buttress section and Gate 1 met the 1979 criteria if keyways into the foundation rock are considered.
� Assessment of Structural Strength – The 1920 portion of the structure (powerhouse, Gates 2-4, and overflow spillway) exhibit serious deterioration and spalling of concrete, which has exposed reinforcing steel in the tainter gate piers. Localized cracking and miss-alignment are evident and the right tainter gate pier has a through crack near the trunion pin anchor. Miss-alignment of the piers which restricts operation of the gates was observed. The condition of the spillway was not apparent. The spillway was resurfaced in 1961, but earlier pictures in the field file indicated similar degrees of deterioration. The concrete condition in the new portion of the dam (left of powerhouse) was in adequate condition.
• January 1980 – Warzyn Engineering Inc. – Testing, Inspection, and Preliminary Design Report, Little Falls Dam Rehabilitation, Willow River State Park
o The purpose of this additional engineering work is to develop preliminarily rehabilitation plans, a preliminary cost estimate, develop a cost/benefit ratio and evaluate the cost of rehabilitation with alternative actions for the Little Falls Dam.
o Testing Performed – Ultrasonic testing was performed on the dam to the right of Gate 1, visual inspection of the dam to the right of the powerhouse was completed, upstream and downstream soundings were done, and lab testing of concrete cores was completed.
o Description of Existing Structure � Gate 4 was inoperable due to structural displacement of the right pier. � The 1920’s portions of the structure to the right were found to possess
marginal stability against overturning and sliding. Overturning stability was found to be less than adequate and does not meet currently (1979) accepted stability criteria.
� Gate 1 and the arch buttress section to the left of the powerhouse was found to meet 1979 stability criteria for overturning and sliding if keys in the foundation rock are considered.
o Upstream and Downstream Soundings � Four to eight feet of scour was found at the toe of the overflow spillway. � Eight to twelve feet of scour was found at the toe of Gates 2-4. � Three to eight feet of scour was found at the toe of Gate 1. � Large boulders and chunks of concrete were found upstream of the
spillway – ten to twelve feet from the top of the overflow spillway and six to seven feet down from the sills of Gates 2-4.
o Concrete Core Information � A concrete core at the upstream right face of the pier between Gate 4 and
the overflow spillway had a compressive strength of 3370 psi. � Concrete cores in the right abutment wall, overflow spillway, downstream
portion of the between Gate 4 and the overflow spillway, and pier between Gates 3 and 4 all had adequate strength.
7
o Condition of Concrete � Minor vertical cracking was observed to the left of Gate 1. � Delamination and cracking was observed on the exterior faces of the
powerhouse and tainter gate piers. � Cracking and spalling was observed near the gate support pins. � The top six feet of the overflow spillway, replaced in 1961, was in good
condition. Deterioration and cracking was observed in the old concrete below the cold joint of the repair.
� Structural movement was prohibiting the operation of Gate 4. Significant cracking, spalling, and rotation was observed on the right pier. Delamination of the surface concrete, horizontal cracking, diagonal cracking, and vertical cracking was also observed which indicated a serious structural situation.
o Evaluation of Testing Work and Findings � The left pier of Gate 4 and left pier of Gate 3 were shown to be problem
areas using the ultrasonic pulse readings. These are problem areas due to the amount and size of micro cracking near the tainter gate support pins and development length of the anchorage.
� Inconsistencies in the mixing and placement of the concrete during construction and weak aggregate bonding with the cement paste were determined to be responsible for the observed deterioration. Alkali-aggregate reactions were thought to be causing deterioration in the 1979 report, but this is not the case.
o Recommendations � Post-tensioned anchors be installed in the overflow spillway and Gates 2-
4 to increase the stability of the dam. � The right pier of Gate 4 should be replaced. � Deteriorated concrete should be repaired and epoxy be injected into
cracks found on the tainter gate piers, north wall of the powerhouse, and inside the sluice gate.
� The downstream voids should be filled with concrete. � A grout curtain be installed at the arch dam section to stop seepage
and/or piping. � Occasional vortices had been observed in the upstream pool adjacent to
the arch buttress section which may have been related to the observed seepage and/or piping. Due to the nature of the bedrock, it is possible that significant under seepage may have existed which may have affected the stability of the structure.
• December 1980 – Warzyn Engineering Inc. – Subsurface Investigation Little Falls Dam Rehabilitation
o The purpose of this investigation was to determine subsurface conditions within the areas of proposed repairs and provide recommendations for overflow spillway rock anchors and grouting for seepage control.
o Field Work: � Five borings were performed in November 1980.
• Three borings were performed downstream of the arch buttress portion of the structure.
• Two borings were preformed from a barge upstream of the overflow spillway portion of the structure.
� Bore holes downstream of the arch buttress section were pressure tested for permeability through the foundation bedrock.
8
� Core samples were collected and evaluated by an engineering geologist. o Description of bedrock downstream of arch buttress section:
� Three to five feet of severely weathered bedrock and silty alluvium on top of 30 feet of fine grained sandstone.
� The bedrock contains numerous silt seams and vertical joint fractures. � Rock Quality Designation (RQD) indicated the bedrock in the area of the
arch buttress section to be generally fair to excellent. � Water pressure tests indicate relatively low hydraulic conductivity in the
bedrock. o Description of bedrock upstream of overflow spillway:
� Water depths varied from 6.5 to 8.3 feet during the partial drawdown for drilling (reservoir elevation not recorded in report).
� Both borings encountered portions of the original, rubble mound structure on top of four to six feet of dense, fine grained sandstone. Fine grained quartz sandstone seams with alternating shale seams were encountered through the remainder of the borings. The stratified rock stratum is extremely fractured and broken at a depth of seven to ten feet into the deposit.
� Rock Quality Designation (RQD) indicated the bedrock in the area of the spillway to be poor to good with the poorest quality rock in the lower sandstone/shale zone.
o Rock Anchor Recommendations: � Rock anchors should be drilled into the natural rock strata below the
rubble debris. � Rock anchors should be spaced at least 1.2 times the depth of
embedment. � Ultimate bond stress of 100 psi could be used as an average throughout
the rock strata for anchor design. � A minimum safety factor of 2.0 should be used for rock anchor design. � All rock anchors should be proof loaded to confirm design assumptions. � Rock anchors could be installed at a batter (angle) to provide additional
sliding and overturning stability. � Report provided the following foundation parameters for stability
analyses: • Concrete/Sandstone Interface:
o Unit Weight = 80 pcf o Internal Friction Angle = 40 degrees o Cohesion = 0 psf
• Upper, Fine Grained Sandstone: o Unit Weight = 75 pcf o Internal Friction Angle = 60 degrees o Cohesion = 0 psf
• Fractured, Broken Sandstone/Shale: o Unit Weight = 65 pcf o Internal Friction Angle = 20 degrees o Cohesion = 400 psf
• Beds should be considered horizontal for purposes of analysis. o Seepage Control Recommendations:
� Borings did not indicate that significant seepage did or would occur through foundation rock. Deep, line, grouting did not appear warranted.
9
� A graded filter blanket or drain system was suggested (in lieu of area grouting) to alleviate potential for piping of foundation soils. The filter blanket recommendation consisted of filter fabric covered by a coarse stone (light riprap) mat.
� Seepage monitoring should be continued. o Cofferdam Construction Recommendations:
� Sheet pile cofferdam would be difficult to construct due to shallow bedrock and lack of ability to get much toe resistance.
� Blasting should not be permitted for purposes of loosening bedrock for sheet piling.
� Base seal and/or bracing would be required for seepage and stability control of a cofferdam.
� An earthen cofferdam might also be considered but economics and environmental impacts may make this impractical.
• 1981 – Warzyn Engineering Inc. – Rehabilitation of the Little Falls Dam Specifications (DOA Project No. 8006-10)
o Demolition – The hand railings, sluice gate, and hoisting mechanisms for all four gates were removed.
o Removal of Concrete and Surface Preparation – The unsound concrete removed as a part of this project was at the following locations: deck surfaces, concrete on the powerhouse, concrete in the interior of the sluice, concrete on the pier past the left face of the powerhouse, concrete on the original pier of the left powerhouse wall, complete removal of the right abutment and two piers of Gates 2-4 down to the face of the spillway, removal of the concrete walkway over Gates 2-4.
o Rock Anchors – Four rock anchors were installed in the overflow spillway and stressed to a load 260kips, a rock anchor was installed in the center of each of Gates 2-4 and stressed to a load of 170kips. Concrete flip buckets were installed at the trailing end of the spillway apron discharge and rock bolted to the bedrock.
o Cast-in-place concrete was used to replace the right abutment wall of Gate 4, the piers between Gates 2-4, the powerhouse walls, the walkways, and the downstream apron.
o Low water/cement concrete overlay was used on the observation platform and walkway over the powerhouse.
o Miscellaneous steel construction included a sluice gate trash rack, sluice gate hoist support, tainter gate angle extensions, and the rock anchors.
o Joint sealant was used for all cold joints. o Paint – All tainter gates, hoist mechanisms, and sluice gate.
• 1984 – Synergics, Inc. – Stability of Little Falls Dam o The purpose of this report was to present analysis and address questions
regarding the stability of the dam which were raised in the 1979 Dam Safety Inspection Report.
o The report analyzed the stability of the dam after repairs were made to increase the overturning resistance of the overflow spillway section and Gates 2-4. Rock anchors were installed in these two sections and flip buckets were anchored to the bedrock downstream of the spillways.
o This report determined that no danger of failure existed under the most extreme flood conditions.
10
• 1987 – Warzyn Engineering, Inc. – Engineering Evaluation of Little Falls Dam o The purpose of this study was to observe and evaluate the condition of the Little
Falls Dam and to provide recommendations for rehabilitation and as required modifications of the structure to safely pass the 1000-year flood event.
o Inspection: � Concrete was in good condition other than deterioration at the right
abutment. � Tainter gates were in good condition, the u-bolt clips are reversed which
affects the capacity of the wire rope system. The sluice was operated twice a year and functioned properly during the inspection. The stem pipe cover had broken off.
� The hoist cable for Gate 3 was broken. � Vegetation has been allowed to grow on the riprap and geotechnical
fabric below the arch buttress section. The fabric and stone was placed to reduce piping potential and seepage.
� Some seepage was observed adjacent to the right abutment. o Hydraulic and Hydrologic Evaluation:
� The 1000-year event was determined to have a flow of 15,000 cfs, which corresponds to a pool elevation of 746.0 feet (2.4 feet above walkway), and a tailwater elevation of 730.6 feet.
o Structural Stability Evaluation: � The 1979 analysis was reviewed and the 1000-year flood loading
condition was added (1000-year headwater + 1000-year tailwater + silt load)
� The stability of the dam was significantly increased by the 1981 rehabilitation construction.
� The report concluded that the dam structure satisfied the 1987 stability criteria and no further upgrades to increase stability were needed.
o Three alternatives were considered to pass the 1,000 year flood: � Remove a portion of the arch buttress section and install a tainter gate.
This was not considered because of the relatively high cost. � Provide an emergency spillway adjacent to the left abutment. This was
not considered because of the relatively high cost for creating and providing erosion protection for the emergency spillway.
� Provide containment levees at right angles to the river at the left and right abutments. This would increase the effective height of the dam and confine the overtopping to the concrete portion of the structure. This was the preferable option because of constructability and cost.
� Note – It appears that none of these alternatives were acted upon. • 1988 – WDNR – Willow River State Park Environmental Assessment
o The purpose of this report was to aid the decision making process in whether to repair or remove the Willow River Dams.
o Willow River State Park is a LAWCON property which means any conversion to something other than public outdoor recreational use of the property cannot occur without the concurrence of the National Parks Service.
o The river downstream of the Little Falls Dam has been restored to a trout habitat and there are strong local trout advocacy groups.
o The Little Falls Reservoir is heavily fished by visitors to the state park. • 1988 – WDNR – Development and Results of DAMBRK Model for the Willow River
o The purpose of this report was to develop a hydraulic model of the Willow River from the New Richmond Dam to the mouth of the Hudson River. The model was
11
used to estimate the effect of the estimated 100-year flood on the five dams located in this study area.
o The USGS regression equations were used to determine the flood frequencies at the Willow River dams, but the USACE flows were utilized because they were more conservative.
o The gates of Little Falls Dam were assumed to be closed and a rapid failure through the overflow spillway section with a crest of 740.6 was assumed. The gates were not assumed to be open because the opening of gates at high and low flows would cause downstream water levels to rise quickly which would threaten homes.
o The 100-year flood caused a sequential failure of all five dams on the Willow River. The peak flow at the Little Falls Dam was 37,688 cfs and the maximum water surface elevation was 745.5 feet.
• 1990 – EWI Engineering Associates – Little Falls Dam Rehabilitation Specifications (DOA Project No. 8910-10)
o The purpose of this project was to repair the right abutment wall and other surface concrete repairs.
o Demolition – The top portion of the right abutment wall was removed. o Concrete Surface Preparation – Existing deteriorated concrete was removed
from the following locations: the tainter gate wall surfaces and the top portion of the right abutment wall.
o A drainage system was installed for the right abutment. o Cast-in-Place Concrete was installed at the Gate 1 pier extension, new seepage
measuring weir to the left of Gate 1, and new right abutment wall. o After these specifications were written, the right abutment wall required additional
investigations and design. Sheet piling with reinforced tremie concrete was used to connect cast-in-place concrete to the existing concrete of the right abutment wall.
• 1990 – WDNR – Dam Failure Analysis o The purpose of the report is to provide quantitative information related to the
flood stage profile that is the result of dam failure conditions on the Willow River. o The dam was assumed to fail through the overflow spillway with a maximum
breach of 73 feet. The gates were assumed to be closed prior to the failure because opening the gates causes downstream flooding which threatens homes.
o The peak discharge at the Little Falls Dam was 17,375 cfs with a flood elevation of 748.09.
• 1996 – Flood Warning System – A flood warning system with an automatic gate operation system was installed but is no longer in use due to downstream flooding concerns. The City of Hudson objected to use of the system due to concerns that an automatic gate could open and cause downstream flooding.
• 2011 – WDNR Dam Inspection – The findings of the inspection are as follows: o An EAP, IOMP and Dam Failure analysis should be completed for the dam. o There is no method of measuring flow at the dam. o Woody vegetation is growing on the downstream portion of the embankment. o Greasing and lubrication of tainter gates is difficult because of access. o The face of dam and tainter gates could not be inspected. o Cracking of the concrete at the pinions of the tainter gates was observed. o Cracking and weeping from the cracks in the arch buttress section was observed. o Seepage was observed through the sandstone abutting the dam behind the right
abutment.
12
o Right abutment was not inspected in detail due to dangerous access. o There is no portage sign or portage route designated for dam. o Detailed inspection of multiple areas that are difficult and/or dangerous to access
must be performed. A drawdown to inspect the face of the dam was recommended.
• 2013 – Ayres Associates - Dam Failure Analysis – Flows from the 2009 Flood Insurance Study were used in a dynamic routing and inline structures in HEC-RAS. The 100-year flood flow was 13,099 cfs and the 1000-year flow was 16,700 cfs. Two spillway gates in the deepest part of the channel were assumed to fail. The State Park Trail crossing and Trout Brook Road crossings would be inundated from a failure during a 100-year event. Fifteen structures would be inundated if the dam were to fail during a 100-year flooding event. The dam failure analysis was approved in January of 2014 and a high hazard rating was reassigned.
• 2014 – Ayres Associates - Inspection – This inspection was commissioned to include specialized equipment and trained personnel to safely access parts of the dam that are not designed to be occupied. The primary observations during the 2014 inspection included:
o The dam does not have sufficient capacity to pass a 1000-year flood event. This reiterates the analysis that was done in the 1979 and 1987 reports.
o Gates 2 and 4 were inoperable at the time of the inspection. In addition to the inoperability a detailed inspection of the gates had the following findings:
� Gates 2, 3, and 4 need to be cleaned, sandblasted, and painted. � The edges of all rough cuts should be ground smooth � Gate 2, the full penetration weld of the splice arm’s bottom angle of the
lower double should be welded to a full thickness of the leg of the angle. � Gate 2, a leak was observed at the bottom left corner of the bay which
appears to be coming underneath the concrete of the left wall. o Three voids were found underwater on the downstream side of the dam; the
voids should be filled. o No backup power is available onsite; a generator is borrowed, and subject to
availability, from the City of Hudson. o The depth to sediment observed by the dive crew was approximately ten feet.
Earlier investigations documented stone and rubble this is assumed to be buried; probing was not done to confirm this.
3. Existing Hydrology
The 2009 Flood Insurance Study produced a 100-year flood flow of 13,099 cfs as measured “Just downstream of the confluence of Paperjack Creek.” Paperjack Creek enters the Willow River just south of New Richmond, WI. This estimate was derived using a transfer from nearby gaged streams judged to be hydrologically similar to the upper Willow River. In the 2013 dam failure analysis, flows were also calculated using the USGS Regression Equations, USGS Basin Comparison, and HEC-HMS. These methods produced significantly lower estimates of the 100-year flood (7,500 cfs, 7,700 cfs, and 6,700 cfs) than the value used in the Flood Insurance Study (13,099 cfs). Although, the contributing watershed for the area “Just downstream of the confluence of Paperjack Creek” is 218 square miles and the contributing area at the Little Falls Dam is 292 square miles. Because other accepted methods certainly did not support a flood flow larger than the FIS flow at Paperjack Creek, the 2013 Dam Failure Analysis did not use an area adjustment to adjust the flow to account for the difference in drainage areas. The flows
13
reported “Just downstream of the confluence of Paperjack Creek” were used and assumed to be conservative for the Little Falls Dam.
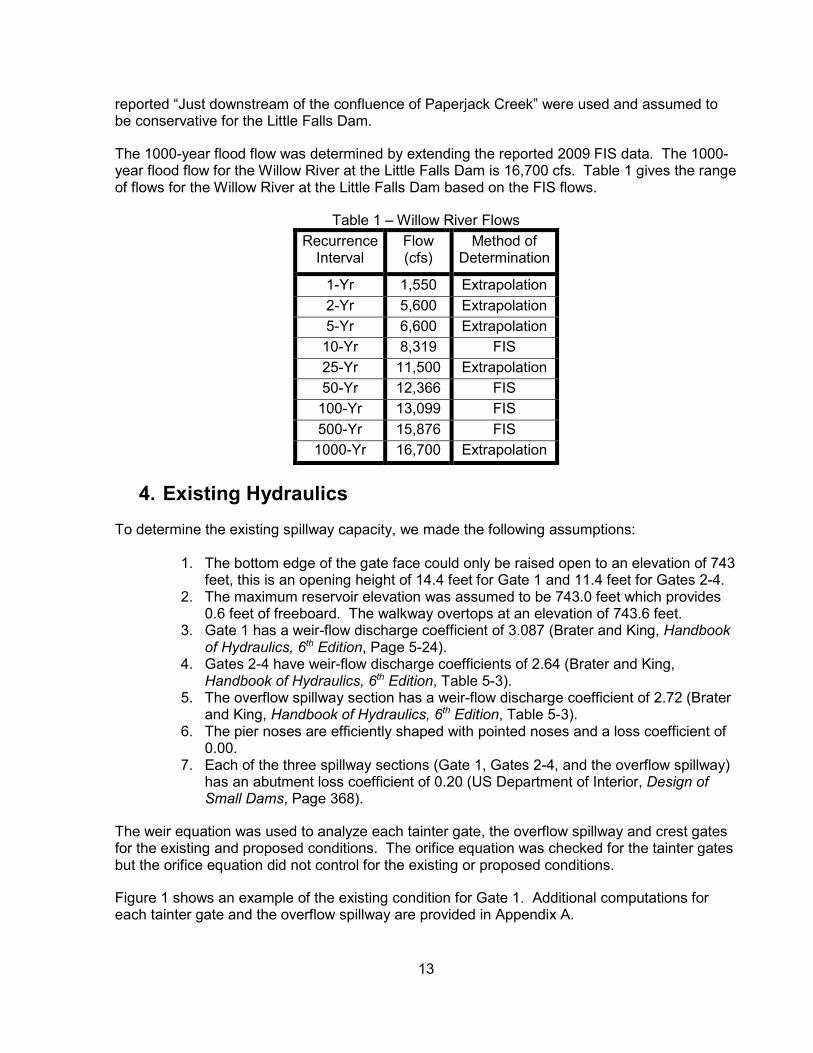
The 1000-year flood flow was determined by extending the reported 2009 FIS data. The 1000-year flood flow for the Willow River at the Little Falls Dam is 16,700 cfs. Table 1 gives the range of flows for the Willow River at the Little Falls Dam based on the FIS flows.
Table 1 – Willow River Flows
Recurrence Interval
Flow (cfs)
Method of Determination
1-Yr 1,550 Extrapolation
2-Yr 5,600 Extrapolation
5-Yr 6,600 Extrapolation
10-Yr 8,319 FIS
25-Yr 11,500 Extrapolation
50-Yr 12,366 FIS
100-Yr 13,099 FIS
500-Yr 15,876 FIS
1000-Yr 16,700 Extrapolation
4. Existing Hydraulics
To determine the existing spillway capacity, we made the following assumptions:
1. The bottom edge of the gate face could only be raised open to an elevation of 743 feet, this is an opening height of 14.4 feet for Gate 1 and 11.4 feet for Gates 2-4.
2. The maximum reservoir elevation was assumed to be 743.0 feet which provides 0.6 feet of freeboard. The walkway overtops at an elevation of 743.6 feet.
3. Gate 1 has a weir-flow discharge coefficient of 3.087 (Brater and King, Handbook of Hydraulics, 6th Edition, Page 5-24).
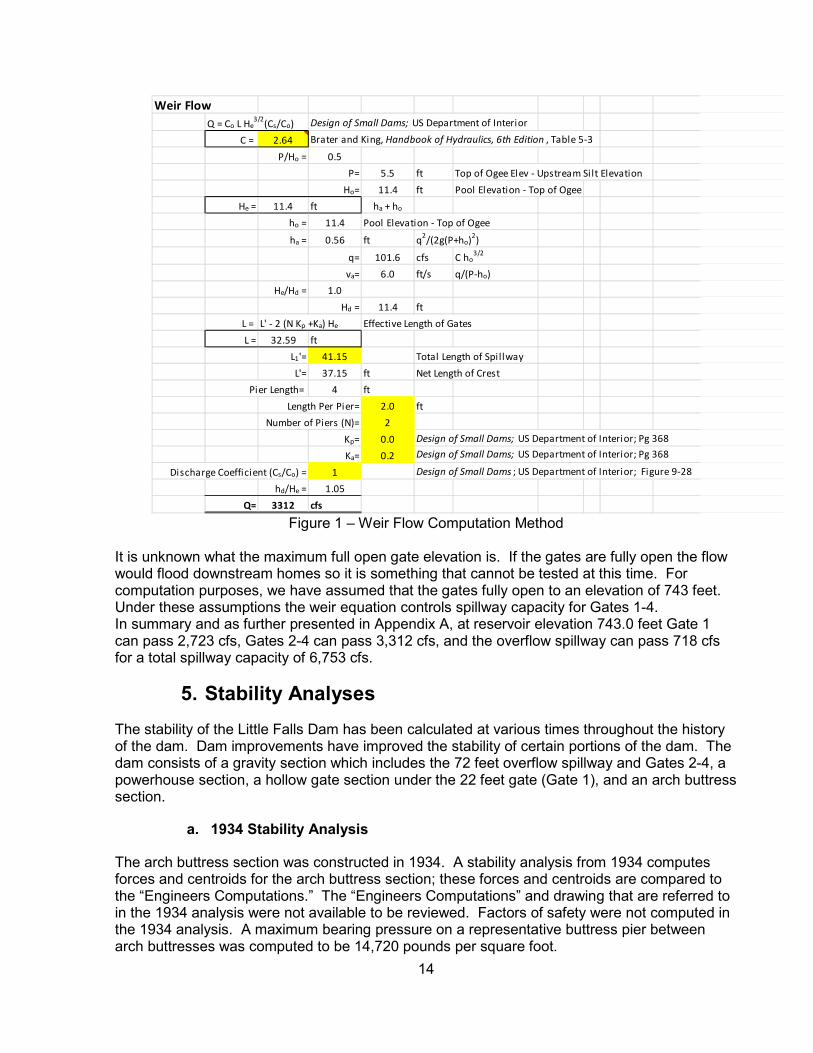
4. Gates 2-4 have weir-flow discharge coefficients of 2.64 (Brater and King, Handbook of Hydraulics, 6th Edition, Table 5-3).
5. The overflow spillway section has a weir-flow discharge coefficient of 2.72 (Brater and King, Handbook of Hydraulics, 6th Edition, Table 5-3).
6. The pier noses are efficiently shaped with pointed noses and a loss coefficient of 0.00.
7. Each of the three spillway sections (Gate 1, Gates 2-4, and the overflow spillway) has an abutment loss coefficient of 0.20 (US Department of Interior, Design of Small Dams, Page 368).
The weir equation was used to analyze each tainter gate, the overflow spillway and crest gates for the existing and proposed conditions. The orifice equation was checked for the tainter gates but the orifice equation did not control for the existing or proposed conditions.
Figure 1 shows an example of the existing condition for Gate 1. Additional computations for each tainter gate and the overflow spillway are provided in Appendix A.
14
Figure 1 – Weir Flow Computation Method
It is unknown what the maximum full open gate elevation is. If the gates are fully open the flow would flood downstream homes so it is something that cannot be tested at this time. For computation purposes, we have assumed that the gates fully open to an elevation of 743 feet. Under these assumptions the weir equation controls spillway capacity for Gates 1-4. In summary and as further presented in Appendix A, at reservoir elevation 743.0 feet Gate 1 can pass 2,723 cfs, Gates 2-4 can pass 3,312 cfs, and the overflow spillway can pass 718 cfs for a total spillway capacity of 6,753 cfs.
5. Stability Analyses
The stability of the Little Falls Dam has been calculated at various times throughout the history of the dam. Dam improvements have improved the stability of certain portions of the dam. The dam consists of a gravity section which includes the 72 feet overflow spillway and Gates 2-4, a powerhouse section, a hollow gate section under the 22 feet gate (Gate 1), and an arch buttress section.
a. 1934 Stability Analysis
The arch buttress section was constructed in 1934. A stability analysis from 1934 computes forces and centroids for the arch buttress section; these forces and centroids are compared to the “Engineers Computations.” The “Engineers Computations” and drawing that are referred to in the 1934 analysis were not available to be reviewed. Factors of safety were not computed in the 1934 analysis. A maximum bearing pressure on a representative buttress pier between arch buttresses was computed to be 14,720 pounds per square foot.
Weir Flow
Design of Small Dams; US Department of Interior
C = 2.64 Brater and King, Handbook of Hydraulics, 6th Edition , Table 5-3
P/Ho = 0.5
P= 5.5 ft Top of Ogee Elev - Upstream Silt Elevation
Ho= 11.4 ft Pool Elevation - Top of Ogee
He = 11.4 ft ha + ho
ho = 11.4 Pool Elevation - Top of Ogee
ha = 0.56 ft q2/(2g(P+ho)
2)
q= 101.6 cfs C ho3/2
va= 6.0 ft/s q/(P-ho)
He/Hd = 1.0
Hd = 11.4 ft
L = L' - 2 (N Kp +Ka) He Effective Length of Gates
L = 32.59 ft
L1'= 41.15 Total Length of Spillway
L'= 37.15 ft Net Length of Crest
Pier Length= 4 ft
Length Per Pier= 2.0 ft
Number of Piers (N)= 2
Kp= 0.0 Design of Small Dams; US Department of Interior; Pg 368
Ka= 0.2 Design of Small Dams; US Department of Interior; Pg 368
Discharge Coefficient (Cs/Co) = 1 Design of Small Dams ; US Department of Interior; Figure 9-28
hd/He = 1.05
Q= 3312 cfs
Q = Co L He3/2
(Cs/Co)
15
b. 1979 Stability Analysis
A complete stability analysis was included in the Little Falls Dam, Willow River, St. Croix County, Wisconsin, Inventory No. WI053, National Dam Safety Program Inspection Report, USACE, September 1979. Warzyn Engineering Inc. performed the stability analysis that is included in the USACE report. Their analysis refers to Holland, Ackerman & Holland sheets that are not available. A factor of safety against sliding and overturning was computed. Bearing pressures were not computed.
Gates 2-4 and the overflow spillway section to the right of the powerhouse were found to have marginally adequate stability for overturning with hydrostatic pressure and silt loading. The overturning stability was less than adequate when ice forces were added. The sliding factors of safety for Gates 2-4 and the overflow spillway to the right of the powerhouse was found to have factors of safety that ranged from 2.5 to 5; less with ice loads. The stability of the arch buttress section met the 1979 criteria. The powerhouse stability was not analyzed, there are no scaled cross-sections available through the powerhouse, and no information about the decommissioning of the powerhouse is available. Stability issues in the gravity section were addressed with the addition of rock anchors in 1981, see 1984 Stability Analysis.
The dam is founded on sandstone bedrock. The sandstone was described as fine-grained, medium-bedded, relatively soft and poorly cemented. The report discusses a maximum bearing stress of 8 tons per square foot on the bedrock, which is within tolerable limits. The report recommends that additional investigations of the foundation stability be performed.
The report mentions that there may be seepage beneath the arch buttress section; this was mentioned because vortices had been observed by the owner upstream of the arch buttress section. A grout curtain in front of the arch buttress section was initially recommended in the 1980 Warzyn, Testing, Inspection, and Preliminary Design Report to prevent seepage and piping. This was later revised in the December 19, 1980 report to recommend area grouting could be performed to minimize the near surface seepage, but deep line grouting does not appear to be warranted since stability of the arch section appears satisfactory and reservoir levels can be maintained. It was recommended that the grouting be deferred. The area was graded, cleared, and geotextile fabric with stone ballast was installed as a filter in the 1981 rehab. Upstream vortices have not been reports in any inspections since 1981.
c. 1984 Stability Analysis
A stability analysis was performed on the overflow spillway in 1984 to analyze three loading conditions. This analysis takes into account the rock anchors that were installed in 1981. The three loading conditions analyzed are:
• Load Case 1 = 0.1PMF (16,200 cfs) + silt load • Load Case 2 = normal pool + silt load + ice load • Load Case 3 = 0.1PMF (16,200 cfs) + silt load without 30 feet of tailwater.
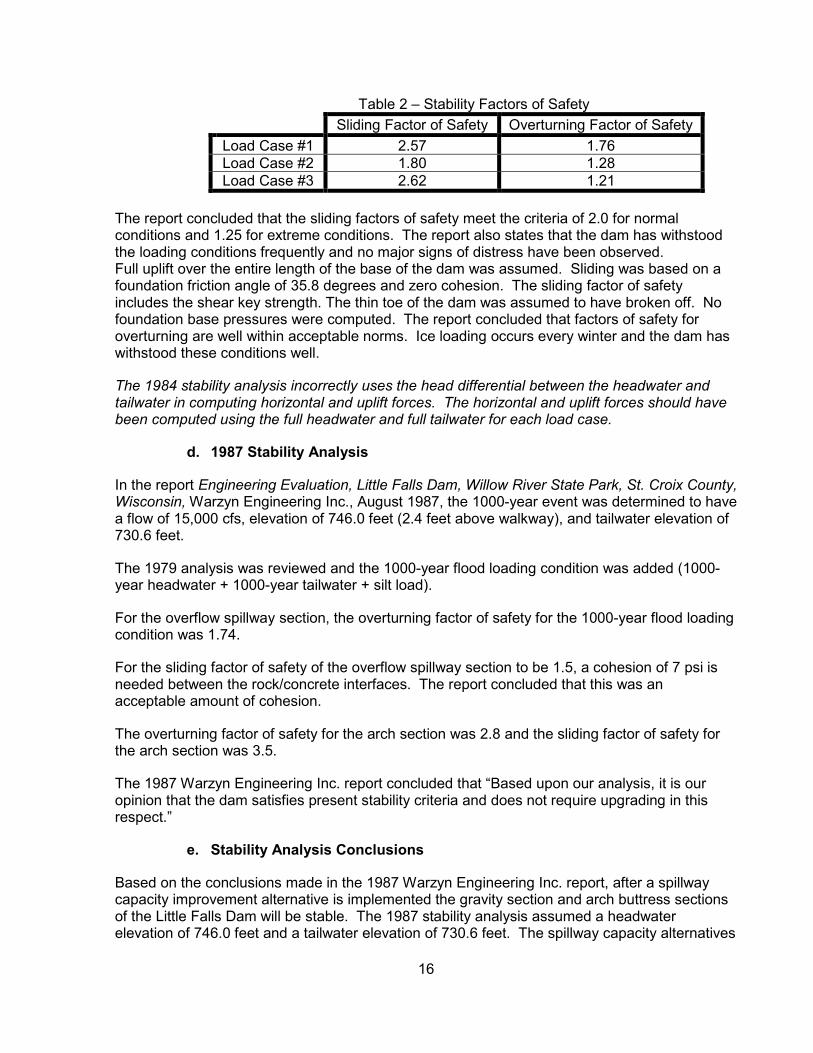
The factors of safety determined for each loading case is shown in Table 2:
16
Table 2 – Stability Factors of Safety
Sliding Factor of Safety Overturning Factor of Safety
Load Case #1 2.57 1.76 Load Case #2 1.80 1.28 Load Case #3 2.62 1.21
The report concluded that the sliding factors of safety meet the criteria of 2.0 for normal conditions and 1.25 for extreme conditions. The report also states that the dam has withstood the loading conditions frequently and no major signs of distress have been observed. Full uplift over the entire length of the base of the dam was assumed. Sliding was based on a foundation friction angle of 35.8 degrees and zero cohesion. The sliding factor of safety includes the shear key strength. The thin toe of the dam was assumed to have broken off. No foundation base pressures were computed. The report concluded that factors of safety for overturning are well within acceptable norms. Ice loading occurs every winter and the dam has withstood these conditions well.
The 1984 stability analysis incorrectly uses the head differential between the headwater and tailwater in computing horizontal and uplift forces. The horizontal and uplift forces should have been computed using the full headwater and full tailwater for each load case.
d. 1987 Stability Analysis
In the report Engineering Evaluation, Little Falls Dam, Willow River State Park, St. Croix County, Wisconsin, Warzyn Engineering Inc., August 1987, the 1000-year event was determined to have a flow of 15,000 cfs, elevation of 746.0 feet (2.4 feet above walkway), and tailwater elevation of 730.6 feet.
The 1979 analysis was reviewed and the 1000-year flood loading condition was added (1000-year headwater + 1000-year tailwater + silt load).
For the overflow spillway section, the overturning factor of safety for the 1000-year flood loading condition was 1.74.
For the sliding factor of safety of the overflow spillway section to be 1.5, a cohesion of 7 psi is needed between the rock/concrete interfaces. The report concluded that this was an acceptable amount of cohesion.
The overturning factor of safety for the arch section was 2.8 and the sliding factor of safety for the arch section was 3.5.
The 1987 Warzyn Engineering Inc. report concluded that “Based upon our analysis, it is our opinion that the dam satisfies present stability criteria and does not require upgrading in this respect.”
e. Stability Analysis Conclusions
Based on the conclusions made in the 1987 Warzyn Engineering Inc. report, after a spillway capacity improvement alternative is implemented the gravity section and arch buttress sections of the Little Falls Dam will be stable. The 1987 stability analysis assumed a headwater elevation of 746.0 feet and a tailwater elevation of 730.6 feet. The spillway capacity alternatives
17
are all designed to have a headwater elevation of 743.0 feet, to prevent overtopping. Using the 1979 tailwater rating curve the 1000-year flood flow of 16,700 cfs corresponds with a tailwater elevation of 731.0 feet. The spillway capacity improvement alternatives will allow any existing portions of the gravity section and the arch buttress section to continue to be stable by lowering the headwater by three feet and lowering the tailwater by only 0.4 feet. The stability and decommissioning of the powerhouse is unknown; further analysis to determine the stability and how the powerhouse was sealed should be determined. A formal stability analyses should be performed for all structures when the spillway capacity alternative has been determined. The stability analyses should include all applicable load cases to determine sliding factors of safety and foundation base pressures based on the new configuration.
6. Spillway Capacity Improvement Alternatives
Since the existing dam does not have sufficient capacity to pass the 1000-year flood event (16,700 cfs) without overtopping the walkway, Ayres Associates evaluated eight alternatives to improve the dam’s total spillway capacity. In the process of researching the dam history and multiple conversations with WDNR staff, the following five criteria were agreed upon as guidance to identify the goals that alternatives should accomplish. These criteria, in order of importance are:
1. Spillway Capacity – The dam must pass the 1000-year flow without overtopping and 100-year flow through the principle spillway.
2. Structural integrity –The powerhouse section and Gates 2-4 must be replaced because the dam’s history and present condition show there is a lack of structural integrity in those sections. It was also determined that the structural integrity of the overflow spillway is questionable; further analysis and testing is needed to determine its integrity and whether or not it can remain.
3. Maintain the current reservoir normal pool elevation. 4. Provide a cold water draw. 5. Dam should have little or no need for operation.
As summarized in the history section, the 1987 Warzyn Engineering, Inc. report evaluated three alternatives for spillway capacity improvements to the dam and recommended containment dikes to contain flood flows within the footprint of the dam. The recommended alternative was never constructed and is no longer viable because the 1000-year flow used in 1987 does not match the 2009 Flood Insurance Study flow. Also the arch buttress portion of the dam would overtop and this section was not designed by the engineers to have flood flows overtop it.
The present day alternatives derived in this feasibility study analysis are as follows, although the final locations, elevations, and dimensions of the alternatives may change during the final design process:
Alternative #1 – Replace the existing dam with a fixed crest labyrinth spillway.
Alternative #2 – Replace the existing dam with a fixed crest ogee spillway and embankment.
Alternative #3 – Replace the overflow spillway, Gates 2-4, and powerhouse with six crest gates.
Alternative #4 – Replace the overflow spillway, Gates 2-4, powerhouse, Gate 1, and a portion of the arch buttress section with a fixed crest spillway and two crest gates.
18
Alternative #5 – Replace the overflow spillway, Gates 2-4, powerhouse, Gate 1, and a portion of the arch buttress section with a fixed crest spillway and two tainter gates.
Alternative #6 – Replace Gates 2-4 and the powerhouse with a crest gate and two tainter gates.
Alternative #7 – Replace the existing dam with a lower fixed crest ogee spillway 2.5 feet below the normal pool elevation.
Alternative #8 – Remove the existing dam and restore the pre-dam river channel.
There are issues with constructability that will be relevant for all eight of the alternatives. Some things that will make construction difficult for every alternative are:
• Dewatering will be complex. It may require a cofferdam to span the entire channel with a diversion channel or staged construction. Staged construction would include activities such as utilizing sections of the existing dam to pass flows while other sections are re-constructed. As sections of the dam repairs are completed the cofferdam or diversion structure would be moved to route flows over the newly constructed section of the dam.
• It will require extensive demolition and dredging to remove the 1920 portion of the dam. • Construction access and dewatering will be difficult because there is no access from the
right bank of the reservoir. • Dewatering the dam will be difficult because it does not currently have capacity to pass a
10-year storm with all gates and spillways available.
a. Alternative #1 – Replace the existing dam with a fixed crest labyrinth spillway.
The entire existing dam would be removed. A new labyrinth spillway with eight cycles and 900 feet of crest length would be constructed in the location of the existing dam. The crest spillway would be located at an elevation to maintain the current normal pool elevation. The efficiency of the labyrinth is such that the 1000-year flood could be passed by the new structure without exceeding the current reservoir rim elevation. A five foot by five foot slide gate would be required, with this option, to provide a low level outlet capable of passing base flows at a drawn down reservoir elevation. This will be referred to as a lake drain in subsequent alternatives. A cold water draw would also be provided with this alternative.
The total flow through the dam if this alternative were to be selected would be 17,158 cfs. The hydraulic calculations for this alternative can be found in Appendix D. The opinion of estimated cost for this alternative is $9,800,000.
Advantages:
• Minimal excavation or dredging is required upstream of the structure footprint as silt is below proposed crest elevation.
• No changes to current lake elevation. • Completely removes the existing dam and eliminates any unknown stability concerns. • No gate operation required for flood flows. • Minimal maintenance (moving parts) and inspection requirements. • Unique layout could provide additional public interest. • Eliminates unnecessary downstream flooding which could be caused by gate or operator
error.
19
Disadvantages:
• Complex shape and large footprint results in significant cost from the volume of concrete necessary.
• High walls may further increase cost if rock anchors or large shear keys are required for stability. Cost may be higher than estimated due to unknown foundation conditions.
• Optimum wall height for labyrinth spillway is six to ten feet. The 30 foot high dam poses potential design and constructability issues.
• Public would no longer have access to overlook the dam beyond the left abutment unless additional measures are included to provide a public viewing area.
• Requires significant downstream rock excavation on the left side of the existing structure to accommodate wider overflow section.
• The bedrock depth and quality is inconsistent and relatively unknown. This alternative may require significant bedrock surface preparation (dental concrete, removal of poor quality rock, etc.) that could further inflate costs and alter design.
• No operation would mean less regular observation of the structure and reduced likelihood of noticing deficiencies.
b. Alternative #2 – Replace the existing dam with a fixed crest ogee spillway and embankment.
The entire existing dam would be removed. A new 300 foot long fixed crest spillway would span the entire channel in the location of the existing dam. The crest of the spillway would be located at an elevation to maintain the current normal pool elevation. To pass the 1000-year flood over this length of spillway, the reservoir would rise to elevation 746.6 feet. A flood at this elevation would overtop the current rim of the reservoir immediately to the left of the dam as well as upstream in the park user area, primarily at the beach. An embankment would need to be constructed to raise the rim elevation around the reservoir. Approximately 1500 feet of four foot tall embankment would be required in the low areas around the reservoir to keep flow over the primary spillway structure during a 1000-year event. Alternatively, a lined channel or flume could be constructed to serve as an auxiliary spillway allowing flow to route around the southeast side of the dam through the park during large events. A three foot tall embankment would still be required to pass a 100-year flow over the primary spillway. If a lined channel was constructed as a bypass to the primary spillway a concrete structure with a flume and energy dissipation would still be required due to the significant elevation drop at the re-entry point to the river downstream of the dam. A lake drain and cold water draw would be provided for this alternative.
The total flow through the dam if this alternative were to be selected would be 17,058 cfs. The hydraulic calculations for this alternative can be found in Appendix D. The opinion of estimated cost for this alternative is $7,600,000.
Advantages:
• Minimal excavation or dredging is required upstream of the structure footprint as silt is below proposed crest elevation.
• No changes to current lake elevation. • Completely removes the existing dam and eliminates any unknown stability concerns. • No gate operation required to pass flood flows. • Minimal maintenance and inspection requirements.
20
• Eliminates unnecessary downstream flooding which could be caused by gate or operator error.
Disadvantages:
• Cost may be higher than estimated due to unknown foundation conditions. • Raised pool elevation during peak of floods will flood areas that have historically not
flooded. This could result in minor flood damage to these open space use areas. • Requires an embankment in low areas around the project that may impact lake access
and visibility. Alternatively, constructing an auxiliary bypass channel and shorter embankment through the park for higher flood events would eliminate access to the primary spillway without construction of a bridge to the dam.
• Public would no longer have access to overlook the dam beyond the left abutment unless additional measures are included to provide a public viewing area.
• Requires significant downstream rock excavation on the left side of the existing structure to accommodate wider overflow section.
• The bedrock depth and quality is inconsistent and relatively unknown. This alternative may require significant rock surface preparation (dental concrete, removal of poor quality rock, etc.) that could further inflate costs and alter design.
• No operation would mean less regular observation of the structure and reduced likelihood of noticing deficiencies.
c. Alternative #3 – Replace the overflow spillway, Gates 2-4, and powerhouse with six crest gates.
The entire 1920 portion of the dam would be removed; this includes everything to the right of Gate 1 (powerhouse, Gates 2-4, and overflow spillway). Crest gates would be installed where the 1920 (older) portion of the dam is located. To obtain enough flow to pass a 1000-year flood event requires six crest gates, 22.0 feet wide by 10.6 feet tall. The top of the gates when closed would be 741.5 feet and the top of the gates while fully open (with flow over them) would be 730.9 feet. The top of the remaining tainter gate would be extended to a height such that water would no longer flow over the gate when closed. A lake drain and cold water draw would also be provided for this alternative.
The total flow through the dam if this alternative were to be selected would be 16,800 cfs. A plan view and cross-section can be found in Appendix B, and opinion of estimated cost can be found in Appendix C. The hydraulic calculations can be found in Appendix D. The opinion of estimated cost for this alternative is $6,100,000.
Advantages:
• Would remove the remnants of the old wooden crib the original concrete dam was built around.
• Lowest gate elevations are above or at current bottom of existing gates. Compared to alternatives with deeper gates, this will result in less potential dredging upstream or less potential sediment downstream by incision of deeper channel within pool.
• Crest gates are relatively simple to operate and are designed to allow water to flow over the top of them.
• There would be access to manually operate Gate 1 and the new crest gates. Access to the existing backup power connection and operation panel remains intact.
21
• Crest gates when only minimally open can pass smaller flows with less operation. More operation is needed to pass minimal flows with tainter gates because of the depth and amount of driving head.
• Crest gates can be left open slightly in the winter to continuously pass water which can reduce ice buildup.
Disadvantages:
• An access bridge on the dam would be needed to allow for maintenance or repairs of the crest gates.
• Public would no longer have access to the powerhouse overlook or the dam beyond Gate 1 unless additional measures are included to provide a public viewing area.
• Additional maintenance is needed for crest gates to maintain the hydraulic operating system.
• A hydraulic pump unit with fluid reservoir is required onsite. • Gate 1 and arch buttress remain and some past investigations (vortices upstream) have
indicated potential foundation issues.
d. Alternative #4 – Replace the overflow spillway, Gates 2-4, powerhouse, Gate 1, and a portion of the arch buttress section with a fixed crest spillway and two crest gates.
The existing overflow spillway, Gates 2-4, powerhouse, Gate 1, and a portion of the arch buttress section would be removed. A new 150 foot long fixed crest spillway would span from the right abutment. Two new 14 feet high by 37 feet wide hydraulic crest gates would be installed to the left of the new spillway. Portions of the left arch buttress section can remain in place with public access overlook areas. A lake drain and cold water draw would also be provided for this alternative.
The overflow spillway and crest gates in the raised (or closed) position would be capable of passing 2,800 cfs. The total flow through the dam if this alternative were to be selected would be 17,082 cfs. The hydraulic calculations for this alternative can be found in Appendix D. The opinion of estimated cost for this alternative is $7,600,000.
Advantages:
• Would remove the remnants of the old wooden crib the original concrete dam was built around.
• The majority of the dam that has had foundation concerns is removed. • Crest gates are relatively simple to operate and are designed to allow water to flow over
the top of them. • There would be access to manually operate the new crest gates and access to a backup
power connection/operation panel. • No operation is required for flood events under 2,800 cfs, a little over a 1-year flood
event. • Minimal upstream excavation or dredging required as silt is below proposed gate sill
elevation. • Crest gates when only minimally open can pass smaller flows with less operation. More
operation is needed to pass minimal flows with tainter gates because of the depth and amount of driving head.
22
• Crest gates can be left open slightly in the winter to continuously pass water which can reduce ice buildup.
Disadvantages:
• An access bridge on the dam would be needed to allow for maintenance or repairs of the crest gates.
• Public would no longer have access to the powerhouse overlook or the dam beyond the arch buttress section unless additional measures are included to provide a public viewing area.
• Additional maintenance is needed for crest gates to maintain the hydraulic operating system.
• A hydraulic pump unit with fluid reservoir is required onsite.
e. Alternative #5 – Replace the overflow spillway, Gates 2-4, powerhouse, Gate 1, and a portion of the arch buttress section with a fixed crest spillway and two tainter gates.
The existing overflow spillway, Gates 2-4, powerhouse, Gate 1, and a portion of the arch buttress section would be removed. A new 150 foot long fixed crest spillway would span from the right abutment. Two new 25.0 feet high by 25.0 feet wide tainter gates would be installed to the left of the new spillway. The sills of the new gates would be at 718.0-feet, 10.6 feet lower than existing Gate 1 sill. Portions of the left arch buttress section can remain in place with public access overlook areas. A lake drain and cold water draw would also be provided for this alternative.
The spillway capacity with the tainter gates closed is 1940 cfs. The total flow through the dam if this alternative were to be selected would be 16,974 cfs. The hydraulic calculations for this alternative can be found in Appendix D. The opinion of estimated cost for this alternative is $7,000,000.
Advantages:
• Would remove the remnants of the old wooden crib the original concrete dam was built around.
• There would be access to manually operate the new tainter gates and access to a backup power connection/operation panel.
• No operation is required for flood events under 1,900 cfs, approximately a 1-year flood event.
• The majority of the dam that has had foundation concerns is removed.
Disadvantages:
• An access bridge on the dam would be needed to allow for maintenance or repairs of the crest gates.
• Public would no longer have access to the powerhouse or the dam beyond the arch buttress section unless additional measures are included to provide a public viewing area.
• Tainter gates will require regular inspection, maintenance, and exercise.
23
• The tainter gates would need to be designed to withstand ice loading or a deicing system would need to be installed.
• The new tainter gates have significantly lower sill elevations (718.0) than existing tainter Gate 1 (728.6). This lower sill elevation could result in incision of new channel in the upstream pool (flood waters are flowing through the dam at a lower elevation) which would result in possible additional siltation in the downstream river.
f. Alternative #6 – Replace Gates 2-4 and the powerhouse with a crest gate and two tainter gates.
The powerhouse and Gates 2-4 would be removed. A crest gate and two tainter gates would be installed where the powerhouse and Gates 2-4 used to be. To obtain enough flow to pass a 1000-year flood event requires one crest gate 22.0 feet wide by 9.0 feet tall and two tainter gates 22.0 feet wide and 23.0 feet tall. The top of the crest gate when closed would be 741.6 feet and the top of the crest gate while fully open would be 732.6 feet. The sill for the new tainter gates is 722.0 feet, 6.6 feet lower than existing Gate 1. The top of the remaining tainter gate would be extended to a height such that water would no longer flow over the gate when closed. A lake drain and cold water draw would also be provided for this alternative.
The overflow spillway and crest gates in the raised (or closed) position would be capable of passing 970 cfs (less than a 1-year event). The total flow through the Little Falls Dam if this alternative were to be selected would be 16, 914 cfs. A plan view and cross-section can be found in Appendix B and opinion of estimated cost can be found in Appendix C. The hydraulic calculations can be found in Appendix D. During the final design the gate widths and depths may be modified to have uniform gate widths for dewatering purposes. The opinion of estimated cost for this alternative is $5,000,000.
Advantages:
• Crest gates are relatively simple to operate and are designed to allow water to flow over the top of them.
• There would be access to manually operate Gate 1 and the new gates. Access to the existing backup power connection and operation panel remains intact.
• Crest gates when minimally open can pass smaller flows with less operation. • Crest gates can be left open slightly in the winter to continuously pass water which can
reduce ice buildup.
Disadvantages:
• An access bridge would be needed to allow for maintenance or repairs of the gates. • Public would no longer have access to the powerhouse overlook or the dam beyond
Gate 1 unless additional measures are included to provide a public viewing area. • Foundation under Gate 1 and arch buttress is not improved • Additional maintenance is needed for crest gates to maintain the hydraulic operating
system. • A hydraulic pump unit with fluid reservoir is required onsite. • The gates would need to be designed to withstand ice loading or a deicing system would
need to be installed. • The new tainter gates have significantly lower sill elevations (720.0) than existing tainter
Gate 1 (728.6). This lower sill elevation could result in incision of new channel in the
24
upstream pool (flood waters are flowing through the dam at a lower elevation) which would result in possible additional siltation in the downstream river.
g. Alternative #7 – Replace the existing dam with a lower fixed crest ogee spillway 2.5 feet below the normal pool elevation.
The entire existing dam would be removed. A new 300 foot long fixed crest spillway would span the entire channel in the location of the existing dam. The spillway crest elevation would be lowered such that the 1000-year flood could be passed by the new structure without exceeding the current reservoir rim elevation. Normal pool would be lowered by approximately 2.6 feet from the current elevation. A lake drain and cold water draw would be provided for this alternative.
The total flow through the Little Falls Dam if this alternative were to be selected would be 17,058 cfs. The hydraulic calculations for this alternative can be found in Appendix D. The opinion of estimated cost for this alternative is $6,500,000.
Advantages:
• Minimal excavation or dredging is required upstream of the structure footprint as silt is below proposed crest elevation.
• This alternative completely removes the existing dam and eliminates any unknown stability concerns.
• No gate operation required for flood flows. • Minimal maintenance and inspection requirements. • Eliminates unnecessary downstream flooding which could be caused by gate or operator
error.
Disadvantages:
• This alternative lowers the current normal pool elevation by 2.6 feet impacting lake and shoreline use. A significant area of upstream pooled would no longer be lake. This alternatives does not meet Criteria 3, but was left in because Criteria 3 is lower on order of importance.
• Public would no longer have access to overlook the dam beyond the left abutment unless additional measures are included to provide a public viewing area.
• The bedrock depth and quality is inconsistent and relatively unknown. This alternative may require significant rock surface preparation (dental concrete, removal of poor quality rock, etc.) that could further inflate costs and alter design.
• Requires significant downstream rock excavation on the left side of the existing structure to accommodate wider overflow section.
• No operation would mean less regular observation of the structure and reduced likelihood of noticing deficiencies.
h. Alternative #8 – Removing the existing dam and restoring the pre-dam river channel.
This alternative is complete dam removal and the river channel is restored to natural conditions. While the alternative does not fit the criteria established for spillway alternatives, it should be an alternative considered for a complete and thorough dam rehabilitation discussion. The cost of complete dam removal is estimated to be $600,000. This cost only accounts for the immediate
25
direct costs of the structural removal of the dam. Significant additional costs would likely be incurred for sediment control, stream bank development, and stabilization upstream of the dam in the years following dam removal. A detailed study would be required to fully understand the impact and costs of a dam removal. The estimated cost for two miles of stream restoration upstream of the dam could range from $1,000,000 to $4,000,000 in addition to the dam removal costs.
Advantages:
• No long term maintenance or inspection • Lowest immediate cost option
Disadvantages:
• Potential for significant additional costs in future sediment management, bank stabilization, and stream bank development.
• Could cause short degradation of downstream river habitat by release of sediment. • Could cause long term siltation of downstream lake. • Lake will be gone as a public attraction and source of revenue.
i. Additional Alternatives Considered
Through this process a number of alternatives were considered but rejected. These are not included in the eight alternatives that were given further consideration. These alternatives generally considered repairs or modifications to the existing overflow, Gates 2 to 4 and powerhouse. The structural criteria set was that the powerhouse section and Gates 2-4 must be replaced. It also determined that the overflow spillway is questionable. As the foundation of these sections is likely compromised, they were not considered further because they did not meet Criteria 2, structural integrity of dam.
7. Discussion of Drawdown
The base flow for the Willow River at the Little Falls Dam is between 100 and 200 cfs. This information is based on the flow data available from USGS Gage 05341753 Willow River @ Willow River State Park NR Burkhardt, WI see Figure 2. Note that 2012 was a draught year and we did not include that in our estimate of base flow.
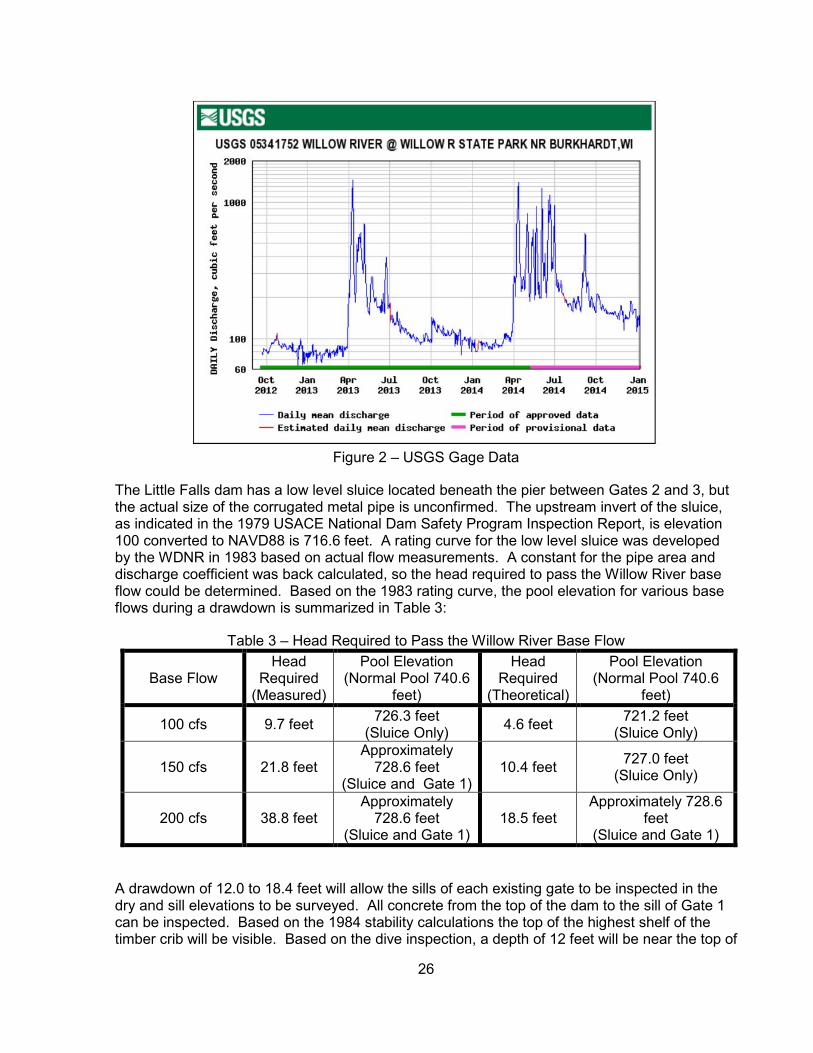
26
Figure 2 – USGS Gage Data
The Little Falls dam has a low level sluice located beneath the pier between Gates 2 and 3, but the actual size of the corrugated metal pipe is unconfirmed. The upstream invert of the sluice, as indicated in the 1979 USACE National Dam Safety Program Inspection Report, is elevation 100 converted to NAVD88 is 716.6 feet. A rating curve for the low level sluice was developed by the WDNR in 1983 based on actual flow measurements. A constant for the pipe area and discharge coefficient was back calculated, so the head required to pass the Willow River base flow could be determined. Based on the 1983 rating curve, the pool elevation for various base flows during a drawdown is summarized in Table 3:
Table 3 – Head Required to Pass the Willow River Base Flow
Base Flow Head
Required (Measured)
Pool Elevation (Normal Pool 740.6
feet)
Head Required
(Theoretical)
Pool Elevation (Normal Pool 740.6
feet)
100 cfs 9.7 feet 726.3 feet
(Sluice Only) 4.6 feet
721.2 feet (Sluice Only)
150 cfs 21.8 feet Approximately
728.6 feet (Sluice and Gate 1)
10.4 feet 727.0 feet
(Sluice Only)
200 cfs 38.8 feet Approximately
728.6 feet (Sluice and Gate 1)
18.5 feet Approximately 728.6
feet (Sluice and Gate 1)
A drawdown of 12.0 to 18.4 feet will allow the sills of each existing gate to be inspected in the dry and sill elevations to be surveyed. All concrete from the top of the dam to the sill of Gate 1 can be inspected. Based on the 1984 stability calculations the top of the highest shelf of the timber crib will be visible. Based on the dive inspection, a depth of 12 feet will be near the top of
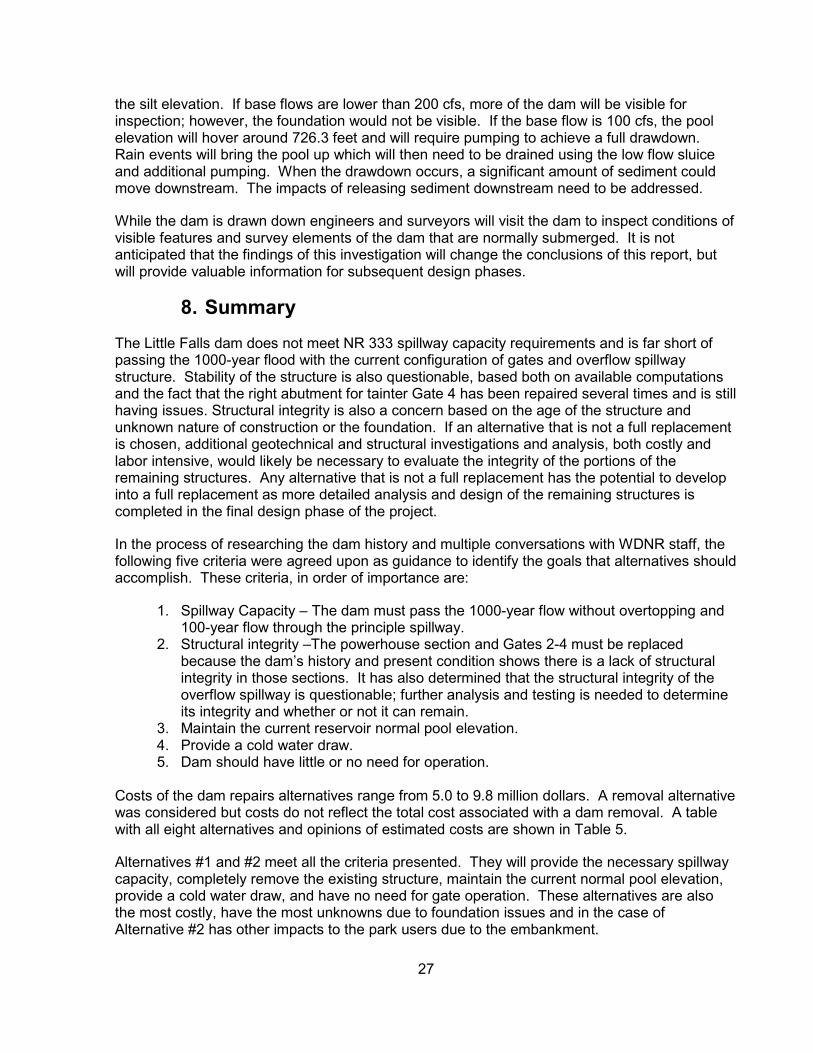
27
the silt elevation. If base flows are lower than 200 cfs, more of the dam will be visible for inspection; however, the foundation would not be visible. If the base flow is 100 cfs, the pool elevation will hover around 726.3 feet and will require pumping to achieve a full drawdown. Rain events will bring the pool up which will then need to be drained using the low flow sluice and additional pumping. When the drawdown occurs, a significant amount of sediment could move downstream. The impacts of releasing sediment downstream need to be addressed.
While the dam is drawn down engineers and surveyors will visit the dam to inspect conditions of visible features and survey elements of the dam that are normally submerged. It is not anticipated that the findings of this investigation will change the conclusions of this report, but will provide valuable information for subsequent design phases.
8. Summary
The Little Falls dam does not meet NR 333 spillway capacity requirements and is far short of passing the 1000-year flood with the current configuration of gates and overflow spillway structure. Stability of the structure is also questionable, based both on available computations and the fact that the right abutment for tainter Gate 4 has been repaired several times and is still having issues. Structural integrity is also a concern based on the age of the structure and unknown nature of construction or the foundation. If an alternative that is not a full replacement is chosen, additional geotechnical and structural investigations and analysis, both costly and labor intensive, would likely be necessary to evaluate the integrity of the portions of the remaining structures. Any alternative that is not a full replacement has the potential to develop into a full replacement as more detailed analysis and design of the remaining structures is completed in the final design phase of the project.
In the process of researching the dam history and multiple conversations with WDNR staff, the following five criteria were agreed upon as guidance to identify the goals that alternatives should accomplish. These criteria, in order of importance are:
1. Spillway Capacity – The dam must pass the 1000-year flow without overtopping and 100-year flow through the principle spillway.
2. Structural integrity –The powerhouse section and Gates 2-4 must be replaced because the dam’s history and present condition shows there is a lack of structural integrity in those sections. It has also determined that the structural integrity of the overflow spillway is questionable; further analysis and testing is needed to determine its integrity and whether or not it can remain.
3. Maintain the current reservoir normal pool elevation. 4. Provide a cold water draw. 5. Dam should have little or no need for operation.
Costs of the dam repairs alternatives range from 5.0 to 9.8 million dollars. A removal alternative was considered but costs do not reflect the total cost associated with a dam removal. A table with all eight alternatives and opinions of estimated costs are shown in Table 5.
Alternatives #1 and #2 meet all the criteria presented. They will provide the necessary spillway capacity, completely remove the existing structure, maintain the current normal pool elevation, provide a cold water draw, and have no need for gate operation. These alternatives are also the most costly, have the most unknowns due to foundation issues and in the case of Alternative #2 has other impacts to the park users due to the embankment.

28
Alternatives #3, #4, and #5 address the majority of the issues with the dam. They address the spillway capacity, the potential instability, foundation, and structural integrity issues associated with the overflow spillway, powerhouse, and the smaller tainter gate section (Gates 2-4), maintain the current reservoir normal pool elevation, and provide a cold water draw. All three alternatives keep the current arch buttress section and Alternative #3 keeps Gate 1. All sections of the existing dam that are not removed need further investigation during the final design phase to confirm their structural integrity. If the structural integrity of the existing portions of the dam are compromised, removal of those sections may be warranted. All three alternatives require gate operation during high flow events.
Alternative #6 addresses the spillway capacity, the instability issues associated with the powerhouse and Gates 2-4, maintains the current reservoir normal pool elevation, and provides a cold water draw. Alternative #6 keeps the existing overflow spillway, Gate 1, and the arch buttress section; these portions of the dam need further investigation during the final design phase to confirm their structural integrity. Additional stabilization or removal may be needed depending on the findings. Gate operation is required for during high flow events.
Alternative #7 addresses the spillway capacity, structural integrity, provides a cold water draw, and does not need gate operation. This alternative lowers the normal pool by 2.6 feet by having a lower fixed crest weir and will significantly impact lake users.
The constructability of each alternative needs to be considered. None of the alternatives will be easy to construct and will likely require a partial or full drawdown of the impoundment. If this drawdown occurs, a significant amount of sediment could move downstream. The impacts of releasing sediment downstream need to be addressed and additional measures will be required to prevent this.
A complete stability analyses for applicable load cases must be performed for the chosen alternative for all structures. This will require additional investigations to determine bedrock concrete interface and bedrock/foundation quality. The stability analyses must determine the sliding factors of safety and foundation base pressures based on the new configuration. If portions of the existing dam are to be utilized the stability analyses of those structures must be updated to reflect the proper analyses and the applicable loading conditions.
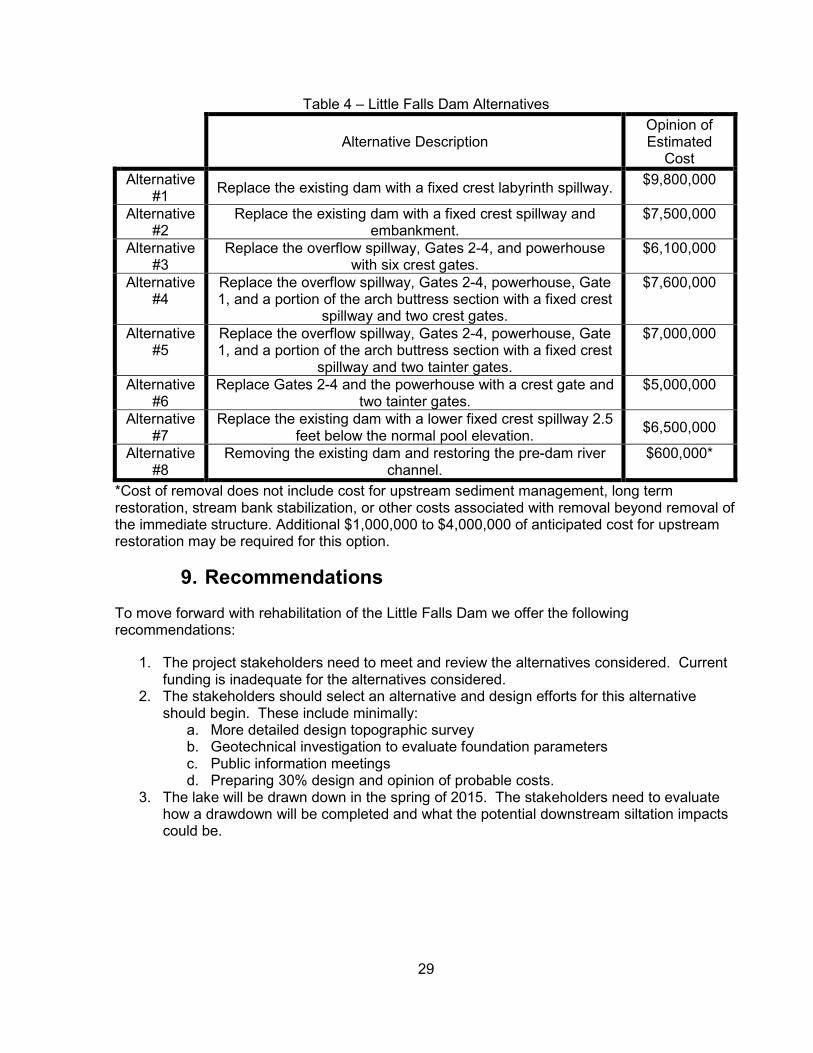
29
Table 4 – Little Falls Dam Alternatives
Alternative Description
Opinion of Estimated
Cost
Alternative #1
Replace the existing dam with a fixed crest labyrinth spillway. $9,800,000
Alternative #2
Replace the existing dam with a fixed crest spillway and embankment.
$7,500,000
Alternative #3
Replace the overflow spillway, Gates 2-4, and powerhouse with six crest gates.
$6,100,000
Alternative #4
Replace the overflow spillway, Gates 2-4, powerhouse, Gate 1, and a portion of the arch buttress section with a fixed crest
spillway and two crest gates.
$7,600,000
Alternative #5
Replace the overflow spillway, Gates 2-4, powerhouse, Gate 1, and a portion of the arch buttress section with a fixed crest
spillway and two tainter gates.
$7,000,000
Alternative #6
Replace Gates 2-4 and the powerhouse with a crest gate and two tainter gates.
$5,000,000
Alternative #7
Replace the existing dam with a lower fixed crest spillway 2.5 feet below the normal pool elevation.
$6,500,000
Alternative #8
Removing the existing dam and restoring the pre-dam river channel.
$600,000*
*Cost of removal does not include cost for upstream sediment management, long term restoration, stream bank stabilization, or other costs associated with removal beyond removal of the immediate structure. Additional $1,000,000 to $4,000,000 of anticipated cost for upstream restoration may be required for this option.
9. Recommendations
To move forward with rehabilitation of the Little Falls Dam we offer the following recommendations:
1. The project stakeholders need to meet and review the alternatives considered. Current funding is inadequate for the alternatives considered.
2. The stakeholders should select an alternative and design efforts for this alternative should begin. These include minimally:
a. More detailed design topographic survey b. Geotechnical investigation to evaluate foundation parameters c. Public information meetings d. Preparing 30% design and opinion of probable costs.
3. The lake will be drawn down in the spring of 2015. The stakeholders need to evaluate how a drawdown will be completed and what the potential downstream siltation impacts could be.
Appendix A
Existing Conditions
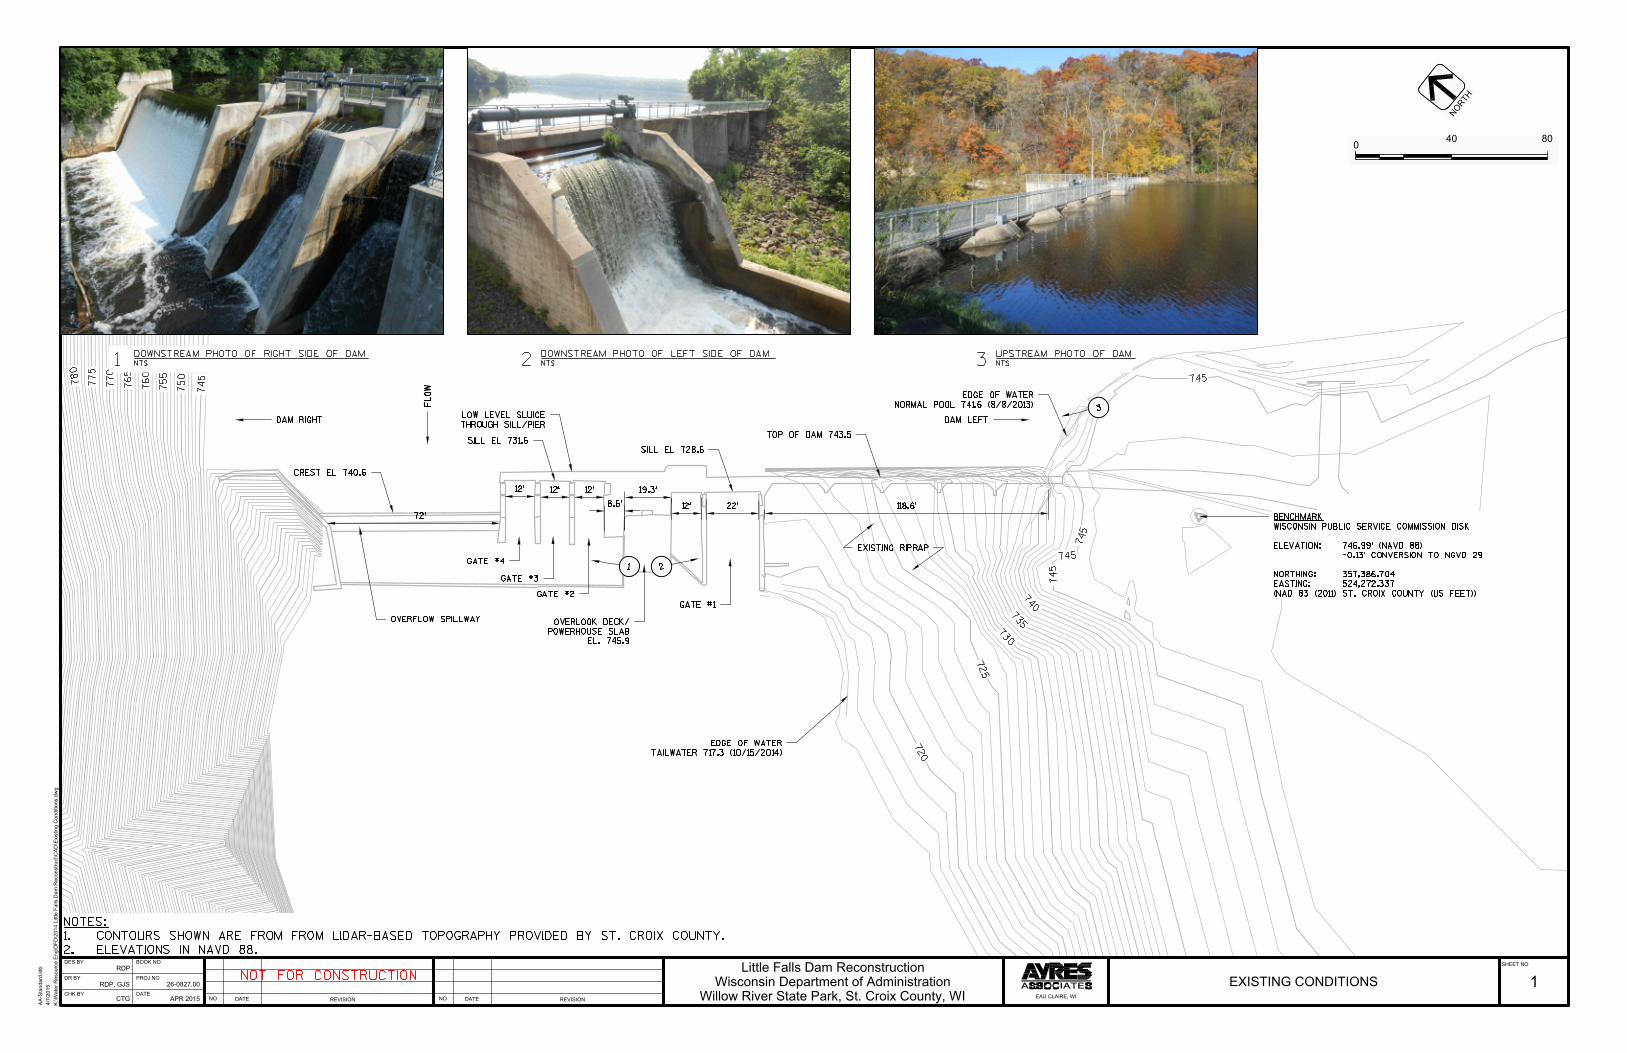
040 80
REVISIONDATEREVISIONDATEDATE
BOOK NO
PROJ NO
DES BY
DR BY
CHK BY
SHEET NO
NO NO
4/7
/2015
K:\
Wate
r R
esourc
e E
ng\D
FD
\2014 L
ittle F
alls
Dam
Reconstr
uct\
CA
D\E
xis
ting C
onditio
ns.d
wg
AA
-Sta
ndard
.stb
26-0827.00
Little Falls Dam Reconstruction
Willow River State Park, St. Croix County, WI
RDP
RDP, GJS
CTG
1EXISTING CONDITIONSAPR 2015 EAU CLAIRE, WI
Wisconsin Department of Administration
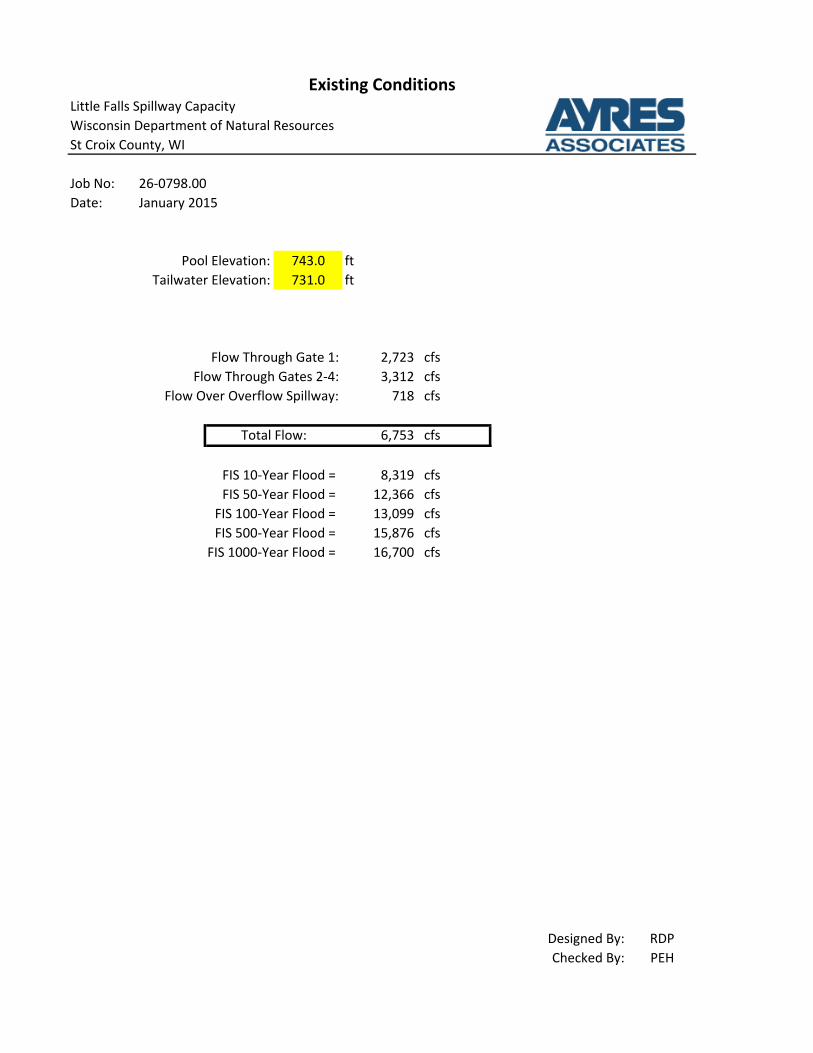
Job No: 26-0798.00
Date: January 2015
Pool Elevation: 743.0 ft
Tailwater Elevation: 731.0 ft
Flow Through Gate 1: 2,723 cfs
Flow Through Gates 2-4: 3,312 cfs
Flow Over Overflow Spillway: 718 cfs
6,753 cfs
FIS 10-Year Flood = 8,319 cfs
FIS 50-Year Flood = 12,366 cfs
FIS 100-Year Flood = 13,099 cfs
FIS 500-Year Flood = 15,876 cfs
FIS 1000-Year Flood = 16,700 cfs
Designed By: RDP
Checked By: PEH
Little Falls Spillway Capacity
Wisconsin Department of Natural Resources
St Croix County, WI
Existing Conditions
Total Flow:
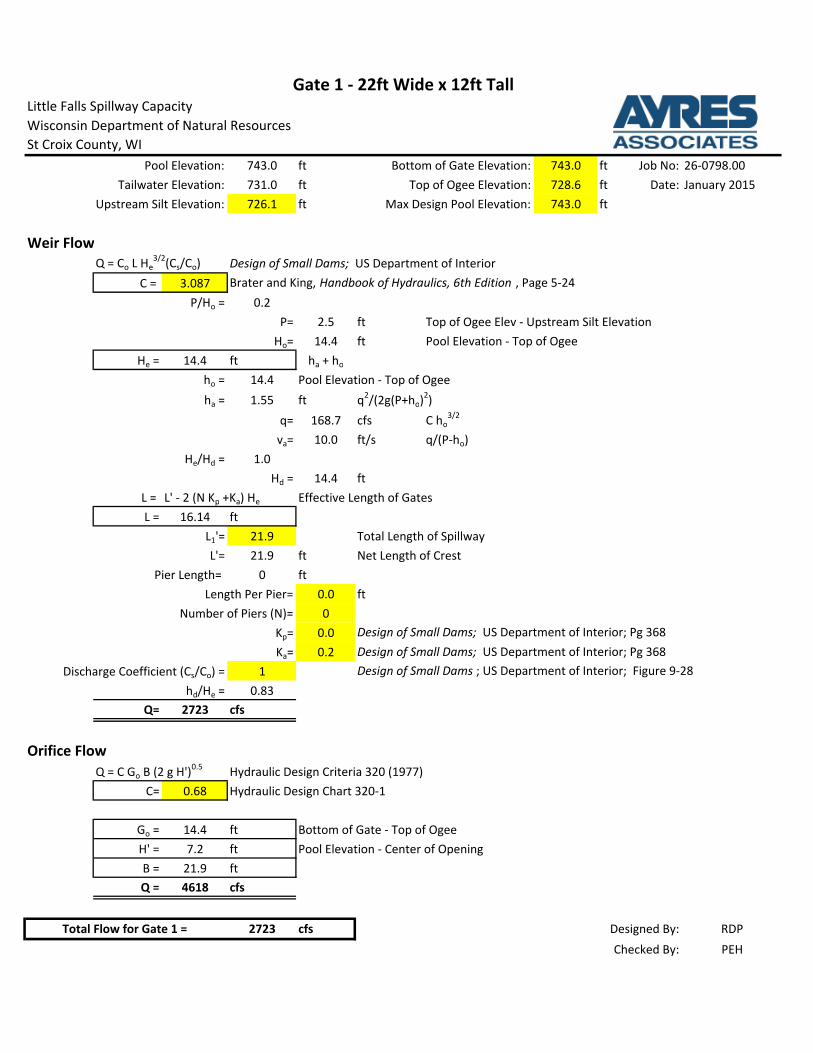
Pool Elevation: 743.0 ft Bottom of Gate Elevation: 743.0 ft Job No: 26-0798.00
Tailwater Elevation: 731.0 ft Top of Ogee Elevation: 728.6 ft Date: January 2015
Upstream Silt Elevation: 726.1 ft Max Design Pool Elevation: 743.0 ft
Weir Flow
Design of Small Dams; US Department of Interior
C = 3.087 Brater and King, Handbook of Hydraulics, 6th Edition , Page 5-24
P/Ho = 0.2
P= 2.5 ft Top of Ogee Elev - Upstream Silt Elevation
Ho= 14.4 ft Pool Elevation - Top of Ogee
He = 14.4 ft ha + ho
ho = 14.4 Pool Elevation - Top of Ogee
ha = 1.55 ft q2/(2g(P+ho)
2)
q= 168.7 cfs C ho3/2
va= 10.0 ft/s q/(P-ho)
He/Hd = 1.0
Hd = 14.4 ft
L = L' - 2 (N Kp +Ka) He Effective Length of Gates
L = 16.14 ft
L1'= 21.9 Total Length of Spillway
L'= 21.9 ft Net Length of Crest
Pier Length= 0 ft
Length Per Pier= 0.0 ft
Number of Piers (N)= 0
Kp= 0.0 Design of Small Dams; US Department of Interior; Pg 368
Ka= 0.2 Design of Small Dams; US Department of Interior; Pg 368
Discharge Coefficient (Cs/Co) = 1 Design of Small Dams ; US Department of Interior; Figure 9-28
hd/He = 0.83
Q= 2723 cfs
Orifice Flow
Q = C Go B (2 g H')0.5
Hydraulic Design Criteria 320 (1977)
C= 0.68 Hydraulic Design Chart 320-1
Go = 14.4 ft Bottom of Gate - Top of Ogee
H' = 7.2 ft Pool Elevation - Center of Opening
B = 21.9 ft
Q = 4618 cfs
2723 cfs Designed By: RDP
Checked By: PEH
Total Flow for Gate 1 =
Gate 1 - 22ft Wide x 12ft Tall
Little Falls Spillway Capacity
Wisconsin Department of Natural Resources
St Croix County, WI
Q = Co L He3/2
(Cs/Co)

Pool Elevation: 743.0 ft Bottom of Gate Elevation: 743.0 ft Job No: 26-0798.00
Tailwater Elevation: 731.0 ft Top of Ogee Elevation: 731.6 ft Date: January 2015
Upstream Silt Elevation: 726.1 ft Max Design Pool Elevation: 743.0 ft
Weir Flow
Design of Small Dams; US Department of Interior
C = 2.64 Brater and King, Handbook of Hydraulics, 6th Edition , Table 5-3
P/Ho = 0.5
P= 5.5 ft Top of Ogee Elev - Upstream Silt Elevation
Ho= 11.4 ft Pool Elevation - Top of Ogee
He = 11.4 ft ha + ho
ho = 11.4 Pool Elevation - Top of Ogee
ha = 0.56 ft q2/(2g(P+ho)
2)
q= 101.6 cfs C ho3/2
va= 6.0 ft/s q/(P-ho)
He/Hd = 1.0
Hd = 11.4 ft
L = L' - 2 (N Kp +Ka) He Effective Length of Gates
L = 32.59 ft
L1'= 41.15 Total Length of Spillway
L'= 37.15 ft Net Length of Crest
Pier Length= 4 ft
Length Per Pier= 2.0 ft
Number of Piers (N)= 2
Kp= 0.0 Design of Small Dams; US Department of Interior; Pg 368
Ka= 0.2 Design of Small Dams; US Department of Interior; Pg 368
Discharge Coefficient (Cs/Co) = 1 Design of Small Dams ; US Department of Interior; Figure 9-28
hd/He = 1.05
Q= 3312 cfs
Orifice Flow
Q = C Go B (2 g H')0.5
Hydraulic Design Criteria 320 (1977)
C= 0.68 Hydraulic Design Chart 320-1
Go = 11.4 ft Bottom of Gate - Top of Ogee
H' = 5.7 ft Pool Elevation - Center of Opening
B = 37.15 ft Net Length of Crest
Q = 5518 cfs
3312 cfs Designed By: RDP
Checked By: PEH
Gates 2-4 - 12ft Wide x 9ft Tall
Total Flow for Gates 2-4 =
Little Falls Spillway Capacity
Wisconsin Department of Natural Resources
St Croix County, WI
Q = Co L He3/2
(Cs/Co)
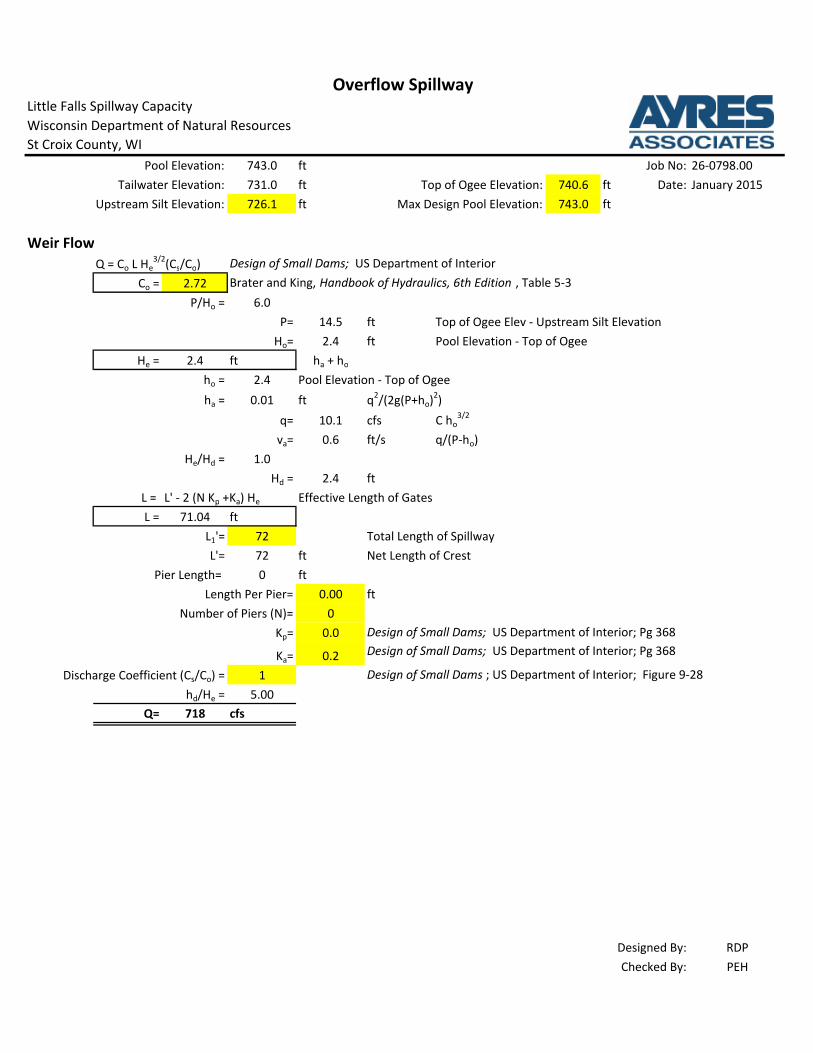
Pool Elevation: 743.0 ft Job No: 26-0798.00
Tailwater Elevation: 731.0 ft Top of Ogee Elevation: 740.6 ft Date: January 2015
Upstream Silt Elevation: 726.1 ft Max Design Pool Elevation: 743.0 ft
Weir Flow
Q = Co L He3/2
(Cs/Co) Design of Small Dams; US Department of Interior
Co = 2.72 Brater and King, Handbook of Hydraulics, 6th Edition , Table 5-3
P/Ho = 6.0
P= 14.5 ft Top of Ogee Elev - Upstream Silt Elevation
Ho= 2.4 ft Pool Elevation - Top of Ogee
He = 2.4 ft ha + ho
ho = 2.4 Pool Elevation - Top of Ogee
ha = 0.01 ft q2/(2g(P+ho)
2)
q= 10.1 cfs C ho3/2
va= 0.6 ft/s q/(P-ho)
He/Hd = 1.0
Hd = 2.4 ft
L = L' - 2 (N Kp +Ka) He Effective Length of Gates
L = 71.04 ft
L1'= 72 Total Length of Spillway
L'= 72 ft Net Length of Crest
Pier Length= 0 ft
Length Per Pier= 0.00 ft
Number of Piers (N)= 0
Kp= 0.0 Design of Small Dams; US Department of Interior; Pg 368
Ka= 0.2 Design of Small Dams; US Department of Interior; Pg 368
Discharge Coefficient (Cs/Co) = 1 Design of Small Dams ; US Department of Interior; Figure 9-28
hd/He = 5.00
Q= 718 cfs
Designed By: RDP
Checked By: PEH
Overflow Spillway
Little Falls Spillway Capacity
Wisconsin Department of Natural Resources
St Croix County, WI
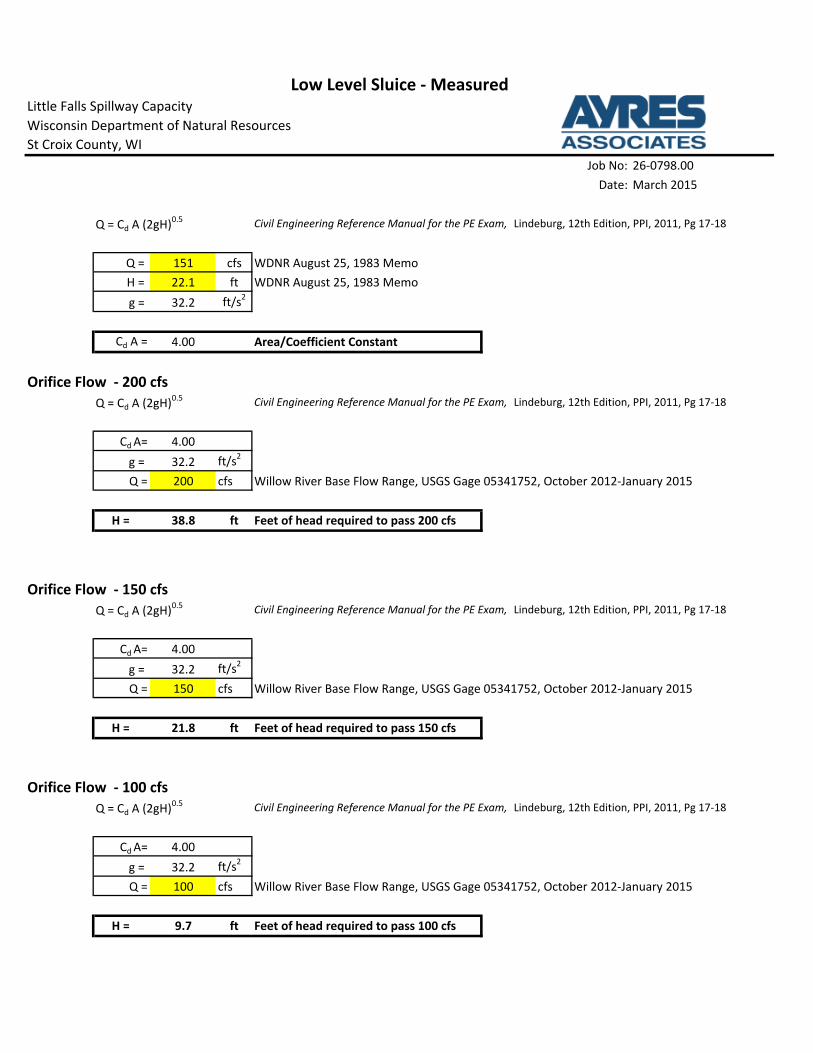
Job No: 26-0798.00
Date: March 2015
Q = Cd A (2gH)0.5
Civil Engineering Reference Manual for the PE Exam, Lindeburg, 12th Edition, PPI, 2011, Pg 17-18
Q = 151 cfs WDNR August 25, 1983 Memo
H = 22.1 ft WDNR August 25, 1983 Memo
g = 32.2 ft/s2
Cd A = 4.00 Area/Coefficient Constant
Orifice Flow - 200 cfs
Q = Cd A (2gH)0.5
Civil Engineering Reference Manual for the PE Exam, Lindeburg, 12th Edition, PPI, 2011, Pg 17-18
Cd A= 4.00
g = 32.2 ft/s2
Q = 200 cfs Willow River Base Flow Range, USGS Gage 05341752, October 2012-January 2015
H = 38.8 ft Feet of head required to pass 200 cfs
Orifice Flow - 150 cfs
Q = Cd A (2gH)0.5
Civil Engineering Reference Manual for the PE Exam, Lindeburg, 12th Edition, PPI, 2011, Pg 17-18
Cd A= 4.00
g = 32.2 ft/s2
Q = 150 cfs Willow River Base Flow Range, USGS Gage 05341752, October 2012-January 2015
H = 21.8 ft Feet of head required to pass 150 cfs
Orifice Flow - 100 cfs
Q = Cd A (2gH)0.5
Civil Engineering Reference Manual for the PE Exam, Lindeburg, 12th Edition, PPI, 2011, Pg 17-18
Cd A= 4.00
g = 32.2 ft/s2
Q = 100 cfs Willow River Base Flow Range, USGS Gage 05341752, October 2012-January 2015
H = 9.7 ft Feet of head required to pass 100 cfs
Low Level Sluice - MeasuredLittle Falls Spillway Capacity
Wisconsin Department of Natural Resources
St Croix County, WI
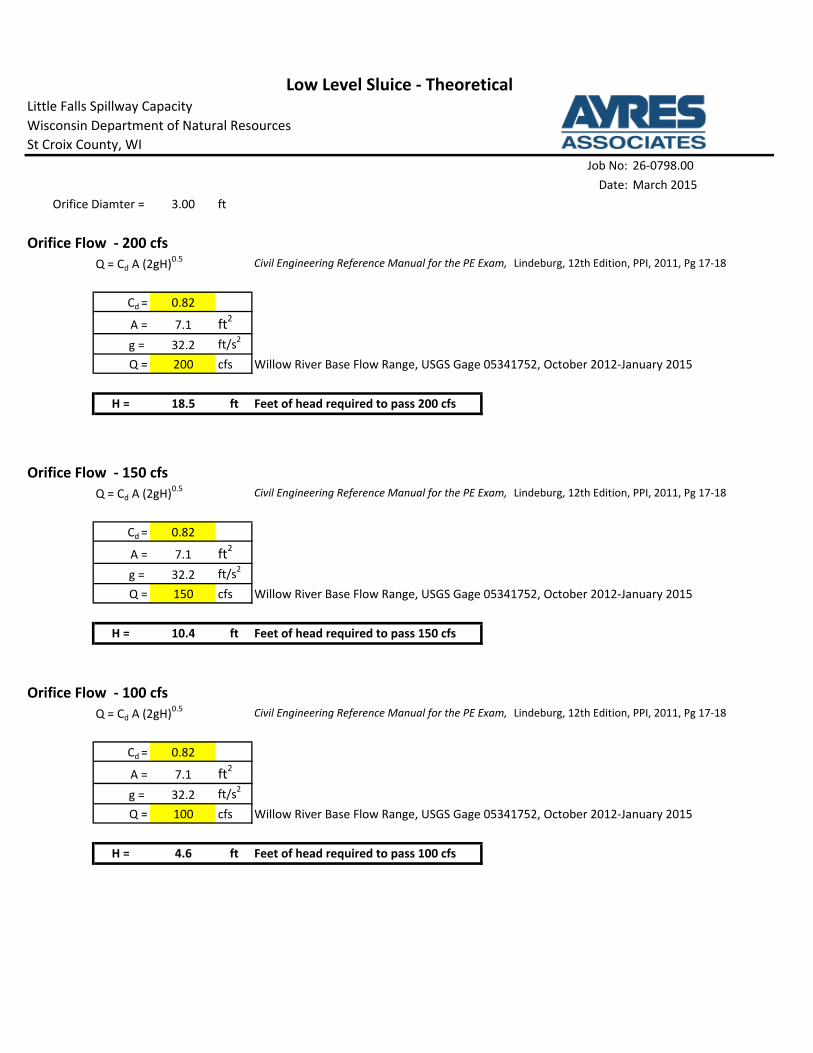
Job No: 26-0798.00
Date: March 2015
Orifice Diamter = 3.00 ft
Orifice Flow - 200 cfs
Q = Cd A (2gH)0.5
Civil Engineering Reference Manual for the PE Exam, Lindeburg, 12th Edition, PPI, 2011, Pg 17-18
Cd = 0.82
A = 7.1 ft2
g = 32.2 ft/s2
Q = 200 cfs Willow River Base Flow Range, USGS Gage 05341752, October 2012-January 2015
H = 18.5 ft Feet of head required to pass 200 cfs
Orifice Flow - 150 cfs
Q = Cd A (2gH)0.5
Civil Engineering Reference Manual for the PE Exam, Lindeburg, 12th Edition, PPI, 2011, Pg 17-18
Cd = 0.82
A = 7.1 ft2
g = 32.2 ft/s2
Q = 150 cfs Willow River Base Flow Range, USGS Gage 05341752, October 2012-January 2015
H = 10.4 ft Feet of head required to pass 150 cfs
Orifice Flow - 100 cfs
Q = Cd A (2gH)0.5
Civil Engineering Reference Manual for the PE Exam, Lindeburg, 12th Edition, PPI, 2011, Pg 17-18
Cd = 0.82
A = 7.1 ft2
g = 32.2 ft/s2
Q = 100 cfs Willow River Base Flow Range, USGS Gage 05341752, October 2012-January 2015
H = 4.6 ft Feet of head required to pass 100 cfs
Low Level Sluice - Theoretical
Little Falls Spillway Capacity
Wisconsin Department of Natural Resources
St Croix County, WI

Appendix B
Alternatives Drawings
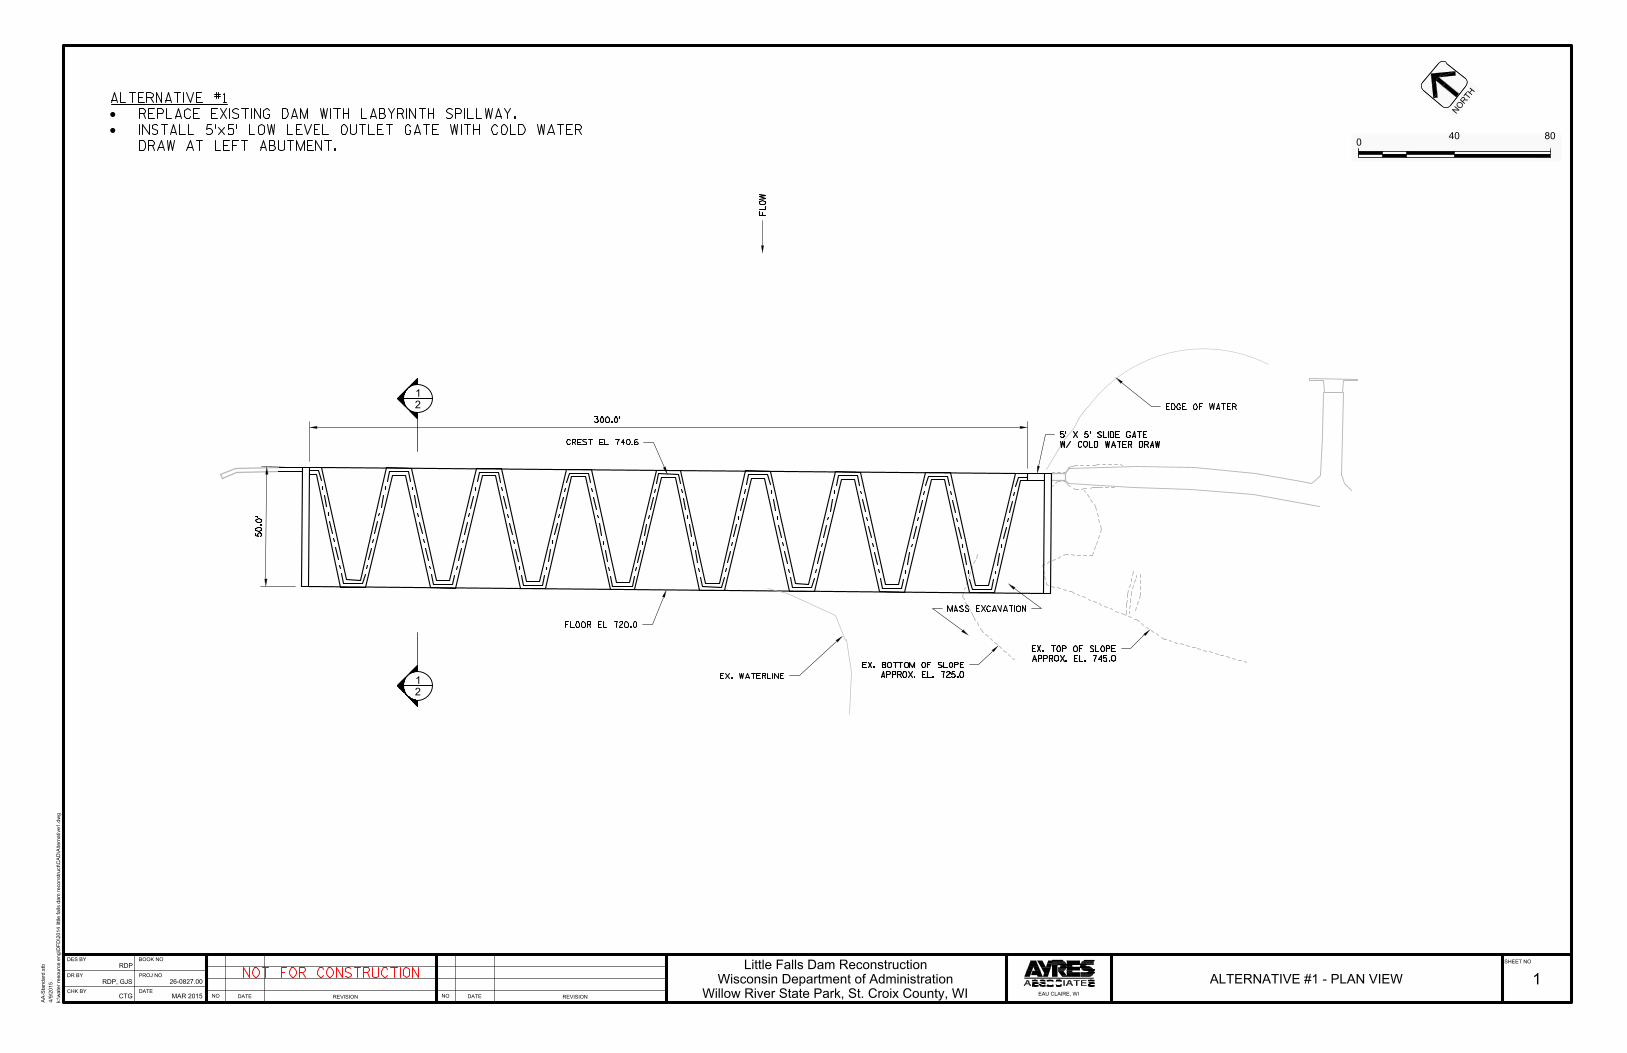
REVISION
DATE
REVISION
DATE
DATE
BOOK NO
PROJ NO
DES BY
DR BY
CHK BY
SHEET NO
NO NO
4/9/2015
k:\w
ater resource eng\D
FD
\2014 little falls dam
reconstruct\C
AD
\A
lternative1.dw
g
AA
-S
tandard.stb
26-0827.00
Little Falls Dam Reconstruction
Willow River State Park, St. Croix County, WI
RDP
RDP, GJS
CTG
1ALTERNATIVE #1 - PLAN VIEW
MAR 2015
EAU CLAIRE, WI
Wisconsin Department of Administration
0
40 80
1
2
2
1
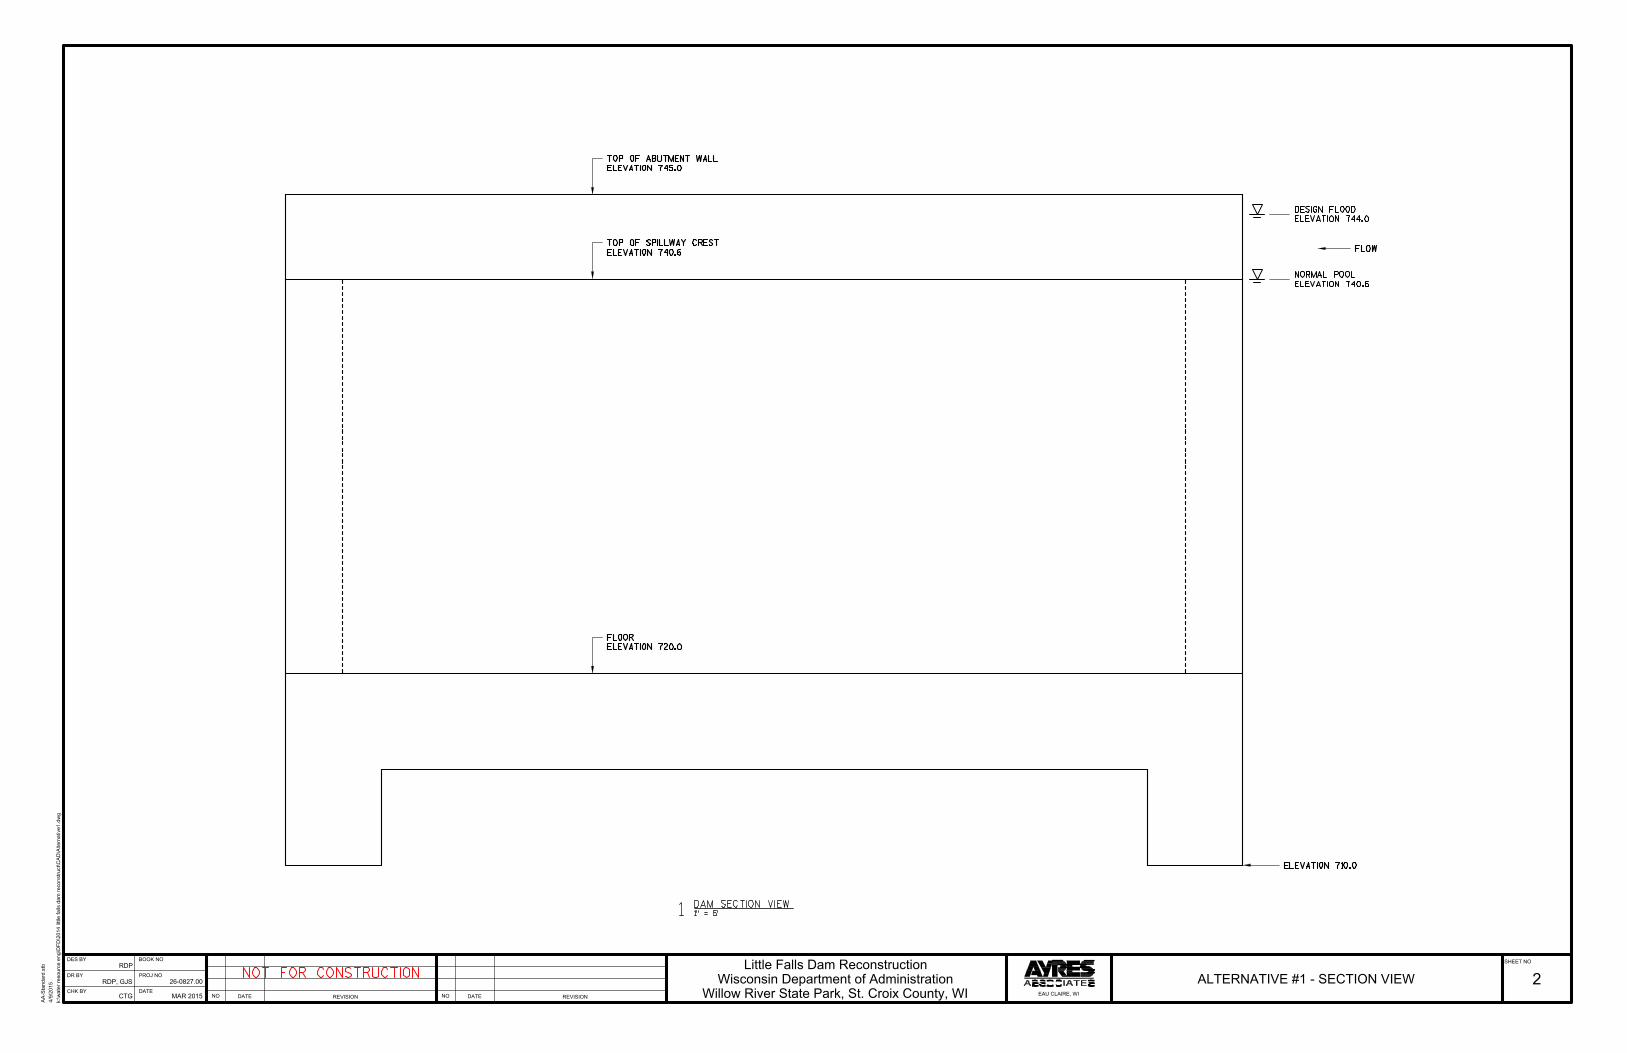
REVISION
DATE
REVISION
DATE
DATE
BOOK NO
PROJ NO
DES BY
DR BY
CHK BY
SHEET NO
NO NO
4/9/2015
k:\w
ater resource eng\D
FD
\2014 little falls dam
reconstruct\C
AD
\A
lternative1.dw
g
AA
-S
tandard.stb
26-0827.00
Little Falls Dam Reconstruction
Willow River State Park, St. Croix County, WI
RDP
RDP, GJS
CTG
2ALTERNATIVE #1 - SECTION VIEW
MAR 2015
EAU CLAIRE, WI
Wisconsin Department of Administration
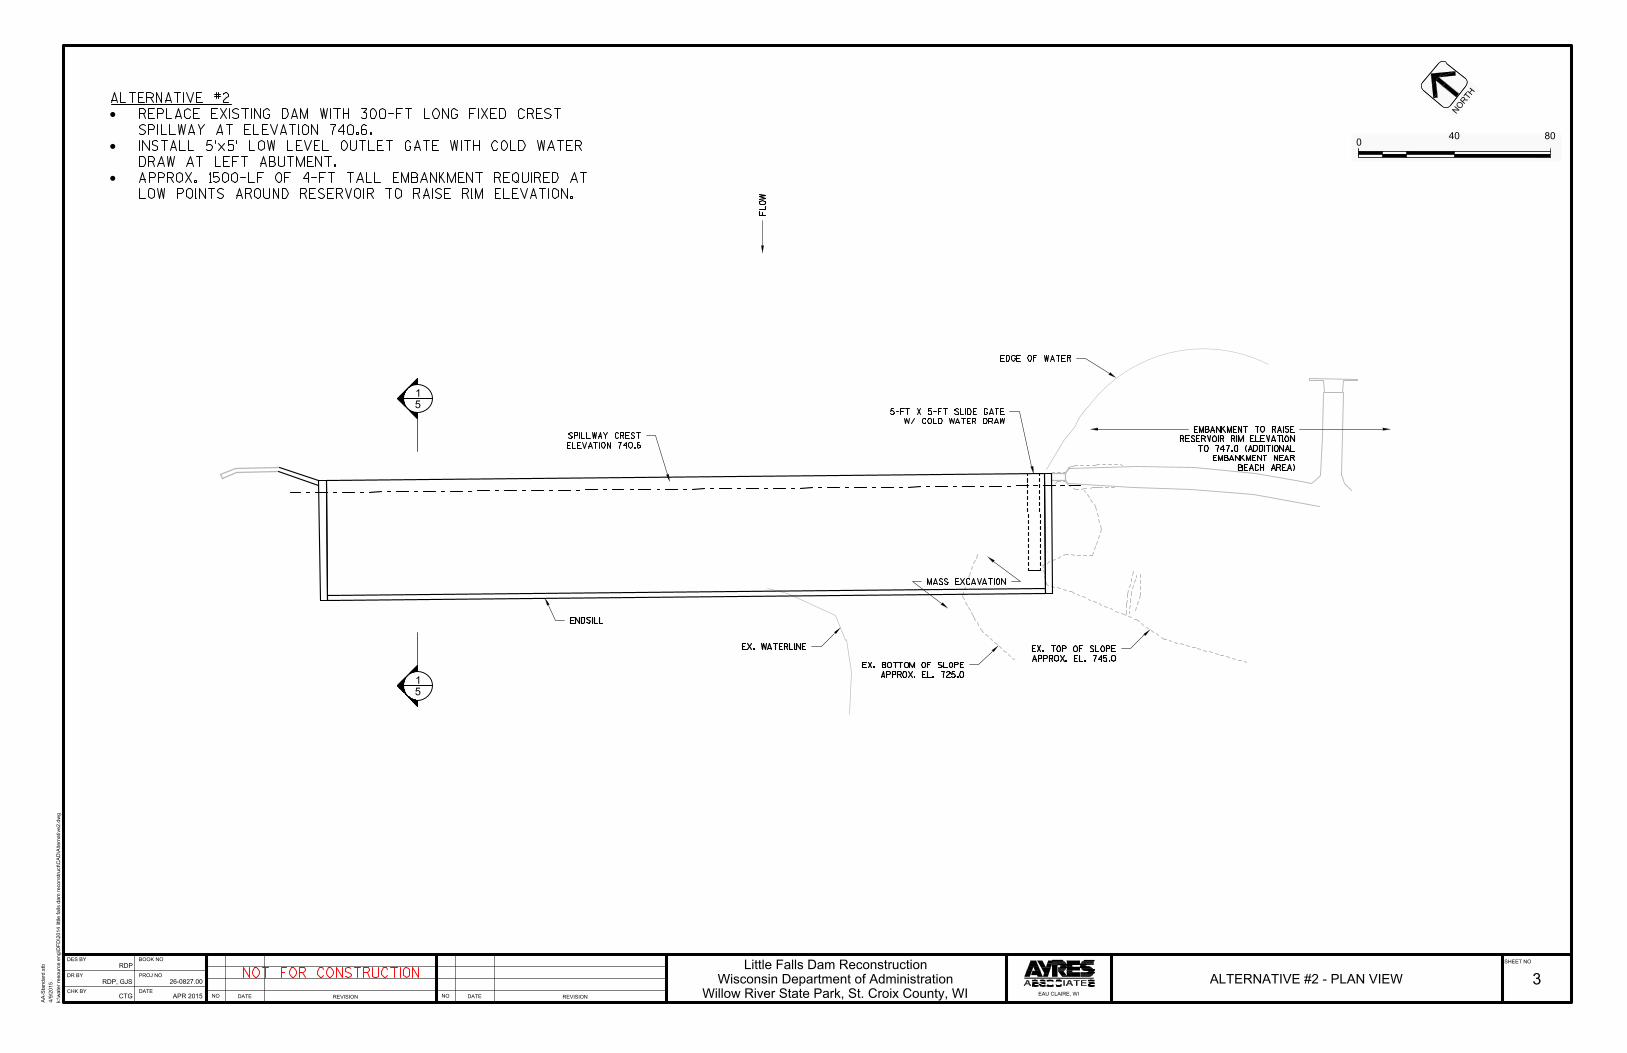
REVISION
DATE
REVISION
DATE
DATE
BOOK NO
PROJ NO
DES BY
DR BY
CHK BY
SHEET NO
NO NO
4/9/2015
k:\w
ater resource eng\D
FD
\2014 little falls dam
reconstruct\C
AD
\A
lternative2.dw
g
AA
-S
tandard.stb
26-0827.00
Little Falls Dam Reconstruction
Willow River State Park, St. Croix County, WI
RDP
RDP, GJS
CTG
3ALTERNATIVE #2 - PLAN VIEW
APR 2015
EAU CLAIRE, WI
Wisconsin Department of Administration
0
40 80
1
5
5
1
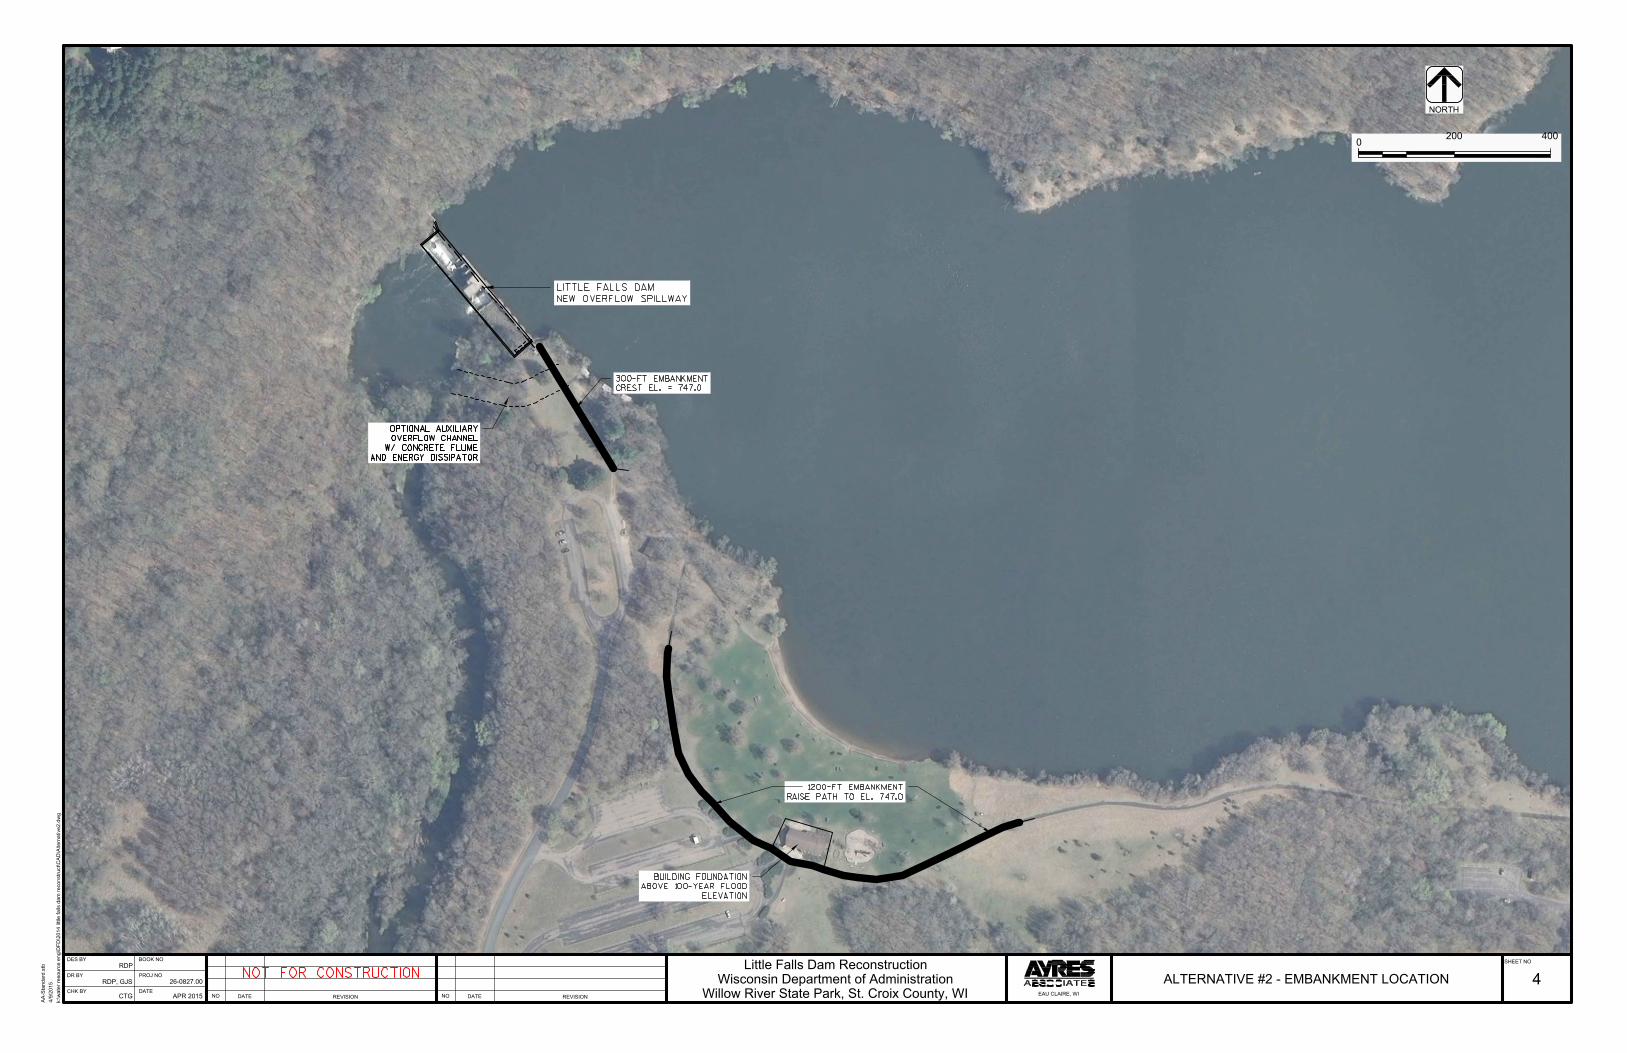
REVISION
DATE
REVISION
DATE
DATE
BOOK NO
PROJ NO
DES BY
DR BY
CHK BY
SHEET NO
NO NO
4/9/2015
k:\w
ater resource eng\D
FD
\2014 little falls dam
reconstruct\C
AD
\A
lternative2.dw
g
AA
-S
tandard.stb
26-0827.00
Little Falls Dam Reconstruction
Willow River State Park, St. Croix County, WI
RDP
RDP, GJS
CTG
4ALTERNATIVE #2 - EMBANKMENT LOCATION
APR 2015
EAU CLAIRE, WI
Wisconsin Department of Administration
0
200 400
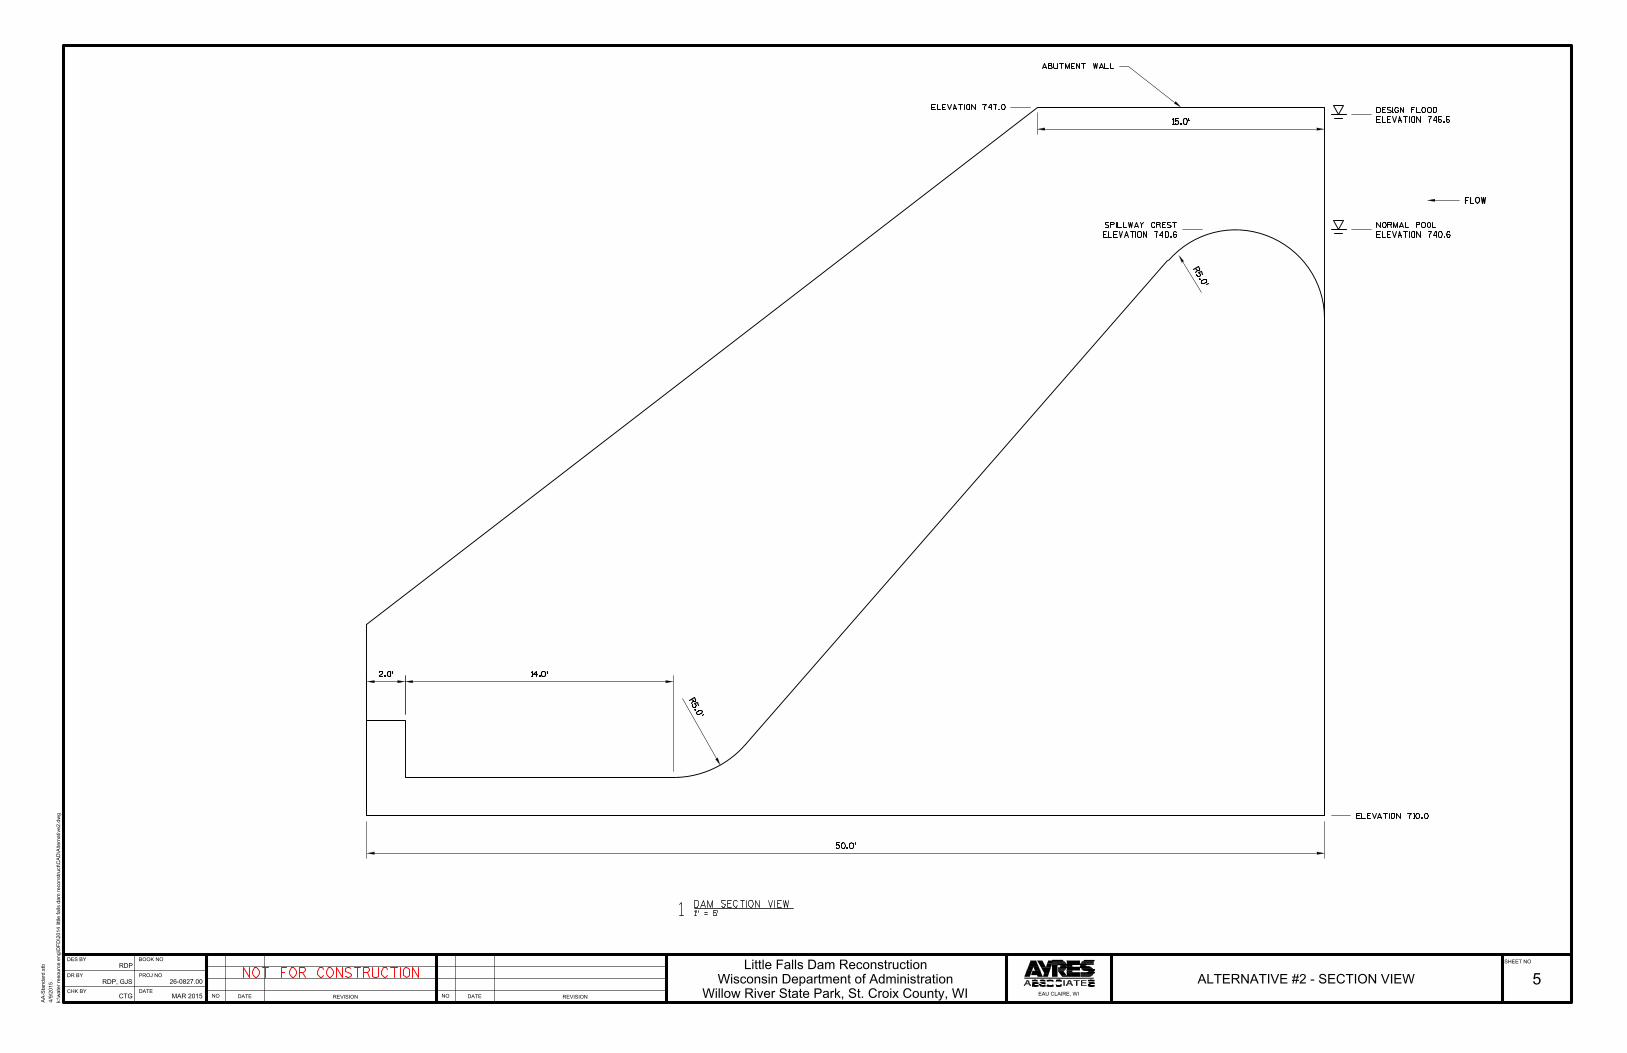
REVISION
DATE
REVISION
DATE
DATE
BOOK NO
PROJ NO
DES BY
DR BY
CHK BY
SHEET NO
NO NO
4/9/2015
k:\w
ater resource eng\D
FD
\2014 little falls dam
reconstruct\C
AD
\A
lternative2.dw
g
AA
-S
tandard.stb
26-0827.00
Little Falls Dam Reconstruction
Willow River State Park, St. Croix County, WI
RDP
RDP, GJS
CTG
5ALTERNATIVE #2 - SECTION VIEW
MAR 2015
EAU CLAIRE, WI
Wisconsin Department of Administration
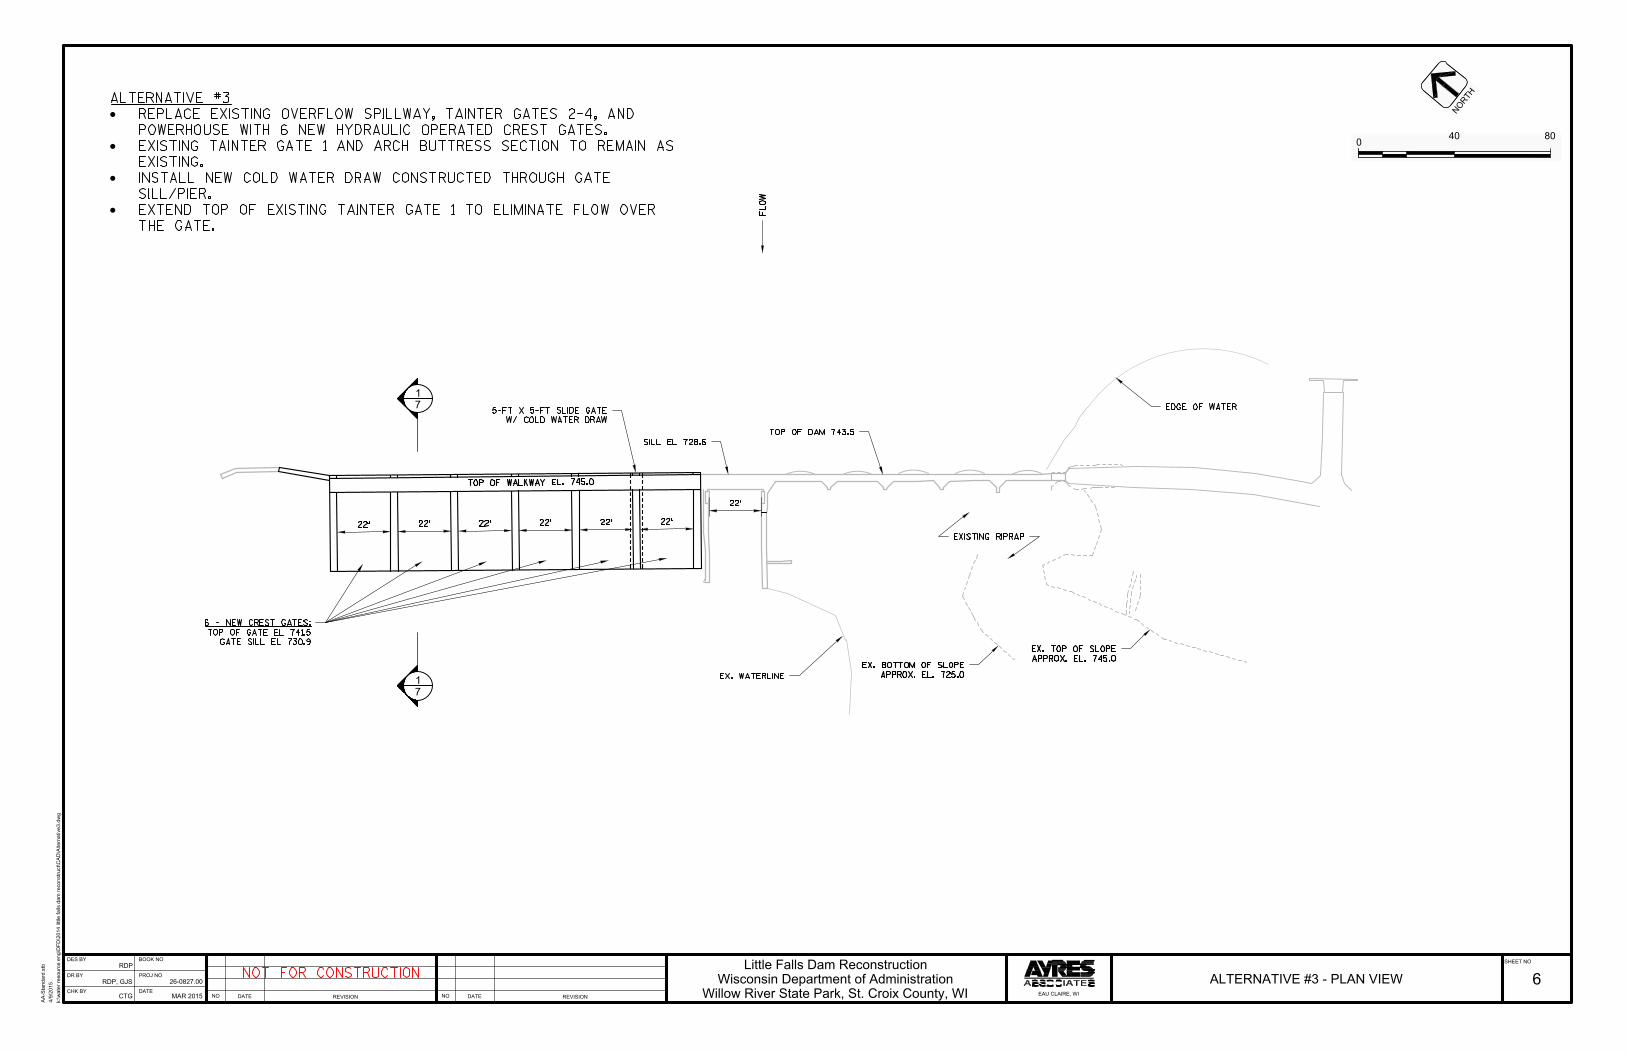
REVISION
DATE
REVISION
DATE
DATE
BOOK NO
PROJ NO
DES BY
DR BY
CHK BY
SHEET NO
NO NO
4/9/2015
k:\w
ater resource eng\D
FD
\2014 little falls dam
reconstruct\C
AD
\A
lternative3.dw
g
AA
-S
tandard.stb
26-0827.00
Little Falls Dam Reconstruction
Willow River State Park, St. Croix County, WI
RDP
RDP, GJS
CTG
6ALTERNATIVE #3 - PLAN VIEW
MAR 2015
EAU CLAIRE, WI
Wisconsin Department of Administration
0
40 80
1
7
7
1
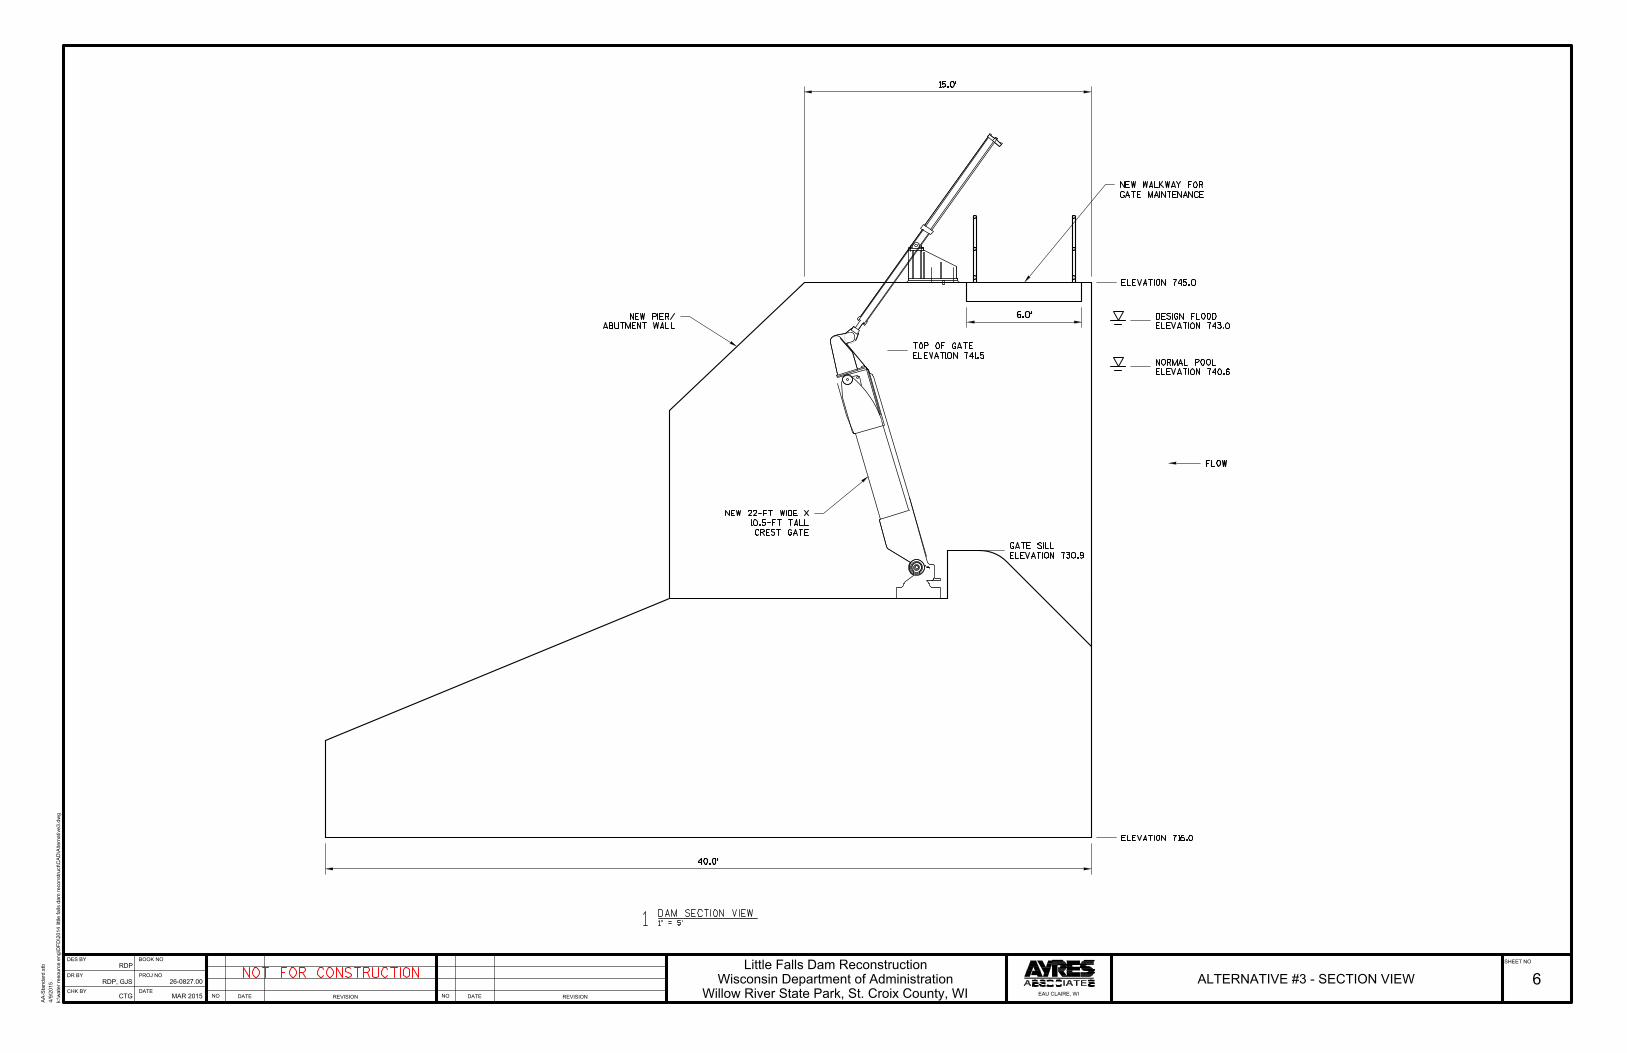
REVISION
DATE
REVISION
DATE
DATE
BOOK NO
PROJ NO
DES BY
DR BY
CHK BY
SHEET NO
NO NO
4/9/2015
k:\w
ater resource eng\D
FD
\2014 little falls dam
reconstruct\C
AD
\A
lternative3.dw
g
AA
-S
tandard.stb
26-0827.00
Little Falls Dam Reconstruction
Willow River State Park, St. Croix County, WI
RDP
RDP, GJS
CTG
6ALTERNATIVE #3 - SECTION VIEW
MAR 2015
EAU CLAIRE, WI
Wisconsin Department of Administration
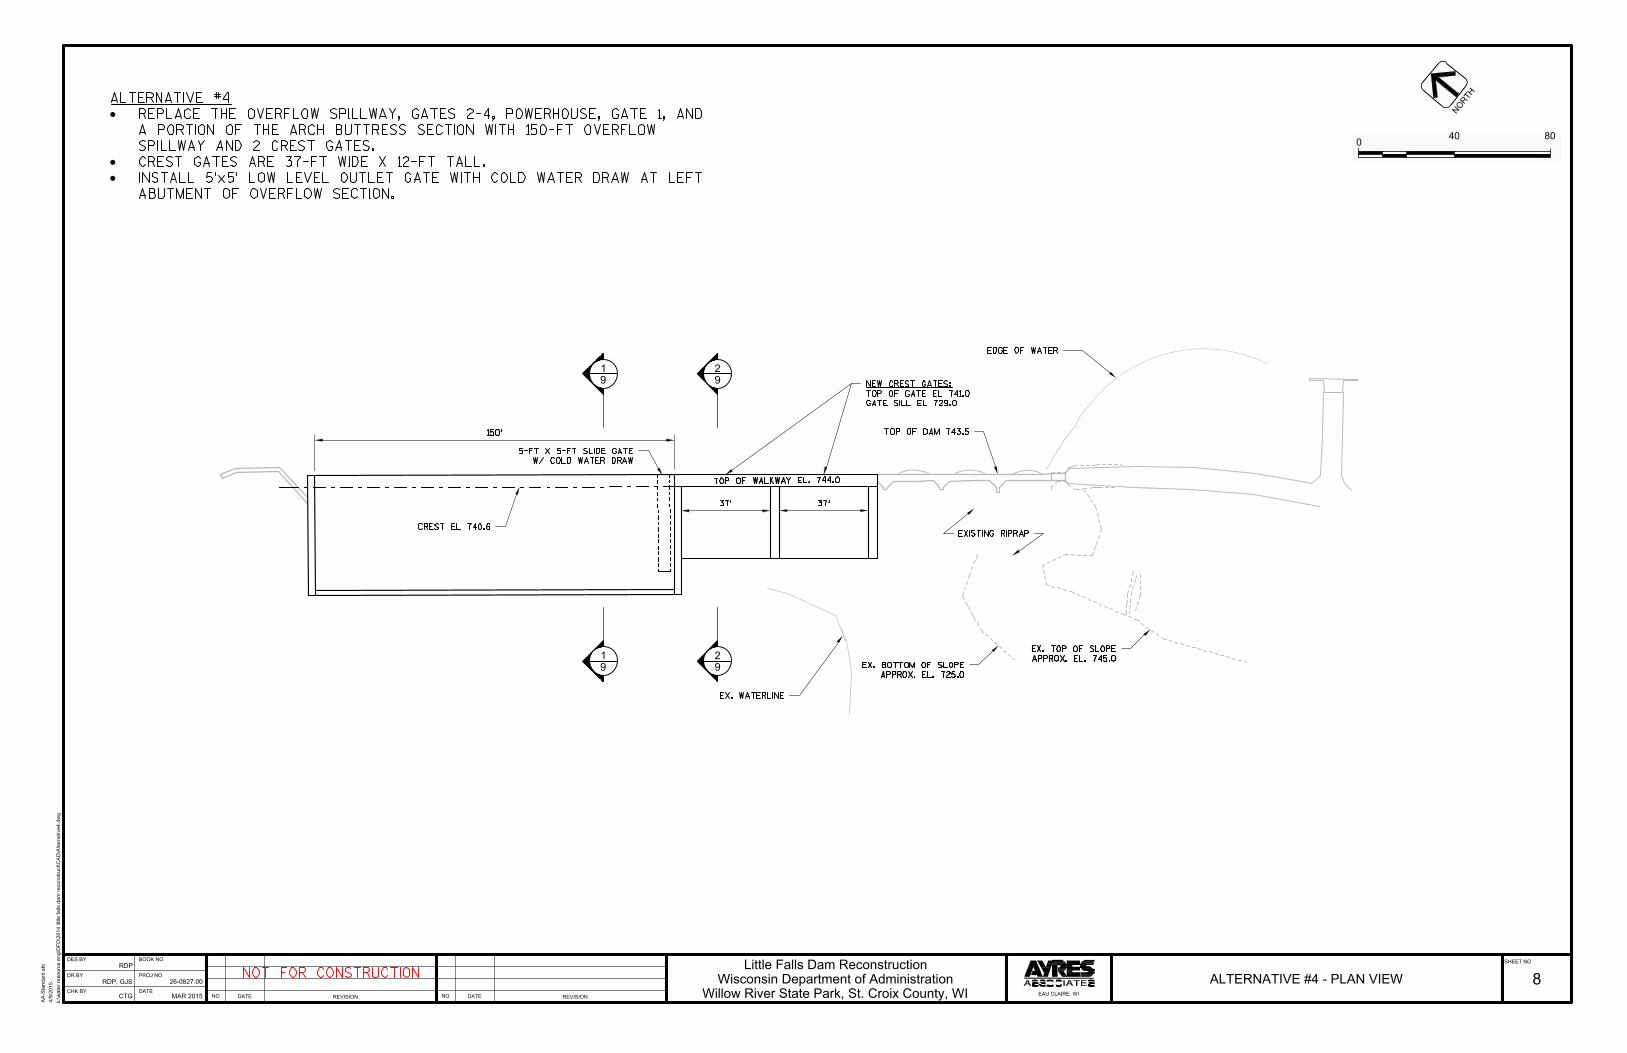
REVISION
DATE
REVISION
DATE
DATE
BOOK NO
PROJ NO
DES BY
DR BY
CHK BY
SHEET NO
NO NO
4/9/2015
k:\w
ater resource eng\D
FD
\2014 little falls dam
reconstruct\C
AD
\A
lternative4.dw
g
AA
-S
tandard.stb
26-0827.00
Little Falls Dam Reconstruction
Willow River State Park, St. Croix County, WI
RDP
RDP, GJS
CTG
8ALTERNATIVE #4 - PLAN VIEW
MAR 2015
EAU CLAIRE, WI
Wisconsin Department of Administration
0
40 80
1
9
9
1
2
9
9
2
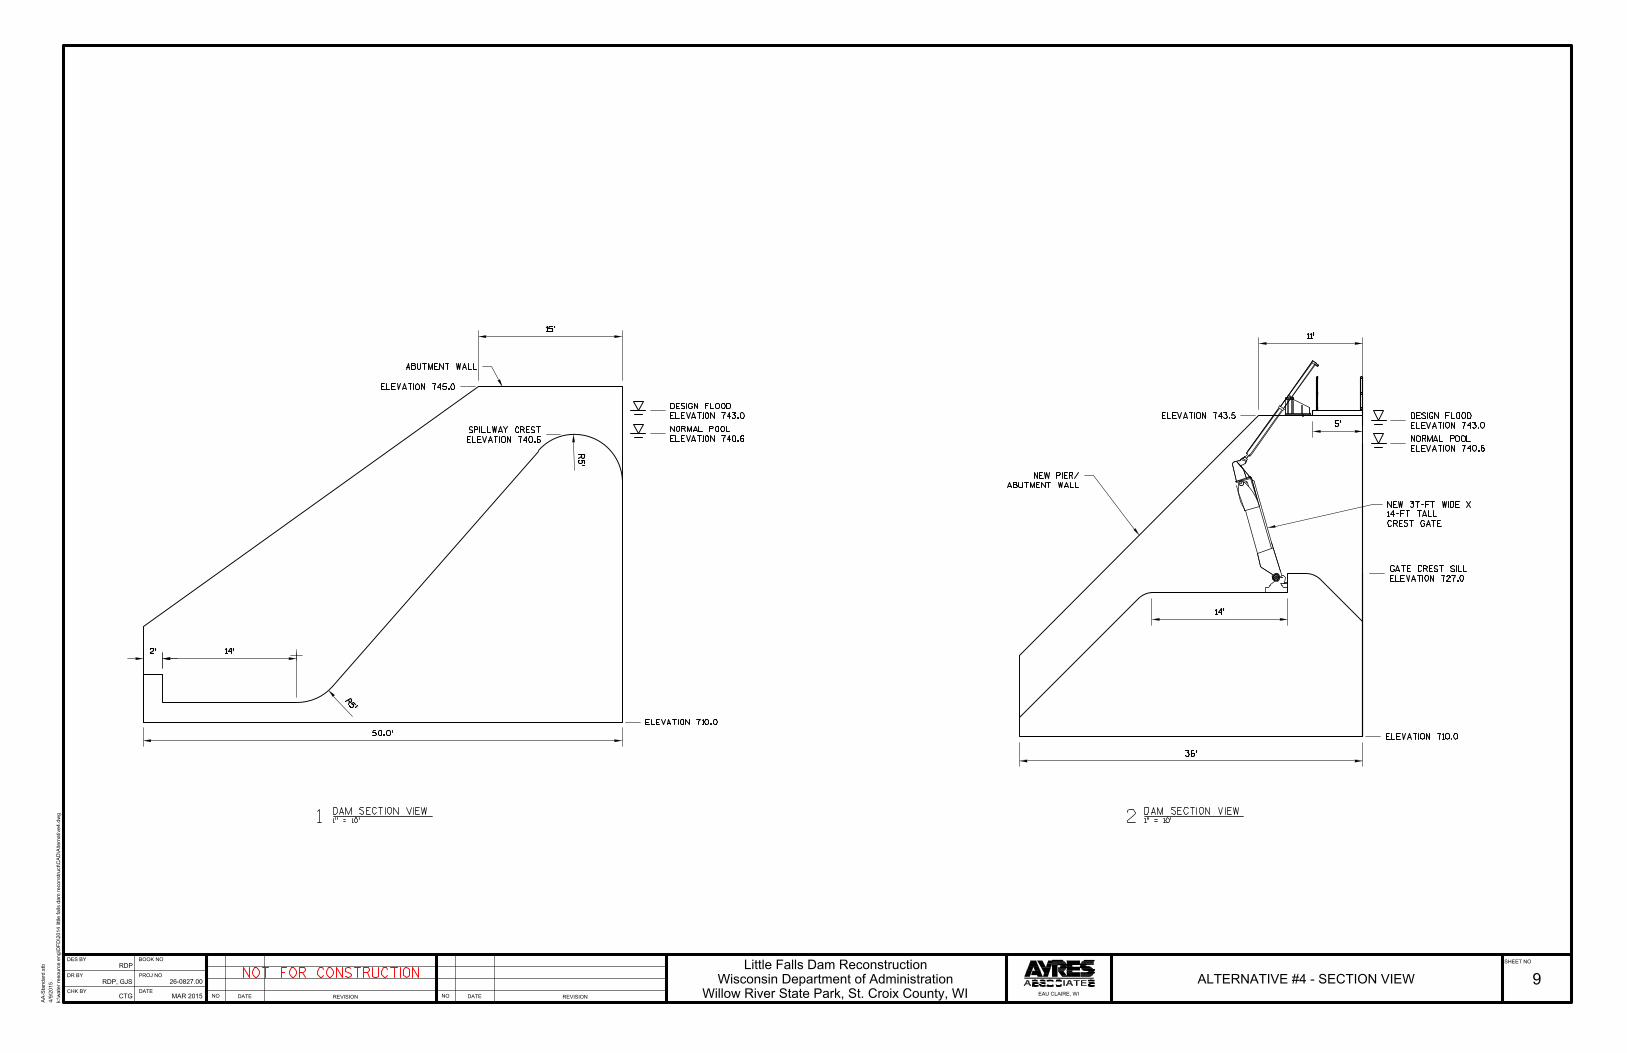
REVISION
DATE
REVISION
DATE
DATE
BOOK NO
PROJ NO
DES BY
DR BY
CHK BY
SHEET NO
NO NO
4/9/2015
k:\w
ater resource eng\D
FD
\2014 little falls dam
reconstruct\C
AD
\A
lternative4.dw
g
AA
-S
tandard.stb
26-0827.00
Little Falls Dam Reconstruction
Willow River State Park, St. Croix County, WI
RDP
RDP, GJS
CTG
9ALTERNATIVE #4 - SECTION VIEW
MAR 2015
EAU CLAIRE, WI
Wisconsin Department of Administration
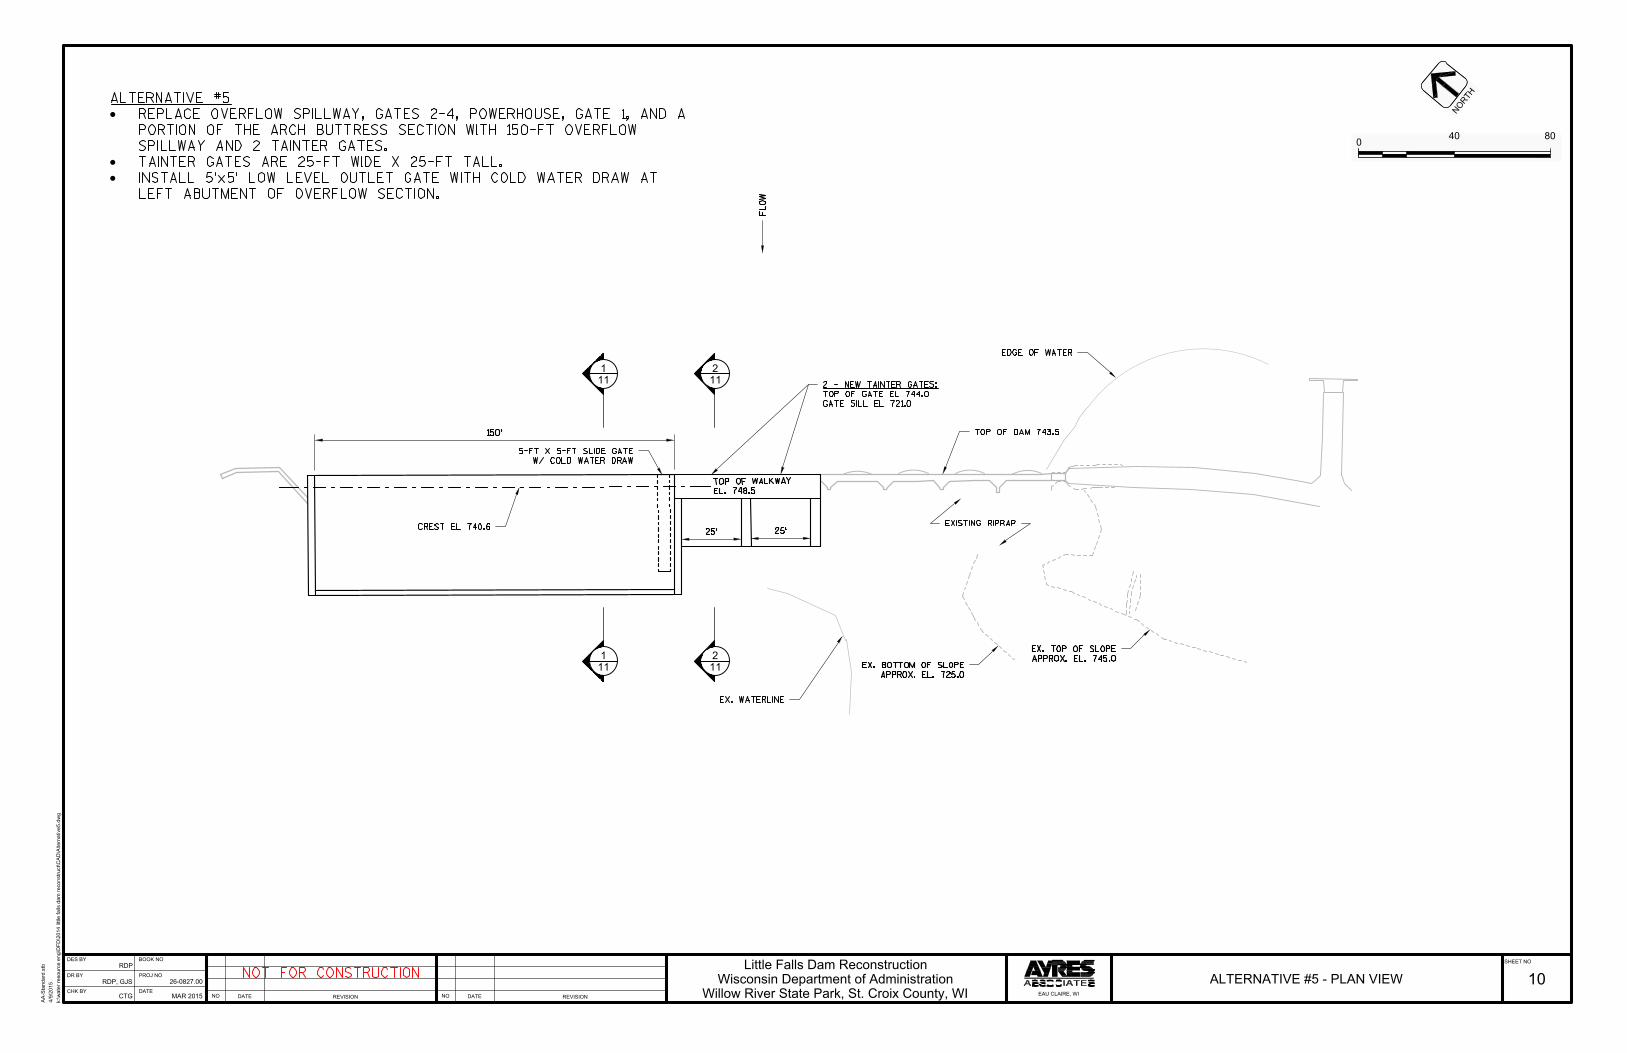
REVISION
DATE
REVISION
DATE
DATE
BOOK NO
PROJ NO
DES BY
DR BY
CHK BY
SHEET NO
NO NO
4/9/2015
k:\w
ater resource eng\D
FD
\2014 little falls dam
reconstruct\C
AD
\A
lternative5.dw
g
AA
-S
tandard.stb
26-0827.00
Little Falls Dam Reconstruction
Willow River State Park, St. Croix County, WI
RDP
RDP, GJS
CTG
10ALTERNATIVE #5 - PLAN VIEW
MAR 2015
EAU CLAIRE, WI
Wisconsin Department of Administration
0
40 80
1
11
11
1
2
11
11
2
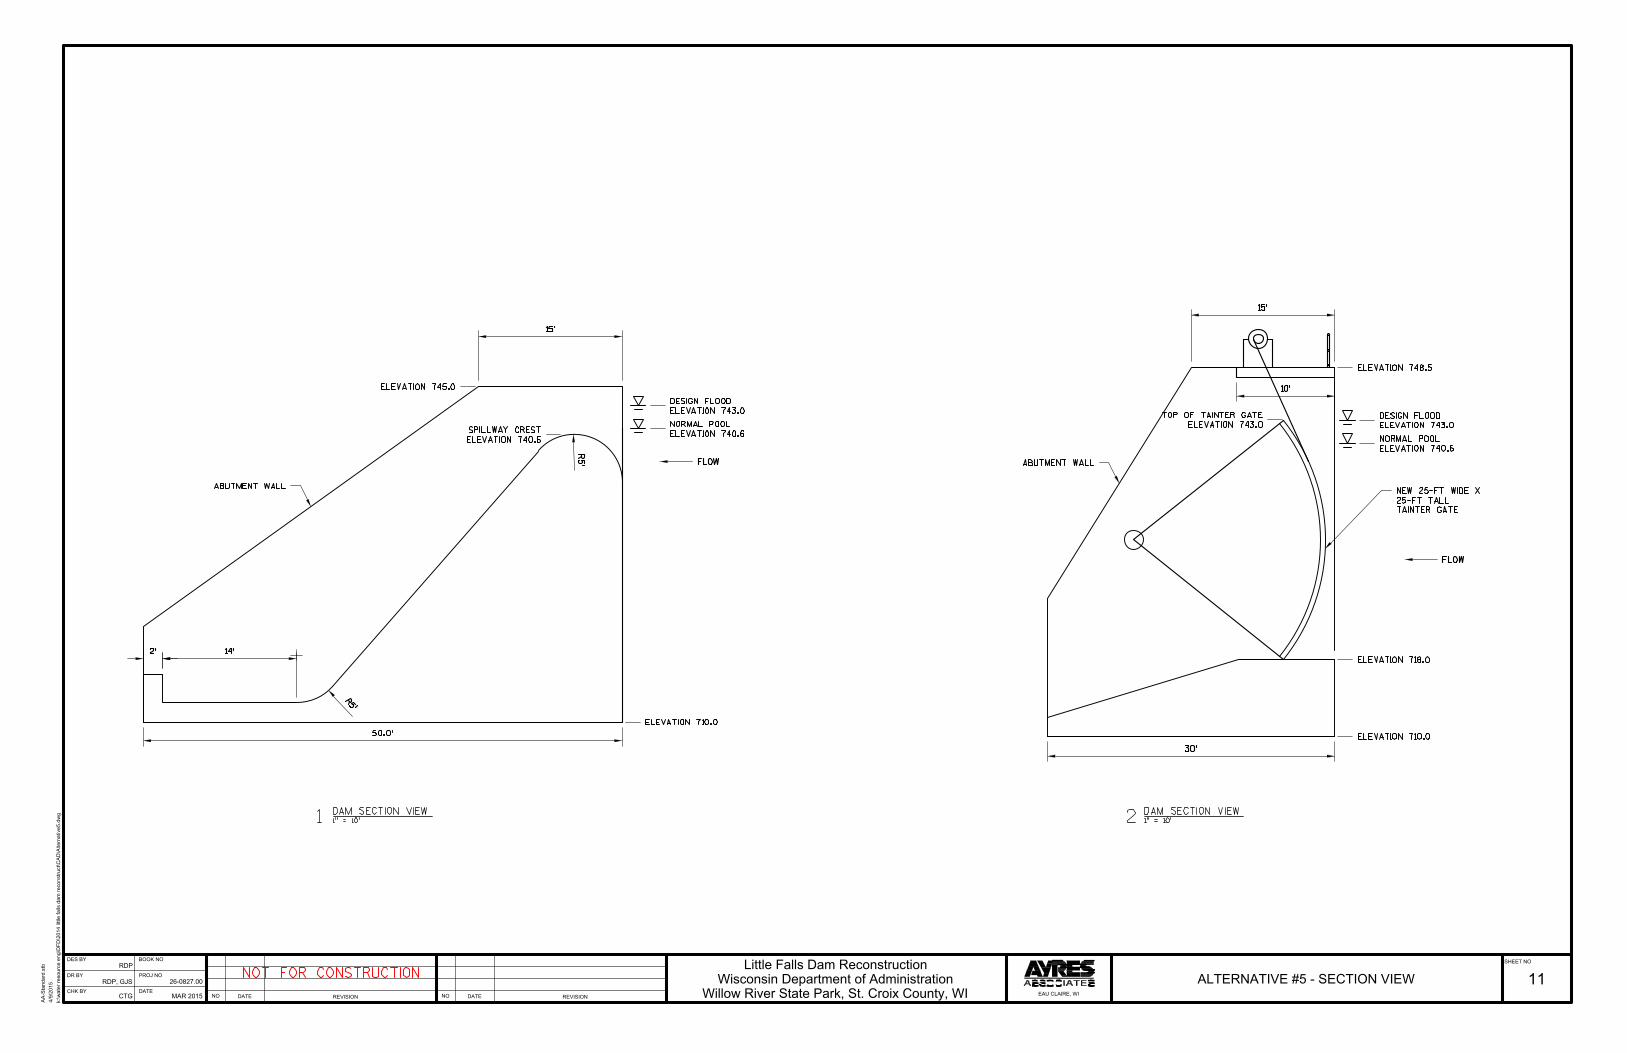
REVISION
DATE
REVISION
DATE
DATE
BOOK NO
PROJ NO
DES BY
DR BY
CHK BY
SHEET NO
NO NO
4/9/2015
k:\w
ater resource eng\D
FD
\2014 little falls dam
reconstruct\C
AD
\A
lternative5.dw
g
AA
-S
tandard.stb
26-0827.00
Little Falls Dam Reconstruction
Willow River State Park, St. Croix County, WI
RDP
RDP, GJS
CTG
11ALTERNATIVE #5 - SECTION VIEW
MAR 2015
EAU CLAIRE, WI
Wisconsin Department of Administration
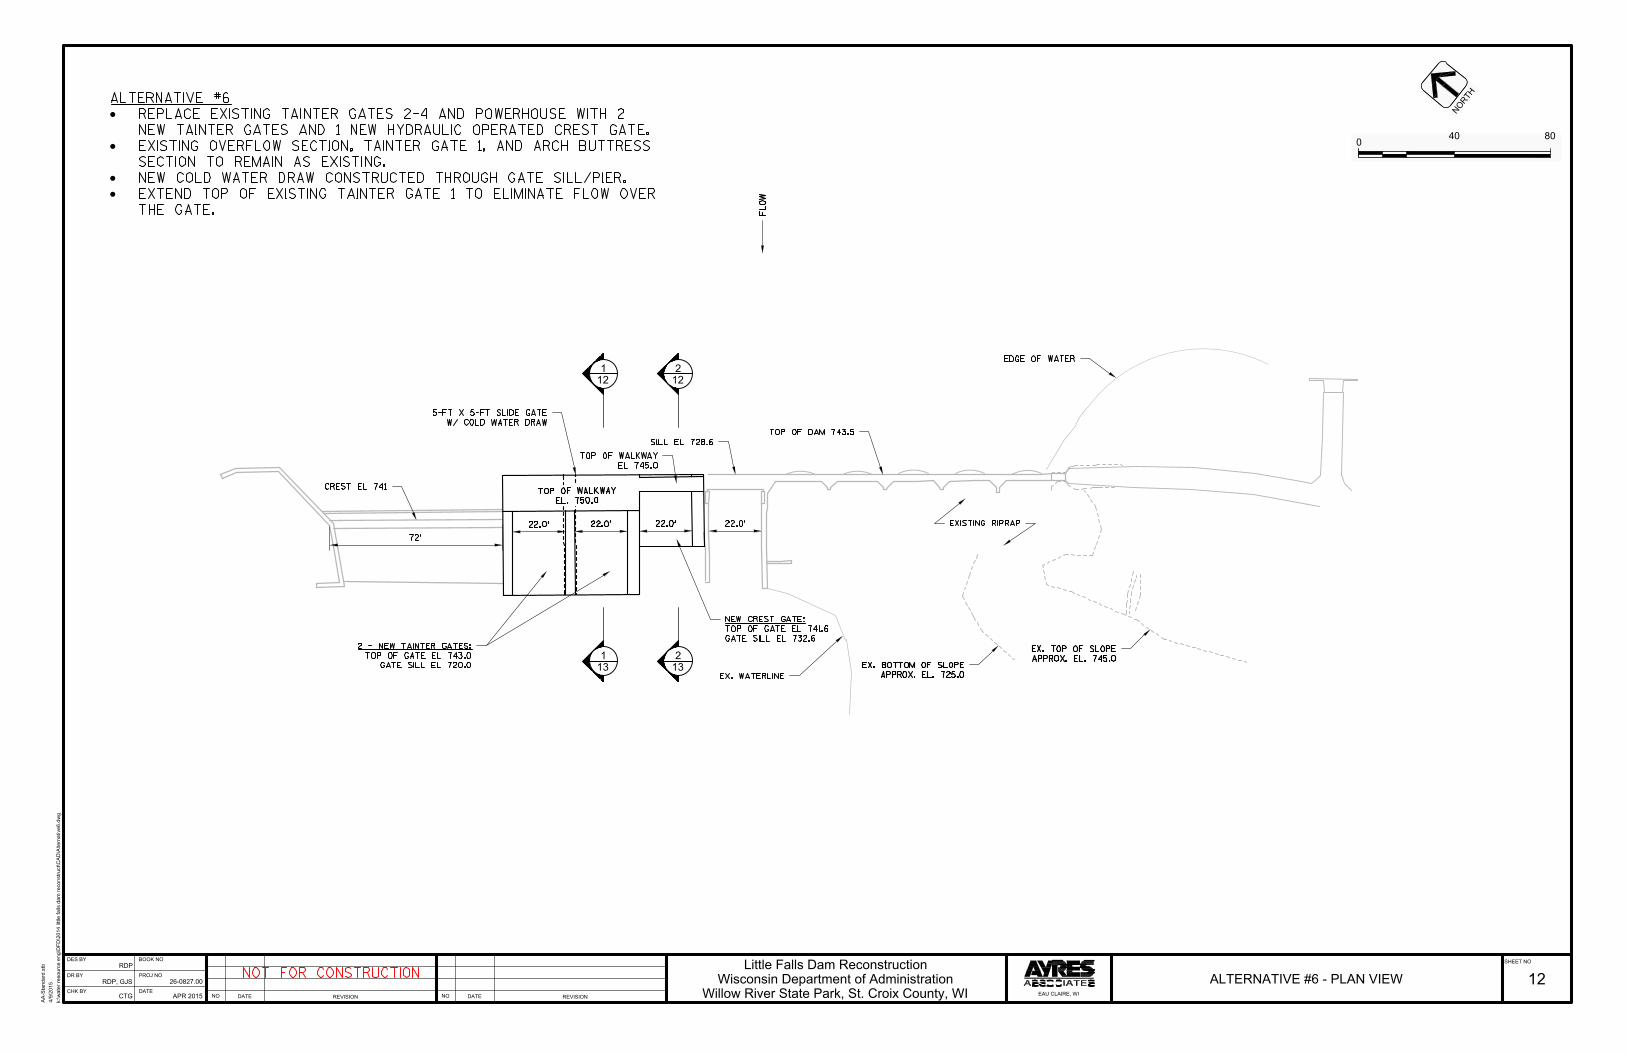
REVISION
DATE
REVISION
DATE
DATE
BOOK NO
PROJ NO
DES BY
DR BY
CHK BY
SHEET NO
NO NO
4/9/2015
k:\w
ater resource eng\D
FD
\2014 little falls dam
reconstruct\C
AD
\A
lternative6.dw
g
AA
-S
tandard.stb
26-0827.00
Little Falls Dam Reconstruction
Willow River State Park, St. Croix County, WI
RDP
RDP, GJS
CTG
12ALTERNATIVE #6 - PLAN VIEW
APR 2015
EAU CLAIRE, WI
Wisconsin Department of Administration
0
40 80
1
12
13
1
2
12
13
2
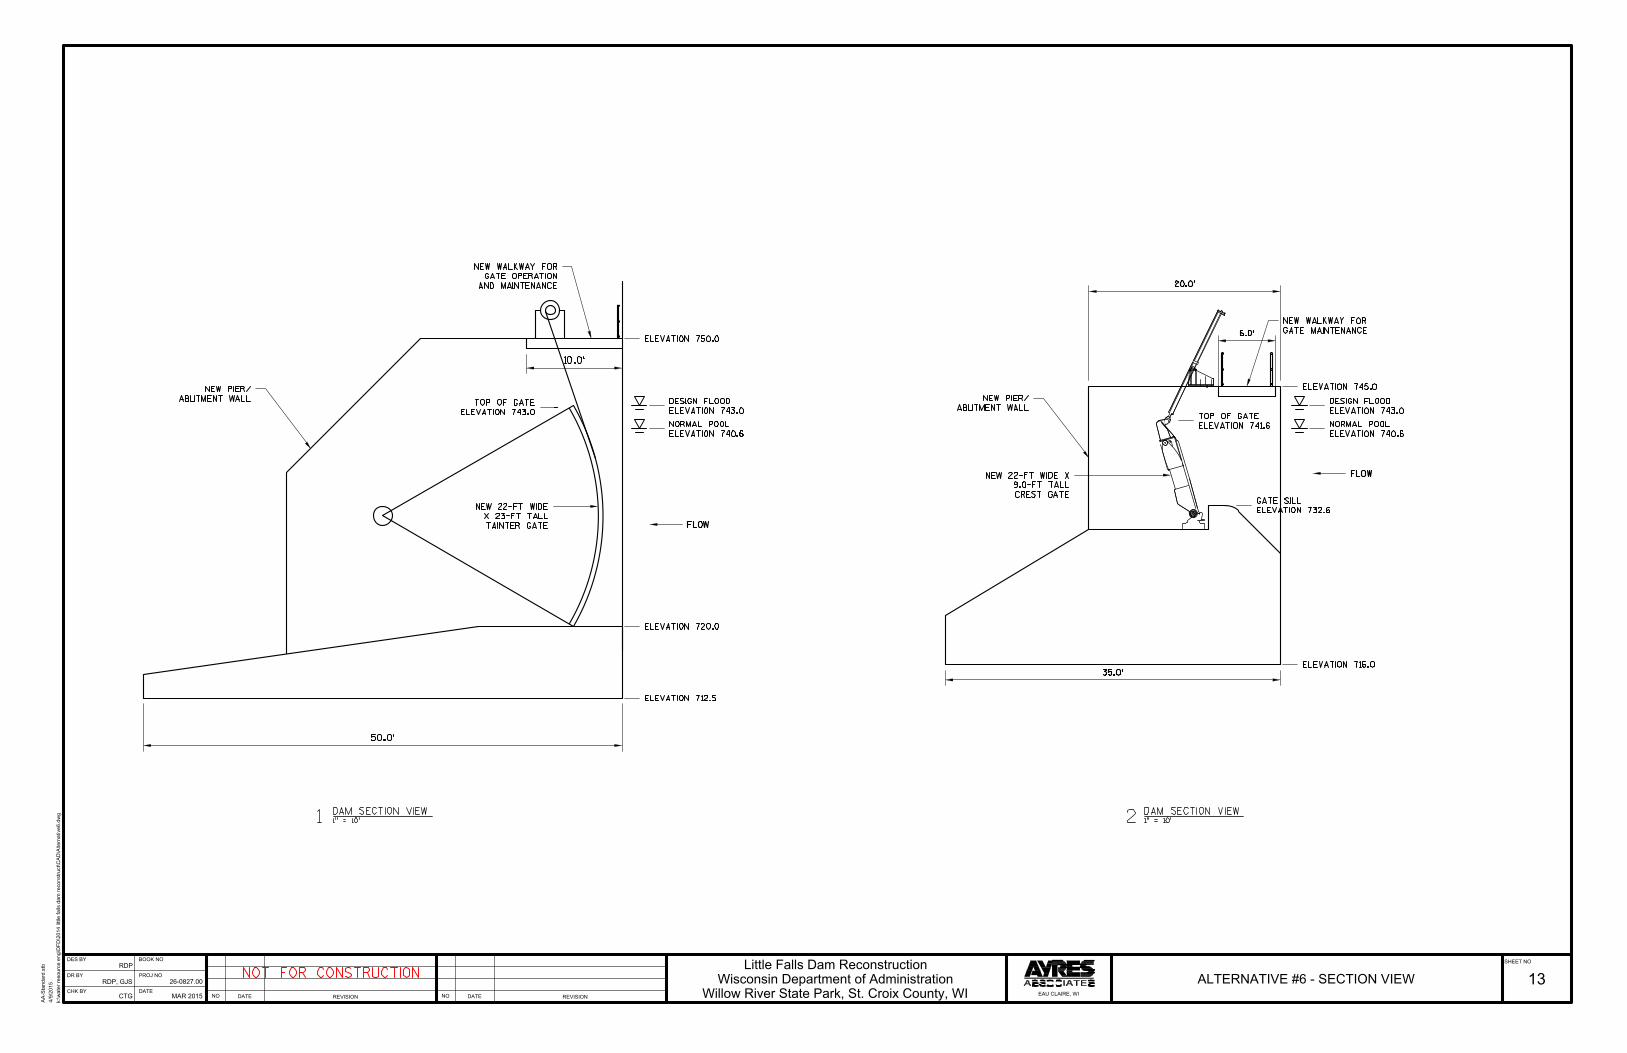
REVISION
DATE
REVISION
DATE
DATE
BOOK NO
PROJ NO
DES BY
DR BY
CHK BY
SHEET NO
NO NO
4/9/2015
k:\w
ater resource eng\D
FD
\2014 little falls dam
reconstruct\C
AD
\A
lternative6.dw
g
AA
-S
tandard.stb
26-0827.00
Little Falls Dam Reconstruction
Willow River State Park, St. Croix County, WI
RDP
RDP, GJS
CTG
13ALTERNATIVE #6 - SECTION VIEW
MAR 2015
EAU CLAIRE, WI
Wisconsin Department of Administration
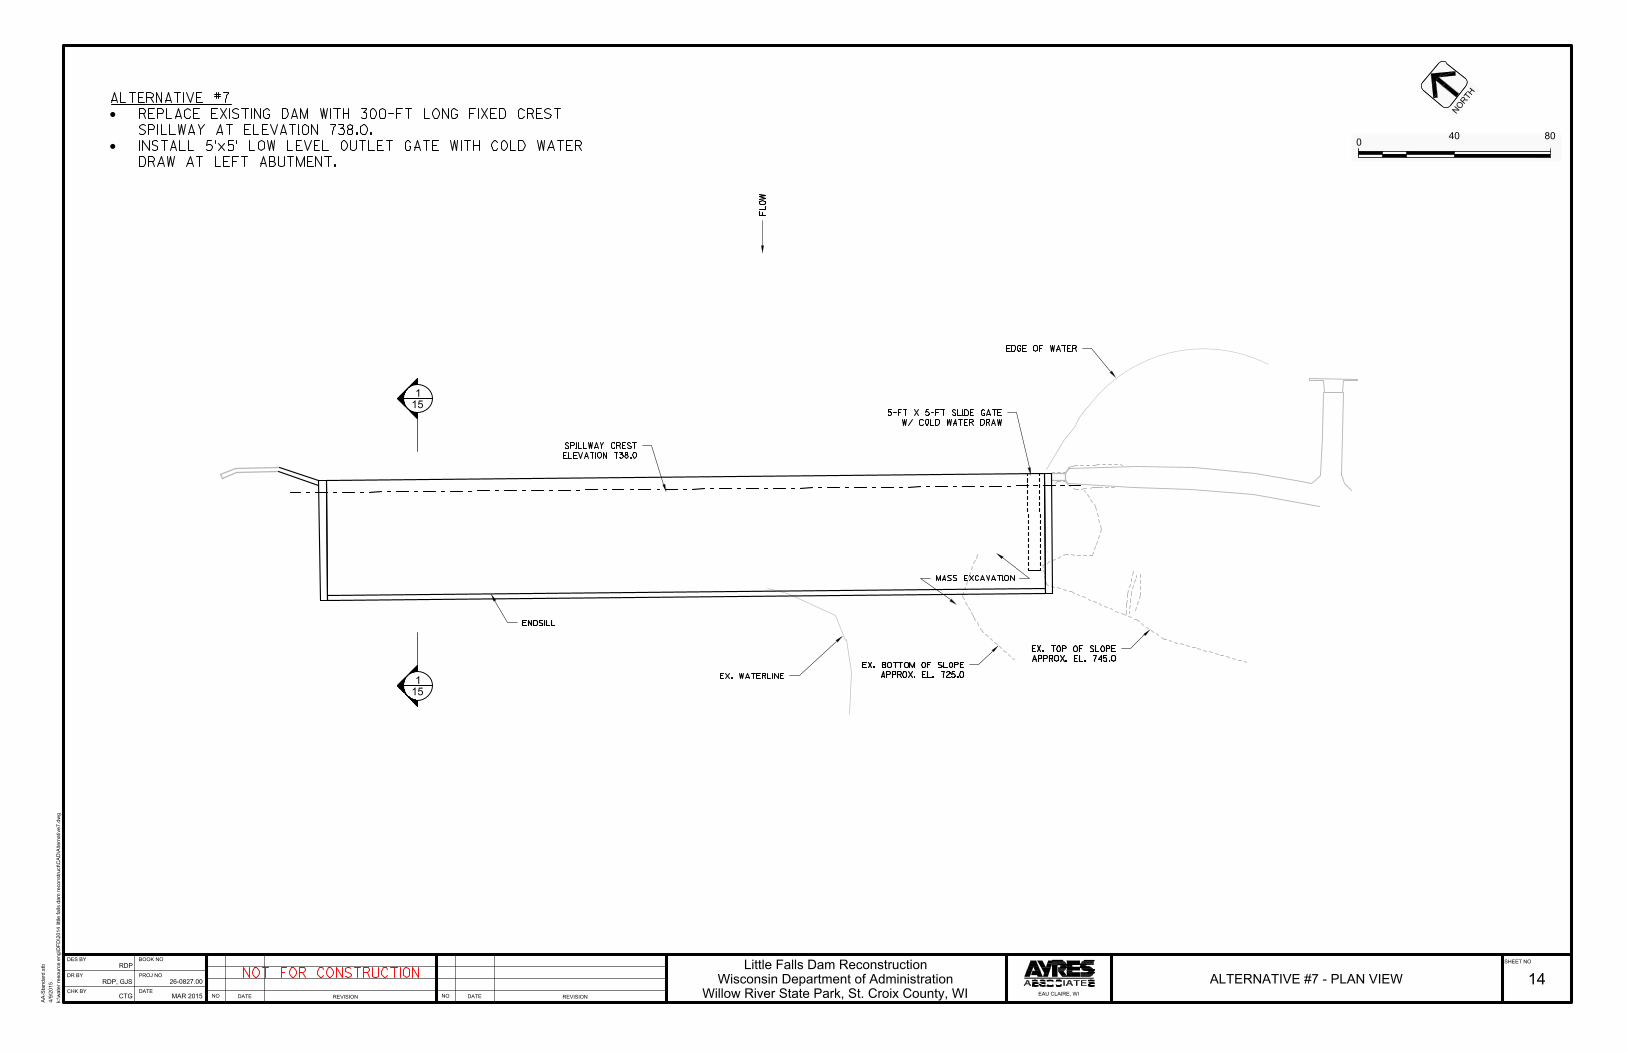
REVISION
DATE
REVISION
DATE
DATE
BOOK NO
PROJ NO
DES BY
DR BY
CHK BY
SHEET NO
NO NO
4/9/2015
k:\w
ater resource eng\D
FD
\2014 little falls dam
reconstruct\C
AD
\A
lternative7.dw
g
AA
-S
tandard.stb
26-0827.00
Little Falls Dam Reconstruction
Willow River State Park, St. Croix County, WI
RDP
RDP, GJS
CTG
14ALTERNATIVE #7 - PLAN VIEW
MAR 2015
EAU CLAIRE, WI
Wisconsin Department of Administration
0
40 80
1
15
15
1
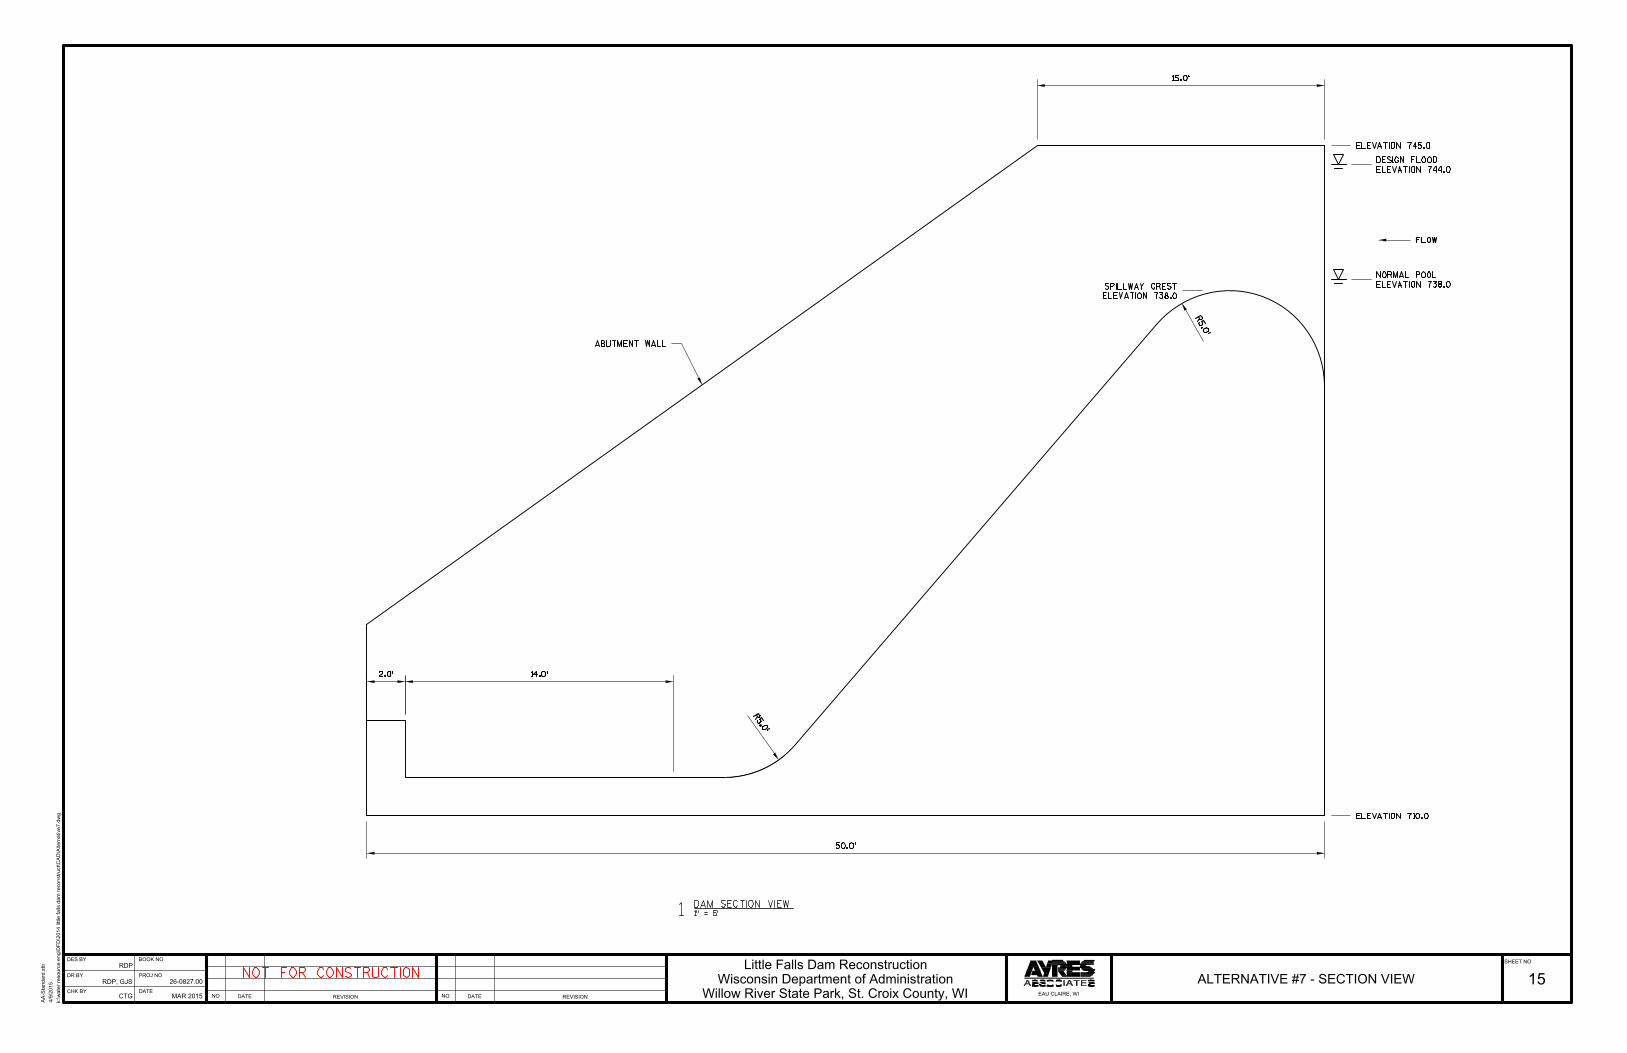
REVISION
DATE
REVISION
DATE
DATE
BOOK NO
PROJ NO
DES BY
DR BY
CHK BY
SHEET NO
NO NO
4/9/2015
k:\w
ater resource eng\D
FD
\2014 little falls dam
reconstruct\C
AD
\A
lternative7.dw
g
AA
-S
tandard.stb
26-0827.00
Little Falls Dam Reconstruction
Willow River State Park, St. Croix County, WI
RDP
RDP, GJS
CTG
15ALTERNATIVE #7 - SECTION VIEW
MAR 2015
EAU CLAIRE, WI
Wisconsin Department of Administration
Appendix C
Alternatives Opinions of Estimated Costs
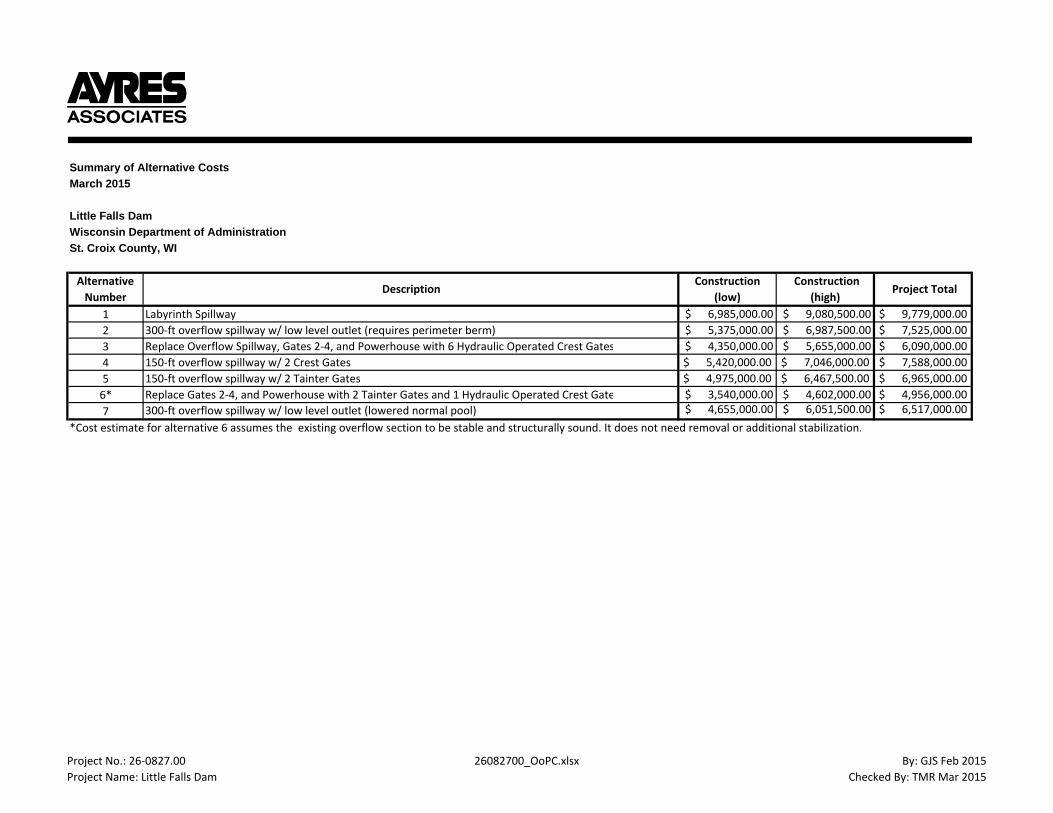
Summary of Alternative CostsMarch 2015
Little Falls DamWisconsin Department of AdministrationSt. Croix County, WI
1 Labyrinth Spillway $ 6,985,000.00 $ 9,080,500.00 $ 9,779,000.00 2 300‐ft overflow spillway w/ low level outlet (requires perimeter berm) $ 5,375,000.00 $ 6,987,500.00 $ 7,525,000.00 3 Replace Overflow Spillway, Gates 2‐4, and Powerhouse with 6 Hydraulic Operated Crest Gates $ 4,350,000.00 $ 5,655,000.00 $ 6,090,000.00 4 150‐ft overflow spillway w/ 2 Crest Gates $ 5,420,000.00 $ 7,046,000.00 $ 7,588,000.00 5 150‐ft overflow spillway w/ 2 Tainter Gates $ 4,975,000.00 $ 6,467,500.00 $ 6,965,000.00 6* Replace Gates 2‐4, and Powerhouse with 2 Tainter Gates and 1 Hydraulic Operated Crest Gate $ 3,540,000.00 $ 4,602,000.00 $ 4,956,000.00 7 300‐ft overflow spillway w/ low level outlet (lowered normal pool) $ 4,655,000.00 $ 6,051,500.00 $ 6,517,000.00
*Cost estimate for alternative 6 assumes the existing overflow section to be stable and structurally sound. It does not need removal or additional stabilization.
Alternative Number
DescriptionConstruction
(low) Construction
(high) Project Total
Project No.: 26‐0827.00Project Name: Little Falls Dam
26082700_OoPC.xlsx By: GJS Feb 2015Checked By: TMR Mar 2015
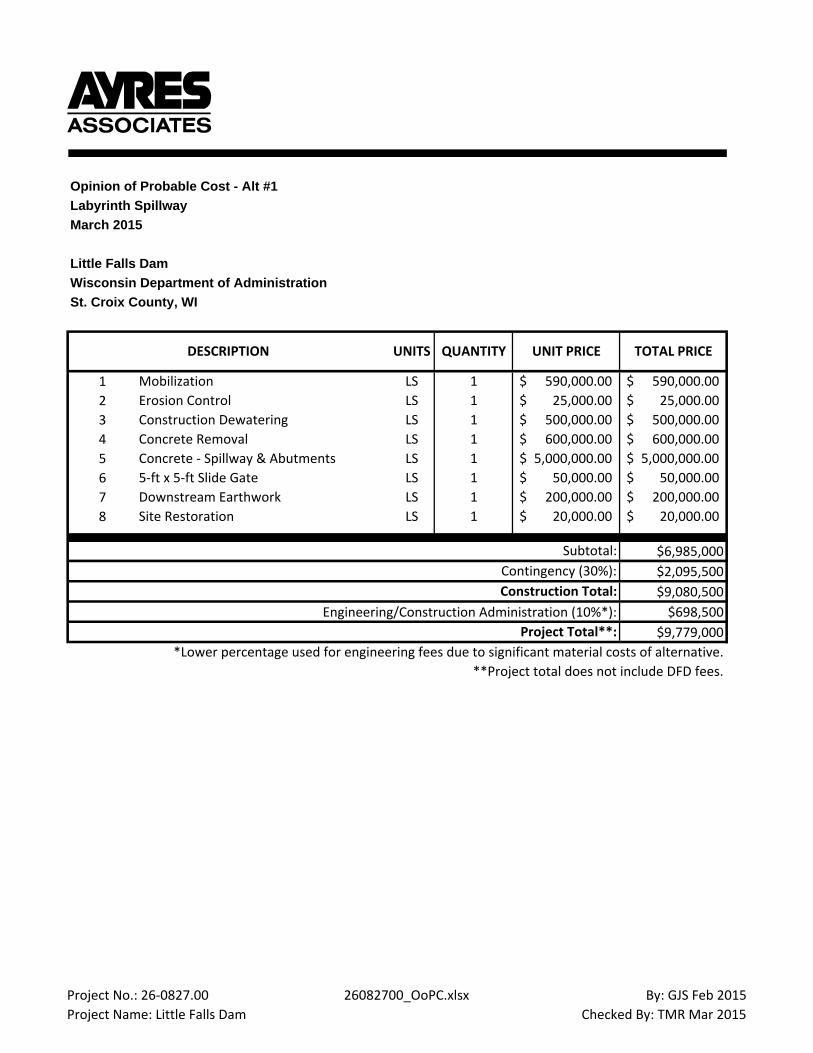
Opinion of Probable Cost - Alt #1Labyrinth SpillwayMarch 2015
Little Falls DamWisconsin Department of AdministrationSt. Croix County, WI
1 Mobilization LS 1 590,000.00$ 590,000.00$ 2 Erosion Control LS 1 25,000.00$ 25,000.00$ 3 Construction Dewatering LS 1 500,000.00$ 500,000.00$ 4 Concrete Removal LS 1 600,000.00$ 600,000.00$ 5 Concrete ‐ Spillway & Abutments LS 1 5,000,000.00$ 5,000,000.00$ 6 5‐ft x 5‐ft Slide Gate LS 1 50,000.00$ 50,000.00$ 7 Downstream Earthwork LS 1 200,000.00$ 200,000.00$ 8 Site Restoration LS 1 20,000.00$ 20,000.00$
$6,985,000$2,095,500$9,080,500
Engineering/Construction Administration (10%*): $698,500$9,779,000
*Lower percentage used for engineering fees due to significant material costs of alternative.**Project total does not include DFD fees.
TOTAL PRICE
Subtotal:Contingency (30%):Construction Total:
Project Total**:
DESCRIPTION UNITS QUANTITY UNIT PRICE
Project No.: 26‐0827.00Project Name: Little Falls Dam
26082700_OoPC.xlsx By: GJS Feb 2015Checked By: TMR Mar 2015
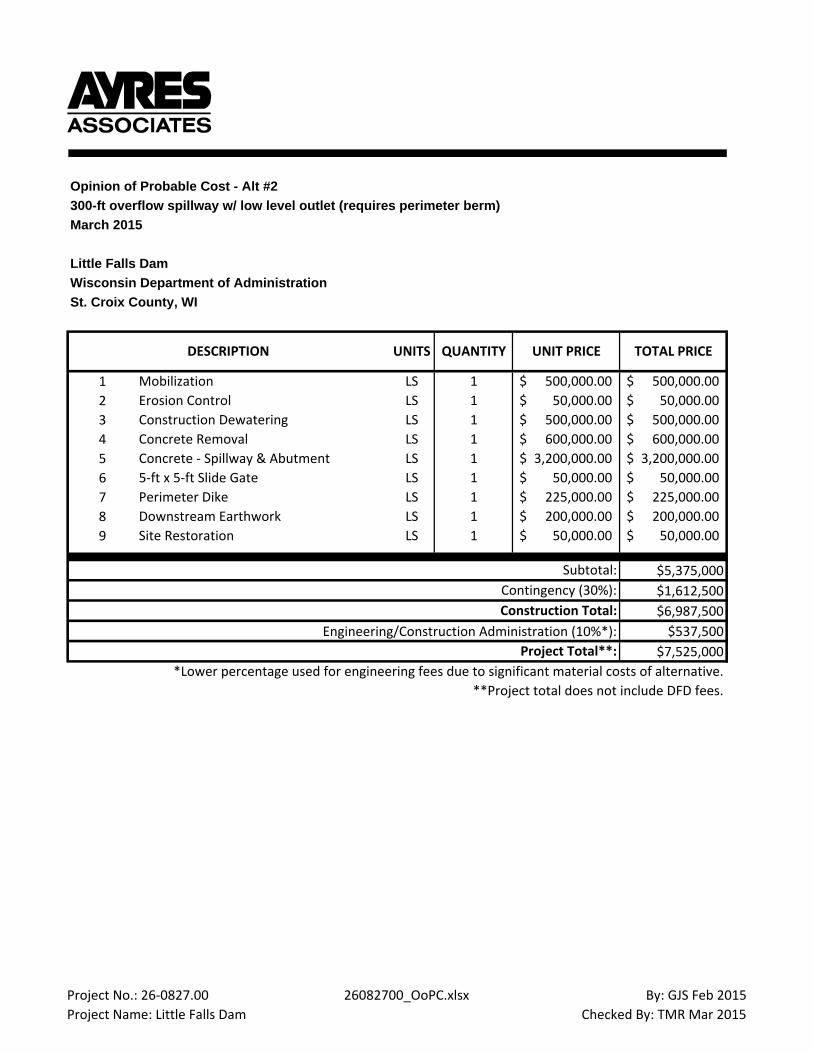
Opinion of Probable Cost - Alt #2300-ft overflow spillway w/ low level outlet (requires perimeter berm)March 2015
Little Falls DamWisconsin Department of AdministrationSt. Croix County, WI
1 Mobilization LS 1 500,000.00$ 500,000.00$ 2 Erosion Control LS 1 50,000.00$ 50,000.00$ 3 Construction Dewatering LS 1 500,000.00$ 500,000.00$ 4 Concrete Removal LS 1 600,000.00$ 600,000.00$ 5 Concrete ‐ Spillway & Abutment LS 1 3,200,000.00$ 3,200,000.00$ 6 5‐ft x 5‐ft Slide Gate LS 1 50,000.00$ 50,000.00$ 7 Perimeter Dike LS 1 225,000.00$ 225,000.00$ 8 Downstream Earthwork LS 1 200,000.00$ 200,000.00$ 9 Site Restoration LS 1 50,000.00$ 50,000.00$
$5,375,000$1,612,500$6,987,500
Engineering/Construction Administration (10%*): $537,500$7,525,000
*Lower percentage used for engineering fees due to significant material costs of alternative.**Project total does not include DFD fees.
TOTAL PRICE
Subtotal:Contingency (30%):Construction Total:
Project Total**:
DESCRIPTION UNITS QUANTITY UNIT PRICE
Project No.: 26‐0827.00Project Name: Little Falls Dam
26082700_OoPC.xlsx By: GJS Feb 2015Checked By: TMR Mar 2015

Opinion of Probable Cost - Alt #3Replace Overflow Spillway, Gates 2-4, and Powerhouse with 6 Hydraulic Operated Crest GatesMarch 2015
Little Falls DamWisconsin Department of AdministrationSt. Croix County, WI
1 Mobilization LS 1 450,000.00$ 450,000.00$ 2 Erosion Control LS 1 25,000.00$ 25,000.00$ 3 Construction Dewatering LS 1 300,000.00$ 300,000.00$ 4 Concrete Removal LS 1 500,000.00$ 500,000.00$ 5 Concrete ‐ Piers/Abutments & Sill LS 1 1,600,000.00$ 1,600,000.00$ 6 Concrete Walkway & Handrail LS 1 50,000.00$ 50,000.00$ 7 Hydraulic Crest Gate Ea 6 230,000.00$ 1,380,000.00$ 8 Electrical LS 1 25,000.00$ 25,000.00$ 9 Site Restoration LS 1 20,000.00$ 20,000.00$
$4,350,000$1,305,000$5,655,000
Engineering/Construction Administration (10%*): $435,000$6,090,000
*Lower percentage used for engineering fees due to significant material costs of alternative.**Project total does not include DFD fees.
TOTAL PRICE
Subtotal:
Project Total**:
Contingency (30%):Construction Total:
DESCRIPTION UNITS QUANTITY UNIT PRICE
Project No.: 26‐0827.00Project Name: Little Falls Dam
26082700_OoPC.xlsx By: GJS Jan 2015Checked By: TMR Jan 2015

Opinion of Probable Cost - Alt #4150-ft overflow spillway w/ 2 Crest GatesMarch 2015
Little Falls DamWisconsin Department of AdministrationSt. Croix County, WI
1 Mobilization LS 1 500,000.00$ 500,000.00$ 2 Erosion Control LS 1 25,000.00$ 25,000.00$ 3 Construction Dewatering LS 1 500,000.00$ 500,000.00$ 4 Concrete Removal LS 1 600,000.00$ 600,000.00$ 5 Concrete ‐ Spillway & Abutments LS 1 1,750,000.00$ 1,750,000.00$ 6 Concrete ‐ Gate Bay & Abutments LS 1 900,000.00$ 900,000.00$ 7 5‐ft x 5‐ft Slide Gate LS 1 50,000.00$ 50,000.00$ 8 Crest Gate Ea 2 525,000.00$ 1,050,000.00$ 9 Electrical LS 1 25,000.00$ 25,000.00$ 10 Site Restoration LS 1 20,000.00$ 20,000.00$
$5,420,000$1,626,000$7,046,000
Engineering/Construction Administration (10%*): $542,000$7,588,000
*Lower percentage used for engineering fees due to significant material costs of alternative.**Project total does not include DFD fees.
TOTAL PRICE
Subtotal:Contingency (30%):Construction Total:
Project Total**:
DESCRIPTION UNITS QUANTITY UNIT PRICE
Project No.: 26‐0827.00Project Name: Little Falls Dam
26082700_OoPC.xlsx By: GJS Feb 2015Checked By: TMR Mar 2015

Opinion of Probable Cost - Alt #5150-ft overflow spillway w/ 2 Tainter GatesMarch 2015
Little Falls DamWisconsin Department of AdministrationSt. Croix County, WI
1 Mobilization LS 1 480,000.00$ 480,000.00$ 2 Erosion Control LS 1 25,000.00$ 25,000.00$ 3 Construction Dewatering LS 1 500,000.00$ 500,000.00$ 4 Concrete Removal LS 1 600,000.00$ 600,000.00$ 5 Concrete ‐ Spillway & Abutments LS 1 1,750,000.00$ 1,750,000.00$ 6 Concrete ‐ Gate Bay & Abutments LS 1 575,000.00$ 575,000.00$ 7 5‐ft x 5‐ft Slide Gate LS 1 50,000.00$ 50,000.00$ 8 Tainter Gate, Trunnion, & Hoist Ea 2 475,000.00$ 950,000.00$ 9 Electrical LS 1 25,000.00$ 25,000.00$ 10 Site Restoration LS 1 20,000.00$ 20,000.00$
$4,975,000$1,492,500$6,467,500
Engineering/Construction Administration (10%*): $497,500$6,965,000
*Lower percentage used for engineering fees due to significant material costs of alternative.**Project total does not include DFD fees.
TOTAL PRICE
Subtotal:Contingency (30%):Construction Total:
Project Total**:
DESCRIPTION UNITS QUANTITY UNIT PRICE
Project No.: 26‐0827.00Project Name: Little Falls Dam
26082700_OoPC.xlsx By: GJS Feb 2015Checked By: TMR Mar 2015
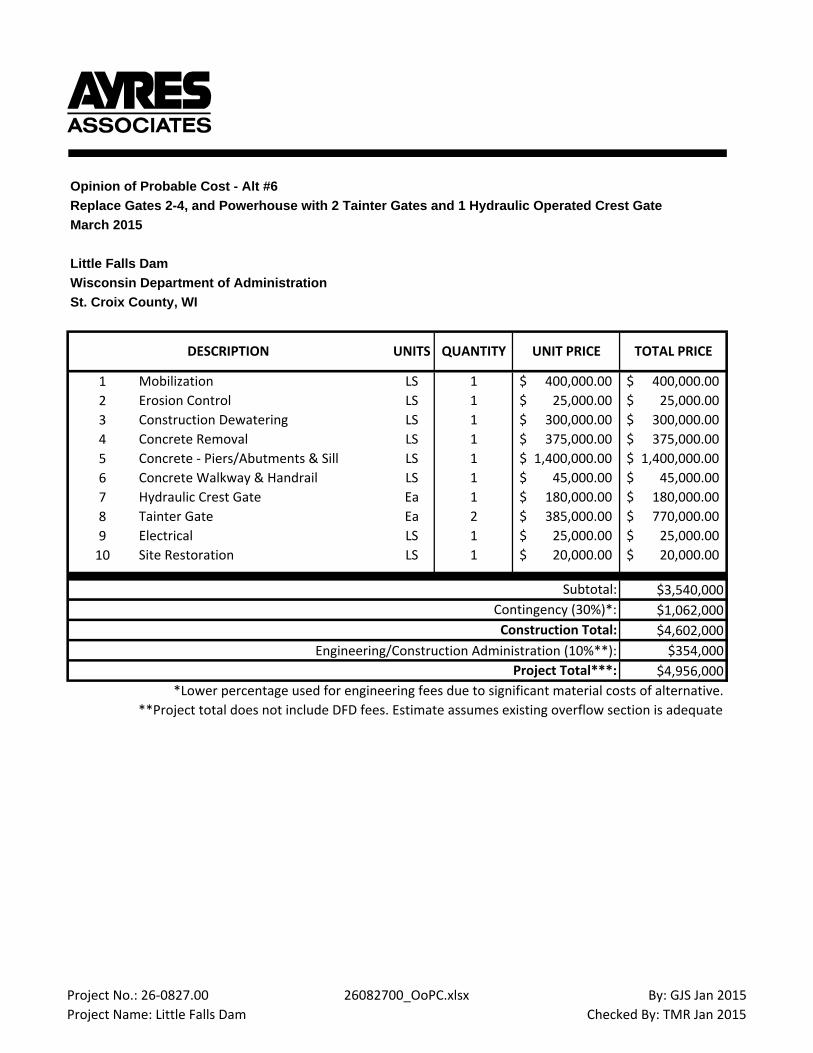
Opinion of Probable Cost - Alt #6Replace Gates 2-4, and Powerhouse with 2 Tainter Gates and 1 Hydraulic Operated Crest GateMarch 2015
Little Falls DamWisconsin Department of AdministrationSt. Croix County, WI
1 Mobilization LS 1 400,000.00$ 400,000.00$ 2 Erosion Control LS 1 25,000.00$ 25,000.00$ 3 Construction Dewatering LS 1 300,000.00$ 300,000.00$ 4 Concrete Removal LS 1 375,000.00$ 375,000.00$ 5 Concrete ‐ Piers/Abutments & Sill LS 1 1,400,000.00$ 1,400,000.00$ 6 Concrete Walkway & Handrail LS 1 45,000.00$ 45,000.00$ 7 Hydraulic Crest Gate Ea 1 180,000.00$ 180,000.00$ 8 Tainter Gate Ea 2 385,000.00$ 770,000.00$ 9 Electrical LS 1 25,000.00$ 25,000.00$ 10 Site Restoration LS 1 20,000.00$ 20,000.00$
$3,540,000$1,062,000$4,602,000
Engineering/Construction Administration (10%**): $354,000$4,956,000
*Lower percentage used for engineering fees due to significant material costs of alternative.**Project total does not include DFD fees. Estimate assumes existing overflow section is adequate
TOTAL PRICE
Subtotal:Contingency (30%)*:Construction Total:
Project Total***:
DESCRIPTION UNITS QUANTITY UNIT PRICE
Project No.: 26‐0827.00Project Name: Little Falls Dam
26082700_OoPC.xlsx By: GJS Jan 2015Checked By: TMR Jan 2015

Opinion of Probable Cost - Alt #7300-ft overflow spillway w/ low level outlet (lowered normal pool)March 2015
Little Falls DamWisconsin Department of AdministrationSt. Croix County, WI
1 Mobilization LS 1 460,000.00$ 460,000.00$ 2 Erosion Control LS 1 25,000.00$ 25,000.00$ 3 Construction Dewatering LS 1 500,000.00$ 500,000.00$ 4 Concrete Removal LS 1 600,000.00$ 600,000.00$ 5 Concrete ‐ Spillway & Abutment LS 1 2,800,000.00$ 2,800,000.00$ 6 5‐ft x 5‐ft Slide Gate LS 1 50,000.00$ 50,000.00$ 7 Downstream Earthwork LS 1 200,000.00$ 200,000.00$ 8 Site Restoration LS 1 20,000.00$ 20,000.00$
$4,655,000$1,396,500$6,051,500
Engineering/Construction Administration (10%*): $465,500$6,517,000
*Lower percentage used for engineering fees due to significant material costs of alternative.**Project total does not include DFD fees.
TOTAL PRICE
Subtotal:Contingency (30%):Construction Total:
Project Total**:
DESCRIPTION UNITS QUANTITY UNIT PRICE
Project No.: 26‐0827.00Project Name: Little Falls Dam
26082700_OoPC.xlsx By: GJS Feb 2015Checked By: TMR Mar 2015
Appendix D
Alternatives Hydraulics
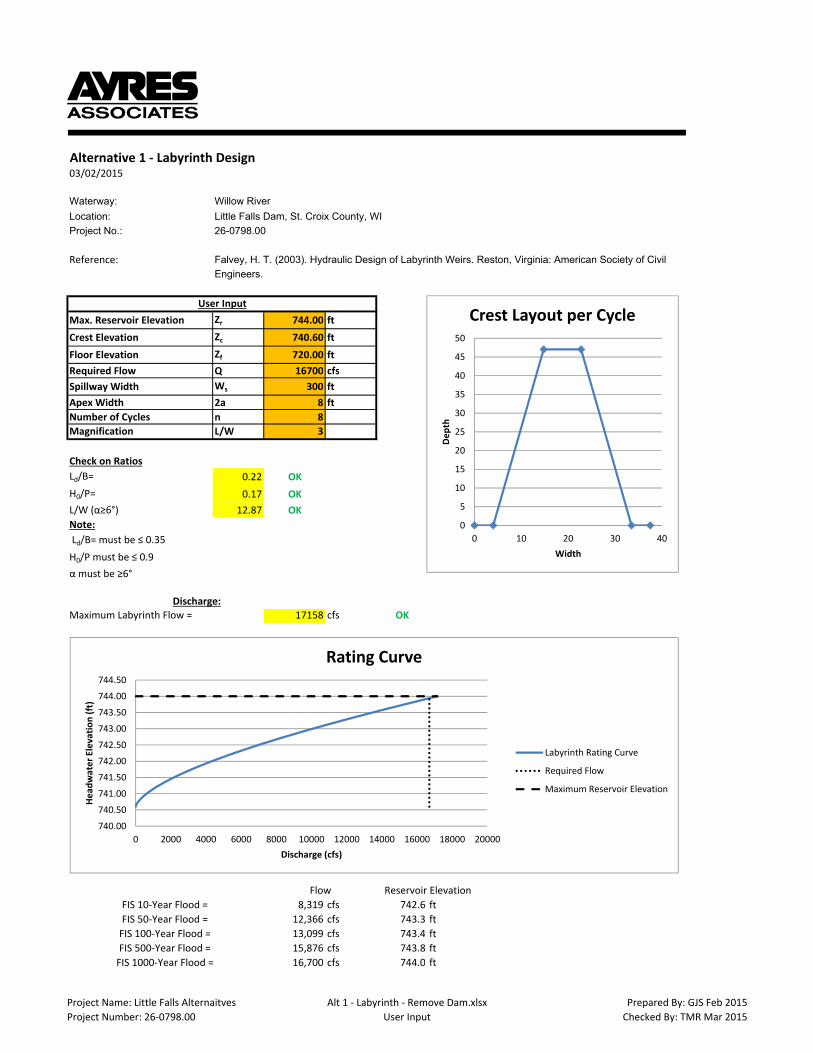
Alternative 1 - Labyrinth Design03/02/2015
Waterway: Willow River
Location: Little Falls Dam, St. Croix County, WI
Project No.: 26-0798.00
Reference: Falvey, H. T. (2003). Hydraulic Design of Labyrinth Weirs. Reston, Virginia: American Society of Civil
Engineers.
Max. Reservoir Elevation Zr 744.00 ft
Crest Elevation Zc 740.60 ft
Floor Elevation Zf 720.00 ft
Required Flow Q 16700 cfs
Spillway Width Ws 300 ft
Apex Width 2a 8 ft
Number of Cycles n 8
Magnification L/W 3
Ld/B= 0.22 OK
H0/P= 0.17 OK
L/W (α≥6°) 12.87 OK
Note:
Ld/B= must be ≤ 0.35
H0/P must be ≤ 0.9
α must be ≥6°
17158 cfs OK
8,319 cfs 742.6 ft
12,366 cfs 743.3 ft
13,099 cfs 743.4 ft
15,876 cfs 743.8 ft
16,700 cfs 744.0 ft
User Input
Check on Ratios
Discharge:
Maximum Labyrinth Flow =
FIS 100-Year Flood =
FIS 500-Year Flood =
FIS 1000-Year Flood =
Flow Reservoir Elevation
FIS 10-Year Flood =
FIS 50-Year Flood =
0
5
10
15
20
25
30
35
40
45
50
0 10 20 30 40
De
pth
Width
Crest Layout per Cycle
740.00
740.50
741.00
741.50
742.00
742.50
743.00
743.50
744.00
744.50
0 2000 4000 6000 8000 10000 12000 14000 16000 18000 20000
He
ad
wa
ter
Ele
va
tio
n (
ft)
Discharge (cfs)
Rating Curve
Labyrinth Rating Curve
Required Flow
Maximum Reservoir Elevation
Project Name: Little Falls Alternaitves
Project Number: 26-0798.00
Alt 1 - Labyrinth - Remove Dam.xlsx
User Input
Prepared By: GJS Feb 2015
Checked By: TMR Mar 2015
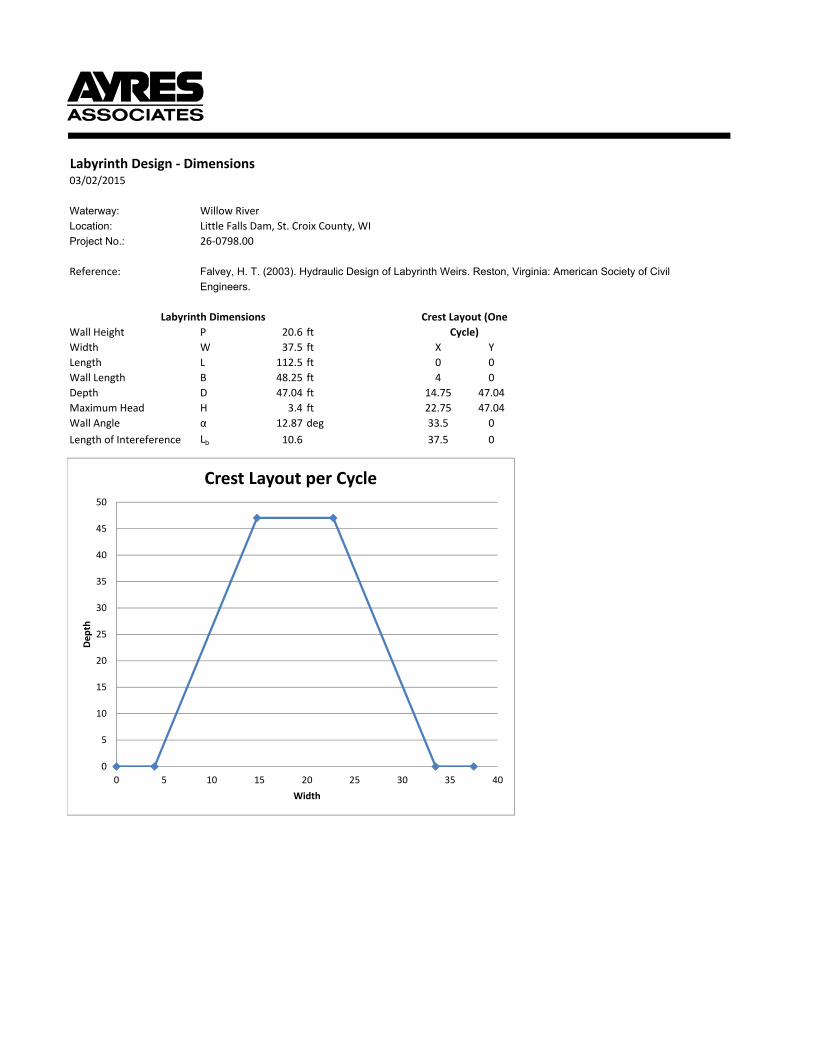
Labyrinth Design - Dimensions03/02/2015
Waterway: Willow River
Location: Little Falls Dam, St. Croix County, WI
Project No.: 26-0798.00
Reference: Falvey, H. T. (2003). Hydraulic Design of Labyrinth Weirs. Reston, Virginia: American Society of Civil
Engineers.
Wall Height P 20.6 ft
Width W 37.5 ft X Y
Length L 112.5 ft 0 0
Wall Length B 48.25 ft 4 0
Depth D 47.04 ft 14.75 47.04
Maximum Head H 3.4 ft 22.75 47.04
Wall Angle α 12.87 deg 33.5 0
Length of Intereference Lb 10.6 37.5 0
Labyrinth Dimensions Crest Layout (One
Cycle)
0
5
10
15
20
25
30
35
40
45
50
0 5 10 15 20 25 30 35 40
De
pth
Width
Crest Layout per Cycle
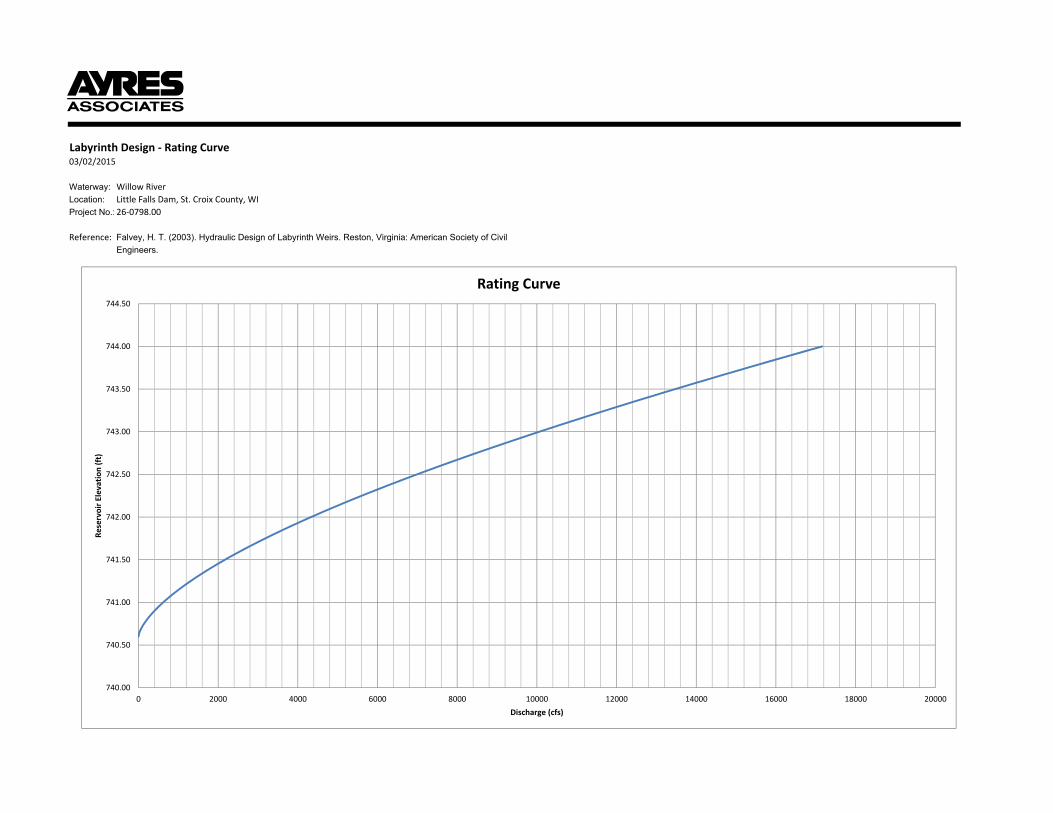
Labyrinth Design - Rating Curve03/02/2015
Waterway: Willow River
Location: Little Falls Dam, St. Croix County, WI
Project No.: 26-0798.00
Reference: Falvey, H. T. (2003). Hydraulic Design of Labyrinth Weirs. Reston, Virginia: American Society of Civil
Engineers.
740.00
740.50
741.00
741.50
742.00
742.50
743.00
743.50
744.00
744.50
0 2000 4000 6000 8000 10000 12000 14000 16000 18000 20000
Re
serv
oir
Ele
va
tio
n (
ft)
Discharge (cfs)
Rating Curve
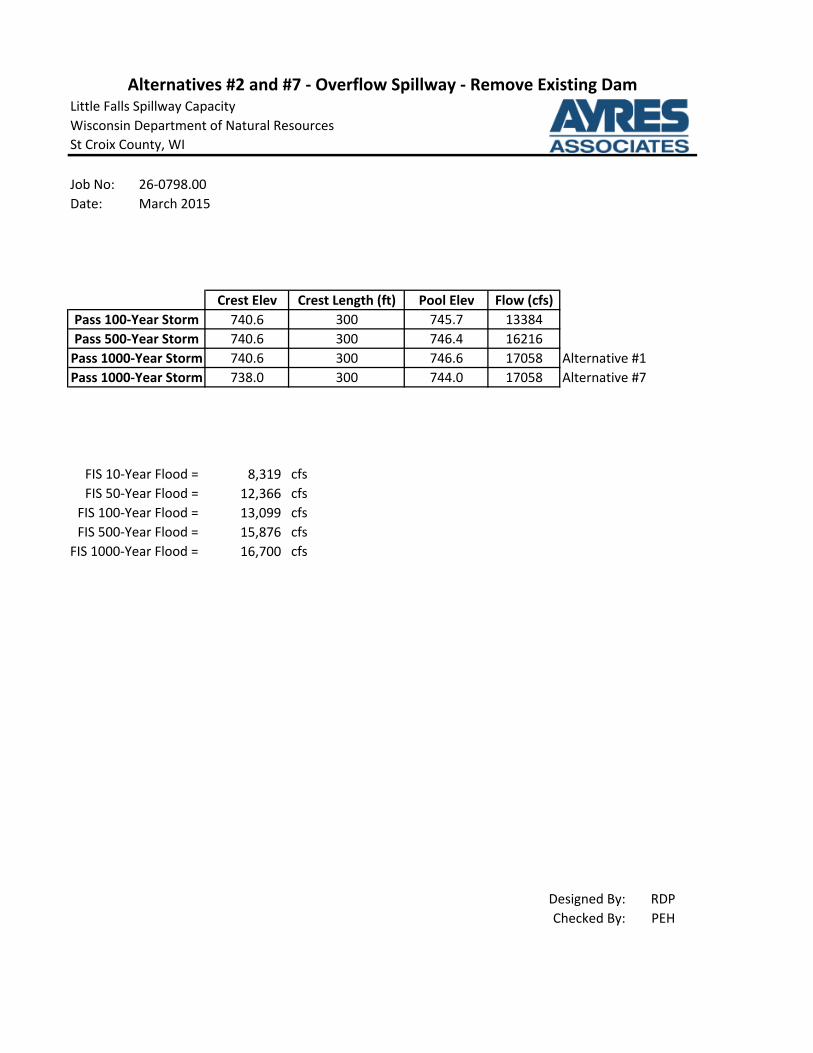
Little Falls Spillway Capacity
Wisconsin Department of Natural Resources
St Croix County, WI
Job No: 26-0798.00
Date: March 2015
Crest Elev Crest Length (ft) Pool Elev Flow (cfs)
740.6 300 745.7 13384
740.6 300 746.4 16216
740.6 300 746.6 17058 Alternative #1
738.0 300 744.0 17058 Alternative #7
FIS 10-Year Flood = 8,319 cfs
FIS 50-Year Flood = 12,366 cfs
FIS 100-Year Flood = 13,099 cfs
FIS 500-Year Flood = 15,876 cfs
FIS 1000-Year Flood = 16,700 cfs
Designed By: RDP
Checked By: PEH
Pass 100-Year Storm
Pass 500-Year Storm
Pass 1000-Year Storm
Pass 1000-Year Storm
Alternatives #2 and #7 - Overflow Spillway - Remove Existing Dam

Little Falls Spillway Capacity
Wisconsin Department of Natural Resources
St Croix County, WI
Pool Elevation: 745.7 ft Job No: 26-0798.00
Tailwater Elevation: 729.0 ft Crest Elevation: 740.6 ft Date: March 2015
Upstream Silt Elevation: 726.1 ft Max Design Pool Elevation: 745.7 ft
Weir Flow
Design of Small Dams; US Department of Interior
Co = 3.9 Discharge Coefficient - Figure 9-23
P/Ho = 2.8
P= 14.5 ft Crest Elev - Upstream Silt Elevation
Ho= 5.1 ft Pool Elevation - Crest Elev
He = 5.1 ft ha + ho
ho = 5.1 Pool Elevation - Crest Elev
ha = 0.08 ft q2/(2g(P+ho)
2)
q= 44.9 cfs C ho3/2
va= 2.3 ft/s q/(P-ho)
He/Hd = 1.0
Hd = 5.1 ft
L = L' - 2 (N Kp +Ka) He Effective Length of Spillway
L = 297.96 ft
L1'= 300 ft Total Length of Spillway
L'= 300 ft Net Length of Spillway
Pier Length= 0 ft
Length Per Pier= 0.0 ft
Number of Piers (N)= 0
Kp= 0.0 Design of Small Dams; US Department of Interior; Pg 368
Ka= 0.2 Design of Small Dams; US Department of Interior; Pg 368; 1 Abutment.
Discharge Coefficient (Cs/Co) = 1 Design of Small Dams ; US Department of Interior; Figure 9-28
hd/He = 3.27
Q= 13384 cfs
Total Flow for Spillway = 13384 cfs
Designed By: RDP
Checked By: GJS
Alternatives #2 - Overflow Spillway (100-yr Storm)
Q = Co L He3/2
(Cs/Co)
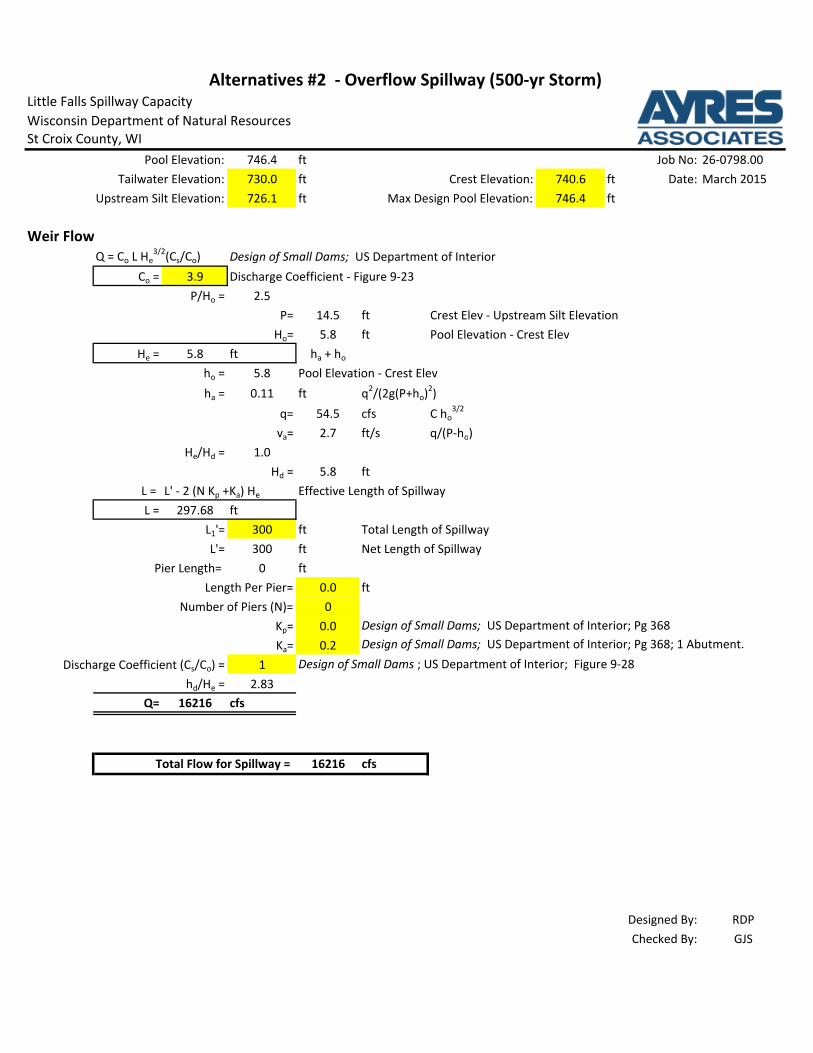
Little Falls Spillway Capacity
Wisconsin Department of Natural Resources
St Croix County, WI
Pool Elevation: 746.4 ft Job No: 26-0798.00
Tailwater Elevation: 730.0 ft Crest Elevation: 740.6 ft Date: March 2015
Upstream Silt Elevation: 726.1 ft Max Design Pool Elevation: 746.4 ft
Weir Flow
Design of Small Dams; US Department of Interior
Co = 3.9 Discharge Coefficient - Figure 9-23
P/Ho = 2.5
P= 14.5 ft Crest Elev - Upstream Silt Elevation
Ho= 5.8 ft Pool Elevation - Crest Elev
He = 5.8 ft ha + ho
ho = 5.8 Pool Elevation - Crest Elev
ha = 0.11 ft q2/(2g(P+ho)
2)
q= 54.5 cfs C ho3/2
va= 2.7 ft/s q/(P-ho)
He/Hd = 1.0
Hd = 5.8 ft
L = L' - 2 (N Kp +Ka) He Effective Length of Spillway
L = 297.68 ft
L1'= 300 ft Total Length of Spillway
L'= 300 ft Net Length of Spillway
Pier Length= 0 ft
Length Per Pier= 0.0 ft
Number of Piers (N)= 0
Kp= 0.0 Design of Small Dams; US Department of Interior; Pg 368
Ka= 0.2 Design of Small Dams; US Department of Interior; Pg 368; 1 Abutment.
Discharge Coefficient (Cs/Co) = 1 Design of Small Dams ; US Department of Interior; Figure 9-28
hd/He = 2.83
Q= 16216 cfs
Total Flow for Spillway = 16216 cfs
Designed By: RDP
Checked By: GJS
Alternatives #2 - Overflow Spillway (500-yr Storm)
Q = Co L He3/2
(Cs/Co)

Little Falls Spillway Capacity
Wisconsin Department of Natural Resources
St Croix County, WI
Pool Elevation: 746.6 ft Job No: 26-0798.00
Tailwater Elevation: 731.0 ft Crest Elevation: 740.6 ft Date: March 2015
Upstream Silt Elevation: 726.1 ft Max Design Pool Elevation: 746.6 ft
Weir Flow
Design of Small Dams; US Department of Interior
Co = 3.9 Discharge Coefficient - Figure 9-23
P/Ho = 2.4
P= 14.5 ft Crest Elev - Upstream Silt Elevation
Ho= 6.0 ft Pool Elevation - Crest Elev
He = 6.0 ft ha + ho
ho = 6.0 Pool Elevation - Crest Elev
ha = 0.12 ft q2/(2g(P+ho)
2)
q= 57.3 cfs C ho3/2
va= 2.8 ft/s q/(P-ho)
He/Hd = 1.0
Hd = 6.0 ft
L = L' - 2 (N Kp +Ka) He Effective Length of Spillway
L = 297.60 ft
L1'= 300 ft Total Length of Spillway
L'= 300 ft Net Length of Spillway
Pier Length= 0 ft
Length Per Pier= 0.0 ft
Number of Piers (N)= 0
Kp= 0.0 Design of Small Dams; US Department of Interior; Pg 368
Ka= 0.2 Design of Small Dams; US Department of Interior; Pg 368; 1 Abutment.
Discharge Coefficient (Cs/Co) = 1 Design of Small Dams ; US Department of Interior; Figure 9-28
hd/He = 2.60
Q= 17058 cfs
Total Flow for Spillway = 17058 cfs
Designed By: RDP
Checked By: GJS
Alternatives #2 - Overflow Spillway (1000-yr Storm)
Q = Co L He3/2
(Cs/Co)

Little Falls Spillway Capacity
Wisconsin Department of Natural Resources
St Croix County, WI
Pool Elevation: 744.0 ft Job No: 26-0798.00
Tailwater Elevation: 731.0 ft Crest Elevation: 738.0 ft Date: March 2015
Upstream Silt Elevation: 726.1 ft Max Design Pool Elevation: 744.0 ft
Weir Flow
Design of Small Dams; US Department of Interior
Co = 3.9 Discharge Coefficient - Figure 9-23
P/Ho = 2.0
P= 11.9 ft Crest Elev - Upstream Silt Elevation
Ho= 6.0 ft Pool Elevation - Crest Elev
He = 6.0 ft ha + ho
ho = 6.0 Pool Elevation - Crest Elev
ha = 0.16 ft q2/(2g(P+ho)
2)
q= 57.3 cfs C ho3/2
va= 3.2 ft/s q/(P-ho)
He/Hd = 1.0
Hd = 6.0 ft
L = L' - 2 (N Kp +Ka) He Effective Length of Spillway
L = 297.60 ft
L1'= 300 ft Total Length of Spillway
L'= 300 ft Net Length of Spillway
Pier Length= 0 ft
Length Per Pier= 0.0 ft
Number of Piers (N)= 0
Kp= 0.0 Design of Small Dams; US Department of Interior; Pg 368
Ka= 0.2 Design of Small Dams; US Department of Interior; Pg 368; 1 Abutment.
Discharge Coefficient (Cs/Co) = 1 Design of Small Dams ; US Department of Interior; Figure 9-28
hd/He = 2.17
Q= 17058 cfs
Total Flow for Spillway = 17058 cfs
Designed By: RDP
Checked By: GJS
Alternatives #7 - Overflow Spillway (1000-yr Storm)
Q = Co L He3/2
(Cs/Co)
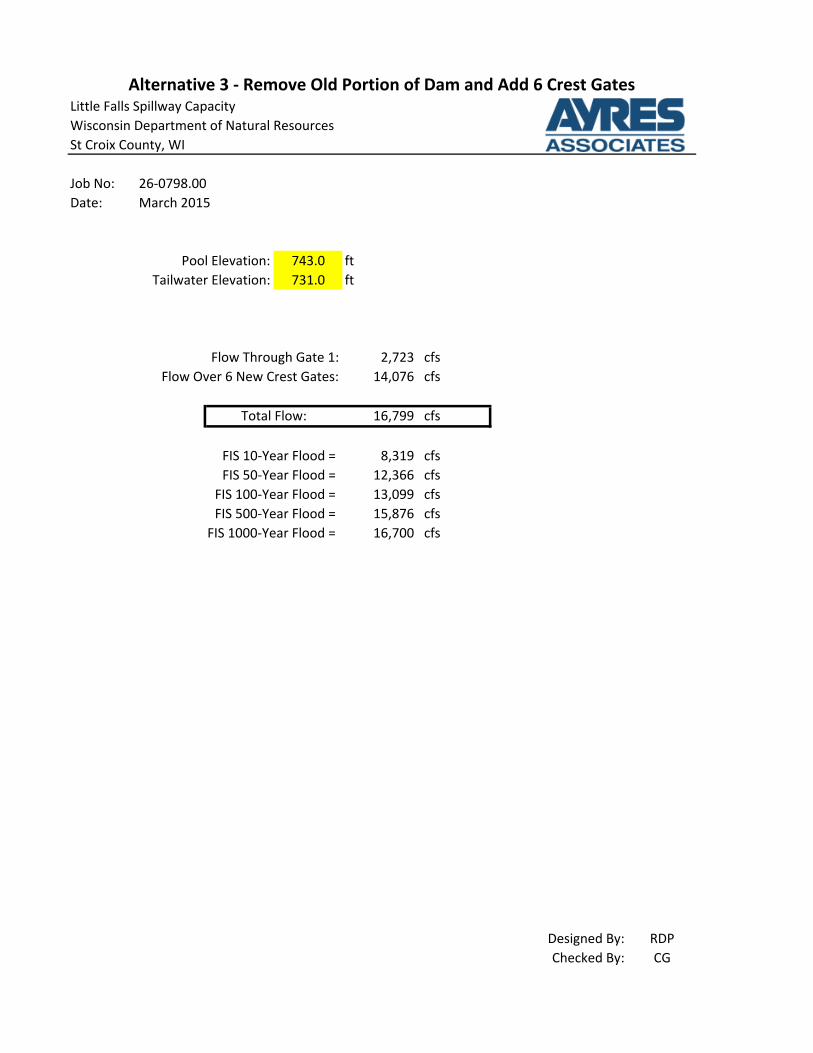
Job No: 26-0798.00
Date: March 2015
Pool Elevation: 743.0 ft
Tailwater Elevation: 731.0 ft
Flow Through Gate 1: 2,723 cfs
Flow Over 6 New Crest Gates: 14,076 cfs
16,799 cfs
FIS 10-Year Flood = 8,319 cfs
FIS 50-Year Flood = 12,366 cfs
FIS 100-Year Flood = 13,099 cfs
FIS 500-Year Flood = 15,876 cfs
FIS 1000-Year Flood = 16,700 cfs
Designed By: RDP
Checked By: CG
Little Falls Spillway Capacity
Wisconsin Department of Natural Resources
St Croix County, WI
Alternative 3 - Remove Old Portion of Dam and Add 6 Crest Gates
Total Flow:
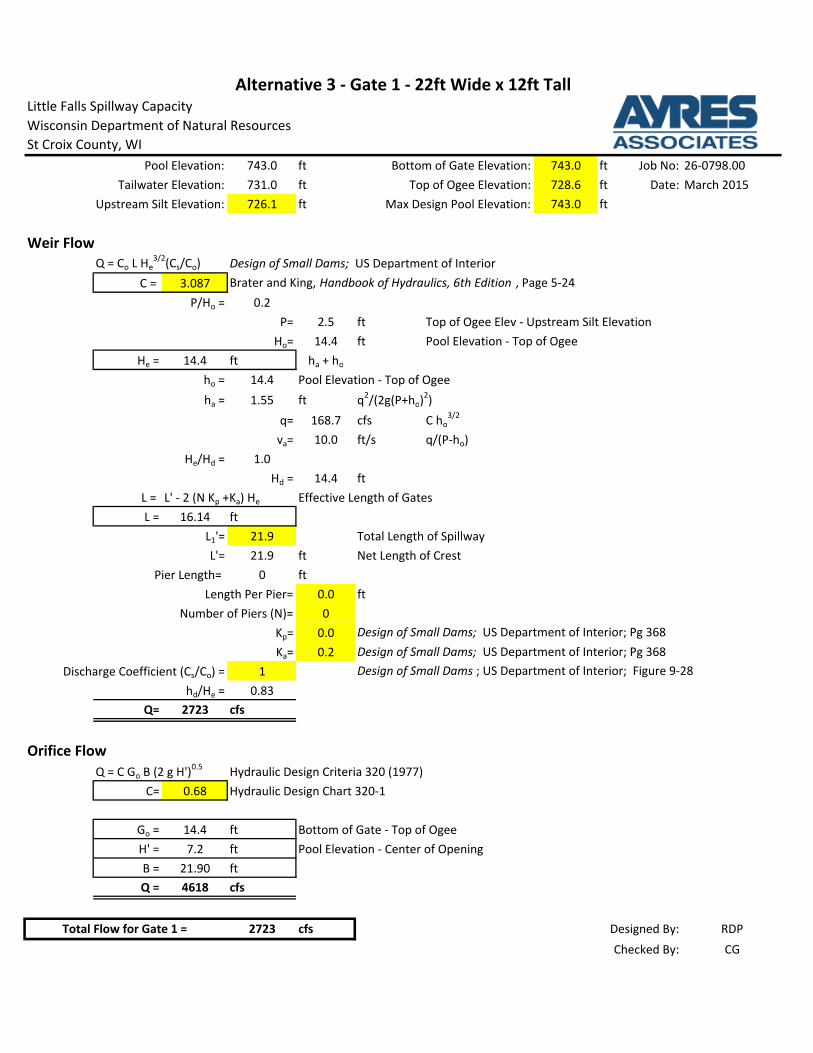
Pool Elevation: 743.0 ft Bottom of Gate Elevation: 743.0 ft Job No: 26-0798.00
Tailwater Elevation: 731.0 ft Top of Ogee Elevation: 728.6 ft Date: March 2015
Upstream Silt Elevation: 726.1 ft Max Design Pool Elevation: 743.0 ft
Weir Flow
Design of Small Dams; US Department of Interior
C = 3.087 Brater and King, Handbook of Hydraulics, 6th Edition , Page 5-24
P/Ho = 0.2
P= 2.5 ft Top of Ogee Elev - Upstream Silt Elevation
Ho= 14.4 ft Pool Elevation - Top of Ogee
He = 14.4 ft ha + ho
ho = 14.4 Pool Elevation - Top of Ogee
ha = 1.55 ft q2/(2g(P+ho)
2)
q= 168.7 cfs C ho3/2
va= 10.0 ft/s q/(P-ho)
He/Hd = 1.0
Hd = 14.4 ft
L = L' - 2 (N Kp +Ka) He Effective Length of Gates
L = 16.14 ft
L1'= 21.9 Total Length of Spillway
L'= 21.9 ft Net Length of Crest
Pier Length= 0 ft
Length Per Pier= 0.0 ft
Number of Piers (N)= 0
Kp= 0.0 Design of Small Dams; US Department of Interior; Pg 368
Ka= 0.2 Design of Small Dams; US Department of Interior; Pg 368
Discharge Coefficient (Cs/Co) = 1 Design of Small Dams ; US Department of Interior; Figure 9-28
hd/He = 0.83
Q= 2723 cfs
Orifice Flow
Q = C Go B (2 g H')0.5
Hydraulic Design Criteria 320 (1977)
C= 0.68 Hydraulic Design Chart 320-1
Go = 14.4 ft Bottom of Gate - Top of Ogee
H' = 7.2 ft Pool Elevation - Center of Opening
B = 21.90 ft
Q = 4618 cfs
2723 cfs Designed By: RDP
Checked By: CG
Q = Co L He3/2
(Cs/Co)
Total Flow for Gate 1 =
Alternative 3 - Gate 1 - 22ft Wide x 12ft Tall
Little Falls Spillway Capacity
Wisconsin Department of Natural Resources
St Croix County, WI

Pool Elevation: 743.0 ft Job No: 26-0798.00
Tailwater Elevation: 731 ft Top of Ogee Elevation: 730.9 ft Date: March 2015
Upstream Silt Elevation: 726.0 ft Max Design Pool Elevation: 743.0 ft
Weir Flow
Design of Small Dams; US Department of Interior
Co = 2.63 Design of Small Dams; US Department of Interior, Figure 9-23
P/Ho = 0.4
P= 4.9 ft Top of Ogee Elev - Upstream Silt Elevation
Ho= 12.1 ft Pool Elevation - Top of Ogee
He = 12.1 ft ha + ho
ho = 12.1 Pool Elevation - Top of Ogee
ha = 0.66 ft q2/(2g(P+ho)
2)
q= 110.7 cfs C ho3/2
va= 6.5 ft/s q/(P-ho)
He/Hd = 1.0
Hd = 12.1 ft
L = L' - 2 (N Kp +Ka) He Effective Length of Gates
L = 127.16 ft
L1'= 153 Total Length of Spillway
L'= 132 ft Net Length of Crest
Pier Length= 21 ft
Length Per Pier= 3.00 ft
Number of Piers (N)= 7
Kp= 0.0 Design of Small Dams; US Department of Interior; Pg 368
Ka= 0.2 Design of Small Dams; US Department of Interior; Pg 368
Discharge Coefficient (Cs/Co) = 1 Design of Small Dams ; US Department of Interior; Figure 9-28
hd/He = 0.99
Q= 14076 cfs
Designed By: RDP
Checked By: CG
Alternative 3 - Crest Gates (6 - 22ft x 10.6ft)
Little Falls Spillway Capacity
Wisconsin Department of Natural Resources
St Croix County, WI
Q = Co L He3/2
(Cs/Co)
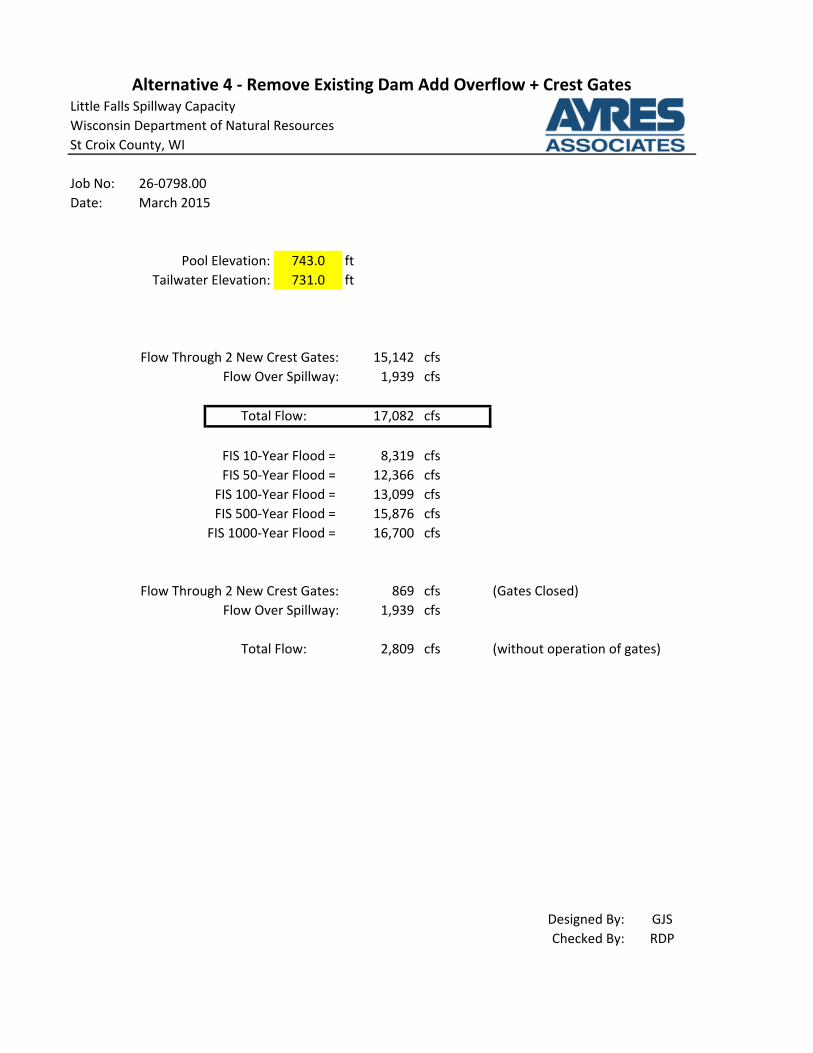
Job No: 26-0798.00
Date: March 2015
Pool Elevation: 743.0 ft
Tailwater Elevation: 731.0 ft
Flow Through 2 New Crest Gates: 15,142 cfs
Flow Over Spillway: 1,939 cfs
17,082 cfs
FIS 10-Year Flood = 8,319 cfs
FIS 50-Year Flood = 12,366 cfs
FIS 100-Year Flood = 13,099 cfs
FIS 500-Year Flood = 15,876 cfs
FIS 1000-Year Flood = 16,700 cfs
Flow Through 2 New Crest Gates: 869 cfs (Gates Closed)
Flow Over Spillway: 1,939 cfs
2,809 cfs (without operation of gates)
Designed By: GJS
Checked By: RDP
Total Flow:
Little Falls Spillway Capacity
Wisconsin Department of Natural Resources
St Croix County, WI
Alternative 4 - Remove Existing Dam Add Overflow + Crest Gates
Total Flow:
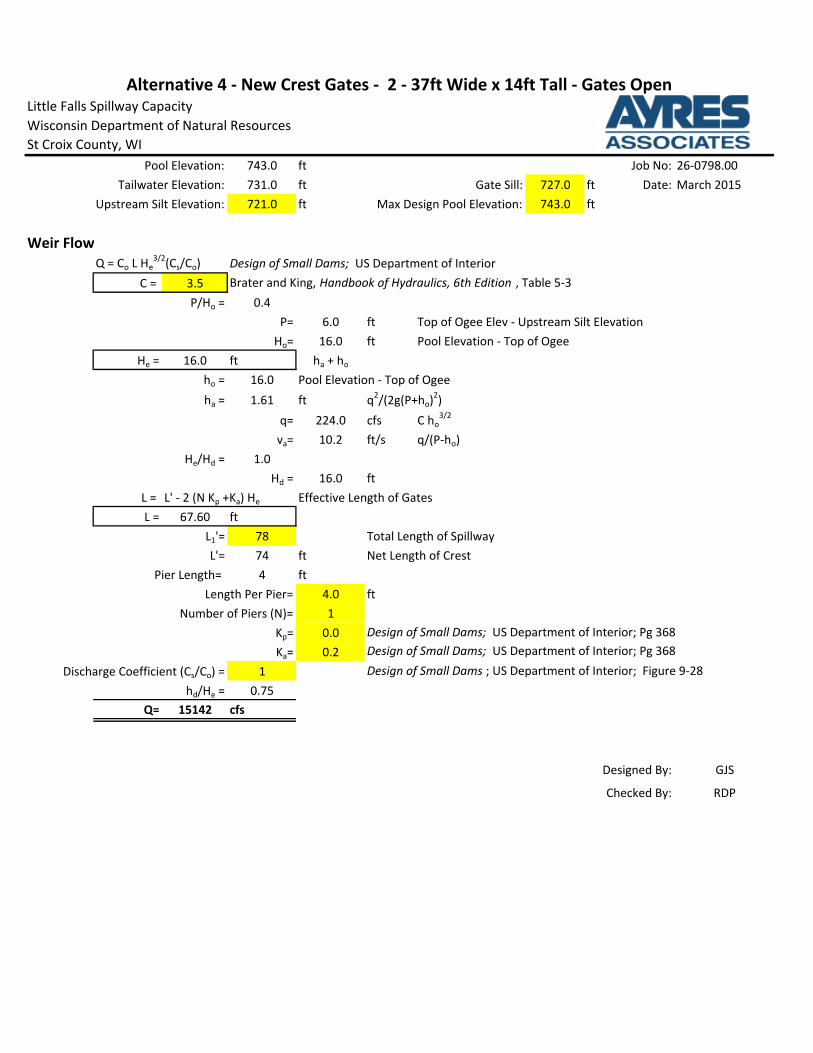
Pool Elevation: 743.0 ft Job No: 26-0798.00
Tailwater Elevation: 731.0 ft Gate Sill: 727.0 ft Date: March 2015
Upstream Silt Elevation: 721.0 ft Max Design Pool Elevation: 743.0 ft
Weir Flow
Design of Small Dams; US Department of Interior
C = 3.5 Brater and King, Handbook of Hydraulics, 6th Edition , Table 5-3
P/Ho = 0.4
P= 6.0 ft Top of Ogee Elev - Upstream Silt Elevation
Ho= 16.0 ft Pool Elevation - Top of Ogee
He = 16.0 ft ha + ho
ho = 16.0 Pool Elevation - Top of Ogee
ha = 1.61 ft q2/(2g(P+ho)
2)
q= 224.0 cfs C ho3/2
va= 10.2 ft/s q/(P-ho)
He/Hd = 1.0
Hd = 16.0 ft
L = L' - 2 (N Kp +Ka) He Effective Length of Gates
L = 67.60 ft
L1'= 78 Total Length of Spillway
L'= 74 ft Net Length of Crest
Pier Length= 4 ft
Length Per Pier= 4.0 ft
Number of Piers (N)= 1
Kp= 0.0 Design of Small Dams; US Department of Interior; Pg 368
Ka= 0.2 Design of Small Dams; US Department of Interior; Pg 368
Discharge Coefficient (Cs/Co) = 1 Design of Small Dams ; US Department of Interior; Figure 9-28
hd/He = 0.75
Q= 15142 cfs
Designed By: GJS
Checked By: RDP
Alternative 4 - New Crest Gates - 2 - 37ft Wide x 14ft Tall - Gates Open
Little Falls Spillway Capacity
Wisconsin Department of Natural Resources
St Croix County, WI
Q = Co L He3/2
(Cs/Co)
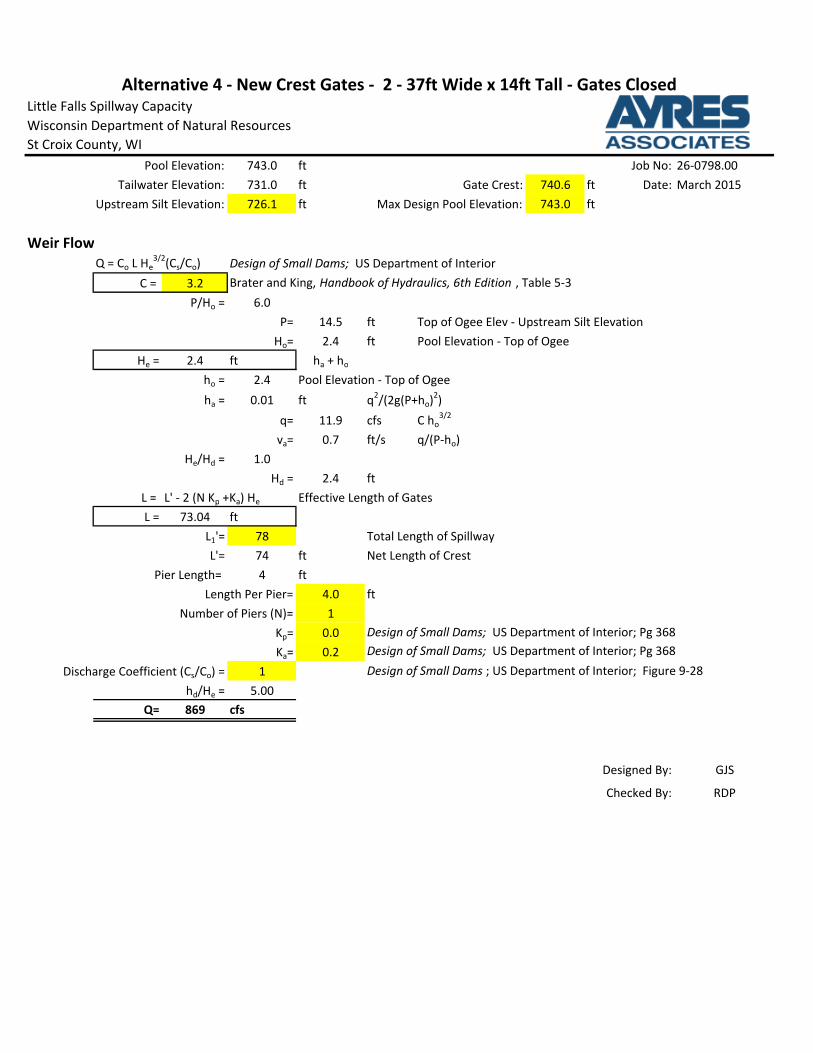
Pool Elevation: 743.0 ft Job No: 26-0798.00
Tailwater Elevation: 731.0 ft Gate Crest: 740.6 ft Date: March 2015
Upstream Silt Elevation: 726.1 ft Max Design Pool Elevation: 743.0 ft
Weir Flow
Design of Small Dams; US Department of Interior
C = 3.2 Brater and King, Handbook of Hydraulics, 6th Edition , Table 5-3
P/Ho = 6.0
P= 14.5 ft Top of Ogee Elev - Upstream Silt Elevation
Ho= 2.4 ft Pool Elevation - Top of Ogee
He = 2.4 ft ha + ho
ho = 2.4 Pool Elevation - Top of Ogee
ha = 0.01 ft q2/(2g(P+ho)
2)
q= 11.9 cfs C ho3/2
va= 0.7 ft/s q/(P-ho)
He/Hd = 1.0
Hd = 2.4 ft
L = L' - 2 (N Kp +Ka) He Effective Length of Gates
L = 73.04 ft
L1'= 78 Total Length of Spillway
L'= 74 ft Net Length of Crest
Pier Length= 4 ft
Length Per Pier= 4.0 ft
Number of Piers (N)= 1
Kp= 0.0 Design of Small Dams; US Department of Interior; Pg 368
Ka= 0.2 Design of Small Dams; US Department of Interior; Pg 368
Discharge Coefficient (Cs/Co) = 1 Design of Small Dams ; US Department of Interior; Figure 9-28
hd/He = 5.00
Q= 869 cfs
Designed By: GJS
Checked By: RDP
Alternative 4 - New Crest Gates - 2 - 37ft Wide x 14ft Tall - Gates Closed
Little Falls Spillway Capacity
Wisconsin Department of Natural Resources
St Croix County, WI
Q = Co L He3/2
(Cs/Co)

Pool Elevation: 743.0 ft Job No: 26-0798.00
Tailwater Elevation: 731 ft Top of Ogee Elevation: 740.6 ft Date: March 2015
Upstream Silt Elevation: 735.0 ft Max Design Pool Elevation: 743.0 ft
Weir Flow
Design of Small Dams; US Department of Interior
Co = 3.5 Discharge Coefficient - Figure 9-23
P/Ho = 2.3
P= 5.6 ft Top of Ogee Elev - Upstream Silt Elevation
Ho= 2.4 ft Pool Elevation - Top of Ogee
He = 2.4 ft ha + ho
ho = 2.4 Pool Elevation - Top of Ogee
ha = 0.04 ft q2/(2g(P+ho)
2)
q= 13.0 cfs C ho3/2
va= 1.6 ft/s q/(P-ho)
He/Hd = 1.0
Hd = 2.4 ft
L = L' - 2 (N Kp +Ka) He Effective Length of Gates
L = 149.04 ft
L1'= 150 Total Length of Spillway
L'= 150 ft Net Length of Crest
Pier Length= 0 ft
Length Per Pier= 0.00 ft
Number of Piers (N)= 0
Kp= 0.0 Design of Small Dams; US Department of Interior; Pg 368
Ka= 0.2 Design of Small Dams; US Department of Interior; Pg 368.
Discharge Coefficient (Cs/Co) = 1 Design of Small Dams ; US Department of Interior; Figure 9-28
hd/He = 5.00
Q= 1939 cfs
Designed By: GJS
Checked By: RDP
Alternative 4 - Overflow Spillway 150-ft long @ Normal Pool
Little Falls Spillway Capacity
Wisconsin Department of Natural Resources
St Croix County, WI
Q = Co L He3/2
(Cs/Co)

Job No: 26-0798.00
Date: March 2015
Pool Elevation: 743.0 ft
Tailwater Elevation: 731.0 ft
Flow Through 2 New Tainter Gates: 15,035 cfs
Flow Over Spillway: 1,939 cfs
16,974 cfs
FIS 10-Year Flood = 8,319 cfs
FIS 50-Year Flood = 12,366 cfs
FIS 100-Year Flood = 13,099 cfs
FIS 500-Year Flood = 15,876 cfs
FIS 1000-Year Flood = 16,700 cfs
Designed By: GJS
Checked By: RDP
Little Falls Spillway Capacity
Wisconsin Department of Natural Resources
St Croix County, WI
Alternative 5 - Remove Existing Dam add Overflow + Tainter Gates
Total Flow:

Pool Elevation: 743.0 ft Job No: 26-0798.00
Tailwater Elevation: 731.0 ft Top of Ogee Elevation: 718.0 ft Date: March 2015
Upstream Silt Elevation: 718.0 ft Max Design Pool Elevation: 743.0 ft
Weir Flow
Design of Small Dams; US Department of Interior
C = 3.1 Design of Small Dams; US Department of Interior, Table 9-23
P/Ho = 0.0
P= 0.0 ft Top of Ogee Elev - Upstream Silt Elevation
Ho= 25.0 ft Pool Elevation - Top of Ogee
He = 25.0 ft ha + ho
ho = 25.0 Pool Elevation - Top of Ogee
ha = 3.73 ft q2/(2g(P+ho)
2)
q= 387.5 cfs C ho3/2
va= 15.5 ft/s q/(P-ho)
He/Hd = 1.0
Hd = 25.0 ft
L = L' - 2 (N Kp +Ka) He Effective Length of Gates
L = 40.00 ft
L1'= 54 Total Length of Spillway
L'= 50 ft Net Length of Crest
Pier Length= 4 ft
Length Per Pier= 4.0 ft
Number of Piers (N)= 1
Kp= 0.0 Design of Small Dams; US Department of Interior; Pg 368
Ka= 0.2 Design of Small Dams; US Department of Interior; Pg 368
Discharge Coefficient (Cs/Co) = 0.97 Design of Small Dams ; US Department of Interior; Figure 9-28
hd/He = 0.48
Q= 15035 cfs
Designed By: GJS
Checked By: RDP
Alternative 5 - 2 New Tainter Gates - 25ft Wide by 25ft Tall
Little Falls Spillway Capacity
Wisconsin Department of Natural Resources
St Croix County, WI
Q = Co L He3/2
(Cs/Co)
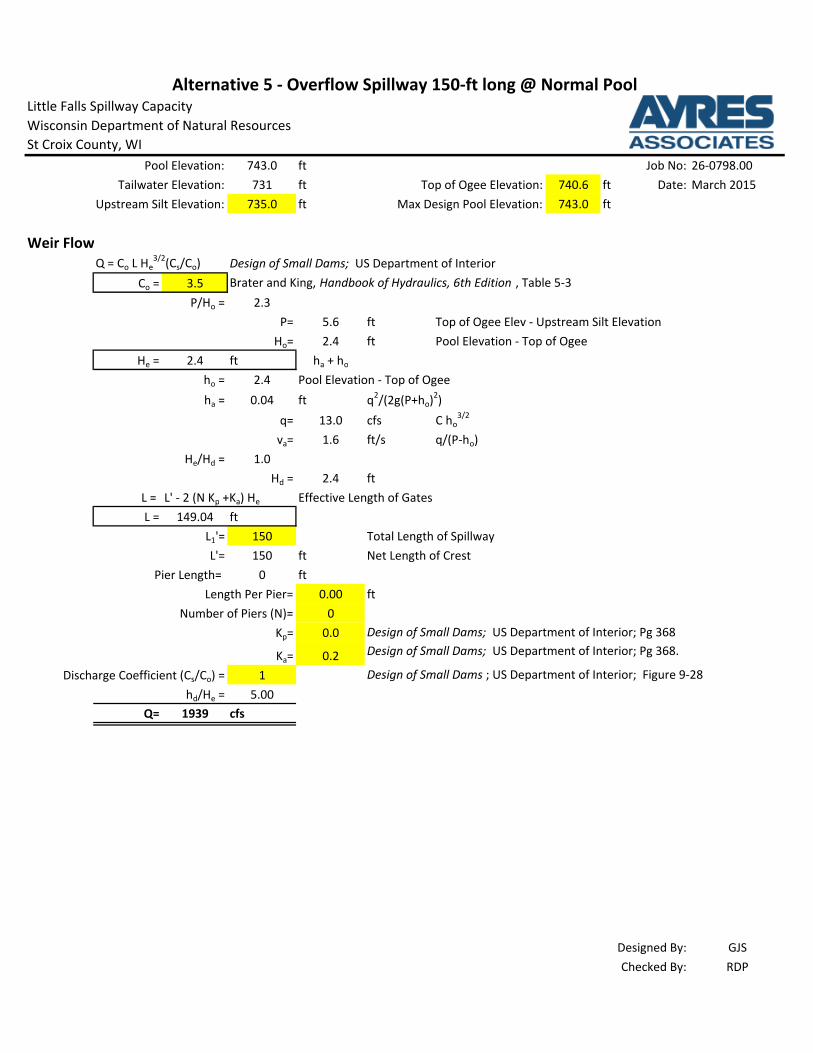
Pool Elevation: 743.0 ft Job No: 26-0798.00
Tailwater Elevation: 731 ft Top of Ogee Elevation: 740.6 ft Date: March 2015
Upstream Silt Elevation: 735.0 ft Max Design Pool Elevation: 743.0 ft
Weir Flow
Design of Small Dams; US Department of Interior
Co = 3.5 Brater and King, Handbook of Hydraulics, 6th Edition , Table 5-3
P/Ho = 2.3
P= 5.6 ft Top of Ogee Elev - Upstream Silt Elevation
Ho= 2.4 ft Pool Elevation - Top of Ogee
He = 2.4 ft ha + ho
ho = 2.4 Pool Elevation - Top of Ogee
ha = 0.04 ft q2/(2g(P+ho)
2)
q= 13.0 cfs C ho3/2
va= 1.6 ft/s q/(P-ho)
He/Hd = 1.0
Hd = 2.4 ft
L = L' - 2 (N Kp +Ka) He Effective Length of Gates
L = 149.04 ft
L1'= 150 Total Length of Spillway
L'= 150 ft Net Length of Crest
Pier Length= 0 ft
Length Per Pier= 0.00 ft
Number of Piers (N)= 0
Kp= 0.0 Design of Small Dams; US Department of Interior; Pg 368
Ka= 0.2 Design of Small Dams; US Department of Interior; Pg 368.
Discharge Coefficient (Cs/Co) = 1 Design of Small Dams ; US Department of Interior; Figure 9-28
hd/He = 5.00
Q= 1939 cfs
Designed By: GJS
Checked By: RDP
Alternative 5 - Overflow Spillway 150-ft long @ Normal Pool
Little Falls Spillway Capacity
Wisconsin Department of Natural Resources
St Croix County, WI
Q = Co L He3/2
(Cs/Co)
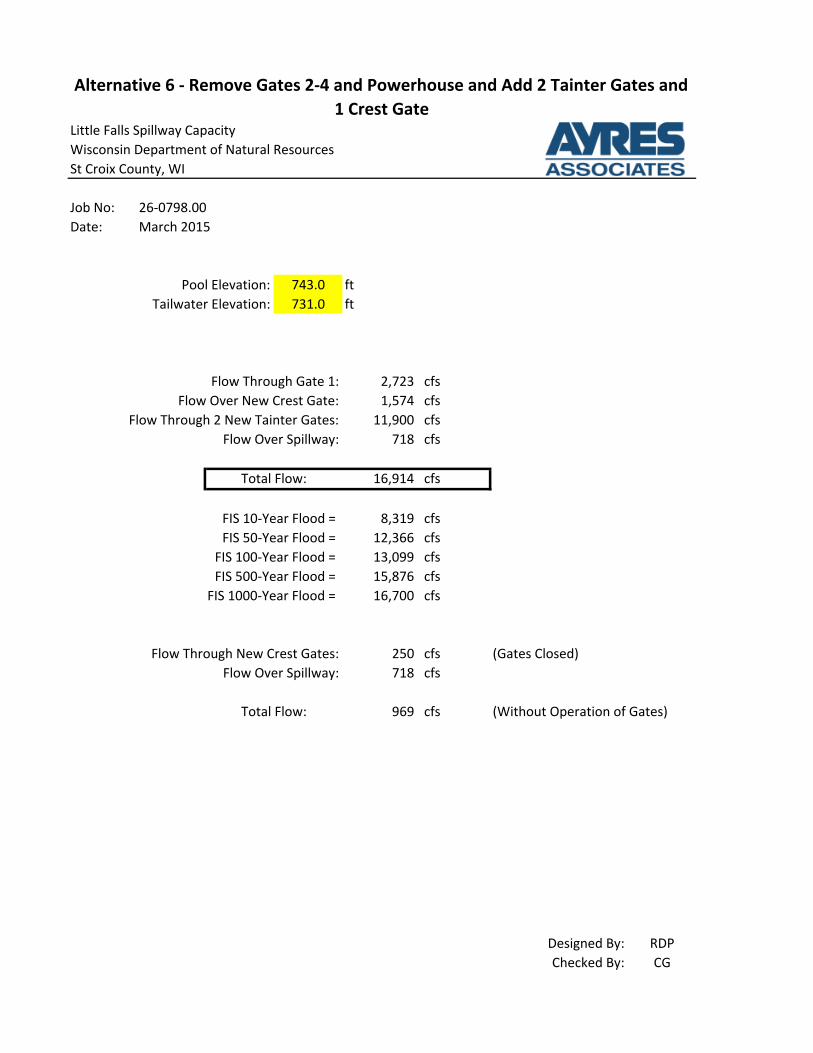
Job No: 26-0798.00
Date: March 2015
Pool Elevation: 743.0 ft
Tailwater Elevation: 731.0 ft
Flow Through Gate 1: 2,723 cfs
Flow Over New Crest Gate: 1,574 cfs
Flow Through 2 New Tainter Gates: 11,900 cfs
Flow Over Spillway: 718 cfs
16,914 cfs
FIS 10-Year Flood = 8,319 cfs
FIS 50-Year Flood = 12,366 cfs
FIS 100-Year Flood = 13,099 cfs
FIS 500-Year Flood = 15,876 cfs
FIS 1000-Year Flood = 16,700 cfs
Flow Through New Crest Gates: 250 cfs (Gates Closed)
Flow Over Spillway: 718 cfs
969 cfs (Without Operation of Gates)
Designed By: RDP
Checked By: CG
Alternative 6 - Remove Gates 2-4 and Powerhouse and Add 2 Tainter Gates and
1 Crest Gate
Total Flow:
Little Falls Spillway Capacity
Wisconsin Department of Natural Resources
St Croix County, WI
Total Flow:

Pool Elevation: 743.0 ft Bottom of Gate Elevation: 743.0 ft Job No: 26-0798.00
Tailwater Elevation: 731.0 ft Top of Ogee Elevation: 728.6 ft Date: March 2015
Upstream Silt Elevation: 726.1 ft Max Design Pool Elevation: 743.0 ft
Weir Flow
Design of Small Dams; US Department of Interior
C = 3.087 Brater and King, Handbook of Hydraulics, 6th Edition , Page 5-24
P/Ho = 0.2
P= 2.5 ft Top of Ogee Elev - Upstream Silt Elevation
Ho= 14.4 ft Pool Elevation - Top of Ogee
He = 14.4 ft ha + ho
ho = 14.4 Pool Elevation - Top of Ogee
ha = 1.55 ft q2/(2g(P+ho)
2)
q= 168.7 cfs C ho3/2
va= 10.0 ft/s q/(P-ho)
He/Hd = 1.0
Hd = 14.4 ft
L = L' - 2 (N Kp +Ka) He Effective Length of Gates
L = 16.14 ft
L1'= 21.9 Total Length of Spillway
L'= 21.9 ft Net Length of Crest
Pier Length= 0 ft
Length Per Pier= 0.0 ft
Number of Piers (N)= 0
Kp= 0.0 Design of Small Dams; US Department of Interior; Pg 368
Ka= 0.2 Design of Small Dams; US Department of Interior; Pg 368
Discharge Coefficient (Cs/Co) = 1 Design of Small Dams ; US Department of Interior; Figure 9-28
hd/He = 0.83
Q= 2723 cfs
Orifice Flow
Q = C Go B (2 g H')0.5
Hydraulic Design Criteria 320 (1977)
C= 0.68 Hydraulic Design Chart 320-1
Go = 14.4 ft Bottom of Gate - Top of Ogee
H' = 7.2 ft Pool Elevation - Center of Opening
B = 21.90 ft
Q = 4618 cfs
2723 cfs Designed By: RDP
Checked By: CG
Total Flow for Gate 1 =
Alternative 6 - Gate 1 - 22ft Wide x 12ft Tall
Little Falls Spillway Capacity
Wisconsin Department of Natural Resources
St Croix County, WI
Q = Co L He3/2
(Cs/Co)
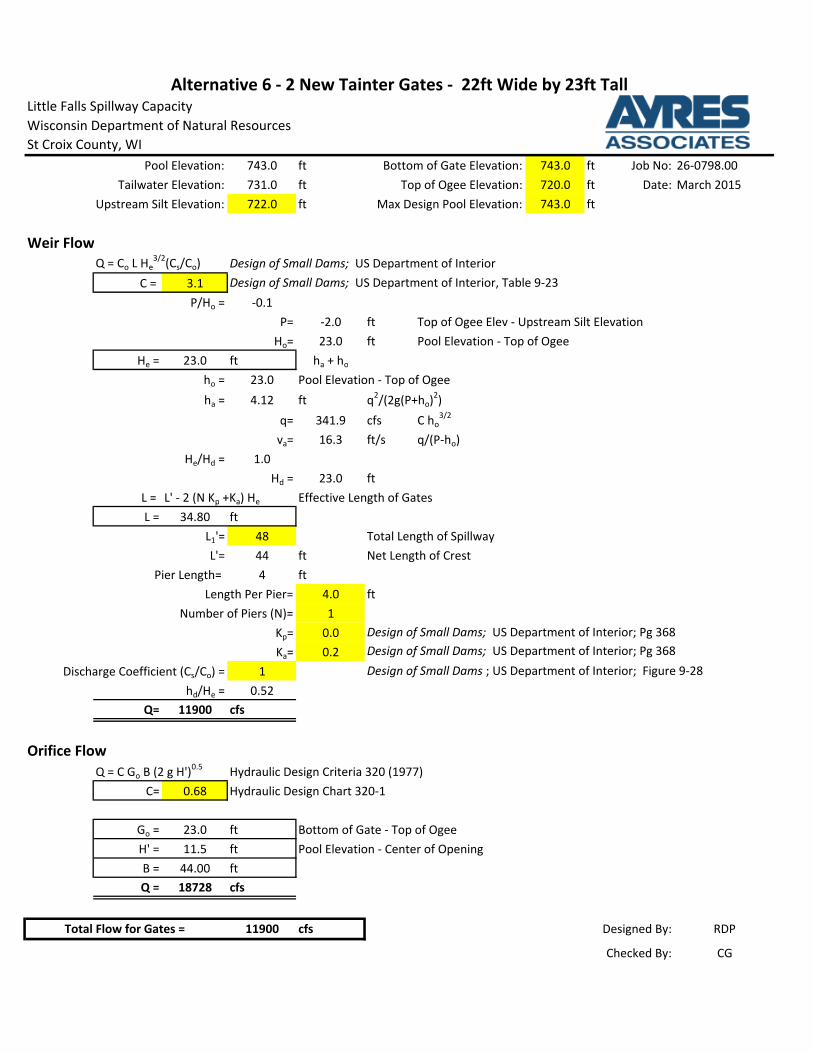
Pool Elevation: 743.0 ft Bottom of Gate Elevation: 743.0 ft Job No: 26-0798.00
Tailwater Elevation: 731.0 ft Top of Ogee Elevation: 720.0 ft Date: March 2015
Upstream Silt Elevation: 722.0 ft Max Design Pool Elevation: 743.0 ft
Weir Flow
Design of Small Dams; US Department of Interior
C = 3.1 Design of Small Dams; US Department of Interior, Table 9-23
P/Ho = -0.1
P= -2.0 ft Top of Ogee Elev - Upstream Silt Elevation
Ho= 23.0 ft Pool Elevation - Top of Ogee
He = 23.0 ft ha + ho
ho = 23.0 Pool Elevation - Top of Ogee
ha = 4.12 ft q2/(2g(P+ho)
2)
q= 341.9 cfs C ho3/2
va= 16.3 ft/s q/(P-ho)
He/Hd = 1.0
Hd = 23.0 ft
L = L' - 2 (N Kp +Ka) He Effective Length of Gates
L = 34.80 ft
L1'= 48 Total Length of Spillway
L'= 44 ft Net Length of Crest
Pier Length= 4 ft
Length Per Pier= 4.0 ft
Number of Piers (N)= 1
Kp= 0.0 Design of Small Dams; US Department of Interior; Pg 368
Ka= 0.2 Design of Small Dams; US Department of Interior; Pg 368
Discharge Coefficient (Cs/Co) = 1 Design of Small Dams ; US Department of Interior; Figure 9-28
hd/He = 0.52
Q= 11900 cfs
Orifice Flow
Q = C Go B (2 g H')0.5
Hydraulic Design Criteria 320 (1977)
C= 0.68 Hydraulic Design Chart 320-1
Go = 23.0 ft Bottom of Gate - Top of Ogee
H' = 11.5 ft Pool Elevation - Center of Opening
B = 44.00 ft
Q = 18728 cfs
11900 cfs Designed By: RDP
Checked By: CG
Alternative 6 - 2 New Tainter Gates - 22ft Wide by 23ft Tall
Total Flow for Gates =
Little Falls Spillway Capacity
Wisconsin Department of Natural Resources
St Croix County, WI
Q = Co L He3/2
(Cs/Co)
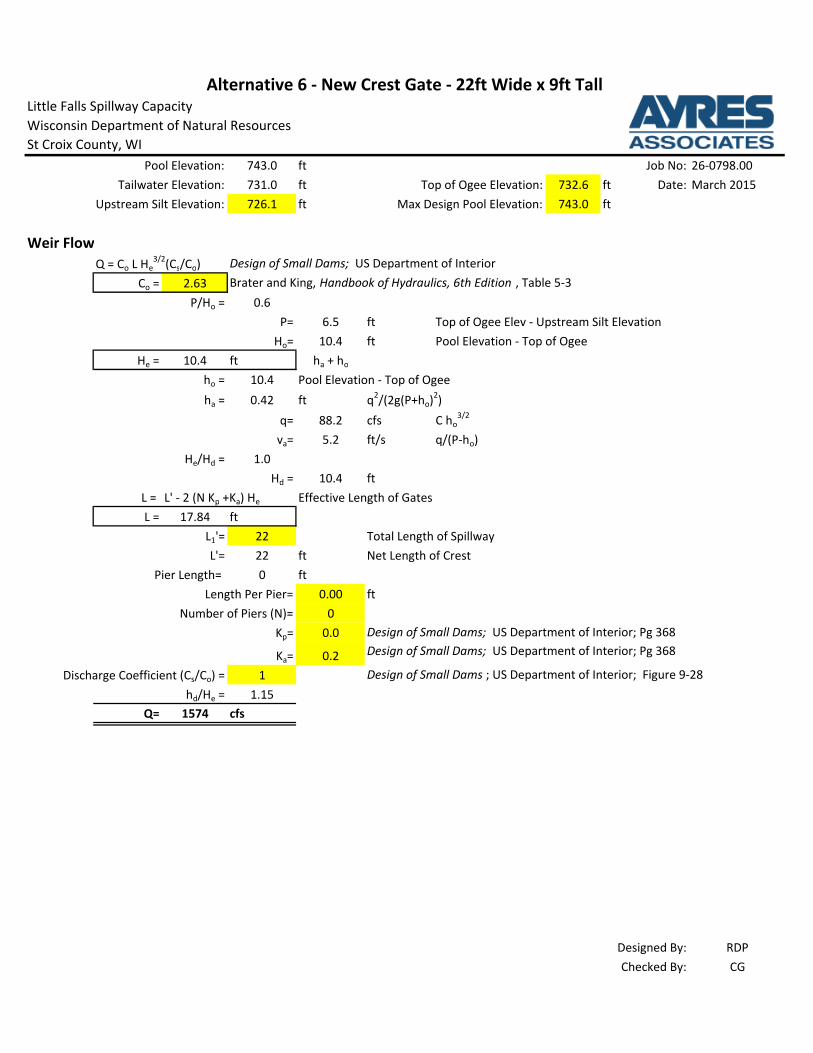
Pool Elevation: 743.0 ft Job No: 26-0798.00
Tailwater Elevation: 731.0 ft Top of Ogee Elevation: 732.6 ft Date: March 2015
Upstream Silt Elevation: 726.1 ft Max Design Pool Elevation: 743.0 ft
Weir Flow
Q = Co L He3/2
(Cs/Co) Design of Small Dams; US Department of Interior
Co = 2.63 Brater and King, Handbook of Hydraulics, 6th Edition , Table 5-3
P/Ho = 0.6
P= 6.5 ft Top of Ogee Elev - Upstream Silt Elevation
Ho= 10.4 ft Pool Elevation - Top of Ogee
He = 10.4 ft ha + ho
ho = 10.4 Pool Elevation - Top of Ogee
ha = 0.42 ft q2/(2g(P+ho)
2)
q= 88.2 cfs C ho3/2
va= 5.2 ft/s q/(P-ho)
He/Hd = 1.0
Hd = 10.4 ft
L = L' - 2 (N Kp +Ka) He Effective Length of Gates
L = 17.84 ft
L1'= 22 Total Length of Spillway
L'= 22 ft Net Length of Crest
Pier Length= 0 ft
Length Per Pier= 0.00 ft
Number of Piers (N)= 0
Kp= 0.0 Design of Small Dams; US Department of Interior; Pg 368
Ka= 0.2 Design of Small Dams; US Department of Interior; Pg 368
Discharge Coefficient (Cs/Co) = 1 Design of Small Dams ; US Department of Interior; Figure 9-28
hd/He = 1.15
Q= 1574 cfs
Designed By: RDP
Checked By: CG
Alternative 6 - New Crest Gate - 22ft Wide x 9ft Tall
Little Falls Spillway Capacity
Wisconsin Department of Natural Resources
St Croix County, WI

Pool Elevation: 743.0 ft Job No: 26-0798.00
Tailwater Elevation: 731.0 ft Top of Ogee Elevation: 740.6 ft Date: March 2015
Upstream Silt Elevation: 726.1 ft Max Design Pool Elevation: 743.0 ft
Weir Flow
Q = Co L He3/2
(Cs/Co) Design of Small Dams; US Department of Interior
Co = 2.72 Brater and King, Handbook of Hydraulics, 6th Edition , Table 5-3
P/Ho = 6.0
P= 14.5 ft Top of Ogee Elev - Upstream Silt Elevation
Ho= 2.4 ft Pool Elevation - Top of Ogee
He = 2.4 ft ha + ho
ho = 2.4 Pool Elevation - Top of Ogee
ha = 0.01 ft q2/(2g(P+ho)
2)
q= 10.1 cfs C ho3/2
va= 0.6 ft/s q/(P-ho)
He/Hd = 1.0
Hd = 2.4 ft
L = L' - 2 (N Kp +Ka) He Effective Length of Gates
L = 71.04 ft
L1'= 72 Total Length of Spillway
L'= 72 ft Net Length of Crest
Pier Length= 0 ft
Length Per Pier= 0.00 ft
Number of Piers (N)= 0
Kp= 0.0 Design of Small Dams; US Department of Interior; Pg 368
Ka= 0.2 Design of Small Dams; US Department of Interior; Pg 368
Discharge Coefficient (Cs/Co) = 1 Design of Small Dams ; US Department of Interior; Figure 9-28
hd/He = 5.00
Q= 718 cfs
Designed By: RDP
Checked By: CG
Alternative 6 - Overflow Spillway
Little Falls Spillway Capacity
Wisconsin Department of Natural Resources
St Croix County, WI
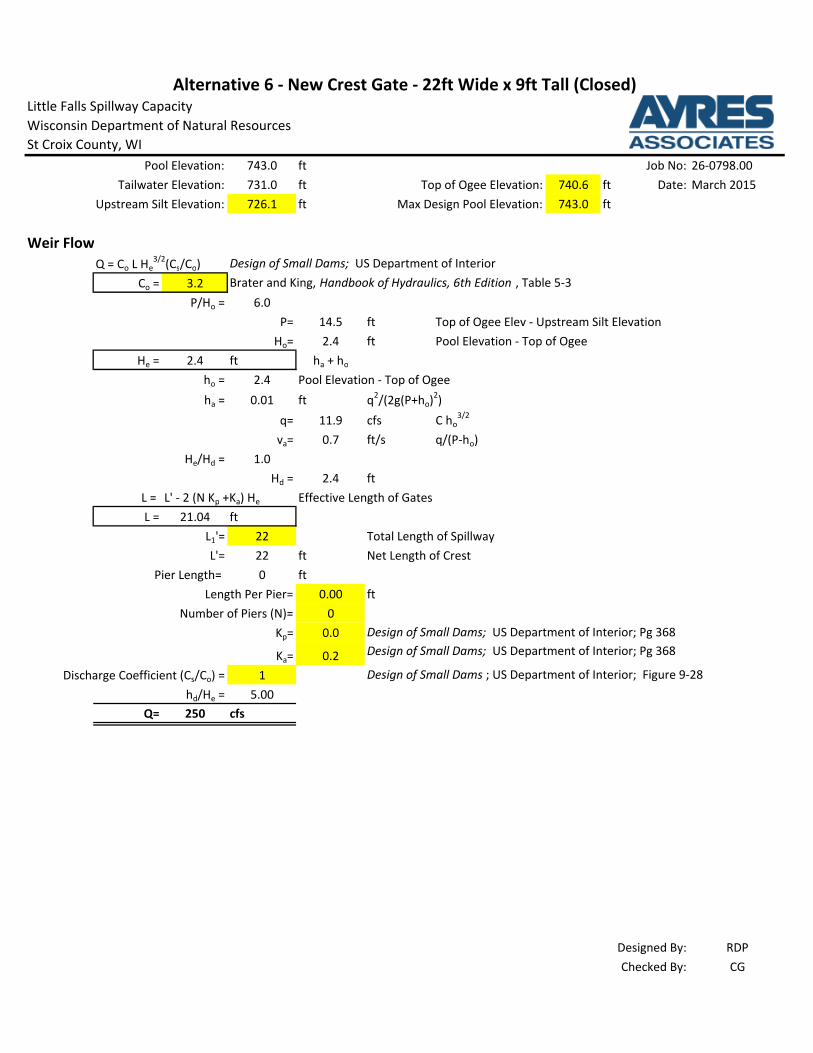
Pool Elevation: 743.0 ft Job No: 26-0798.00
Tailwater Elevation: 731.0 ft Top of Ogee Elevation: 740.6 ft Date: March 2015
Upstream Silt Elevation: 726.1 ft Max Design Pool Elevation: 743.0 ft
Weir Flow
Q = Co L He3/2
(Cs/Co) Design of Small Dams; US Department of Interior
Co = 3.2 Brater and King, Handbook of Hydraulics, 6th Edition , Table 5-3
P/Ho = 6.0
P= 14.5 ft Top of Ogee Elev - Upstream Silt Elevation
Ho= 2.4 ft Pool Elevation - Top of Ogee
He = 2.4 ft ha + ho
ho = 2.4 Pool Elevation - Top of Ogee
ha = 0.01 ft q2/(2g(P+ho)
2)
q= 11.9 cfs C ho3/2
va= 0.7 ft/s q/(P-ho)
He/Hd = 1.0
Hd = 2.4 ft
L = L' - 2 (N Kp +Ka) He Effective Length of Gates
L = 21.04 ft
L1'= 22 Total Length of Spillway
L'= 22 ft Net Length of Crest
Pier Length= 0 ft
Length Per Pier= 0.00 ft
Number of Piers (N)= 0
Kp= 0.0 Design of Small Dams; US Department of Interior; Pg 368
Ka= 0.2 Design of Small Dams; US Department of Interior; Pg 368
Discharge Coefficient (Cs/Co) = 1 Design of Small Dams ; US Department of Interior; Figure 9-28
hd/He = 5.00
Q= 250 cfs
Designed By: RDP
Checked By: CG
Alternative 6 - New Crest Gate - 22ft Wide x 9ft Tall (Closed)
Little Falls Spillway Capacity
Wisconsin Department of Natural Resources
St Croix County, WI