Embed Size (px)
Citation preview
Litter decomposition promotes differential feedbacksin an oligotrophic southern Everglades wetland
Tiffany G. Troxler Æ Daniel L. Childers
Received: 13 October 2006 / Accepted: 30 January 2008 / Published online: 17 March 2008
� Springer Science+Business Media B.V. 2008
Abstract The differential accumulation or loss of
carbon and nutrients during decomposition can promote
differentiation of wetland ecosystems, and contribute to
landscape-scale heterogeneity. Tree islands are impor-
tant ecosystems because they increase ecological
heterogeneity in the Everglades landscape and in
many tropical landscapes. Only slight differences in
elevation due to peat accumulation allow the differ-
entiation of these systems from the adjacent marsh.
Hydrologic restoration of the Everglades landscape is
currently underway, and increased nutrient supply that
could occur with reintroduction of freshwater flow
may alter these differentiation processes. In this study,
we established a landscape-scale, ecosystem-level
experiment to examine litter decomposition responses
to increased freshwater flow in nine tree islands and
adjacent marsh sites in the southern Everglades. We
utilized a standard litterbag technique to quantify
changes in mass loss, decay rates, and phosphorus (P),
nitrogen (N) and carbon (C) dynamics of a common
litter type, cocoplum (Chrysobalanus icaco L.) leaf
litter over 64 weeks. Average C. icaco leaf degrada-
tion rates in tree islands were among the lowest
reported for wetland ecosystems (0.23 ± 0.03 yr-1).
We found lower mass loss and decay rates but higher
absolute mass C, N, and P in tree islands as compared
to marsh ecosystems after 64 weeks. With increased
freshwater flow, we found generally greater mass loss
and significantly higher P concentrations in decom-
posing leaf litter of tree island and marsh sites. Overall,
litter accumulated N and P when decomposing in tree
islands, and released P when decomposing in the
marsh. However, under conditions of increased fresh-
water flow, tree islands accumulated more P while the
marsh accumulated P rather than mineralizing P. In
tree islands, water level explained significant variation
in P concentration and N:P molar ratio in leaf tissue.
Absolute P mass increased strongly with total P load in
tree islands (r2 = 0.81). In the marsh, we found strong,
positive relationships with flow rate. Simultaneous C
and P accumulation in tree island and mineralization
in adjacent marsh ecosystems via leaf litter decompo-
sition promotes landscape differentiation in this
oligotrophic Everglades wetland. However, results of
this study suggest that variation in flow rates, water
levels and TP loads can shift differential P accumula-
tion and loss leading to unidirectional processes among
heterogeneous wetland ecosystems. Under sustained
high P loading that could occur with increased
freshwater flow, tree islands may shift to litter miner-
alization, further degrading landscape heterogeneity in
this system, and signaling an altered ecosystem state.
T. G. Troxler (&) � D. L. Childers
Southeast Environmental Research Center, Florida
International University, 11200 SW 8th St., Miami,
FL 33199, USA
e-mail: [email protected]
T. G. Troxler � D. L. Childers
Department of Biological Sciences, Florida International
University, 11200 SW 8th St., Miami, FL 33199, USA
123
Plant Ecol (2009) 200:69–82
DOI 10.1007/s11258-008-9405-2
Keywords Decay rate � Heterogeneity �Accumulation � Mineralization � Phosphorus �Tree islands � Linear regression
Introduction
On a large scale, peatland development and mainte-
nance are influenced by regional climate, geomor-
phology, site history, and disturbance regimes including
fire and drought (Hogg et al. 1992; Almquist-Jacobson
and Foster 1995). Just as feedbacks driving differen-
tial processes of accumulation and loss are important
in maintaining hummock-hollow microtopography
within and resilience of peatlands (Nungesser 2003),
these differential processes may also be important at
the landscape-scale for maintenance of the peatland
ecosystem in the landscape (Almquist-Jacobson and
Foster 1995). Thus, differential processes of accu-
mulation and loss of carbon and nutrients during
decomposition may promote differentiation among
wetland ecosystems, and contribute to landscape-
scale heterogeneity. Decomposition processes in
wetlands are often nutrient limited, and hydrology
interacts with nutrient availability, and the extant
plant community, to influence peat accumulation or
loss (Pastor et al. 2002).
Exogenous sources of nutrients to wetland envi-
ronments can have deleterious effects on ecological
structure and function, and can alter mechanisms for
differentiation of wetland ecosystems in the landscape,
degrading landscape heterogeneity. In many peatland
studies, litter decomposition is cited as an important
driver of surficial peat dynamics (Middleton and
McKee 2001; Nungesser 2003). In oligotrophic envi-
ronments, especially the phosphorus (P)-limited
Everglades (Noe et al. 2001), litter decomposition
studies have demonstrated that P availability promotes
net immobilization of P by decomposing litter (Qualls
and Richardson 2000; Newman et al. 2001; Davis
et al. 2003; Debusk and Reddy 2005; Corstanje et al.
2005; Rubio and Childers 2006). Increased decompo-
sition and P accumulation have been observed in
areas where P loading is above oligotrophic levels
(Craft and Richardson 1993; Qualls and Richardson
2000; Noe et al. 2001). Thus, if feedbacks control-
ling differential processes of accumulation and loss
between ecosystems are maintained only under
conditions of oligotrophy, then external nutrient
inputs that change the oligotrophic status of inflow-
ing water to the system may subsequently degrade
landscape heterogeneity.
Tree islands are a unique component of the
Everglades landscape and an important component
of landscape heterogeneity, increasing the diversity of
Everglades flora and fauna (Sklar and van der Valk
2002; Troxler Gann et al. 2005; Wetzel et al. 2005).
Like other Everglades communities, tree islands have
experienced major changes in the last 100 years of
human alterations and are expected to undergo further
changes as a result of hydrologic restoration. In the
Everglades, nutrient loads delivered by actions taken
to restore freshwater flow to oligotrophic wetlands
may increase nutrient supply, degrade feedbacks that
promote differential processes of accumulation and
loss, and degrade landscape heterogeneity in the
system. In this study, we explored the importance of
decomposition processes as drivers of this differential
accumulation and loss between tree islands and the
adjacent marsh matrix, and the effects of reintroduced
freshwater flow to an oligotrophic, heterogeneous,
short hydroperiod wetland in the southern Everglades
with peatland tree islands. In 1999, we estab-
lished a landscape-scale, ecosystem-level manipula-
tive experiment to characterize tree island ecosystem
response to increased freshwater flow in the southern
Everglades. We sought to: (1) determine whether
decomposition of a common tree island litter type,
Chrysobalanus icaco (cocoplum), varied among treat-
ment levels of water flow rates and bulk nutrient
loads, (2) examine differences between two contrast-
ing ecosystems, tree islands and the adjacent sawgrass
marsh, and (3) investigate linear relationships between
hydrologic factors and decomposition processes in
these two contrasting ecosystems. We employed a
standard litter bag study and, using a common litter
type, controlled for the effects of litter quality, to
address these three objectives. We tested the follow-
ing hypotheses. (1) Overall, tree islands would accu-
mulate C and nutrients while, in marsh ecosystems,
mineralization would occur. (2) Increased freshwater
flow would result in increased litter decomposition
and nutrient accumulation in tree island and marsh
ecosystems if surface water P was above oligotrophic
levels.
70 Plant Ecol (2009) 200:69–82
123
Methods
Study area
In 1997, hydrologic restoration of the southern
Everglades began with the removal of the southern
levee of the C-111 canal along the segment of the
canal that traverses the easternmost southern Ever-
glades (the C-111 Basin or Everglades National Park
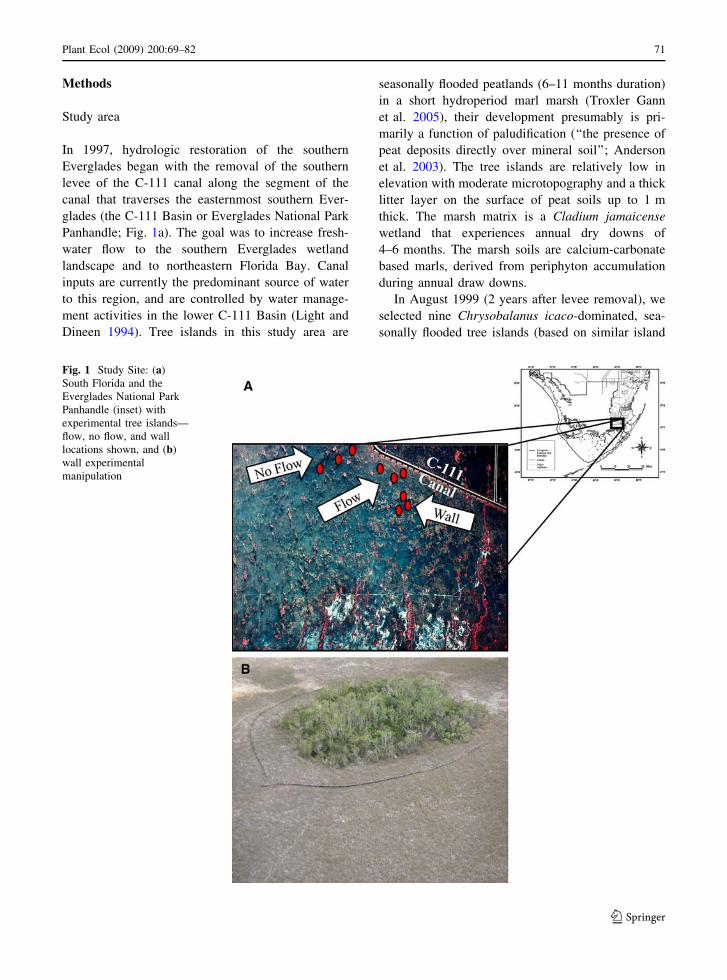
Panhandle; Fig. 1a). The goal was to increase fresh-
water flow to the southern Everglades wetland
landscape and to northeastern Florida Bay. Canal
inputs are currently the predominant source of water
to this region, and are controlled by water manage-
ment activities in the lower C-111 Basin (Light and
Dineen 1994). Tree islands in this study area are
seasonally flooded peatlands (6–11 months duration)
in a short hydroperiod marl marsh (Troxler Gann
et al. 2005), their development presumably is pri-
marily a function of paludification (‘‘the presence of
peat deposits directly over mineral soil’’; Anderson
et al. 2003). The tree islands are relatively low in
elevation with moderate microtopography and a thick
litter layer on the surface of peat soils up to 1 m
thick. The marsh matrix is a Cladium jamaicense
wetland that experiences annual dry downs of
4–6 months. The marsh soils are calcium-carbonate
based marls, derived from periphyton accumulation
during annual draw downs.
In August 1999 (2 years after levee removal), we
selected nine Chrysobalanus icaco-dominated, sea-
sonally flooded tree islands (based on similar island
Fig. 1 Study Site: (a)
South Florida and the
Everglades National Park
Panhandle (inset) with
experimental tree islands—
flow, no flow, and wall
locations shown, and (b)
wall experimental
manipulation
Plant Ecol (2009) 200:69–82 71
123
size and vegetation type) downstream of or adjacent
to the levee removal segment of the C-111 canal
(Fig. 1a). The post-levee increase in freshwater flow
to the C-111 Basin provides a unique opportunity to
investigate the effects of hydrologic restoration.
We investigated the effects of this increase in
freshwater input by selecting tree islands in two
different locations relative to the C-111 canal (Trox-
ler Gann and Childers 2006). Six islands were located
directly downstream of this canal (i.e., islands with
increased freshwater flow) and three islands were in
an area west of the canal that had minimal influence
of the levee removal (we refer to the latter three
islands as ‘‘No Flow’’ islands; Fig. 1a). In six islands
near the canal, we identified the three nearest the
canal as receiving fully enhanced water flow (‘‘Flow’’
islands). With the other three islands, we tested the
effects of sheetflow by experimentally deflecting
surface water flow around the entire islands. We
experimentally reduced sheetflow with plastic walls
(constructed of 12 mil grade plastic and affixed with
PVC posts and cable ties, placed in the marsh
upstream from islands; = ‘‘Wall’’ islands; Fig. 1b).
See Troxler Gann and Childers (2006) for details of
our experimental design and other sampling.
Litter decomposition
In October 1999, we deployed 126 bags at nine sites
with paired tree island and adjacent marsh locations
in each site. Paired marsh locations were approxi-
mately 5 m downstream from each respective tree
island location. Each bag contained approximately
5 g of air-dried C. icaco leaf litter, and was placed on
the standing litter surface upon deployment. We
collected one bag per location (two bags per site) at 1,
2, 4, 8, 16, 32, 64 weeks. We applied an air-dried/
oven-dried weight conversion to determine final oven
dry weights for each bag at each collection period.
We quantified total mass remaining and loss, N and P
concentrations, C:N, C:P, and N:P molar ratios, mass
C, N and P for leaf litter at t0 and each collec-
tion period thereafter. Decay rates were calculated
using the first order, exponential loss decay model,
Mt = Moe-kt, where Mt is the dry mass at time t, Mo
is original dry mass, and k is degradation coefficient
(yr-1; Olson 1963). We calculated total percent loss
as (100 - (Mt/M0) 9 100) day-1 following Middle-
ton and McKee (2001). Turnover rates (T0.95) were
estimated for 95% turnover time as 3 k-1 (Olson
1963). In order to follow nutrient accumulation or
loss, absolute mass was calculated as the product of
dry mass remaining and C, N or P content of litter
following Davis et al. (2003).
After retrieving bags from the field, leaf litter was
gently washed of adhering soil (carefully, and to the
extent possible, leaving accumulated biofilms intact
and attached to the litter), dried to constant weight at
70�C, and weighed. Subsamples from each bag were
ground to a homogeneous powder (\500 lm), and
analyzed for total (T) N, TP and TC content. Leaf
tissue samples were analyzed for TC and TN with a
Carlo Erba elemental analyzer. The modified Solorz-
ano and Sharp (1980) method was used to analyze
for TP.
Environmental factors
From a larger dataset of environmental parameters
collected in association with this study, and published
elsewhere, we removed auto-correlated hydrologic
parameters using Pearson correlation coefficients
(Troxler Gann and Childers 2006). Hydroperiod,
average water level, wet season water level, water
flow rate, annual TP, TN and TOC loads were thus used
to determine which of these factors had the greatest
influence on leaf litter decomposition. See Troxler
Gann and Childers (2006) for details of these data.
Statistical analyses
We compared treatment means for decay rates and
total mass loss, and final values of C and nutrient
content, molar ratios and mass C and nutrients with a
randomized block analysis of variance (ANOVA)
using ecosystem as our blocking factor. Multiple
comparisons for treatment means were evaluated with
Tukey–Kramer tests. We then compared differences
among ecosystems in these same parameters using
t-tests. We used the paired t-test to evaluate differ-
ences between initial and final C, N and P content,
molar ratios and mass nutrients for each ecosystem.
We used simple linear regression analyses to quantify
relationships between hydrologic factors and mass
72 Plant Ecol (2009) 200:69–82
123
loss, decay rates, and final nutrient values separately
for island and marsh ecosystems. In order to maintain
statistical robustness, we only considered island and
marsh regression relationships that were significant at
a Bonferroni-corrected value of P = 0.05/7 or
P B 0.0071 (Zar 1999).
Results
Effects of flow level
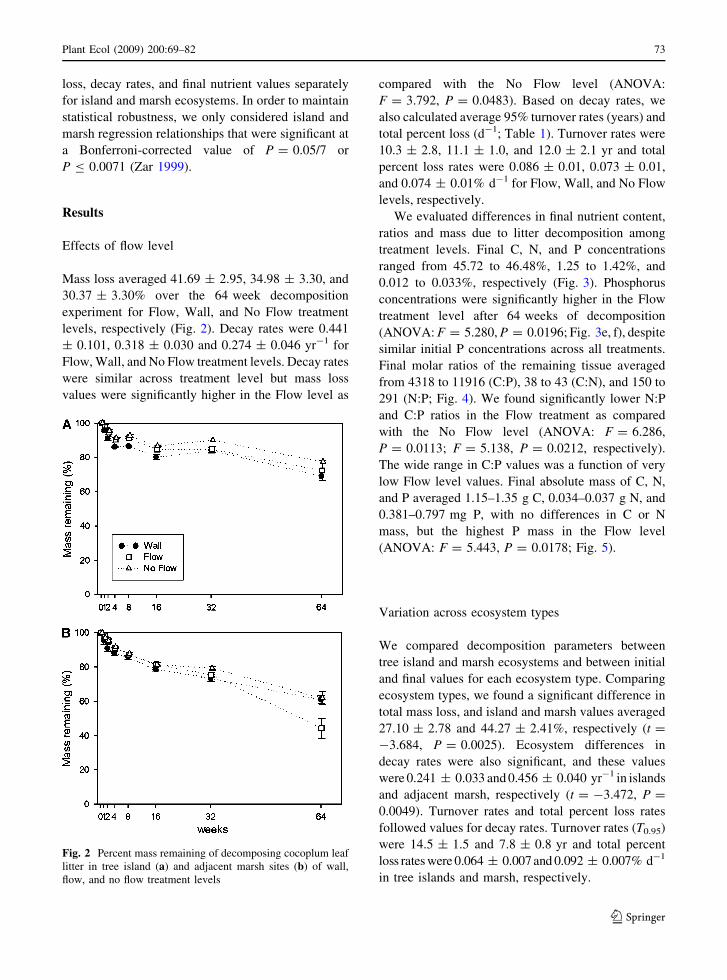
Mass loss averaged 41.69 ± 2.95, 34.98 ± 3.30, and
30.37 ± 3.30% over the 64 week decomposition
experiment for Flow, Wall, and No Flow treatment
levels, respectively (Fig. 2). Decay rates were 0.441
± 0.101, 0.318 ± 0.030 and 0.274 ± 0.046 yr-1 for
Flow, Wall, and No Flow treatment levels. Decay rates
were similar across treatment level but mass loss
values were significantly higher in the Flow level as
compared with the No Flow level (ANOVA:
F = 3.792, P = 0.0483). Based on decay rates, we
also calculated average 95% turnover rates (years) and
total percent loss (d-1; Table 1). Turnover rates were
10.3 ± 2.8, 11.1 ± 1.0, and 12.0 ± 2.1 yr and total
percent loss rates were 0.086 ± 0.01, 0.073 ± 0.01,
and 0.074 ± 0.01% d-1 for Flow, Wall, and No Flow
levels, respectively.
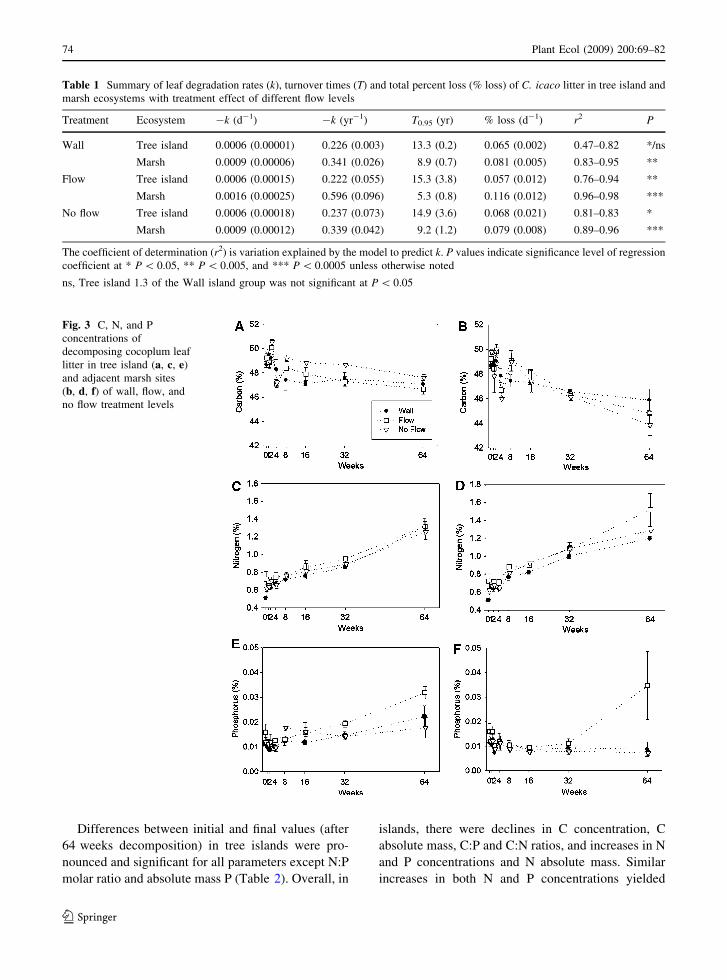
We evaluated differences in final nutrient content,
ratios and mass due to litter decomposition among
treatment levels. Final C, N, and P concentrations
ranged from 45.72 to 46.48%, 1.25 to 1.42%, and
0.012 to 0.033%, respectively (Fig. 3). Phosphorus
concentrations were significantly higher in the Flow
treatment level after 64 weeks of decomposition
(ANOVA: F = 5.280, P = 0.0196; Fig. 3e, f), despite
similar initial P concentrations across all treatments.
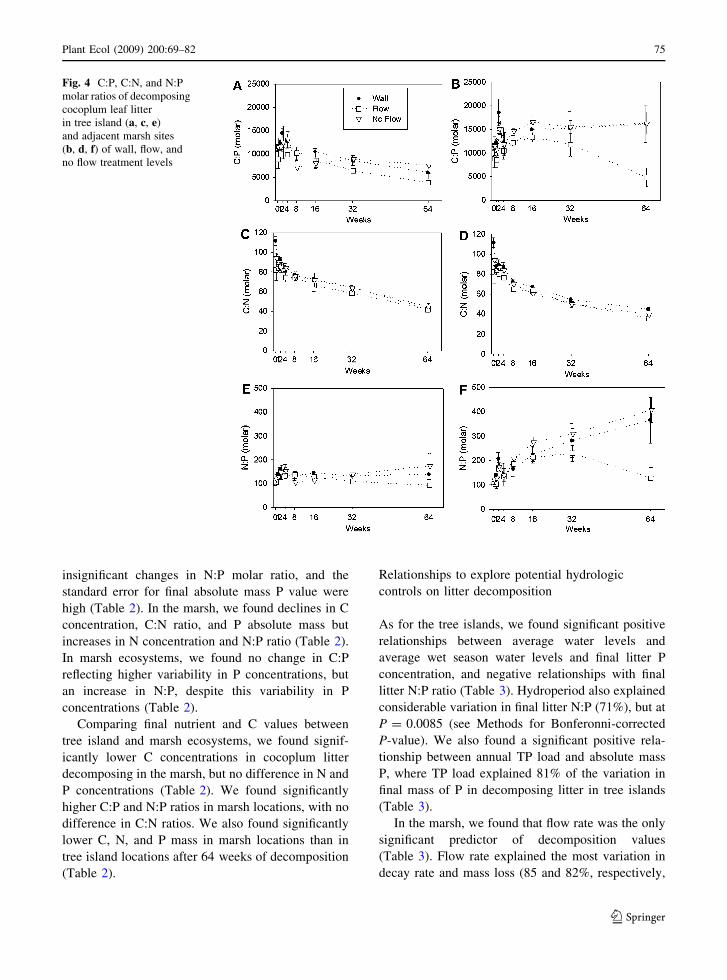
Final molar ratios of the remaining tissue averaged
from 4318 to 11916 (C:P), 38 to 43 (C:N), and 150 to
291 (N:P; Fig. 4). We found significantly lower N:P
and C:P ratios in the Flow treatment as compared
with the No Flow level (ANOVA: F = 6.286,
P = 0.0113; F = 5.138, P = 0.0212, respectively).
The wide range in C:P values was a function of very
low Flow level values. Final absolute mass of C, N,
and P averaged 1.15–1.35 g C, 0.034–0.037 g N, and
0.381–0.797 mg P, with no differences in C or N
mass, but the highest P mass in the Flow level
(ANOVA: F = 5.443, P = 0.0178; Fig. 5).
Variation across ecosystem types
We compared decomposition parameters between
tree island and marsh ecosystems and between initial
and final values for each ecosystem type. Comparing
ecosystem types, we found a significant difference in
total mass loss, and island and marsh values averaged
27.10 ± 2.78 and 44.27 ± 2.41%, respectively (t =
-3.684, P = 0.0025). Ecosystem differences in
decay rates were also significant, and these values
were 0.241 ± 0.033 and 0.456 ± 0.040 yr-1 in islands
and adjacent marsh, respectively (t = -3.472, P =
0.0049). Turnover rates and total percent loss rates
followed values for decay rates. Turnover rates (T0.95)
were 14.5 ± 1.5 and 7.8 ± 0.8 yr and total percent
loss rates were 0.064 ± 0.007 and 0.092 ± 0.007% d-1
in tree islands and marsh, respectively.
Fig. 2 Percent mass remaining of decomposing cocoplum leaf
litter in tree island (a) and adjacent marsh sites (b) of wall,
flow, and no flow treatment levels
Plant Ecol (2009) 200:69–82 73
123
Differences between initial and final values (after
64 weeks decomposition) in tree islands were pro-
nounced and significant for all parameters except N:P
molar ratio and absolute mass P (Table 2). Overall, in
islands, there were declines in C concentration, C
absolute mass, C:P and C:N ratios, and increases in N
and P concentrations and N absolute mass. Similar
increases in both N and P concentrations yielded
Table 1 Summary of leaf degradation rates (k), turnover times (T) and total percent loss (% loss) of C. icaco litter in tree island and
marsh ecosystems with treatment effect of different flow levels
Treatment Ecosystem -k (d-1) -k (yr-1) T0.95 (yr) % loss (d-1) r2 P
Wall Tree island 0.0006 (0.00001) 0.226 (0.003) 13.3 (0.2) 0.065 (0.002) 0.47–0.82 */ns
Marsh 0.0009 (0.00006) 0.341 (0.026) 8.9 (0.7) 0.081 (0.005) 0.83–0.95 **
Flow Tree island 0.0006 (0.00015) 0.222 (0.055) 15.3 (3.8) 0.057 (0.012) 0.76–0.94 **
Marsh 0.0016 (0.00025) 0.596 (0.096) 5.3 (0.8) 0.116 (0.012) 0.96–0.98 ***
No flow Tree island 0.0006 (0.00018) 0.237 (0.073) 14.9 (3.6) 0.068 (0.021) 0.81–0.83 *
Marsh 0.0009 (0.00012) 0.339 (0.042) 9.2 (1.2) 0.079 (0.008) 0.89–0.96 ***
The coefficient of determination (r2) is variation explained by the model to predict k. P values indicate significance level of regression
coefficient at * P \ 0.05, ** P \ 0.005, and *** P \ 0.0005 unless otherwise noted
ns, Tree island 1.3 of the Wall island group was not significant at P \ 0.05
Fig. 3 C, N, and P
concentrations of
decomposing cocoplum leaf
litter in tree island (a, c, e)
and adjacent marsh sites
(b, d, f) of wall, flow, and
no flow treatment levels
74 Plant Ecol (2009) 200:69–82
123
insignificant changes in N:P molar ratio, and the
standard error for final absolute mass P value were
high (Table 2). In the marsh, we found declines in C
concentration, C:N ratio, and P absolute mass but
increases in N concentration and N:P ratio (Table 2).
In marsh ecosystems, we found no change in C:P
reflecting higher variability in P concentrations, but
an increase in N:P, despite this variability in P
concentrations (Table 2).
Comparing final nutrient and C values between
tree island and marsh ecosystems, we found signif-
icantly lower C concentrations in cocoplum litter
decomposing in the marsh, but no difference in N and
P concentrations (Table 2). We found significantly
higher C:P and N:P ratios in marsh locations, with no
difference in C:N ratios. We also found significantly
lower C, N, and P mass in marsh locations than in
tree island locations after 64 weeks of decomposition
(Table 2).
Relationships to explore potential hydrologic
controls on litter decomposition
As for the tree islands, we found significant positive
relationships between average water levels and
average wet season water levels and final litter P
concentration, and negative relationships with final
litter N:P ratio (Table 3). Hydroperiod also explained
considerable variation in final litter N:P (71%), but at
P = 0.0085 (see Methods for Bonferonni-corrected
P-value). We also found a significant positive rela-
tionship between annual TP load and absolute mass
P, where TP load explained 81% of the variation in
final mass of P in decomposing litter in tree islands
(Table 3).
In the marsh, we found that flow rate was the only
significant predictor of decomposition values
(Table 3). Flow rate explained the most variation in
decay rate and mass loss (85 and 82%, respectively,
Fig. 4 C:P, C:N, and N:P
molar ratios of decomposing
cocoplum leaf litter
in tree island (a, c, e)
and adjacent marsh sites
(b, d, f) of wall, flow, and
no flow treatment levels
Plant Ecol (2009) 200:69–82 75
123
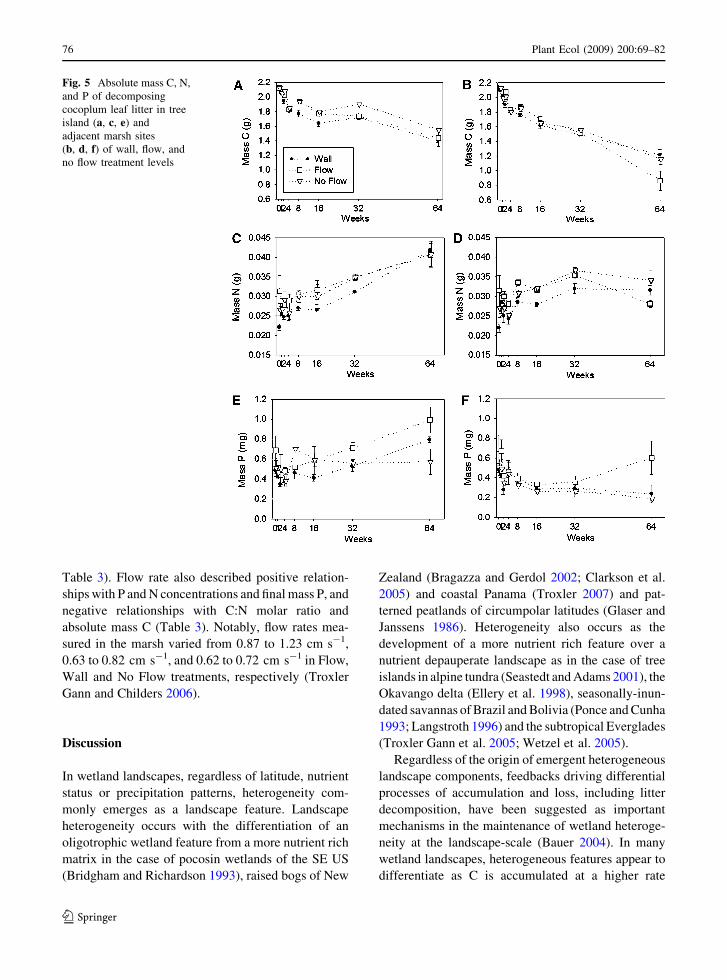
Table 3). Flow rate also described positive relation-
ships with P and N concentrations and final mass P, and
negative relationships with C:N molar ratio and
absolute mass C (Table 3). Notably, flow rates mea-
sured in the marsh varied from 0.87 to 1.23 cm s-1,
0.63 to 0.82 cm s-1, and 0.62 to 0.72 cm s-1 in Flow,
Wall and No Flow treatments, respectively (Troxler
Gann and Childers 2006).
Discussion
In wetland landscapes, regardless of latitude, nutrient
status or precipitation patterns, heterogeneity com-
monly emerges as a landscape feature. Landscape
heterogeneity occurs with the differentiation of an
oligotrophic wetland feature from a more nutrient rich
matrix in the case of pocosin wetlands of the SE US
(Bridgham and Richardson 1993), raised bogs of New
Zealand (Bragazza and Gerdol 2002; Clarkson et al.
2005) and coastal Panama (Troxler 2007) and pat-
terned peatlands of circumpolar latitudes (Glaser and
Janssens 1986). Heterogeneity also occurs as the
development of a more nutrient rich feature over a
nutrient depauperate landscape as in the case of tree
islands in alpine tundra (Seastedt and Adams 2001), the
Okavango delta (Ellery et al. 1998), seasonally-inun-
dated savannas of Brazil and Bolivia (Ponce and Cunha
1993; Langstroth 1996) and the subtropical Everglades
(Troxler Gann et al. 2005; Wetzel et al. 2005).
Regardless of the origin of emergent heterogeneous
landscape components, feedbacks driving differential
processes of accumulation and loss, including litter
decomposition, have been suggested as important
mechanisms in the maintenance of wetland heteroge-
neity at the landscape-scale (Bauer 2004). In many
wetland landscapes, heterogeneous features appear to
differentiate as C is accumulated at a higher rate
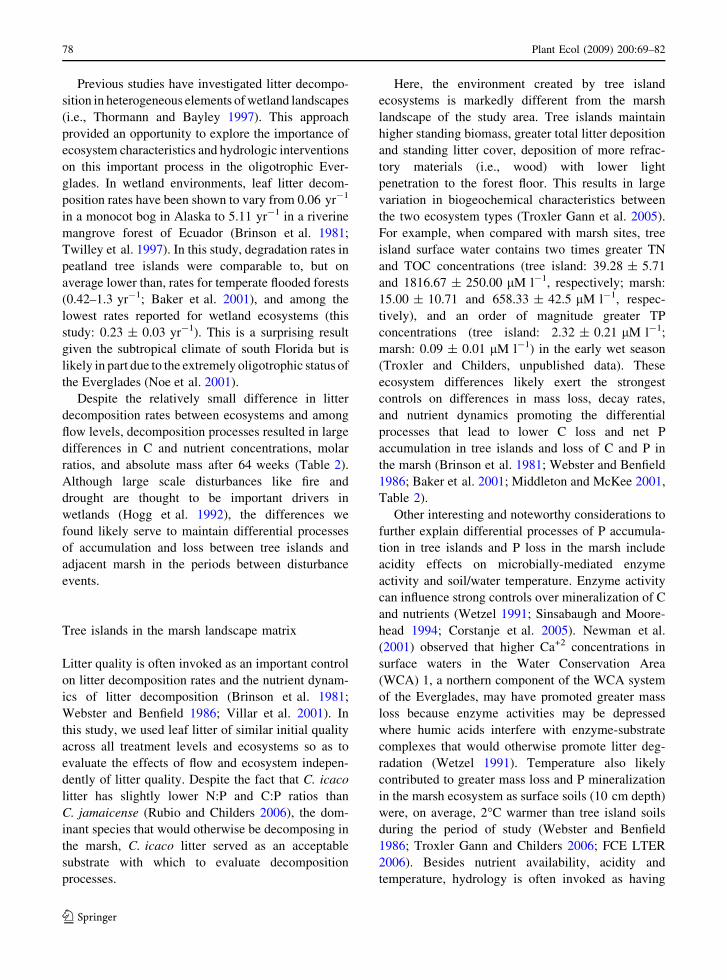
Fig. 5 Absolute mass C, N,
and P of decomposing
cocoplum leaf litter in tree
island (a, c, e) and
adjacent marsh sites
(b, d, f) of wall, flow, and
no flow treatment levels
76 Plant Ecol (2009) 200:69–82
123
relative to the landscape matrix. This process has been
linked to differences in hydrology, nutrient availabil-
ity, standing biomass, and litter quality between the
heterogeneous feature and its matrix system (Glaser
and Janssens 1986; Bridgham and Richardson 1993;
Rietkerk et al. 2004; Couwenberg and Joosten 2005;
Belyea and Baird 2006). This study suggested that this
process also occurs where peatland tree islands emerge
as heterogeneous features of the Everglades wetland
landscape.
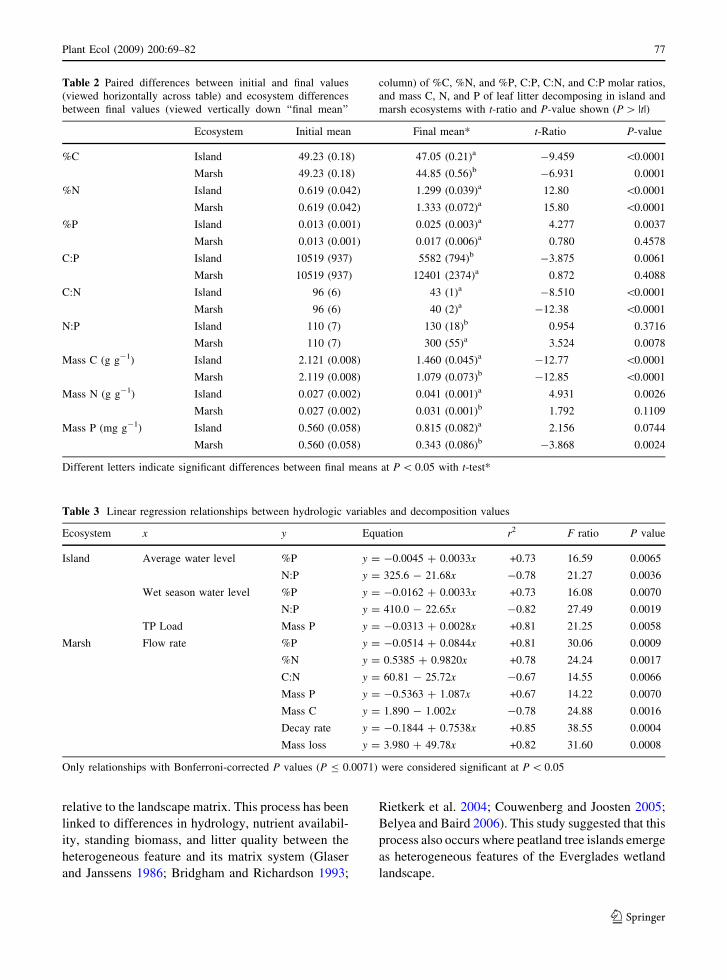
Table 2 Paired differences between initial and final values
(viewed horizontally across table) and ecosystem differences
between final values (viewed vertically down ‘‘final mean’’
column) of %C, %N, and %P, C:P, C:N, and C:P molar ratios,
and mass C, N, and P of leaf litter decomposing in island and
marsh ecosystems with t-ratio and P-value shown (P [ |t|)
Ecosystem Initial mean Final mean* t-Ratio P-value
%C Island 49.23 (0.18) 47.05 (0.21)a -9.459 \0.0001
Marsh 49.23 (0.18) 44.85 (0.56)b -6.931 0.0001
%N Island 0.619 (0.042) 1.299 (0.039)a 12.80 \0.0001
Marsh 0.619 (0.042) 1.333 (0.072)a 15.80 \0.0001
%P Island 0.013 (0.001) 0.025 (0.003)a 4.277 0.0037
Marsh 0.013 (0.001) 0.017 (0.006)a 0.780 0.4578
C:P Island 10519 (937) 5582 (794)b -3.875 0.0061
Marsh 10519 (937) 12401 (2374)a 0.872 0.4088
C:N Island 96 (6) 43 (1)a -8.510 \0.0001
Marsh 96 (6) 40 (2)a -12.38 \0.0001
N:P Island 110 (7) 130 (18)b 0.954 0.3716
Marsh 110 (7) 300 (55)a 3.524 0.0078
Mass C (g g-1) Island 2.121 (0.008) 1.460 (0.045)a -12.77 \0.0001
Marsh 2.119 (0.008) 1.079 (0.073)b -12.85 \0.0001
Mass N (g g-1) Island 0.027 (0.002) 0.041 (0.001)a 4.931 0.0026
Marsh 0.027 (0.002) 0.031 (0.001)b 1.792 0.1109
Mass P (mg g-1) Island 0.560 (0.058) 0.815 (0.082)a 2.156 0.0744
Marsh 0.560 (0.058) 0.343 (0.086)b -3.868 0.0024
Different letters indicate significant differences between final means at P \ 0.05 with t-test*
Table 3 Linear regression relationships between hydrologic variables and decomposition values
Ecosystem x y Equation r2 F ratio P value
Island Average water level %P y = -0.0045 + 0.0033x +0.73 16.59 0.0065
N:P y = 325.6 - 21.68x -0.78 21.27 0.0036
Wet season water level %P y = -0.0162 + 0.0033x +0.73 16.08 0.0070
N:P y = 410.0 - 22.65x -0.82 27.49 0.0019
TP Load Mass P y = -0.0313 + 0.0028x +0.81 21.25 0.0058
Marsh Flow rate %P y = -0.0514 + 0.0844x +0.81 30.06 0.0009
%N y = 0.5385 + 0.9820x +0.78 24.24 0.0017
C:N y = 60.81 - 25.72x -0.67 14.55 0.0066
Mass P y = -0.5363 + 1.087x +0.67 14.22 0.0070
Mass C y = 1.890 - 1.002x -0.78 24.88 0.0016
Decay rate y = -0.1844 + 0.7538x +0.85 38.55 0.0004
Mass loss y = 3.980 + 49.78x +0.82 31.60 0.0008
Only relationships with Bonferroni-corrected P values (P B 0.0071) were considered significant at P \ 0.05
Plant Ecol (2009) 200:69–82 77
123
Previous studies have investigated litter decompo-
sition in heterogeneous elements of wetland landscapes
(i.e., Thormann and Bayley 1997). This approach
provided an opportunity to explore the importance of
ecosystem characteristics and hydrologic interventions
on this important process in the oligotrophic Ever-
glades. In wetland environments, leaf litter decom-
position rates have been shown to vary from 0.06 yr-1
in a monocot bog in Alaska to 5.11 yr-1 in a riverine
mangrove forest of Ecuador (Brinson et al. 1981;
Twilley et al. 1997). In this study, degradation rates in
peatland tree islands were comparable to, but on
average lower than, rates for temperate flooded forests
(0.42–1.3 yr-1; Baker et al. 2001), and among the
lowest rates reported for wetland ecosystems (this
study: 0.23 ± 0.03 yr-1). This is a surprising result
given the subtropical climate of south Florida but is
likely in part due to the extremely oligotrophic status of
the Everglades (Noe et al. 2001).
Despite the relatively small difference in litter
decomposition rates between ecosystems and among
flow levels, decomposition processes resulted in large
differences in C and nutrient concentrations, molar
ratios, and absolute mass after 64 weeks (Table 2).
Although large scale disturbances like fire and
drought are thought to be important drivers in
wetlands (Hogg et al. 1992), the differences we
found likely serve to maintain differential processes
of accumulation and loss between tree islands and
adjacent marsh in the periods between disturbance
events.
Tree islands in the marsh landscape matrix
Litter quality is often invoked as an important control
on litter decomposition rates and the nutrient dynam-
ics of litter decomposition (Brinson et al. 1981;
Webster and Benfield 1986; Villar et al. 2001). In
this study, we used leaf litter of similar initial quality
across all treatment levels and ecosystems so as to
evaluate the effects of flow and ecosystem indepen-
dently of litter quality. Despite the fact that C. icaco
litter has slightly lower N:P and C:P ratios than
C. jamaicense (Rubio and Childers 2006), the dom-
inant species that would otherwise be decomposing in
the marsh, C. icaco litter served as an acceptable
substrate with which to evaluate decomposition
processes.
Here, the environment created by tree island
ecosystems is markedly different from the marsh
landscape of the study area. Tree islands maintain
higher standing biomass, greater total litter deposition
and standing litter cover, deposition of more refrac-
tory materials (i.e., wood) with lower light
penetration to the forest floor. This results in large
variation in biogeochemical characteristics between
the two ecosystem types (Troxler Gann et al. 2005).
For example, when compared with marsh sites, tree
island surface water contains two times greater TN
and TOC concentrations (tree island: 39.28 ± 5.71
and 1816.67 ± 250.00 lM l-1, respectively; marsh:
15.00 ± 10.71 and 658.33 ± 42.5 lM l-1, respec-
tively), and an order of magnitude greater TP
concentrations (tree island: 2.32 ± 0.21 lM l-1;
marsh: 0.09 ± 0.01 lM l-1) in the early wet season
(Troxler and Childers, unpublished data). These
ecosystem differences likely exert the strongest
controls on differences in mass loss, decay rates,
and nutrient dynamics promoting the differential
processes that lead to lower C loss and net P
accumulation in tree islands and loss of C and P in
the marsh (Brinson et al. 1981; Webster and Benfield
1986; Baker et al. 2001; Middleton and McKee 2001,
Table 2).
Other interesting and noteworthy considerations to
further explain differential processes of P accumula-
tion in tree islands and P loss in the marsh include
acidity effects on microbially-mediated enzyme
activity and soil/water temperature. Enzyme activity
can influence strong controls over mineralization of C
and nutrients (Wetzel 1991; Sinsabaugh and Moore-
head 1994; Corstanje et al. 2005). Newman et al.
(2001) observed that higher Ca+2 concentrations in
surface waters in the Water Conservation Area
(WCA) 1, a northern component of the WCA system
of the Everglades, may have promoted greater mass
loss because enzyme activities may be depressed
where humic acids interfere with enzyme-substrate
complexes that would otherwise promote litter deg-
radation (Wetzel 1991). Temperature also likely
contributed to greater mass loss and P mineralization
in the marsh ecosystem as surface soils (10 cm depth)
were, on average, 2�C warmer than tree island soils
during the period of study (Webster and Benfield
1986; Troxler Gann and Childers 2006; FCE LTER
2006). Besides nutrient availability, acidity and
temperature, hydrology is often invoked as having
78 Plant Ecol (2009) 200:69–82
123
strong influences on nutrient and C accumulation in
peatlands (Webster and Benfield 1986). For instance,
the hydraulic properties of a peatland landform
promote a positive feedback on water table height
of the peatland (Belyea and Baird 2006). Thus, even
though annual hydroperiod and surface water level
are on average lower in these tree islands than
adjacent marsh, soil moisture is likely higher in tree
islands when water levels have receded in the
landscape. Some studies have shown that peatland
vegetation can influence hydrology and solute trans-
port that in turn promotes a high water table
throughout the year (Rietkerk et al. 2004). These
interacting factors likely promote the feedbacks that
control differential processes of accumulation and
loss between tree islands and adjacent marsh and
likely contribute to landscape heterogeneity in this
oligotrophic, southern Everglades wetland (Fig. 6,
scenario A).
Hydrologic modifications alter mechanisms
promoting landscape differentiation
In oligotrophic wetland environments, the decompo-
sition of low nutrient quality leaf litter typically takes
place in a soil and water environment of similarly low
nutrient status. In general, studies of litter decompo-
sition in oligotrophic Everglades wetlands (soil TP:
100–400 lg P g-1; water TP: 0.1–0.2 lM l-1; Noe
et al. 2001) have shown net N immobilization and
either mineralization or no change in P content
(Newman et al. 2001; Debusk and Reddy 2005;
Corstanje et al. 2005; Rubio and Childers 2006).
However, when P concentrations of surface water or
soil exceed oligotrophic levels, either as a function of
natural or human-induced P sources, net immobiliza-
tion is the most consistent result (Newman et al. 2001;
Davis et al. 2003; Debusk and Reddy 2005; Corstanje
et al. 2005; Rubio and Childers 2006). Thus, as tree
islands have moderate (above oligotrophic levels) soil
and surface water P concentrations, P immobilization
would be expected. Whereas in the marsh, we found
net P mineralization under conditions where inflowing
water was of low nutrient status (Figs. 4 and 5). Yet,
with greater than oligotrophic levels of inflowing P,
net P immobilization becomes independent of eco-
system type leading to similar net accumulation of P
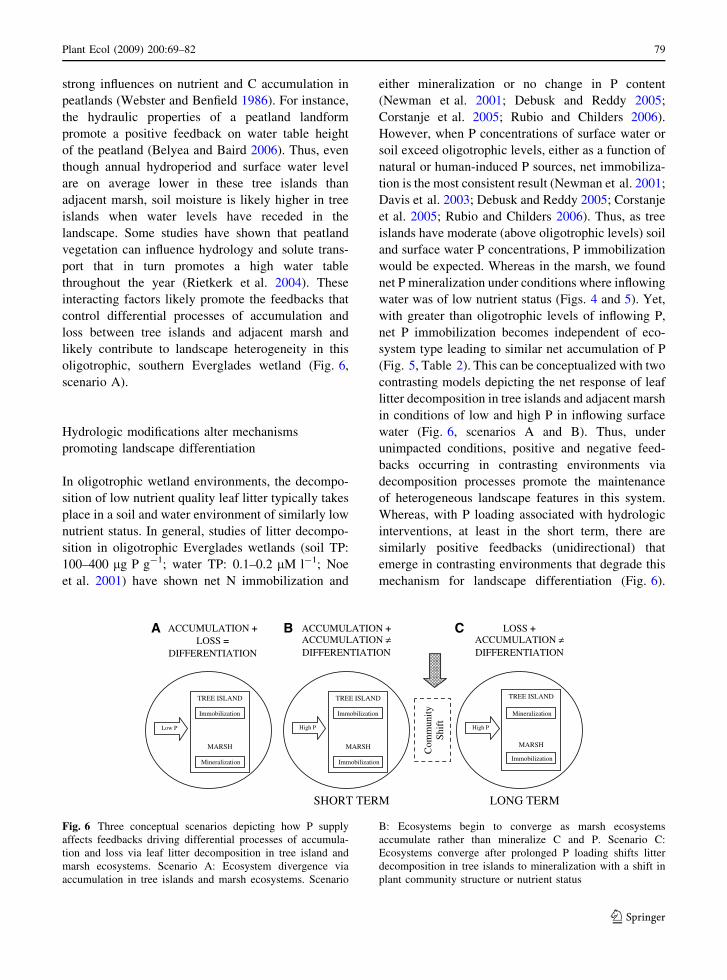
(Fig. 5, Table 2). This can be conceptualized with two
contrasting models depicting the net response of leaf
litter decomposition in tree islands and adjacent marsh
in conditions of low and high P in inflowing surface
water (Fig. 6, scenarios A and B). Thus, under
unimpacted conditions, positive and negative feed-
backs occurring in contrasting environments via
decomposition processes promote the maintenance
of heterogeneous landscape features in this system.
Whereas, with P loading associated with hydrologic
interventions, at least in the short term, there are
similarly positive feedbacks (unidirectional) that
emerge in contrasting environments that degrade this
mechanism for landscape differentiation (Fig. 6).
TREE ISLAND
MARSH
Low P High P
TREE ISLAND
MARSH
Immobilization
Immobilization
ACCUMULATION +LOSS =
DIFFERENTIATION
ACCUMULATION +ACCUMULATION ≠DIFFERENTIATION
LOSS +ACCUMULATION ≠DIFFERENTIATION
SHORT TERM LONG TERM
TREE ISLAND
MARSH
High P
A B C
Mineralization
Immobilization
Immobilization
Mineralization
ytinum
moC
tfihS
Fig. 6 Three conceptual scenarios depicting how P supply
affects feedbacks driving differential processes of accumula-
tion and loss via leaf litter decomposition in tree island and
marsh ecosystems. Scenario A: Ecosystem divergence via
accumulation in tree islands and marsh ecosystems. Scenario
B: Ecosystems begin to converge as marsh ecosystems
accumulate rather than mineralize C and P. Scenario C:
Ecosystems converge after prolonged P loading shifts litter
decomposition in tree islands to mineralization with a shift in
plant community structure or nutrient status
Plant Ecol (2009) 200:69–82 79
123
Strong linear relationships between hydrologic factors
and decomposition values further elucidated these
patterns.
This study suggested that both water level and the
supply of P by inflowing water were important factors
regulating tree island P immobilization via litter
decomposition (Table 3). Peatland tree islands of this
area have soils with greater P concentrations than
surrounding marshes, but are dominated by tree
species delivering senesced leaves of very low P
content and high C content (N:P and C:P ratios
typically 100 and 8,500, respectively; Troxler Gann
et al. 2005). This constant influx of low quality litter
coupled with slightly acidic soil and surface water
conditions promote a substrate for accumulation of
microbial biomass P and CaPO4 precipitation (Keuhn
et al. 2000; Noe et al. 2001). If plant species maintain
delivery of low quality litter (high N:P, high C:P),
despite increased surface water loads of P, tree
islands will likely accumulate P. However, under
circumstances in which hydrologic modifications
alter litter nutrient quality or species composition
favoring plants with higher quality litter, C and P
mineralization of leaf litter in peatland tree islands is
a potential outcome, i.e., convergence of ecosystem
types (Fig. 6, scenario C).
The marsh ecosystem, on the other hand, appeared
to be more sensitive to flow rate directly (Table 3).
While nutrient loads into the C-111 would co-vary
with flow rates, nutrient loads were not similarly
correlated with decomposition values after 64 weeks
(Table 3). Thus, advective sheet flow with even a
minor change in P concentrations of surface water
appeared to influence N and P dynamics and P
accumulation by decomposing leaf litter within the
marsh ecosystem. This coincided with positive rela-
tionships with mass loss and decay rates, and
negative relationships with absolute C mass, suggest-
ing a mechanism that promotes maintenance of
mineral soils in the marsh landscape. Furthermore,
considering that mass loss was highest where flow
rates were highest (in the marsh of the Flow treatment
level; 55.7 ± 4.1%) as compared with mass loss in
the marsh of Wall and No Flow levels (38.9 ± 4.17
and 38.1 ± 4.1%) suggests an additive factor influ-
encing C and nutrient remineralization in the marsh
system. It is interesting to note that given a situation
where light, nutrient and temperature-limited condi-
tions are removed (marsh, flow treatment), flow rates
promote the highest mass loss and decay rates, as has
been found in some stream studies (Lepori et al.
2005; Ardon et al. 2006).
The similar P concentration and accumulation
responses that occurred in contrasting wetland eco-
systems of the Flow treatment level strongly suggests
that canal influences modify mechanisms for land-
scape differentiation in this study. Furthermore, small
differences in P loading can determine whether tree
island and marsh ecosystems have differential P
dynamics or similarly accumulate P. Our study
suggests another mechanism by which reduced
landscape heterogeneity may occur in hydrologi-
cally-altered wetland landscapes, at least in the short
term. With long term P loading, and changes in tree
island canopy structure or leaf quality, convergence
of ecosystem types, and loss of landscape heteroge-
neity, is a possible result, and may signal an altered
tree island ecosystem state.
Acknowledgments We would like to thank the Wetland
Ecosystems Ecology group for field and lab support, as well as
critical reviews that greatly improved this manuscript. Critical
to the accomplishment of this work were Damon Rondeau and
undergraduate research assistants Josh Mahoney and Simone
Normile. This research was partially supported by the South
Florida Water Management District under several sequential
contracts, and by the National Science Foundation through the
Florida Coastal Everglades Long-Term Ecological Research
Program (DEB-9901514).
References
Almquist-Jacobson H, Foster DR (1995) Toward an integrated
model for raised-bog development: theory and field evi-
dence. Ecology 76:2503–2516
Anderson RL, Foster DR, Motzkin G (2003) Integrating lateral
expansion into models of peatland development in tem-
perate New England. J Ecol 91:68–76
Ardon M, Stallcup LA, Pringle CM (2006) Does leaf quality
mediate the stimulation of leaf breakdown by phosphorus
in Neotropical streams? Freshw Biol 51:618–633
Baker TT, Lockaby BG, Conner WH, Meier CE, Stanturf JA,
Burke M (2001) Leaf litter decomposition and nutrient
dynamics in four southern forested floodplain communi-
ties. Soil Sci Soc Am J 65:1334–1347
Bauer IE (2004) Modelling effects of litter quality and envi-
ronment on peat accumulation over different time-scales.
J Ecol 92:661–674
Belyea LR, Baird AJ (2006) Beyond ‘‘the limits to peat bog
growth’’: cross-scale feedback in peatland development.
Ecol Monogr 76:299–322
Bragazza L, Gerdol R (2002) Are nutrient availability and acid-
ity-alkalinity gradients related in Sphagnum-dominated
peatlands? J Veg Sci 13:473–482
80 Plant Ecol (2009) 200:69–82
123
Bridgham SD, Richardson CJ (1993) Hydrology and nutrient
gradients in North Carolina peatlands. Wetlands 13:207–218
Brinson MM, Lugo AE, Brown S (1981) Primary productivity,
decomposition and consumer activity in freshwater wet-
lands. Annu Rev Ecol Syst 12:123–161
Clarkson BR, Schipper LA, Moyersoen B, Silvester WB (2005)
Foliar 15N natural abundance indicates phosphorus limi-
tation of bog species. Oecologia 144:550–557
Corstanje R, Reddy KR, Portier KM (2005) Typha latifolia and
Cladium jamaicense litter decay in response to exogenous
nutrient enrichment. Aquat Bot 84:70–78
Couwenberg J, Joosten H (2005) Self-organization in raised
bog patterning: the origin of microtope zonation and
mesotope diversity. J Ecol 93:1238–1248
Craft CB, Richardson CJ (1993) Peat accretion and N, P, and
organic C accumulation in nutrient-enriched and unen-
riched Everglades peatlands. Ecol Appl 3:446–458
Davis SE, Coronado-Molina C, Childers DL, Day JW (2003)
Temporally dependent C, N, and P dynamics with the
decay of Rhizophora mangle L. Leaf litter in oligotrophic
mangrove wetlands of the Southern Everglades. Aquat
Bot 75:199–215
Debusk WF, Reddy KR (2005) Litter decomposition and
nutrient dynamics in a phosphorus enriched Everglades
marsh. Biogeochemistry 75:217–240
Ellery W, McCarthy T, Dangerfield J (1998) Biotic factors in
Mima mound development: evidence from the floodplains
of the Okavango Delta, Botswana. Int J Ecol Environ Sci
24:293–313
Florida Coastal Everglades (FCE) LTER (2006) FCE LTER
database. http://fcelter.fiu.edu/data/contents/. Cited 10 Oct
2006
Glaser PH, Janssens JA (1986) Raised bogs in eastern North
America: transitions in landforms and gross stratigraphy.
Can J Bot 64:395–415
Hogg EH, Lieffers VJ, Wein RW (1992) Potential carbon
losses from peat profiles: effects of temperature, drought
cycles, and fire. Ecol Appl 2:298–306
Kuehn KA, Lemke MJ, Suberkropp K, Wetzel RG (2000)
Microbial biomass and production associated with
decaying leaf litter of the emergent macrophyte Juncuseffusus. Limnol Oceanogr 45:862–870
Langstroth RP (1996) Forest islands in an Amazonian Savanna
of Northeastern Bolivia. Ph.D. dissertation, University of
Wisconsin, Madison, WI
Lepori F, Palm D, Malmquist B (2005) Effects of stream res-
toration on ecosystem functioning: detritus retentiveness
and decomposition. J Appl Ecol 42:228–238
Light SS, Dineen JW (1994) Water control in the Everglades: a
historical perspective. In: Davis SM, Ogden JC (eds)
Everglades: the ecosystem and its restoration. St. Lucie
Press, Delray Beach, pp 47–87
Middleton BA, McKee KL (2001) Degradiation of mangrove
tissues and implications for peat formation in Belizean
island forests. J Ecol 89:818–828
Newman S, Kumpf H, Laing JA, Kennedy WC (2001)
Decomposition responses to phosphorus enrichment in an
Everglades slough. Biogeochemistry 54:229–250
Noe GB, Childers DL, Jones RD (2001) Phosphorus biogeo-
chemistry and the impact of phosphorus enrichment: why
is the Everglades so unique? Ecosystems 4:603–624
Nungesser MK (2003) Modelling microtopography in boreal
peatlands: hummocks and hollows. Ecol Modell 165:175–
207
Olson JS (1963) Energy storage and the balance of producers
and decomposers in ecological systems. Ecology
44:322–344
Pastor J, Beckham B, Bridgham S, Weltzin J, Chen J (2002)
Plant community dynamics, nutrient cycling and alter-
native stable equilibria in peatlands. Am Nat 160:554–
568
Ponce V, Cunha C (1993) Vegetated earthmounds in tropical
savannas of Central Brazil: a synthesis with special
reference to the Pantanal do Mato Grosso. J Biogeogr
20:219–225
Qualls RG, Richardson CJ (2000) Phosphorus enrichment
affects litter decomposition, immobilization, and soil
microbial phosphorus in wetland mesocosms. Soil Sci Soc
Am J 64:799–808
Rietkerk M, Dekker SC, Wassen MJ, Verkroost AWM, Bierkens
MFP (2004) A putative mechanism for bog patterning. Am
Nat 163:699–708
Rubio G, Childers DL (2006) Controls on herbaceous litter
decomposition in the estuarine ecotones of the Florida
Everglades. Estuaries Coasts 29:259–270
Seastedt T, Adams G (2001) Effects of mobile tree islands on
alpine tundra soils. Ecology 82:8–17
Sinsabaugh RL, Moorehead DL (1994) Resource allocation to
extracellular enzyme production: a model for nitrogen and
phosphorus control of litter decomposition. Soil Biol
Biochem 26:1305–1311
Sklar F, van der Valk A (2002) Tree islands of the Everglades.
Kluwer Academic Publishers, Boston
Solorzano L, Sharp J (1980) Determination of total dissolved P
and particulate P in natural waters. Limnol Oceanogr
25:754–758
Thormann MN, Bayley SE (1997) Decomposition along a
moderate-rich fen-marsh peatland gradient in boreal
Alberta, Canada. Wetlands 17:123–137
Troxler TG (2007) Patterns of phosphorus, nitrogen and 15N
along a peat development gradient in a coastal mire,
Panama. J Trop Ecol 23:683–691
Troxler Gann TG, Childers DL (2006) Relationships between
hydrology and soils describe vegetation patterns in sea-
sonally flooded tree islands of the southern Everglades,
Florida. Plant Soil 279:273–288
Troxler Gann TG, Childers DL, Rondeau DN (2005) Ecosys-
tem structure, nutrient dynamics, and hydrologic
relationships in tree islands of the southern Everglades,
Florida, USA. For Ecol Manage 214:11–27
Twilley RR, Pozo M, Garcia VH, Rivera-Monroy VH, Zam-
brano R, Bodero A (1997) Litter dynamics in riverine
mangrove forests in the Guayas River estuary, Ecuador.
Oecologia 111:109–122
Villar CA, de Cabo AL, Vaithiyanathan P, Bonetto C (2001)
Litter decomposition of emergent macrophytes in a
floodplain marsh of the lower Parana River. Aquat Bot
70:105–116
Webster JR, Benfield EF (1986) Vascular plant breakdown in
freshwater ecosystems. Annu Rev Ecol Syst 17:567–594
Wetzel RG (1991) Extracellular enzymatic interactions: stor-
age, redistribution, and interspecific communication.
Plant Ecol (2009) 200:69–82 81
123

In: Chrost RJ (ed) Microbial enzymes in aquatic envi-
ronments. Springer-Verlag, New York, pp 6–28
Wetzel PR, van der Valk AG, Newman S, Gawlik DE, Troxler
Gann T, Coronado-Molina CA, Childers DL, Sklar FH
(2005) Nutrient redistribution key to maintaining tree
islands in the Florida Everglades. Front Ecol Environ
3:370–376
Zar J (1999) Biostatistical analysis, 4th edn. Prentice Hall,
Upper Sadle River
82 Plant Ecol (2009) 200:69–82
123