Embed Size (px)
Citation preview

Lithuania
GLOBAL FOREST RESOURCES ASSESSMENT 2015
COUNTRY REPORT
Rome, 2014
FAO, at the request of its member countries, regularly monitors the world´s forests and theirmanagement and uses through the Global Forest Resources Assessment (FRA). This country reportis prepared as a contribution to the FAO publication, the Global Forest Resources Assessment 2015(FRA 2015).The content and the structure are in accordance with the recommendations and guidelines given byFAO in the document Guide for country reporting for FRA 2015 (http://www.fao.org/3/a-au190e.pdf).These reports were submitted to FAO as official government documents.
The content and the views expressed in this report are the responsibility of the entity submitting thereport to FAO. FAO may not be held responsible for the use which may be made of the informationcontained in this report.

FRA 2015 – Country Report, Lithuania
3
TABLE OF CONTENTSReport preparation and contact persons...............................................................................................................................41. What is the area of forest and other wooded land and how has it changed over time? ................................................. 52. What is the area of natural and planted forest and how has it changed over time? ..................................................... 133. What are the stocks and growth rates of the forests and how have they changed? .....................................................184. What is the status of forest production and how has it changed over time? .................................................................345. How much forest area is managed for protection of soil and water and ecosystem services? ..................................... 456. How much forest area is protected and designated for the conservation of biodiversity and how has it changed overtime? ................................................................................................................................................................................... 507. What is the area of forest affected by woody invasive species? .................................................................................. 548. How much forest area is damaged each year? ............................................................................................................ 579. What is the forest area with reduced canopy cover? ....................................................................................................6110. What forest policy and regulatory framework exists to support implementation of sustainable forest managementSFM? .................................................................................................................................................................................. 6211. Is there a national platform that promotes stakeholder participation in forest policy development? ............................ 6512. What is the forest area intended to be in permanent forest land use and how has it changed over time? .................. 6613. How does your country measure and report progress towards SFM at the national level? ........................................ 6914. What is the area of forest under a forest management plan and how is this monitored? ........................................... 7215. How are stakeholders involved in the management decision making for publicly owned forests? .............................. 7416. What is the area of forest under an independently verified forest certification scheme? .............................................7517. How much money do governments collect from and spend on forests? .....................................................................7718. Who owns and manages the forests and how has this changed? ..............................................................................7919. How many people are directly employed in forestry? ................................................................................................. 8520. What is the contribution of forestry to Gross Domestic Product (GDP)? .................................................................... 8721. What is forest area likely to be in the future ...............................................................................................................88
FRA 2015 – Country Report, Lithuania
4
Report preparation and contact personsContact personsThe present report was prepared by the following person(s)
Name (FAMILYNAME, first name) Institution/address Email Tables
KULIESIS, ANDRIUS STATE FOREST SERVICE [email protected] 1-21
BUTKUS, ANDRIUS STATE FOREST SERVICE [email protected] 1-9,12-14,18,21
VIZLENSKAS, DARIUS STATE FOREST SERVICE [email protected] 4,6,8,12,14,17,19,20
N/A N/A N/A N/A
Introductory TextPlace an introductory text on the content of this report
FRA -2015 is based on data from the third National forest inventory (NFI) of Lithuania, completed 2008-2012years, as well as data from forest cadastre, stand level forest inventory, forest management statistics from forestenterprises and private forests. NFI, based on regularly, every 5 years remeasured permanent plots, provideshigh accuracy data (1-2%) about growing stock volume, increment, its components, volume of felling, deadwood, their structure by species, forest types, size of trees. Data about felling, forest regeneration, damages offorests, economy were received from state forest enterprises and private forests. For FRA-2015 were used datafrom former assessments, especially FRA-2010. Data of FRA-2010 were updated using the newest NFI andstand level inventory data.
Desk Study?
Check "yes" if this survey is a Desk Study, "no" otherwise
Desk Study? no

FRA 2015 – Country Report, Lithuania
5
1. What is the area of forest and other wooded land and how has it changed over time?Documents for this question:
• Guide for country reporting FRA 2015• FRA 2015 Terms and Definitions
1.1 Categories and definitions
Category Definition
Forest Land spanning more than 0.5 hectares with trees higher than 5 meters and a canopy cover of more than10 percent or trees able to reach these thresholds in situ. It does not include land that is predominantlyunder agricultural or urban land use.
Other wooded land Land not classified as "Forest" spanning more than 0.5 hectares with trees higher than 5 meters anda canopy cover of 5-10 percent or trees able to reach these thresholds ; or with a combined coverof shrubs bushes and trees above 10 percent. It does not include land that is predominantly underagricultural or urban land use.
Other land All land that is not classified as "Forest" or "Other wooded land".
...of which with tree cover(sub-category)
Land considered as "Other land", that is predominantly agricultural or urban lands use and has patchesof tree cover that span more than 0.5 hectares with a canopy cover of more than 10 percent of trees ableto reach a height of 5 meters at maturity. It includes bothe forest and non-forest tree species.
Inland water bodies Inland water bodies generally include major rivers, lakes and water reservoirs.
Forest expansion Expansion of forest on land that, until then, was not defined as forest.
...of which afforestation(sub-category)
Establishment of forest through planting and/or deliberate seeding on land that, until then, was notdefined as forest.
...of which naturalexpansion of forest (sub-category)
Expansion of forests through natural succession on land that, until then, was under another land use(e.g. forest succession on land previously used for agriculture).
Deforestation The conversion of forest to other land use or the longterm reduction of the tree canopy cover below theminimum 10 percent threshold.
...of which humaninduced (sub-category)
Human induced conversion of forest to other land use or the permanent reduction of the tree canopycover below the minimum 10 percent threshold.
Reforestation Natural regeneration or re-establishment of forest through planting and/or deliberate seeding on landalready in forest land use.
...of which artificialreforestation (sub-category)
Re-establishment of forest through planting and/or deliberate seeding on land already in forest land use.
1.2 National data1.2.1 Data sources
References to sourcesof information Variables Years Additional comments
1 Лесной Фонд СССР 01.01.1998, Москва, 1990, стр.184, 185 (Forest Fund ofUSSR 01.01.1988, Moscow,1990,pp.184, 185
Forest 1987 N/A

FRA 2015 – Country Report, Lithuania
6
2 Lietuvos miškųstatistika.1998 m. sausio1 d. valstybinė apskaita(Lithuanian Forest Statistics01.01.1998). Kaunas, 1998,72 p.
Forest 1997 N/A
3 Lietuvos miškų valstybinėapskaita 2001 m. sausio1d. (Lithuanian ForestAssessment. January 1 2001)Kaunas, 2001, 76 p.
Forest 2000 N/A
4 Valstybinė miškųapskaita.2004 m. sausio 1d. (State Forest Assessment.January 1 2004). Kaunas,2004, 95 p. (manuscript)
Forest 2003 N/A
5 Lietuvos Respublikos žemėsfondas (Land fund of theRepublic of Lithuania) 1998m. sausio 1d. Vilnius, 1998,58 p.
OWL, OL with tree 1997 N/A
6 Lietuvos Respublikos žemėsfondas (Land fund of theRepublic of Lithuania) 2001m. sausio 1d., Vilnius, 2001,82 p.
OWL, OL with tree, Officialcountry area, Inland waterbodies
2000 N/A
7 Lietuvos Respublikos žemėsfondas (Land fund of theRepublic of Lithuania) 2004m. sausio 1d, Vilnius, 2004,94 p.
OWL, OL with tree 2003 N/A
8 Vakarų Lietuvos parkųdendrofloros būklės įvertinimas. 1999m. darbųataskaita. Kauno botanikossodas, 1999, (manuscript)
OL with tree 1997, 2000, 2003 N/A
9 Vidurio Lietuvos parkųdendrofloros būklės įvertinimas. 2000m.darbų ataskaita. Lietuvosdendrologų draugija, 2000,(manuscript)
OL with tree 1997, 2000, 2003 N/A
10 Rytų Lietuvos parkų dendrofloros būklės įvertinimas. 2001m.darbų ataskaita. Lietuvosdendrologų draugija, 2001,(manuscript)
OL with tree 1997, 2000, 2003 N/A
11 Pietų ir pietvakarių Lietuvosparkų dendrofloros būklės įvertinimas. 2002 m.darbų ataskaita. Lietuvosdendrologų draugija, 2002,(manuscript)
OL with tree 1997, 2000, 2003 N/A
FRA 2015 – Country Report, Lithuania
7
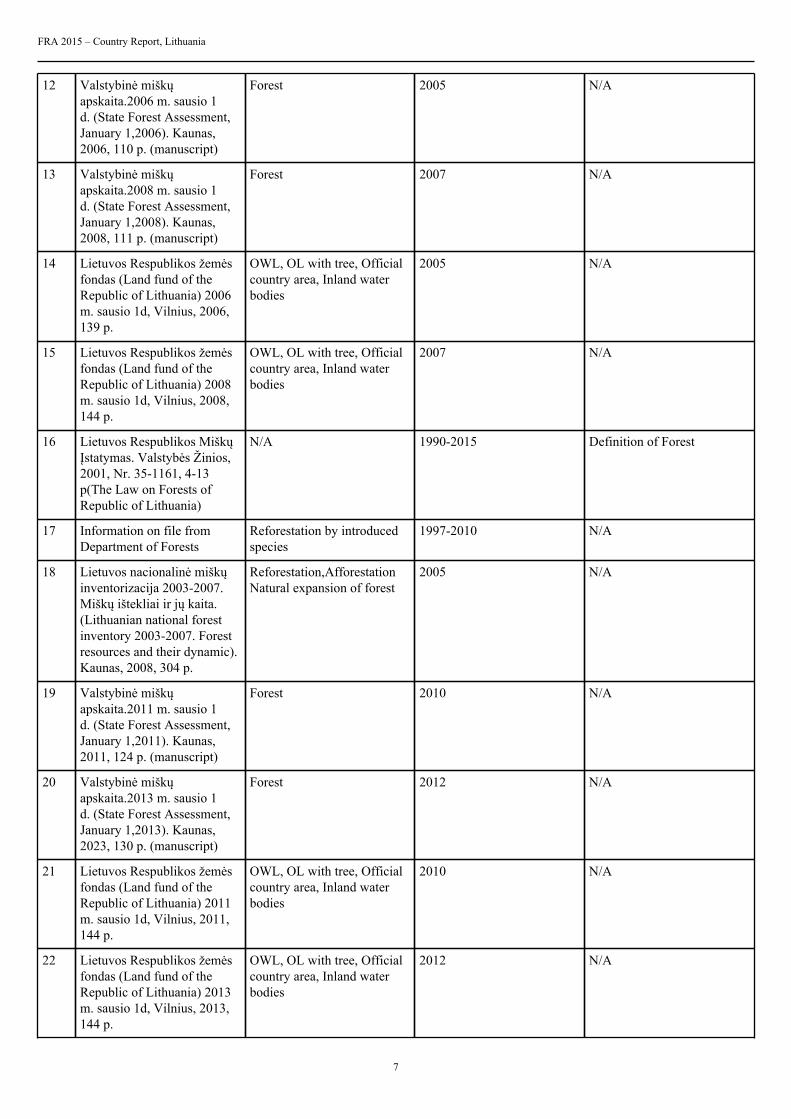
12 Valstybinė miškų apskaita.2006 m. sausio 1d. (State Forest Assessment,January 1,2006). Kaunas,2006, 110 p. (manuscript)
Forest 2005 N/A
13 Valstybinė miškųapskaita.2008 m. sausio 1d. (State Forest Assessment,January 1,2008). Kaunas,2008, 111 p. (manuscript)
Forest 2007 N/A
14 Lietuvos Respublikos žemėsfondas (Land fund of theRepublic of Lithuania) 2006m. sausio 1d, Vilnius, 2006,139 p.
OWL, OL with tree, Officialcountry area, Inland waterbodies
2005 N/A
15 Lietuvos Respublikos žemėsfondas (Land fund of theRepublic of Lithuania) 2008m. sausio 1d, Vilnius, 2008,144 p.
OWL, OL with tree, Officialcountry area, Inland waterbodies
2007 N/A
16 Lietuvos Respublikos Miškų Įstatymas. Valstybės Žinios,2001, Nr. 35-1161, 4-13p(The Law on Forests ofRepublic of Lithuania)
N/A 1990-2015 Definition of Forest
17 Information on file fromDepartment of Forests
Reforestation by introducedspecies
1997-2010 N/A
18 Lietuvos nacionalinė miškų inventorizacija 2003-2007.Miškų ištekliai ir jų kaita.(Lithuanian national forestinventory 2003-2007. Forestresources and their dynamic).Kaunas, 2008, 304 p.
Reforestation,AfforestationNatural expansion of forest
2005 N/A
19 Valstybinė miškų apskaita.2011 m. sausio 1d. (State Forest Assessment,January 1,2011). Kaunas,2011, 124 p. (manuscript)
Forest 2010 N/A
20 Valstybinė miškų apskaita.2013 m. sausio 1d. (State Forest Assessment,January 1,2013). Kaunas,2023, 130 p. (manuscript)
Forest 2012 N/A
21 Lietuvos Respublikos žemėsfondas (Land fund of theRepublic of Lithuania) 2011m. sausio 1d, Vilnius, 2011,144 p.
OWL, OL with tree, Officialcountry area, Inland waterbodies
2010 N/A
22 Lietuvos Respublikos žemėsfondas (Land fund of theRepublic of Lithuania) 2013m. sausio 1d, Vilnius, 2013,144 p.
OWL, OL with tree, Officialcountry area, Inland waterbodies
2012 N/A

FRA 2015 – Country Report, Lithuania
8
23 Lietuvos nacionalinė miškųinventorizacija 2008-2012.Miškų ištekliai ir jų kaita.(Lithuanian national forestinventory 2008-2012. Forestresources and their dynamic).Kaunas, 2013, 304 p.
Reforestation,AfforestationNatural expansion of forest
2010 N/A
24 National greenhouse gasemission inventory report,1990-2011, Republic ofLithuania. Vilnius, 2013,p.666
Deforestation 2000,2005,2010 N/A
1.2.2 Classification and definitions
National class Definition
Forest A land area not less than 0.1 hectare in size covered with trees,the height of which in a natural site in the maturity age isnot less than 5 meters, other forest plants as well as thinnedor vegetation-lost forest due to the acts of nature or humanactivities (cutting areas, burnt areas, clearings). … Forest pitches,nursery areas, forest seed orchards, raw-material bushingsand plantations…forest roads, forest block, technological andfire break lines, areas covered by timber storage houses andother forest-related equipment, recreation grounds, animal feedgrounds, and land assigned for afforestation is ascribed to forestland as well. Tree lines up to 10 meters of width in fields, atroadsides, water bodies, in living areas and cemeteries, singletrees and bushes, parks planted and grown by man in urban andrural areas are not defined as forests.
Other wooded land (OWL) The other bushes and tree groups, growing in fields, wetlandsor close to water bodies, which are at variance with “forest“definition requirements, and not included into forest assessmentand they cover bigger than 0,1 ha are ascribed to other woodedland.
Other land with trees Urban parks, squares and gardens
Reforestation Forest expansion, reforestation According to requirements ofFRA_2015 classification
Natural expansion of forest Forest expansion, reforestation According to requirements ofFRA_2015 classification
1.2.3 Original data
Forest area

FRA 2015 – Country Report, Lithuania
9
Area (1000 hectares)FRA2010
categories 1987 1997 2000 2005 2007 2010 2012
Forest 1931 1978 2020 2121 2143 2170 2174
Otherwooded
land
N/d 82 83 73 77 84 92
Otherland
N/d 4208 4165 4074 4048 4013.5 4001.5
...ofwhich
with treecover
N/d 63 62 63 63 63 63
Inlandwaterbodies
262 262 262 262 262 262.5 262.5
TOTAL 6530 6530 6530 6530 6530 6530 6530
Forest expansion, reforestation
Annual forest establishment (hectares/ year)FRA2010Categories
1998 1999 2000 2001 2002 2003 2004 2005 2006 2007 2008 2009 2010 2011 2012
Afforestation
373 495 881 163 967 1194 1136 2177 3338 4246 3257 2643 3082 4747 3614
Reforestation
N/A
17950 15800
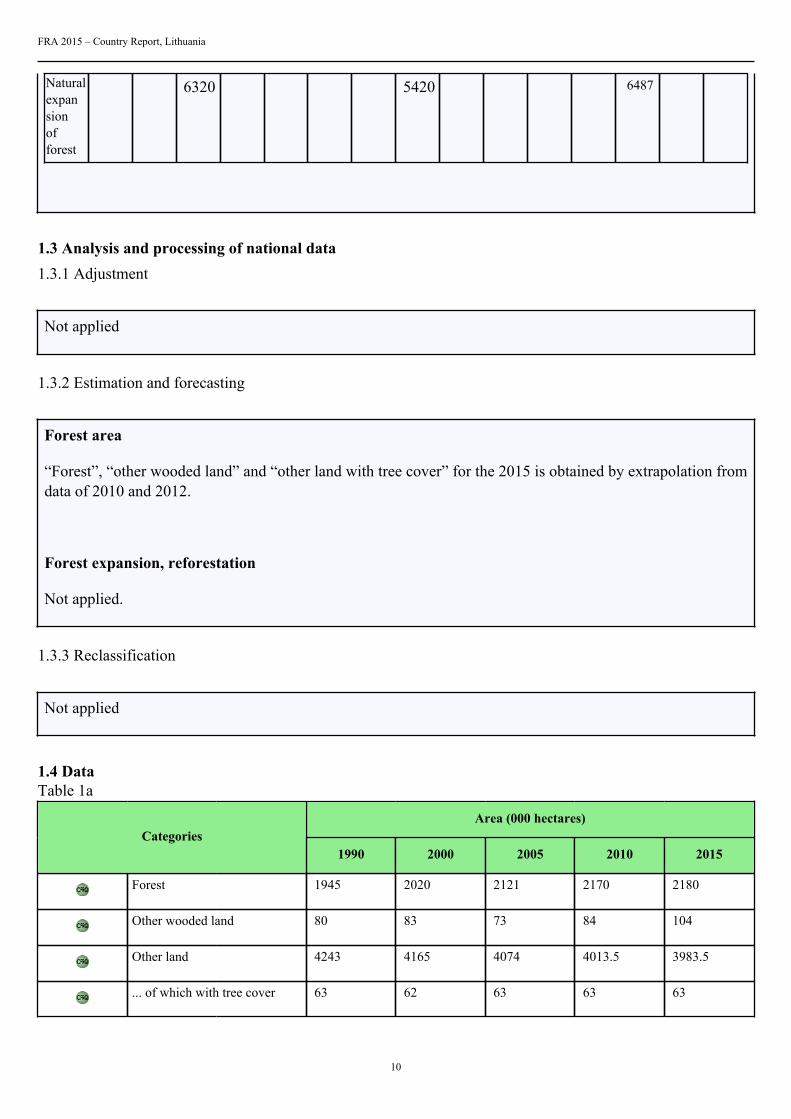
Naturalexpansionofforest
6320 5420 6487
Average
2000 2005 2010
Afforestation
575,8 2418,2 3469
Reforestation
N/A
17950
15800
FRA 2015 – Country Report, Lithuania
10
Naturalexpansionofforest
6320 5420 6487
1.3 Analysis and processing of national data1.3.1 Adjustment
Not applied
1.3.2 Estimation and forecasting
Forest area
“Forest”, “other wooded land” and “other land with tree cover” for the 2015 is obtained by extrapolation fromdata of 2010 and 2012.
Forest expansion, reforestation
Not applied.
1.3.3 Reclassification
Not applied
1.4 DataTable 1a
Area (000 hectares)Categories
1990 2000 2005 2010 2015
Forest 1945 2020 2121 2170 2180
Other wooded land 80 83 73 84 104
Other land 4243 4165 4074 4013.5 3983.5
... of which with tree cover 63 62 63 63 63

FRA 2015 – Country Report, Lithuania
11
Inland water bodies 262 262 262 262.5 262.5
TOTAL 6530.00 6530.00 6530.00 6530.00 6530.00
Table 1bAnnual forest establishment /loss (000 hectares per year)
...of which of introducedspecies (000 hectares per year)
Categories1990 2000 2005 2010 1990 2000 2005 2010
Forest expansion N/A 6.896 7.838 9.956 N/A 0 0 0
... of which afforestation N/A 0.576 2.418 3.469 N/A 0 0 0
... of which naturalexpansion of forest
N/A 6.32 5.42 6.487 N/A 0 0 0
Deforestation N/A 0.048 0.088 0.037 N/A 0 0 0
... of which human induced N/A 0.048 0.088 0.037 N/A 0 0 0
Reforestation N/A N/A 17.95 15.8 N/A 0.002 0.001 0
... of which artificial N/A N/A 8.19 8.7 N/A 0.002 0.001 0
Tiers
Category Tier for status Tier for reported trend
Forest Tier 3 Tier 3
Other wooded land Tier 3 Tier 3
Forest expansion Tier 1 Tier 3
Deforestation Tier 3 Tier 3
Reforestation Tier 3 Tier 3
Tier criteria
Category Tier for status Tier for reported trend
• Forest• Other wooded land• Afforestation• Reforestation• Natural expansion of forest• Deforestation
Tier 3 : Data sources: Either recent(less than 10 years ago) National ForestInventory or remote sensing, with groundtruthing, or programme for repeatedcompatible NFIs Tier 2 : Data sources:Full cover mapping / remote sensing orold NFI (more than 10 years ago) Tier 1 :Other
Tier 3 : Estimate based on repeatedcompatible tiers 3 (tier for status) Tier 2 :Estimate based on repeated compatible tier2 or combination tier 3 and 2 or 1 (tier forstatus) Tier 1 : Other
1.5 Comments
Category Comments related todata definitions etc Comments on the reported trends
FRA 2015 – Country Report, Lithuania
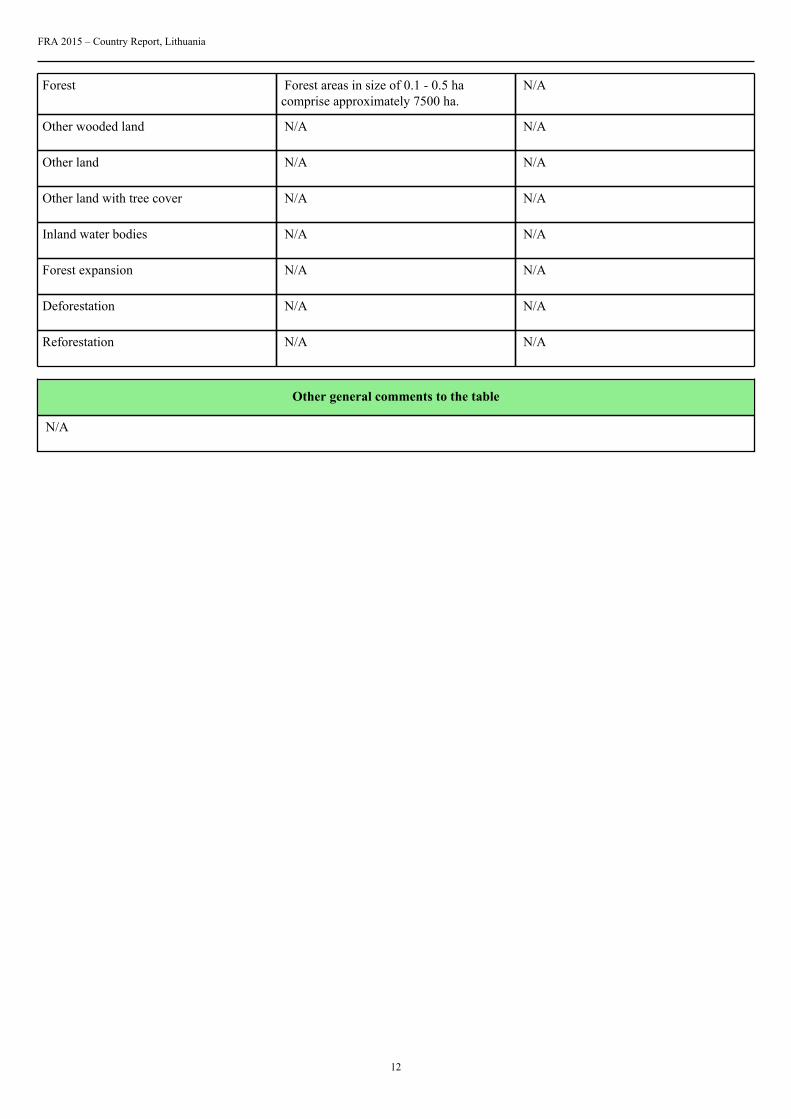
12
Forest Forest areas in size of 0.1 - 0.5 hacomprise approximately 7500 ha.
N/A
Other wooded land N/A N/A
Other land N/A N/A
Other land with tree cover N/A N/A
Inland water bodies N/A N/A
Forest expansion N/A N/A
Deforestation N/A N/A
Reforestation N/A N/A
Other general comments to the table
N/A
FRA 2015 – Country Report, Lithuania
13
2. What is the area of natural and planted forest and how has it changed over time?Documents for this question:
• Guide for country reporting FRA 2015• FRA 2015 Terms and Definitions
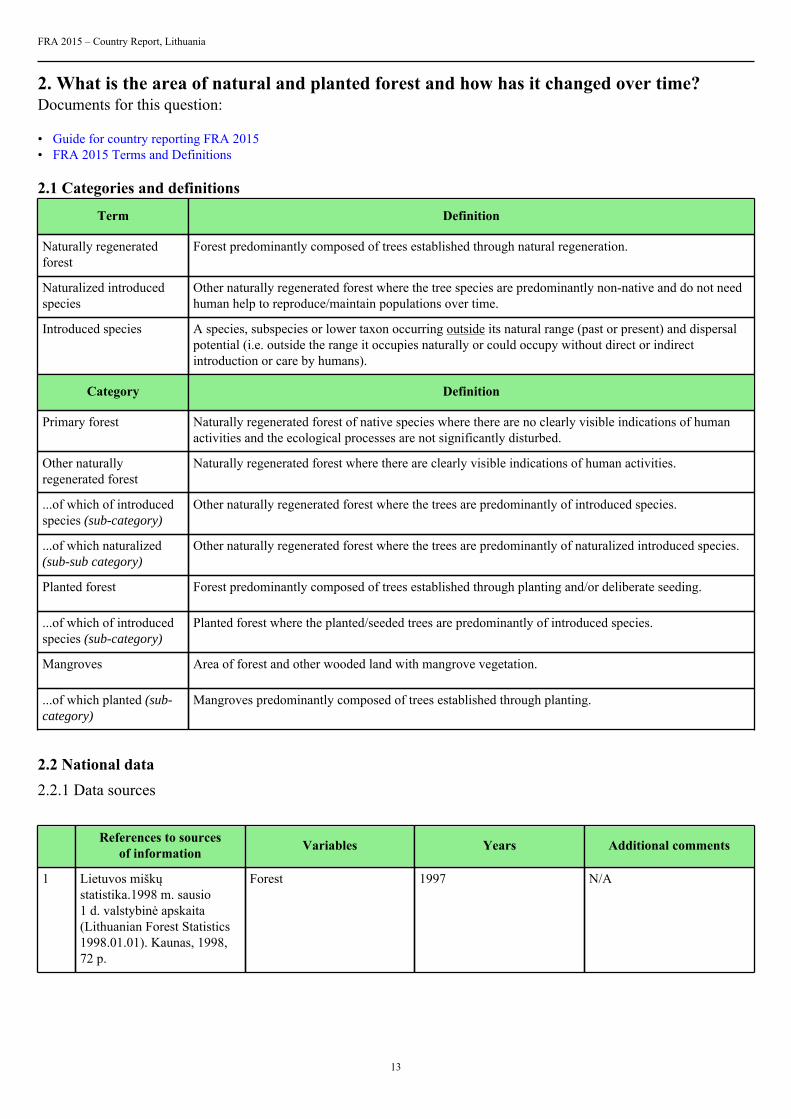
2.1 Categories and definitions
Term Definition
Naturally regeneratedforest
Forest predominantly composed of trees established through natural regeneration.
Naturalized introducedspecies
Other naturally regenerated forest where the tree species are predominantly non-native and do not needhuman help to reproduce/maintain populations over time.
Introduced species A species, subspecies or lower taxon occurring outside its natural range (past or present) and dispersalpotential (i.e. outside the range it occupies naturally or could occupy without direct or indirectintroduction or care by humans).
Category Definition
Primary forest Naturally regenerated forest of native species where there are no clearly visible indications of humanactivities and the ecological processes are not significantly disturbed.
Other naturallyregenerated forest
Naturally regenerated forest where there are clearly visible indications of human activities.
...of which of introducedspecies (sub-category)
Other naturally regenerated forest where the trees are predominantly of introduced species.
...of which naturalized(sub-sub category)
Other naturally regenerated forest where the trees are predominantly of naturalized introduced species.
Planted forest Forest predominantly composed of trees established through planting and/or deliberate seeding.
...of which of introducedspecies (sub-category)
Planted forest where the planted/seeded trees are predominantly of introduced species.
Mangroves Area of forest and other wooded land with mangrove vegetation.
...of which planted (sub-category)
Mangroves predominantly composed of trees established through planting.
2.2 National data2.2.1 Data sources
References to sourcesof information Variables Years Additional comments
1 Lietuvos miškųstatistika.1998 m. sausio1 d. valstybinė apskaita(Lithuanian Forest Statistics1998.01.01). Kaunas, 1998,72 p.
Forest 1997 N/A
FRA 2015 – Country Report, Lithuania
14
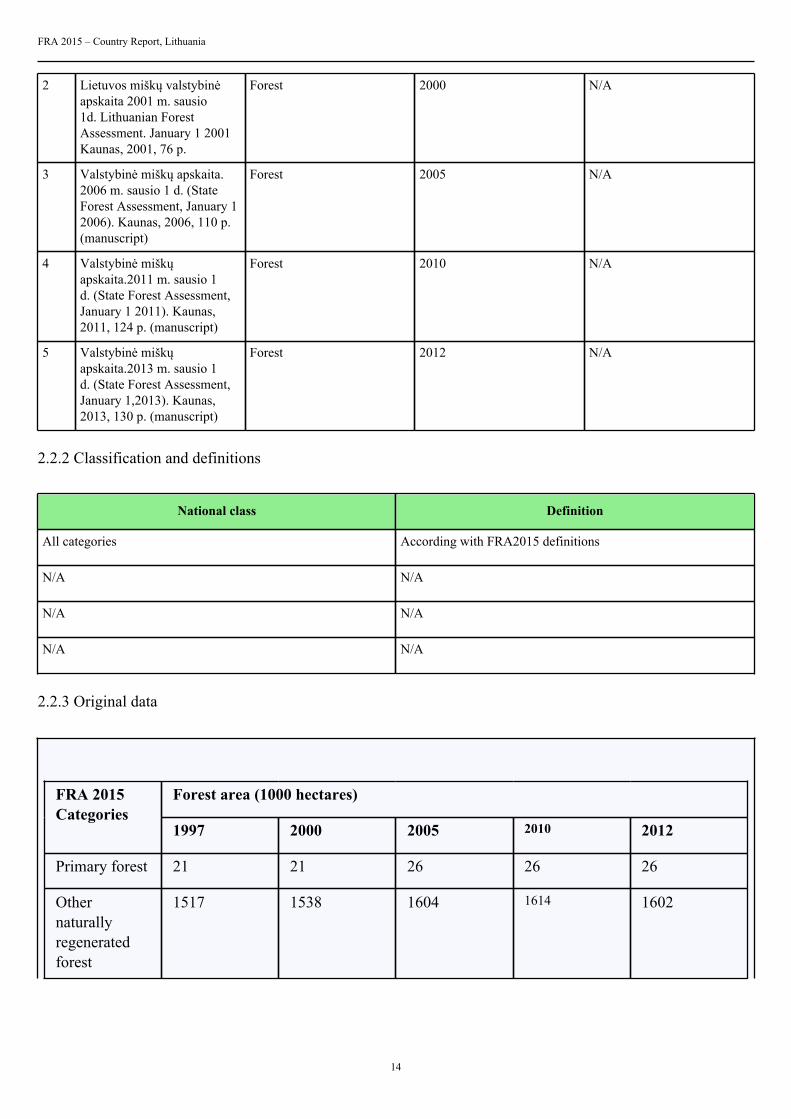
2 Lietuvos miškų valstybinė apskaita 2001 m. sausio1d. Lithuanian ForestAssessment. January 1 2001Kaunas, 2001, 76 p.
Forest 2000 N/A
3 Valstybinė miškų apskaita.2006 m. sausio 1 d. (StateForest Assessment, January 12006). Kaunas, 2006, 110 p.(manuscript)
Forest 2005 N/A
4 Valstybinė miškųapskaita.2011 m. sausio 1d. (State Forest Assessment,January 1 2011). Kaunas,2011, 124 p. (manuscript)
Forest 2010 N/A
5 Valstybinė miškųapskaita.2013 m. sausio 1d. (State Forest Assessment,January 1,2013). Kaunas,2013, 130 p. (manuscript)
Forest 2012 N/A
2.2.2 Classification and definitions
National class Definition
All categories According with FRA2015 definitions
N/A N/A
N/A N/A
N/A N/A
2.2.3 Original data
Forest area (1000 hectares)FRA 2015Categories
1997 2000 2005 2010 2012
Primary forest 21 21 26 26 26
Othernaturallyregeneratedforest
1517 1538 1604 1614 1602
FRA 2015 – Country Report, Lithuania
15
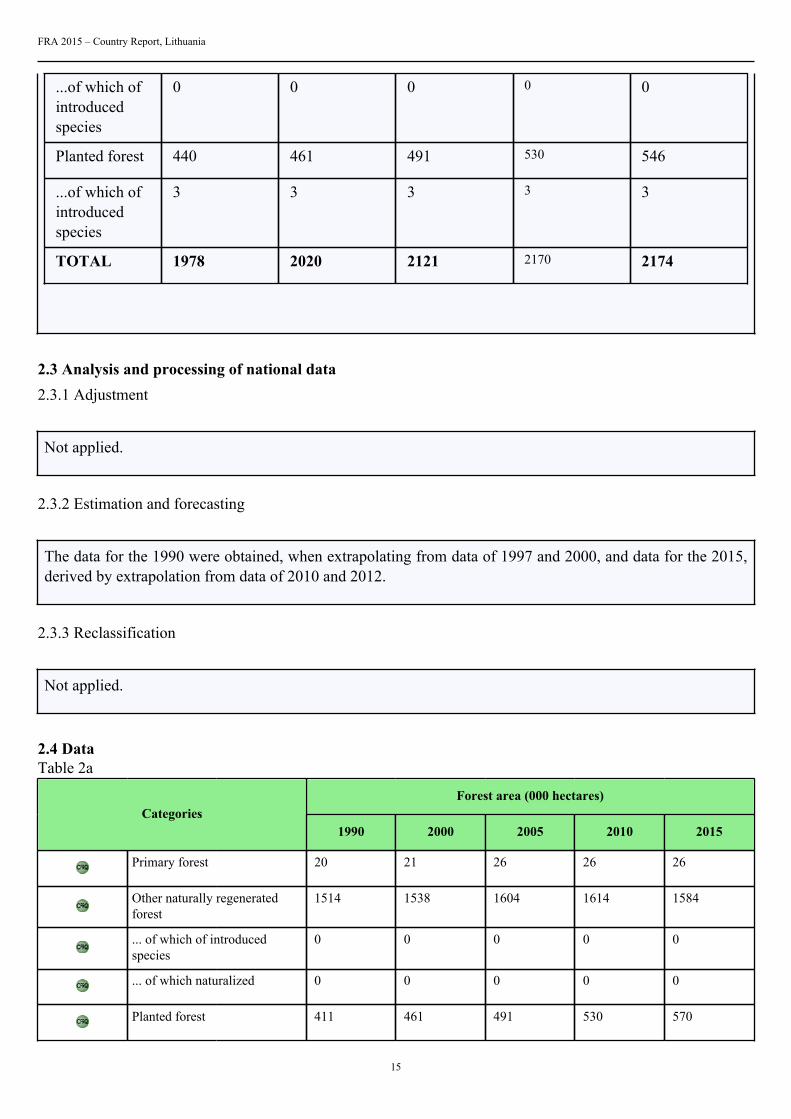
...of which ofintroducedspecies
0 0 0 0 0
Planted forest 440 461 491 530 546
...of which ofintroducedspecies
3 3 3 3 3
TOTAL 1978 2020 2121 2170 2174
2.3 Analysis and processing of national data2.3.1 Adjustment
Not applied.
2.3.2 Estimation and forecasting
The data for the 1990 were obtained, when extrapolating from data of 1997 and 2000, and data for the 2015,derived by extrapolation from data of 2010 and 2012.
2.3.3 Reclassification
Not applied.
2.4 DataTable 2a
Forest area (000 hectares)Categories
1990 2000 2005 2010 2015
Primary forest 20 21 26 26 26
Other naturally regeneratedforest
1514 1538 1604 1614 1584
... of which of introducedspecies
0 0 0 0 0
... of which naturalized 0 0 0 0 0
Planted forest 411 461 491 530 570
FRA 2015 – Country Report, Lithuania
16
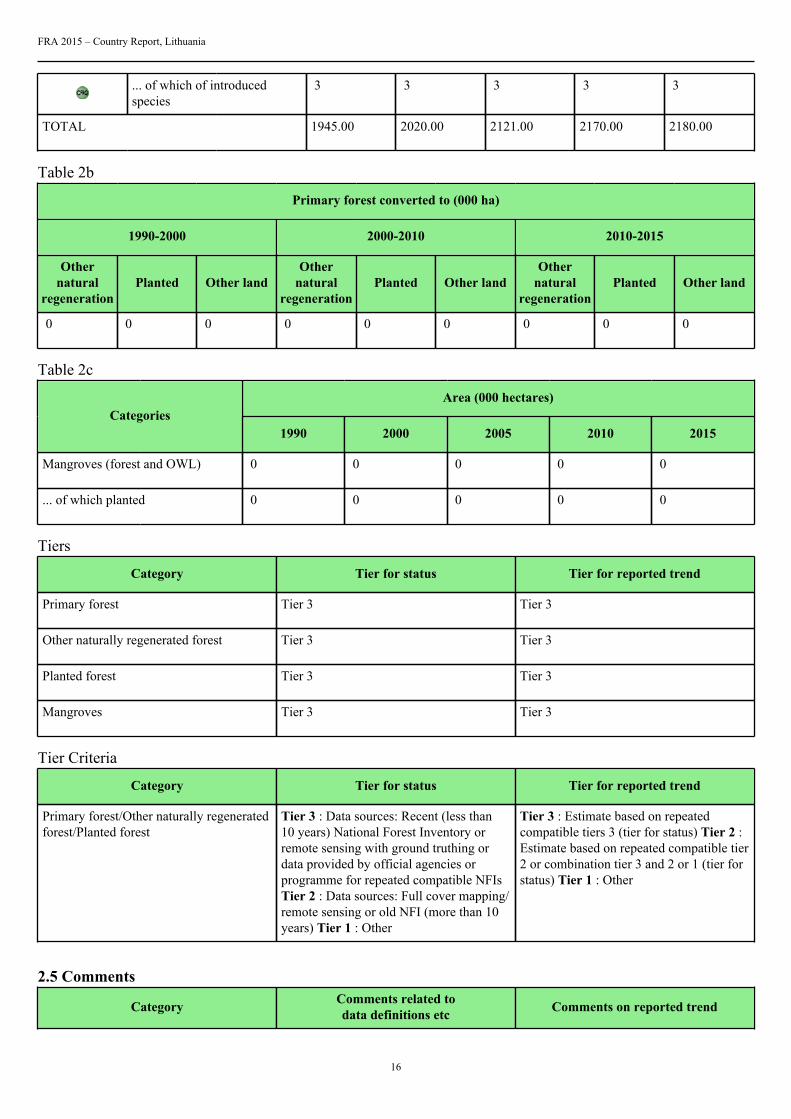
... of which of introducedspecies
3 3 3 3 3
TOTAL 1945.00 2020.00 2121.00 2170.00 2180.00
Table 2b
Primary forest converted to (000 ha)
1990-2000 2000-2010 2010-2015
Othernatural
regenerationPlanted Other land
Othernatural
regenerationPlanted Other land
Othernatural
regenerationPlanted Other land
0 0 0 0 0 0 0 0 0
Table 2c
Area (000 hectares)Categories
1990 2000 2005 2010 2015
Mangroves (forest and OWL) 0 0 0 0 0
... of which planted 0 0 0 0 0
Tiers
Category Tier for status Tier for reported trend
Primary forest Tier 3 Tier 3
Other naturally regenerated forest Tier 3 Tier 3
Planted forest Tier 3 Tier 3
Mangroves Tier 3 Tier 3
Tier Criteria
Category Tier for status Tier for reported trend
Primary forest/Other naturally regeneratedforest/Planted forest
Tier 3 : Data sources: Recent (less than10 years) National Forest Inventory orremote sensing with ground truthing ordata provided by official agencies orprogramme for repeated compatible NFIsTier 2 : Data sources: Full cover mapping/remote sensing or old NFI (more than 10years) Tier 1 : Other
Tier 3 : Estimate based on repeatedcompatible tiers 3 (tier for status) Tier 2 :Estimate based on repeated compatible tier2 or combination tier 3 and 2 or 1 (tier forstatus) Tier 1 : Other
2.5 Comments
Category Comments related todata definitions etc Comments on reported trend
FRA 2015 – Country Report, Lithuania
17
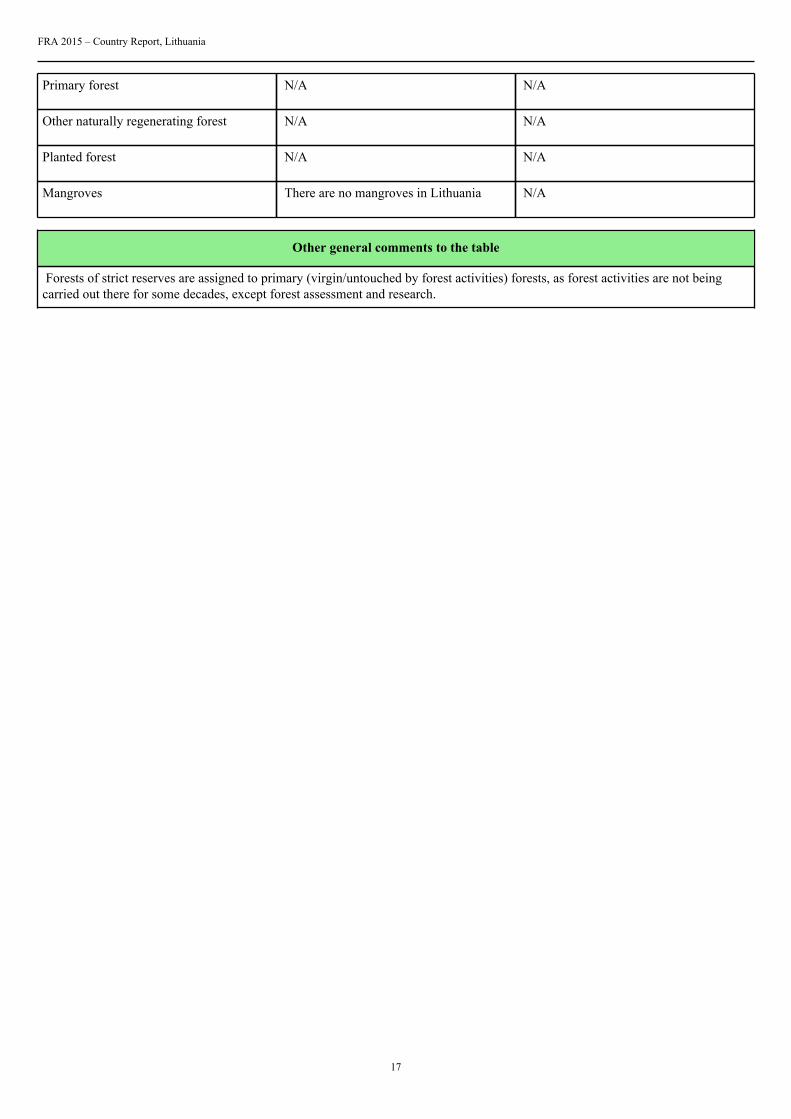
Primary forest N/A N/A
Other naturally regenerating forest N/A N/A
Planted forest N/A N/A
Mangroves There are no mangroves in Lithuania N/A
Other general comments to the table
Forests of strict reserves are assigned to primary (virgin/untouched by forest activities) forests, as forest activities are not beingcarried out there for some decades, except forest assessment and research.
FRA 2015 – Country Report, Lithuania
18
3. What are the stocks and growth rates of the forests and how have they changed?Documents for this question:
• Guide for country reporting FRA 2015• FRA 2015 Terms and Definitions
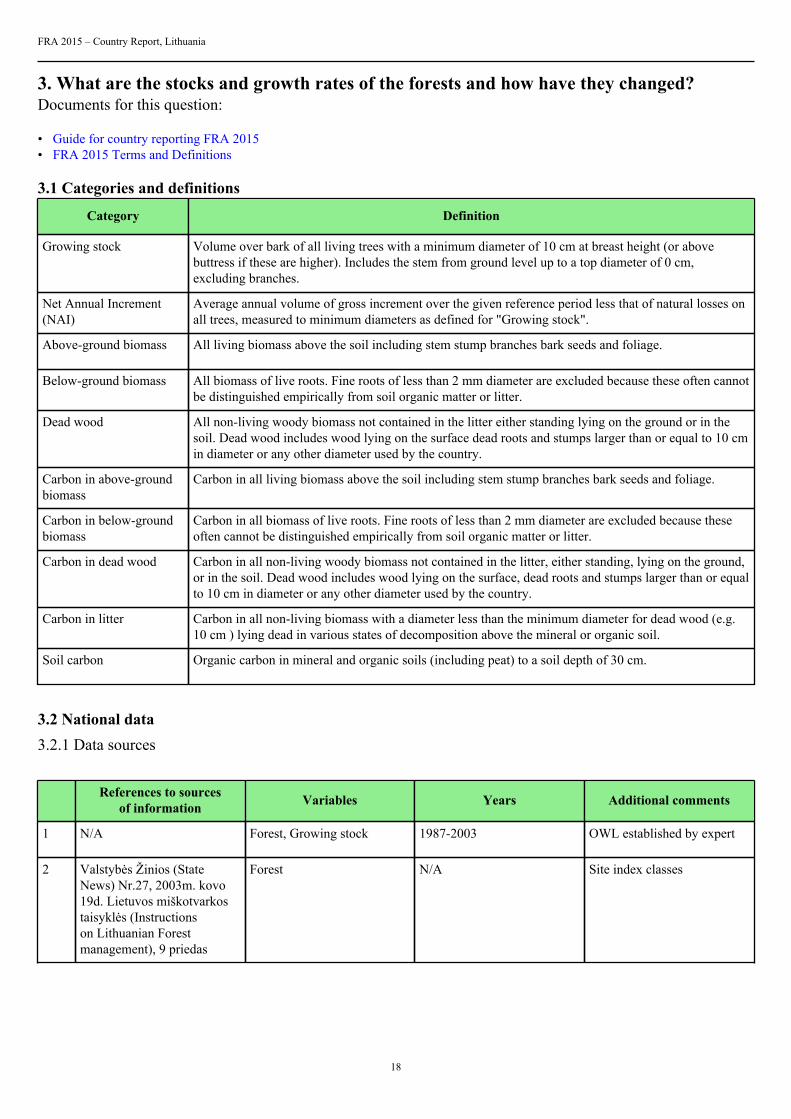
3.1 Categories and definitions
Category Definition
Growing stock Volume over bark of all living trees with a minimum diameter of 10 cm at breast height (or abovebuttress if these are higher). Includes the stem from ground level up to a top diameter of 0 cm,excluding branches.
Net Annual Increment(NAI)
Average annual volume of gross increment over the given reference period less that of natural losses onall trees, measured to minimum diameters as defined for "Growing stock".
Above-ground biomass All living biomass above the soil including stem stump branches bark seeds and foliage.
Below-ground biomass All biomass of live roots. Fine roots of less than 2 mm diameter are excluded because these often cannotbe distinguished empirically from soil organic matter or litter.
Dead wood All non-living woody biomass not contained in the litter either standing lying on the ground or in thesoil. Dead wood includes wood lying on the surface dead roots and stumps larger than or equal to 10 cmin diameter or any other diameter used by the country.
Carbon in above-groundbiomass
Carbon in all living biomass above the soil including stem stump branches bark seeds and foliage.
Carbon in below-groundbiomass
Carbon in all biomass of live roots. Fine roots of less than 2 mm diameter are excluded because theseoften cannot be distinguished empirically from soil organic matter or litter.
Carbon in dead wood Carbon in all non-living woody biomass not contained in the litter, either standing, lying on the ground,or in the soil. Dead wood includes wood lying on the surface, dead roots and stumps larger than or equalto 10 cm in diameter or any other diameter used by the country.
Carbon in litter Carbon in all non-living biomass with a diameter less than the minimum diameter for dead wood (e.g.10 cm ) lying dead in various states of decomposition above the mineral or organic soil.
Soil carbon Organic carbon in mineral and organic soils (including peat) to a soil depth of 30 cm.
3.2 National data3.2.1 Data sources
References to sourcesof information Variables Years Additional comments
1 N/A Forest, Growing stock 1987-2003 OWL established by expert
2 Valstybės Žinios (StateNews) Nr.27, 2003m. kovo19d. Lietuvos miškotvarkostaisyklės (Instructionson Lithuanian Forestmanagement), 9 priedas
Forest N/A Site index classes
FRA 2015 – Country Report, Lithuania
19
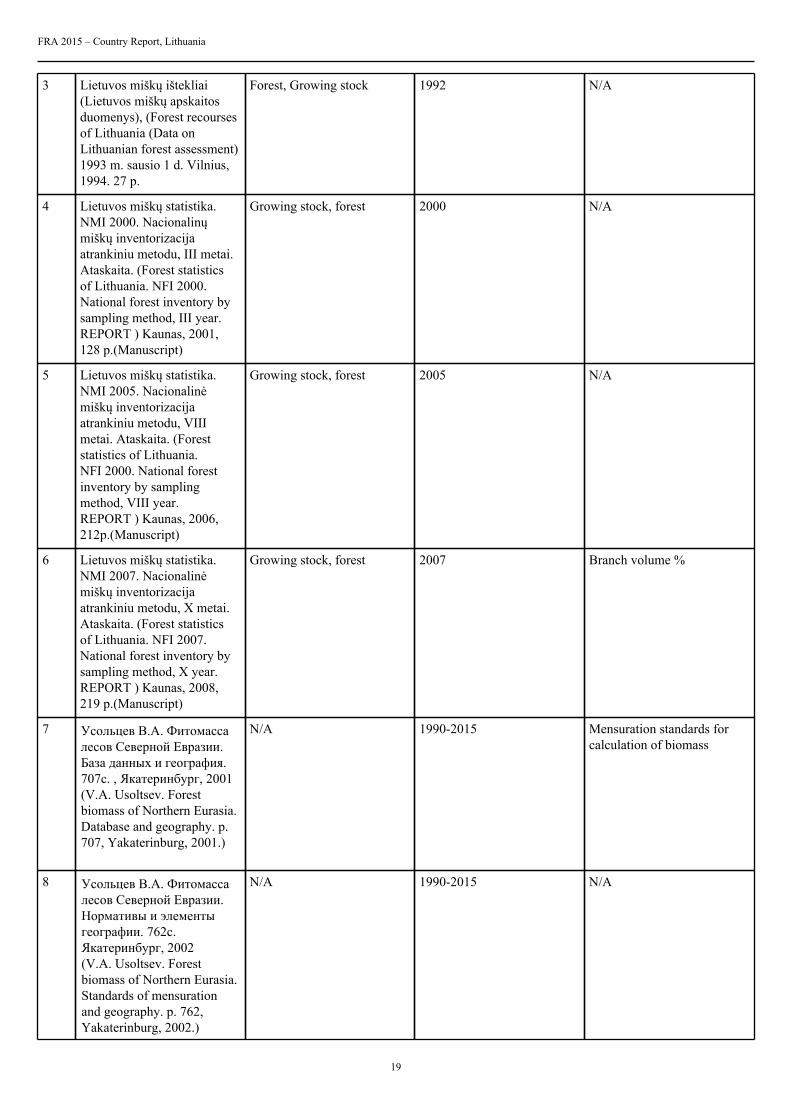
3 Lietuvos miškų ištekliai(Lietuvos miškų apskaitosduomenys), (Forest recoursesof Lithuania (Data onLithuanian forest assessment)1993 m. sausio 1 d. Vilnius,1994. 27 p.
Forest, Growing stock 1992 N/A
4 Lietuvos miškų statistika.NMI 2000. Nacionalinųmiškų inventorizacijaatrankiniu metodu, III metai.Ataskaita. (Forest statisticsof Lithuania. NFI 2000.National forest inventory bysampling method, III year.REPORT ) Kaunas, 2001,128 p.(Manuscript)
Growing stock, forest 2000 N/A
5 Lietuvos miškų statistika.NMI 2005. Nacionalinėmiškų inventorizacijaatrankiniu metodu, VIIImetai. Ataskaita. (Foreststatistics of Lithuania.NFI 2000. National forestinventory by samplingmethod, VIII year.REPORT ) Kaunas, 2006,212p.(Manuscript)
Growing stock, forest 2005 N/A
6 Lietuvos miškų statistika.NMI 2007. Nacionalinėmiškų inventorizacijaatrankiniu metodu, X metai.Ataskaita. (Forest statisticsof Lithuania. NFI 2007.National forest inventory bysampling method, X year.REPORT ) Kaunas, 2008,219 p.(Manuscript)
Growing stock, forest 2007 Branch volume %
7 Усольцев В.А. Фитомасса лесов Северной Евразии.База данных и география. 707с. , Якатеринбург, 2001 (V.A. Usoltsev. Forest biomass of Northern Eurasia. Database and geography. p. 707, Yakaterinburg, 2001.)
N/A 1990-2015 Mensuration standards forcalculation of biomass
8 Усольцев В.А. Фитомасса лесов Северной Евразии. Нормативы и элементы географии. 762с. Якатеринбург, 2002(V.A. Usoltsev. Forestbiomass of Northern Eurasia.Standards of mensurationand geography. p. 762,Yakaterinburg, 2002.)
N/A 1990-2015 N/A

FRA 2015 – Country Report, Lithuania
20
9 3.Усольцев В.А. Фитомасса лесов Северной Евразии.Предельная продуктивность и география. 405 c., Якатеринбург, 2003 (V.A. Usoltsev. Forest biomass of Northern Eurasia. The limits of productivity andtheir geography. P. 405,Yakaterinburg, 2003)
N/A 1990-2015 N/A
10 Lietuvos miškų valstybinėapskaita 2001 m. sausio1d. (Lithuanian ForestAssessment. January, 1 2001,Kaunas, 2001)
Forest 1900,2000,2005,2010,2012 Forest distribution accordingto site index (for theestimations of carbon in thelitter and soil layers).
11 Lietuvos nacionalinė miškų inventorizacija 2008-2012.Miškų ištekliai ir jų kaita.(Lithuanian national forestinventory 2008-2012. Forestresources and their dynamic).Kaunas, 2013, 304 p.
Growing stock, forest,increment
2010 N/A
3.2.2 Classification and definitions
National class Definition
Growing stock Volume over bark of all living trees more than 2 cm in diameterat breast height (or above buttress if these are higher). Includesthe stem from ground level. Branches are not included.
Soil carbon Organic carbon in mineral and organic soils (including peat) toa specified depth chosen by the country and applied consistentlythrough the time series.
N/A N/A
N/A N/A
3.2.3 Original data
Growing stock
Growing stock
Volume (million cubic meters over bark)
Forest Other wooded land
FRA2015category
1990 2000 2005 2007 2010 1990 2000 2005 2010
FRA 2015 – Country Report, Lithuania
21
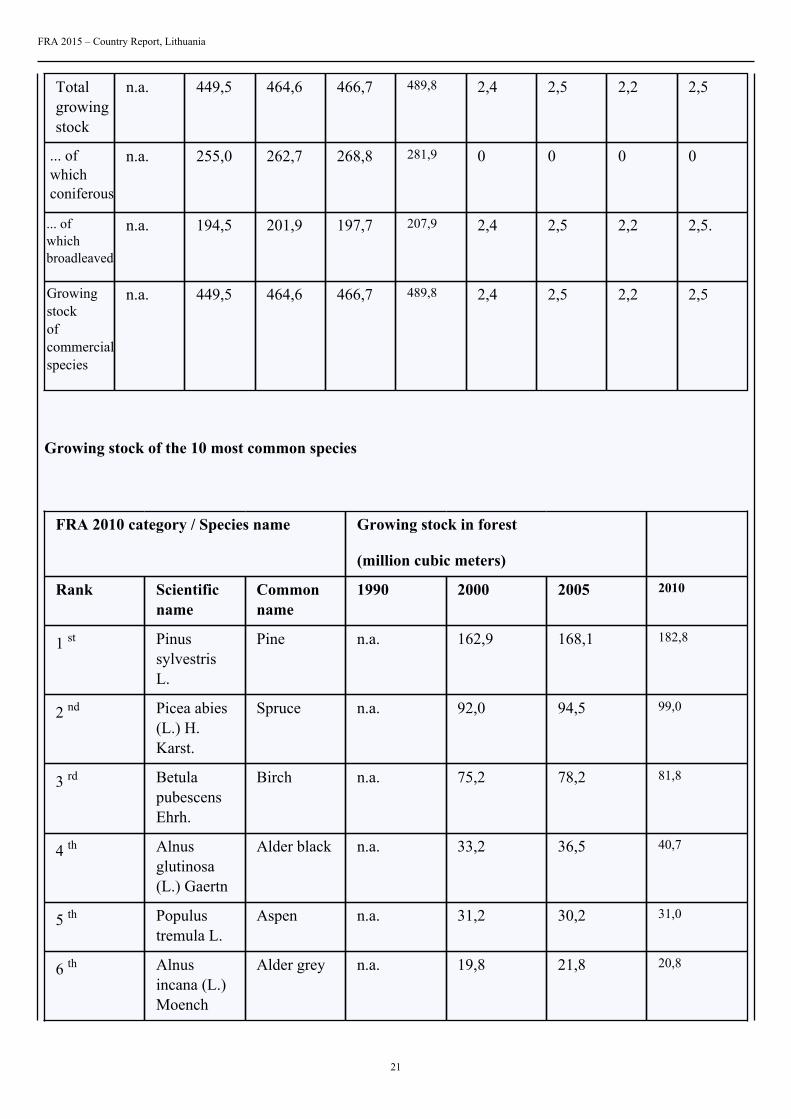
Totalgrowingstock
n.a. 449,5 464,6 466,7 489,8 2,4 2,5 2,2 2,5
... ofwhichconiferous
n.a. 255,0 262,7 268,8 281,9 0 0 0 0
... ofwhichbroadleaved
n.a. 194,5 201,9 197,7 207,9 2,4 2,5 2,2 2,5.
Growingstockofcommercialspecies
n.a. 449,5 464,6 466,7 489,8 2,4 2,5 2,2 2,5
Growing stock of the 10 most common species
FRA 2010 category / Species name Growing stock in forest
(million cubic meters)
Rank Scientificname
Commonname
1990 2000 2005 2010
1 st PinussylvestrisL.
Pine n.a. 162,9 168,1 182,8
2 nd Picea abies(L.) H.Karst.
Spruce n.a. 92,0 94,5 99,0
3 rd BetulapubescensEhrh.
Birch n.a. 75,2 78,2 81,8
4 th Alnusglutinosa(L.) Gaertn
Alder black n.a. 33,2 36,5 40,7
5 th Populustremula L.
Aspen n.a. 31,2 30,2 31,0
6 th Alnusincana (L.)Moench
Alder grey n.a. 19,8 21,8 20,8
FRA 2015 – Country Report, Lithuania
22
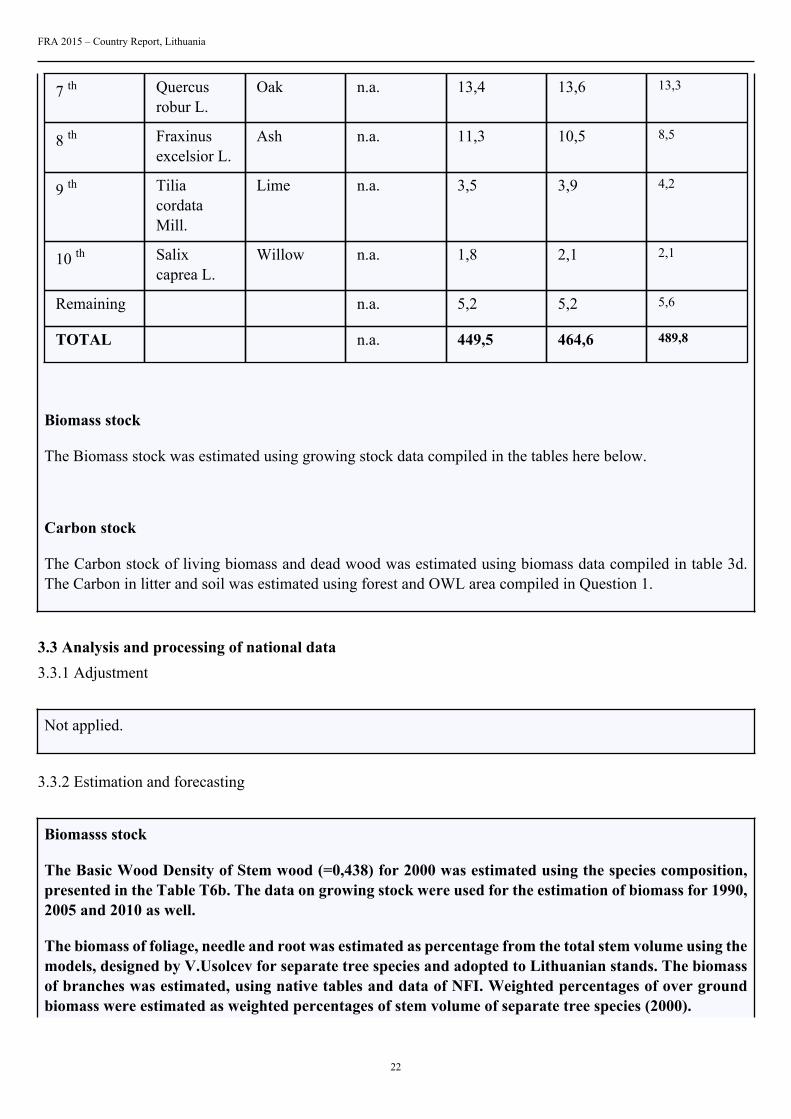
7 th Quercusrobur L.
Oak n.a. 13,4 13,6 13,3
8 th Fraxinusexcelsior L.
Ash n.a. 11,3 10,5 8,5
9 th TiliacordataMill.
Lime n.a. 3,5 3,9 4,2
10 th Salixcaprea L.
Willow n.a. 1,8 2,1 2,1
Remaining n.a. 5,2 5,2 5,6
TOTAL n.a. 449,5 464,6 489,8
Biomass stock
The Biomass stock was estimated using growing stock data compiled in the tables here below.
Carbon stock
The Carbon stock of living biomass and dead wood was estimated using biomass data compiled in table 3d.The Carbon in litter and soil was estimated using forest and OWL area compiled in Question 1.
3.3 Analysis and processing of national data3.3.1 Adjustment
Not applied.
3.3.2 Estimation and forecasting
Biomasss stock
The Basic Wood Density of Stem wood (=0,438) for 2000 was estimated using the species composition,presented in the Table T6b. The data on growing stock were used for the estimation of biomass for 1990,2005 and 2010 as well.
The biomass of foliage, needle and root was estimated as percentage from the total stem volume using themodels, designed by V.Usolcev for separate tree species and adopted to Lithuanian stands. The biomassof branches was estimated, using native tables and data of NFI. Weighted percentages of over groundbiomass were estimated as weighted percentages of stem volume of separate tree species (2000).

FRA 2015 – Country Report, Lithuania
23
Tree species Needle andfoliage biomass
from thestem biomass
Branch biomassfrom the
stem biomass
Stump androot biomass
from the aboveground biomass
Stem volume
% % % mill.m 3
Pine 5 12 26 162.9
Spruce 11 20 26 92.0
Birch 3 16 18 75.2
Aspen 3 13 24 31.2
Black Alder 2 13 18 33.2
Grey Alder 3 13 17 19.8
Oak 3 15 25 13.4
Ash 3 20 20 11.3
Total:
coniferous
broadleaves
22.1
17.8
26.0
19.0
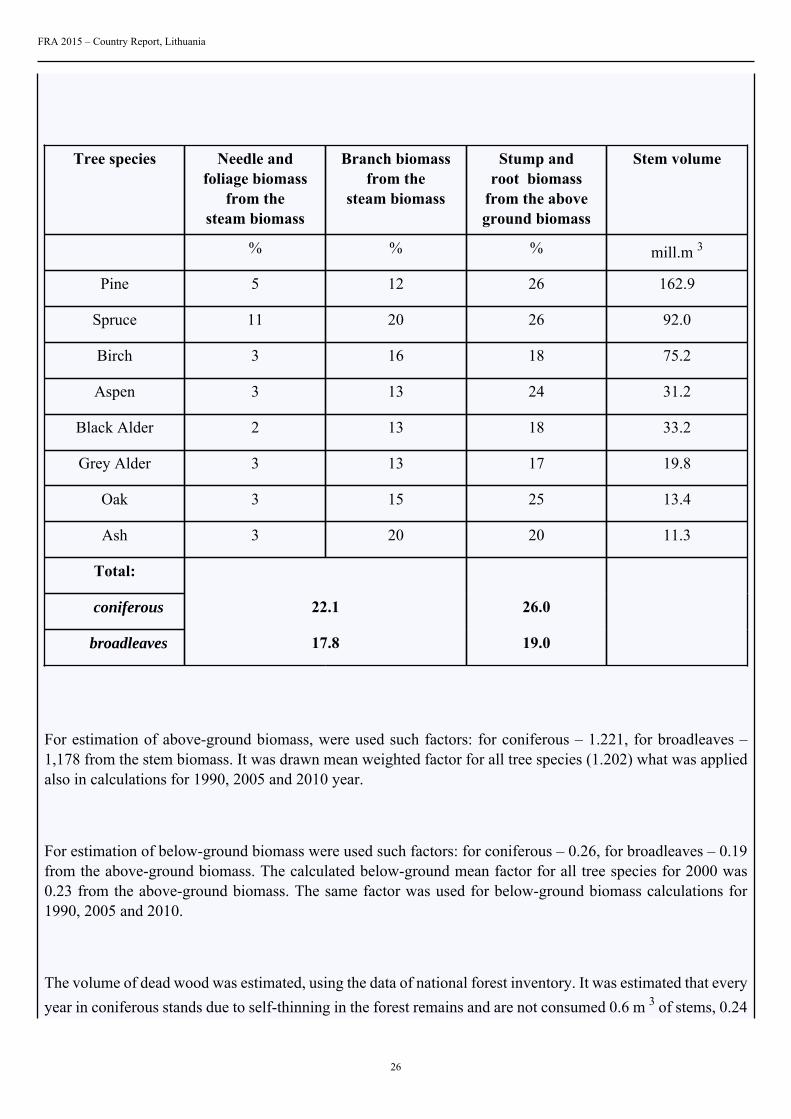
For estimation of above-ground biomass, were used such factors: for coniferous – 1.221, for broadleaves– 1,178 from the stem biomass. It was drawn mean weighted factor for all tree species (1.202) what wasapplied also in calculations for 1990, 2005 and 2010 year.
For estimation of below-ground biomass were used such factors: for coniferous – 0.26, for broadleaves– 0.19 from the above-ground biomass. The calculated below-ground mean factor for all tree speciesfor 2000 was 0.23 from the above-ground biomass. The same factor was used for below-ground biomasscalculations for 1990, 2005 and 2010.
The volume of dead wood was estimated, using the data of national forest inventory. It was estimated thatevery year in coniferous stands due to self-thinning in the forest remains and are not consumed 0.6 m 3
FRA 2015 – Country Report, Lithuania
24
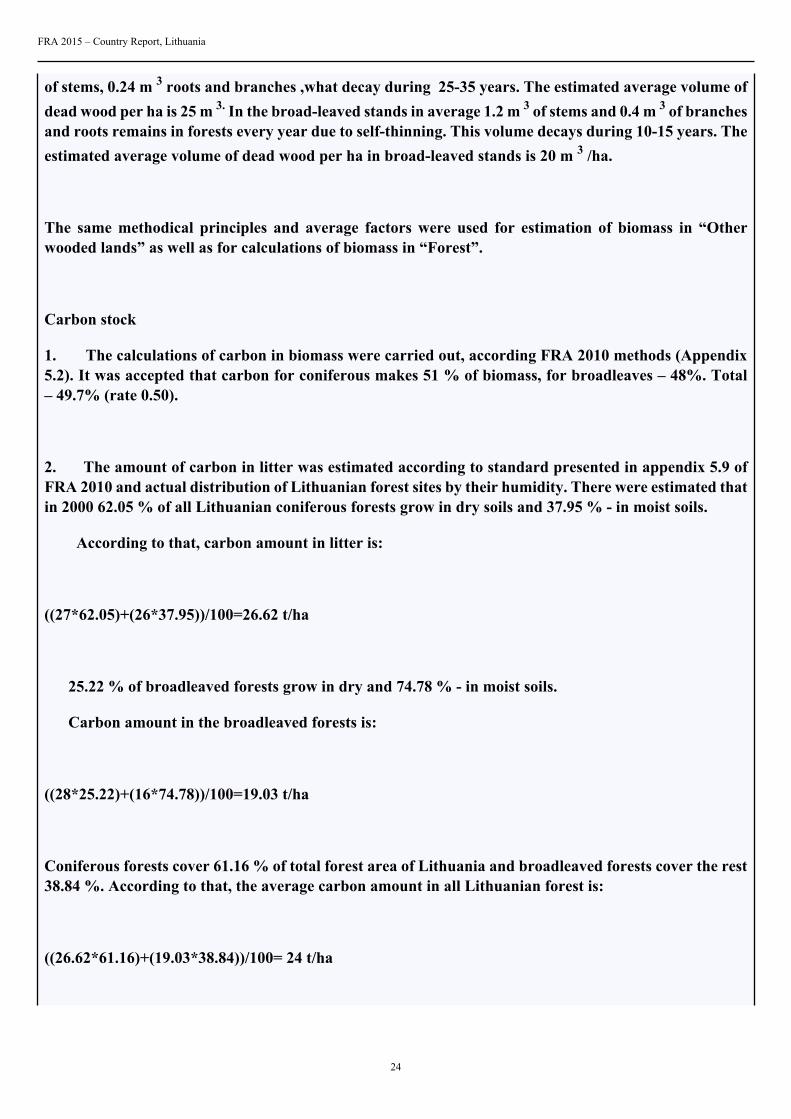
of stems, 0.24 m 3 roots and branches ,what decay during 25-35 years. The estimated average volume ofdead wood per ha is 25 m 3. In the broad-leaved stands in average 1.2 m 3 of stems and 0.4 m 3 of branchesand roots remains in forests every year due to self-thinning. This volume decays during 10-15 years. Theestimated average volume of dead wood per ha in broad-leaved stands is 20 m 3 /ha.
The same methodical principles and average factors were used for estimation of biomass in “Otherwooded lands” as well as for calculations of biomass in “Forest”.
Carbon stock
1. The calculations of carbon in biomass were carried out, according FRA 2010 methods (Appendix5.2). It was accepted that carbon for coniferous makes 51 % of biomass, for broadleaves – 48%. Total– 49.7% (rate 0.50).
2. The amount of carbon in litter was estimated according to standard presented in appendix 5.9 ofFRA 2010 and actual distribution of Lithuanian forest sites by their humidity. There were estimated thatin 2000 62.05 % of all Lithuanian coniferous forests grow in dry soils and 37.95 % - in moist soils.
According to that, carbon amount in litter is:
((27*62.05)+(26*37.95))/100=26.62 t/ha
25.22 % of broadleaved forests grow in dry and 74.78 % - in moist soils.
Carbon amount in the broadleaved forests is:
((28*25.22)+(16*74.78))/100=19.03 t/ha
Coniferous forests cover 61.16 % of total forest area of Lithuania and broadleaved forests cover the rest38.84 %. According to that, the average carbon amount in all Lithuanian forest is:
((26.62*61.16)+(19.03*38.84))/100= 24 t/ha
FRA 2015 – Country Report, Lithuania
25
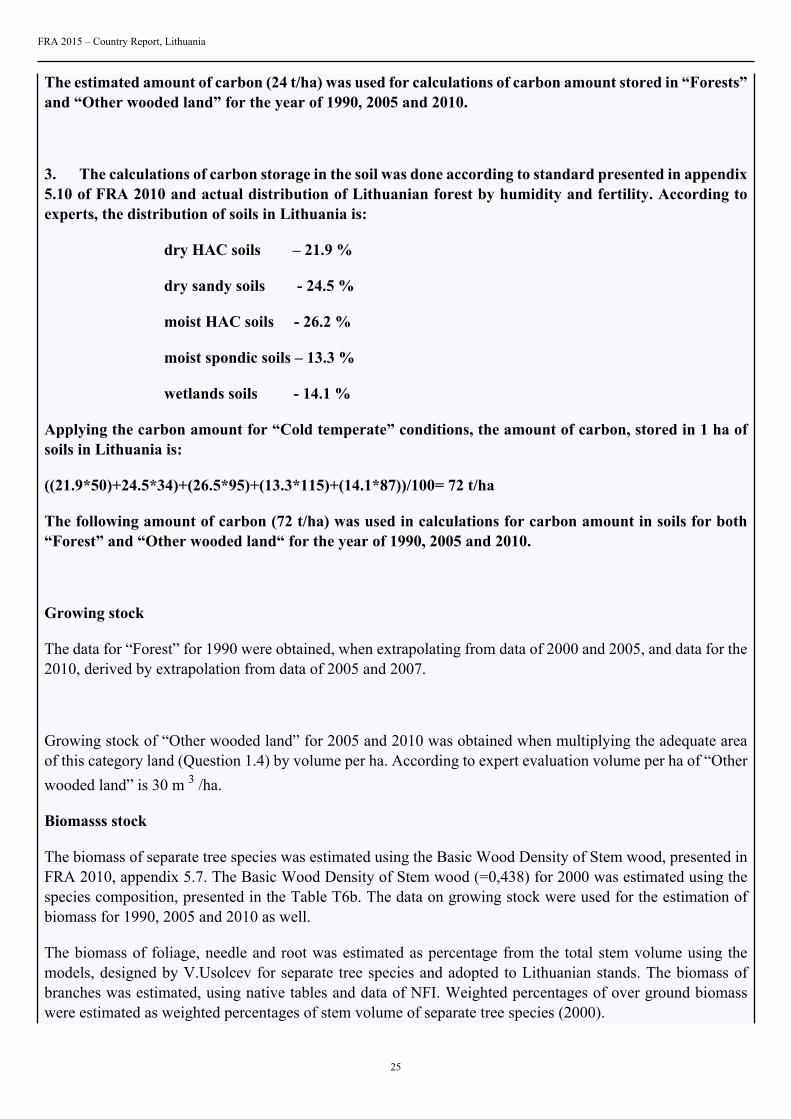
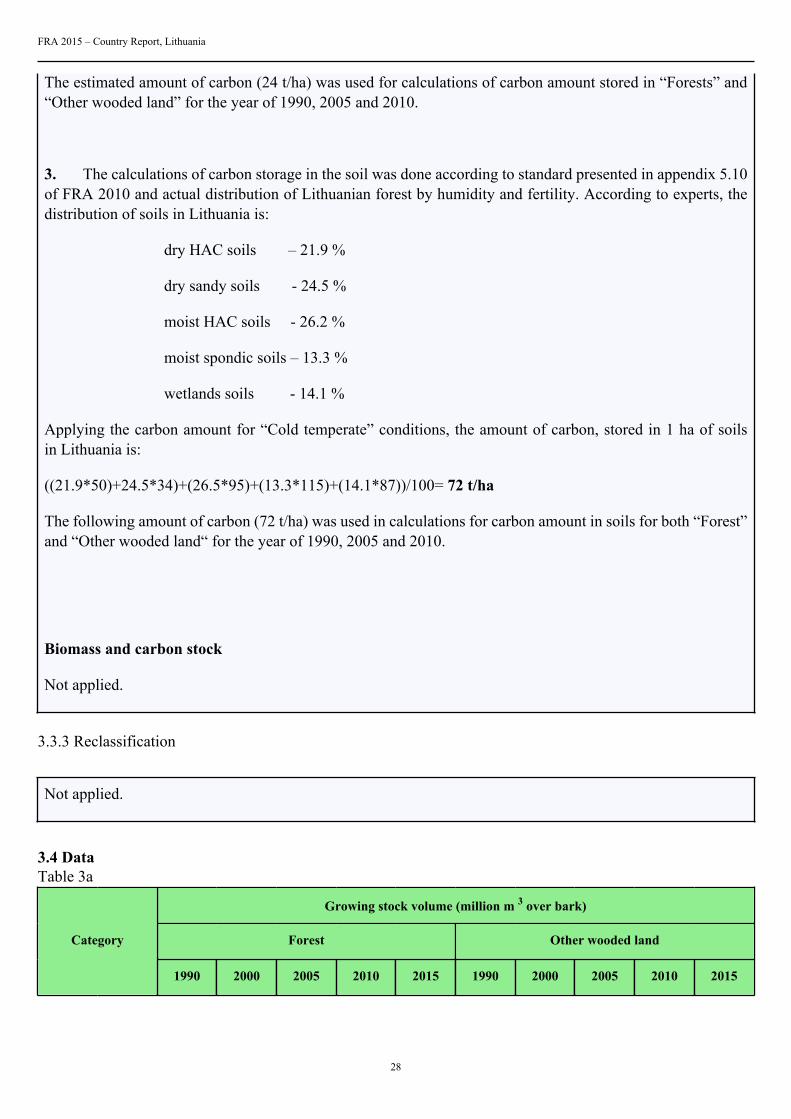
The estimated amount of carbon (24 t/ha) was used for calculations of carbon amount stored in “Forests”and “Other wooded land” for the year of 1990, 2005 and 2010.
3. The calculations of carbon storage in the soil was done according to standard presented in appendix5.10 of FRA 2010 and actual distribution of Lithuanian forest by humidity and fertility. According toexperts, the distribution of soils in Lithuania is:
dry HAC soils – 21.9 %
dry sandy soils - 24.5 %
moist HAC soils - 26.2 %
moist spondic soils – 13.3 %
wetlands soils - 14.1 %
Applying the carbon amount for “Cold temperate” conditions, the amount of carbon, stored in 1 ha ofsoils in Lithuania is:
((21.9*50)+24.5*34)+(26.5*95)+(13.3*115)+(14.1*87))/100= 72 t/ha
The following amount of carbon (72 t/ha) was used in calculations for carbon amount in soils for both“Forest” and “Other wooded land“ for the year of 1990, 2005 and 2010.
Growing stock
The data for “Forest” for 1990 were obtained, when extrapolating from data of 2000 and 2005, and data for the2010, derived by extrapolation from data of 2005 and 2007.
Growing stock of “Other wooded land” for 2005 and 2010 was obtained when multiplying the adequate areaof this category land (Question 1.4) by volume per ha. According to expert evaluation volume per ha of “Otherwooded land” is 30 m 3 /ha.
Biomasss stock
The biomass of separate tree species was estimated using the Basic Wood Density of Stem wood, presented inFRA 2010, appendix 5.7. The Basic Wood Density of Stem wood (=0,438) for 2000 was estimated using thespecies composition, presented in the Table T6b. The data on growing stock were used for the estimation ofbiomass for 1990, 2005 and 2010 as well.
The biomass of foliage, needle and root was estimated as percentage from the total stem volume using themodels, designed by V.Usolcev for separate tree species and adopted to Lithuanian stands. The biomass ofbranches was estimated, using native tables and data of NFI. Weighted percentages of over ground biomasswere estimated as weighted percentages of stem volume of separate tree species (2000).
FRA 2015 – Country Report, Lithuania
26
Tree species Needle andfoliage biomass
from thesteam biomass
Branch biomassfrom the
steam biomass
Stump androot biomass
from the aboveground biomass
Stem volume
% % % mill.m 3
Pine 5 12 26 162.9
Spruce 11 20 26 92.0
Birch 3 16 18 75.2
Aspen 3 13 24 31.2
Black Alder 2 13 18 33.2
Grey Alder 3 13 17 19.8
Oak 3 15 25 13.4
Ash 3 20 20 11.3
Total:
coniferous
broadleaves
22.1
17.8
26.0
19.0
For estimation of above-ground biomass, were used such factors: for coniferous – 1.221, for broadleaves –1,178 from the stem biomass. It was drawn mean weighted factor for all tree species (1.202) what was appliedalso in calculations for 1990, 2005 and 2010 year.
For estimation of below-ground biomass were used such factors: for coniferous – 0.26, for broadleaves – 0.19from the above-ground biomass. The calculated below-ground mean factor for all tree species for 2000 was0.23 from the above-ground biomass. The same factor was used for below-ground biomass calculations for1990, 2005 and 2010.
The volume of dead wood was estimated, using the data of national forest inventory. It was estimated that everyyear in coniferous stands due to self-thinning in the forest remains and are not consumed 0.6 m 3 of stems, 0.24

FRA 2015 – Country Report, Lithuania
27
m 3 roots and branches ,what decay during 25-35 years. The estimated average volume of dead wood per hais 25 m 3. In the broad-leaved stands in average 1.2 m 3 of stems and 0.4 m 3 of branches and roots remains inforests every year due to self-thinning. This volume decays during 10-15 years. The estimated average volumeof dead wood per ha in broad-leaved stands is 20 m 3 /ha.
The same methodical principles and average factors were used for estimation of biomass in “Other woodedlands” as well as for calculations of biomass in “Forest”.
Carbon stock
1. The calculations of carbon in biomass were carried out, according FRA 2010 methods (Appendix 5.2).It was accepted that carbon for coniferous makes 51 % of biomass, for broadleaves – 48%. Total – 49.7% (rate0.50).
2. The amount of carbon in litter was estimated according to standard presented in appendix 5.9 of FRA 2010and actual distribution of Lithuanian forest sites by their humidity. There were estimated that in 2000 62.05 %of all Lithuanian coniferous forests grow in dry soils and 37.95 % - in moist soils.
According to that, carbon amount in litter is:
((27*62.05)+(26*37.95))/100=26.62 t/ha
25.22 % of broadleaved forests grow in dry and 74.78 % - in moist soils.
Carbon amount in the broadleaved forests is:
((28*25.22)+(16*74.78))/100=19.03 t/ha
Coniferous forests cover 61.16 % of total forest area of Lithuania and broadleaved forests cover the rest 38.84%. According to that, the average carbon amount in all Lithuanian forest is:
((26.62*61.16)+(19.03*38.84))/100= 24 t/ha
FRA 2015 – Country Report, Lithuania
28
The estimated amount of carbon (24 t/ha) was used for calculations of carbon amount stored in “Forests” and“Other wooded land” for the year of 1990, 2005 and 2010.
3. The calculations of carbon storage in the soil was done according to standard presented in appendix 5.10of FRA 2010 and actual distribution of Lithuanian forest by humidity and fertility. According to experts, thedistribution of soils in Lithuania is:
dry HAC soils – 21.9 %
dry sandy soils - 24.5 %
moist HAC soils - 26.2 %
moist spondic soils – 13.3 %
wetlands soils - 14.1 %
Applying the carbon amount for “Cold temperate” conditions, the amount of carbon, stored in 1 ha of soilsin Lithuania is:
((21.9*50)+24.5*34)+(26.5*95)+(13.3*115)+(14.1*87))/100= 72 t/ha
The following amount of carbon (72 t/ha) was used in calculations for carbon amount in soils for both “Forest”and “Other wooded land“ for the year of 1990, 2005 and 2010.
Biomass and carbon stock
Not applied.
3.3.3 Reclassification
Not applied.
3.4 DataTable 3a
Growing stock volume (million m 3 over bark)
Forest Other wooded landCategory
1990 2000 2005 2010 2015 1990 2000 2005 2010 2015

FRA 2015 – Country Report, Lithuania
29
Totalgrowingstock
413 449.5 464.6 489.8 515 2.4 2.5 2.2 2.5 3.1
... ofwhichconiferous
234.8 255 262.7 281.9 301.1 0 0 0 0 0
... ofwhichbroadleaved
178.2 194.5 201.9 207.9 213.9 2.4 2.5 2.2 2.5 3.1
Table 3b
Category/Species name Growing stock in forest (million cubic meters)
Rank Scientific name Common name 1990 2000 2005 2010
1 st Pinus sylvestrisL.
Pine 150.1 162.9 168.1 182.8
2 nd Picea abies (L.)H. Karst.
Spruce 84.7 92 94.5 99
3 rd Betulapubescens Ehrh.
Birch 69.1 75.2 78.2 81.8
4 th Alnus glutinosa(L.) Gaertn
Alder black 28.9 33.2 36.5 40.7
5 th Populus tremulaL.
Aspen 32.3 31.2 30.2 31
6 th Alnus incana(L.) Moench
Alder grey 16 19.8 21.8 20.8
7 th Quercus roburL.
Oak 12.8 13.4 13.6 13.3
8 th Fraxinusexcelsior L.
Ash 10.3 11.3 10.5 8.5
9 th Tilia cordataMill.
Lime 2.6 3.5 3.9 4.2
10 th Salix caprea L. Willow 1.3 1.8 2.1 2.1
Remaining 4.9 5.2 5.2 5.6
TOTAL 413.00 449.50 464.60 489.80
THE PRE-FILLED VALUES FOR GROWING STOCK REFER TO THE FOLLOWINGTHRESHOLD VALUES (SEE TABLE BELOW)
Item Value Complementary information
Minimum diameter (cm) at breast heightof trees included in growing stock (X)
2 Minimum diameter for young plantedtrees with height less 1,3 m is 0 cm
Minimum diameter (cm) at the top end ofstem for calculation of growing stock (Y)
0 N/A

FRA 2015 – Country Report, Lithuania
30
Minimum diameter (cm) of branchesincluded in growing stock (W)
N/A Branches are not included in growingstock.
Volume refers to above ground (AG) orabove stump (AS)
AG N/A
PLEASE NOTE THAT THE DEFINITION OF GROWING STOCK HAS CHANGED AND SHOULDBE REPORTED AS GROWING STOCK DBH 10 CM INCLUDING THE STEM FROM GROUNDLEVEL UP TO A DIAMETER OF 0 CM, EXCLUDING BRANCHES.
Table 3c
Net annual increment (m 3 per hectare and year)
ForestCategory
1990 2000 2005 2010 2015
Net annualincrement
N/A N/A 5.8 5.8 6.4
... of whichconiferous
N/A N/A 6.6 7.2 7.3
... of whichbroadleaved
N/A N/A 5 4.4 5.5
Table 3d
Biomass (million metric tonnes oven-dry weight)
Forest Other wooded landCategory
1990 2000 2005 2010 2015 1990 2000 2005 2010 2015
Abovegroundbiomass
217.9 237.1 245.2 257.9 271.1 1.3 1.3 1.2 1.3 1.6
Belowgroundbiomass
50.1 54 56.4 59.3 62.4 0.3 0.3 0.3 0.3 0.4
Deadwood
19.5 20.3 21.2 21.7 21.8 0.1 0.1 0.1 0.1 0.1
TOTAL 287.50 311.40 322.80 338.90 355.30 1.70 1.70 1.60 1.70 2.10
Table 3e
Carbon (Million metric tonnes)
Forest Other wooded landCategory
1990 2000 2005 2010 2015 1990 2000 2005 2010 2015
Carbonin abovegroundbiomass
109 118.6 122.6 129 135.6 0.65 0.65 0.6 0.65 0.8

FRA 2015 – Country Report, Lithuania
31
Carbonin belowgroundbiomass
25.1 27 28.2 29.7 31.2 0.15 0.15 0.15 0.15 0.2
SubtotalLivingbiomass
134.1 145.6 150.8 158.7 166.8 0.8 0.8 0.75 0.8 1
Carbonin deadwood
9.8 10.2 10.6 10.9 10.9 0.05 0.05 0.05 0.05 0.05
Carbonin litter
46.7 48.5 50.9 52.1 52.2 1.9 2 1.8 2.05 2.5
SubtotalDeadwoodand litter
56.5 58.7 61.5 63 63.1 2 2.1 1.9 2.1 2.55
Soilcarbon
140 145.4 152.7 156.2 157 5.8 6.4 5.3 6 7.5
TOTAL 330.60 349.70 365.00 377.90 386.90 8.55 9.25 7.90 8.90 11.05
Tiers
Variable/category Tier for status Tier for trend
Total growing stock Tier 3 Tier 3
Net annual increment Tier 3 Tier 3
Above ground biomass Tier 3 Tier 3
Below ground biomass Tier 2 Tier 2
Dead wood Tier 3 Tier 3
Carbon in above-ground biomass Tier 3 Tier 3
Carbon in below ground biomass Tier 2 Tier 2
Carbon in dead wood and litter Tier 3 Tier 3
Soil carbon Tier 1 Tier 1
Tier criteria
Category Tier for status Tier for reported trend
FRA 2015 – Country Report, Lithuania
32
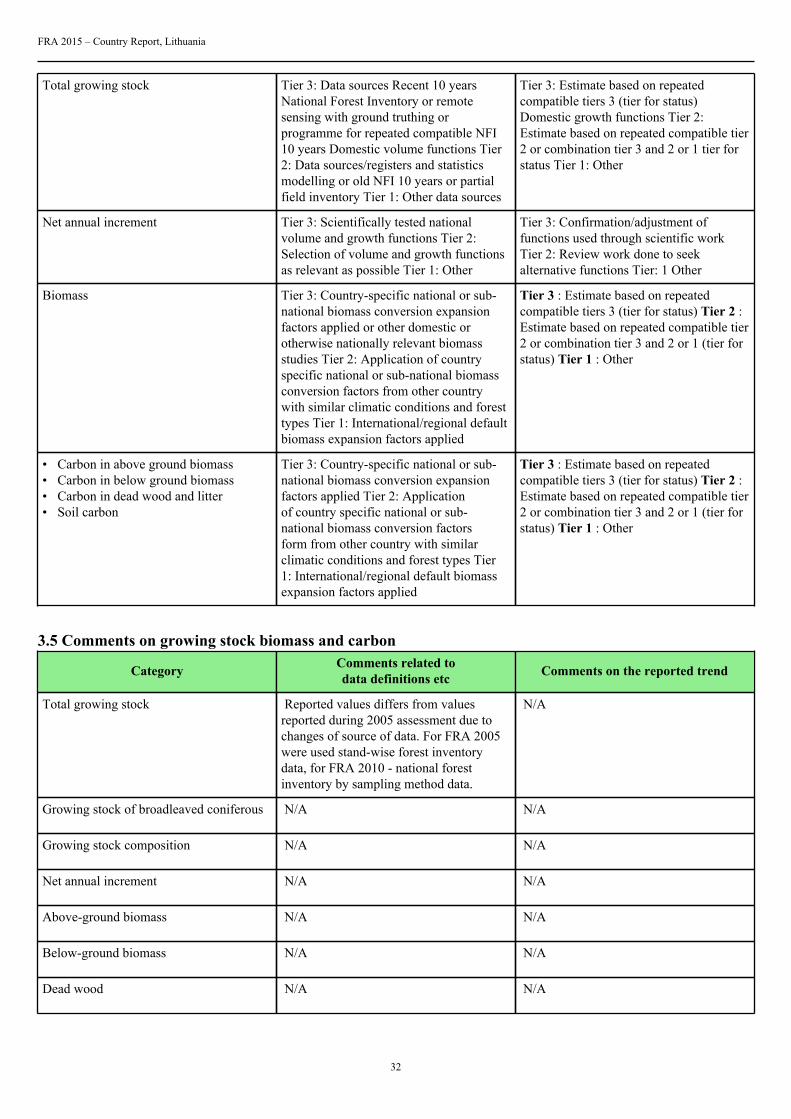
Total growing stock Tier 3: Data sources Recent 10 yearsNational Forest Inventory or remotesensing with ground truthing orprogramme for repeated compatible NFI10 years Domestic volume functions Tier2: Data sources/registers and statisticsmodelling or old NFI 10 years or partialfield inventory Tier 1: Other data sources
Tier 3: Estimate based on repeatedcompatible tiers 3 (tier for status)Domestic growth functions Tier 2:Estimate based on repeated compatible tier2 or combination tier 3 and 2 or 1 tier forstatus Tier 1: Other
Net annual increment Tier 3: Scientifically tested nationalvolume and growth functions Tier 2:Selection of volume and growth functionsas relevant as possible Tier 1: Other
Tier 3: Confirmation/adjustment offunctions used through scientific workTier 2: Review work done to seekalternative functions Tier: 1 Other
Biomass Tier 3: Country-specific national or sub-national biomass conversion expansionfactors applied or other domestic orotherwise nationally relevant biomassstudies Tier 2: Application of countryspecific national or sub-national biomassconversion factors from other countrywith similar climatic conditions and foresttypes Tier 1: International/regional defaultbiomass expansion factors applied
Tier 3 : Estimate based on repeatedcompatible tiers 3 (tier for status) Tier 2 :Estimate based on repeated compatible tier2 or combination tier 3 and 2 or 1 (tier forstatus) Tier 1 : Other
• Carbon in above ground biomass• Carbon in below ground biomass• Carbon in dead wood and litter• Soil carbon
Tier 3: Country-specific national or sub-national biomass conversion expansionfactors applied Tier 2: Applicationof country specific national or sub-national biomass conversion factorsform from other country with similarclimatic conditions and forest types Tier1: International/regional default biomassexpansion factors applied
Tier 3 : Estimate based on repeatedcompatible tiers 3 (tier for status) Tier 2 :Estimate based on repeated compatible tier2 or combination tier 3 and 2 or 1 (tier forstatus) Tier 1 : Other
3.5 Comments on growing stock biomass and carbon
Category Comments related todata definitions etc Comments on the reported trend
Total growing stock Reported values differs from valuesreported during 2005 assessment due tochanges of source of data. For FRA 2005were used stand-wise forest inventorydata, for FRA 2010 - national forestinventory by sampling method data.
N/A
Growing stock of broadleaved coniferous N/A N/A
Growing stock composition N/A N/A
Net annual increment N/A N/A
Above-ground biomass N/A N/A
Below-ground biomass N/A N/A
Dead wood N/A N/A

FRA 2015 – Country Report, Lithuania
33
Carbon in above-ground biomass The estimation of the Carbon stock ofliving biomass was based on the biomassdata compiled in table T7 in the countryreport.
N/A
Carbon in below-ground biomass The estimation of the Carbon stock ofliving biomass was based on the biomassdata compiled in table T7 in the countryreport.
N/A
Carbon in dead wood The estimation of the Carbon stock ofdead wood was based on the biomass datacompiled in table T7 in the country report.Reported Carbon volumes are not equalto reported volumes of biomass due torounding of results.
N/A
Carbon in litter The estimation of the Carbon in litterwas based on the forest and OWL areacompiled in table T1 in the country report.
N/A
Soil carbon The estimation of the Carbon in soilwas based on the forest and OWL areacompiled in table T1 in the country report.
N/A
Other general comments to the table
Growing stock volume of stems up to 10 cm, contains 4 % of all growing stock volume (For. Sci. Vol.58, No 3, p.233)

FRA 2015 – Country Report, Lithuania
34
4. What is the status of forest production and how has it changed over time?Documents for this question:
• Guide for country reporting FRA 2015• FRA 2015 Terms and Definitions
4.1 Categories and definitions
Term Definition
Primary designatedfunction
The primary function or management objective assigned to a management unit either by legalprescription documented decision of the landowner/manager or evidence provided by documentedstudies of forest management practices and customary use.
Non wood forest product(NWFP)
Goods derived from forests that are tangible and physical objects of biological origin other than wood.
Commercial value ofNWFP
For the purpose of this table, value is defined as the commercial market value at the forest gate.
Category Definition
Production forest Forest area designated primarily for production of wood, fibre, bio-energy and/or non-wood forestproducts.
Multiple use forest Forest area designated for more than one purpose and where none of these alone is considered as thepredominant designated function.
Total wood removals The total of industrial round wood removals and woodfuel removals.
...of which woodfuel The wood removed for energy production purposes, regardless whether for industrial, commercial ordomestic use.
4.2 National data4.2.1 Data sources
References to sourcesof information Variables Years Additional comments
1 Lietuvos miškų statistika.1998 m. sausio 1 d.(Lithuanian Forest Statistics1998.01.01). Kaunas, 1998
Forest 1997 N/A
2 Lietuvos miškų valstybinėapskaita 2001 m. sausio1d. (Lithuanian ForestAssessment. January 1 2001).Kaunas, 2001
Forest 2000 N/A
3 Valstybinė miškų apskaita2006 m. sausio 1 d. (StateForest Assessment, January 12006). Kaunas, 2006
Forest 2005 N/A
4 Valstybinė miškų apskaita2008 m. sausio 1 d. (StateForest Assessment, January 12008). Kaunas, 2008.
Forest 2007 N/A
FRA 2015 – Country Report, Lithuania
35
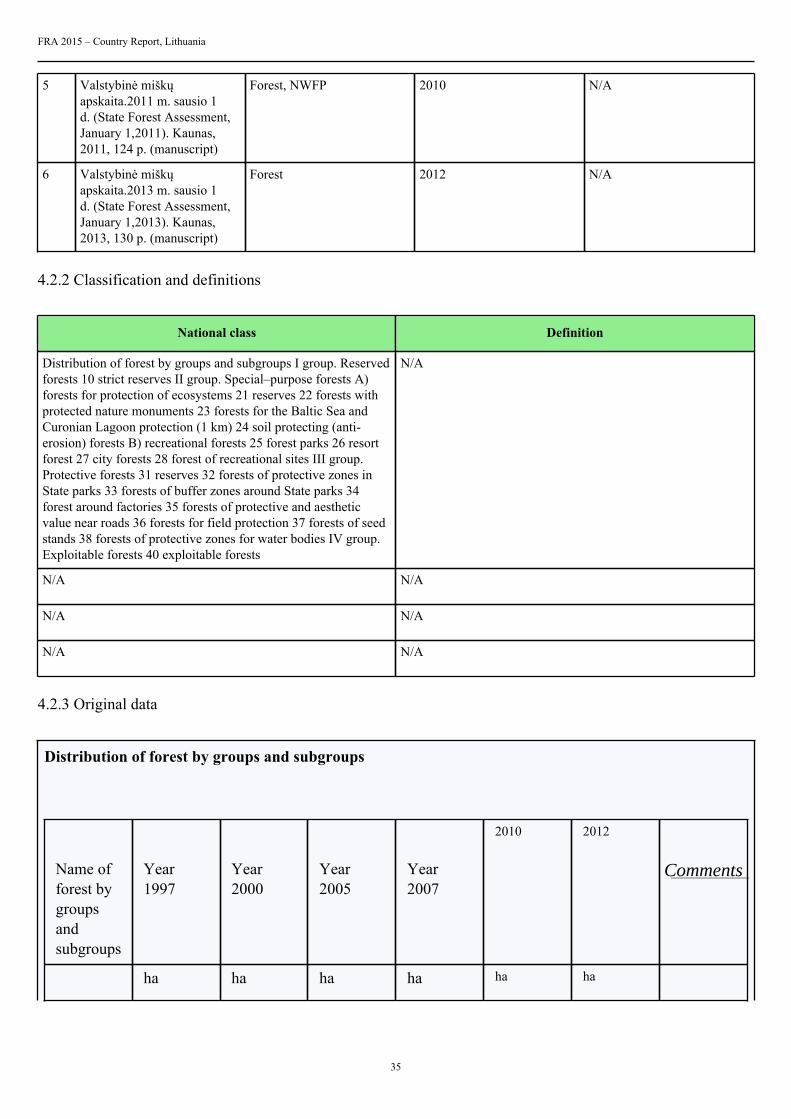
5 Valstybinė miškųapskaita.2011 m. sausio 1d. (State Forest Assessment,January 1,2011). Kaunas,2011, 124 p. (manuscript)
Forest, NWFP 2010 N/A
6 Valstybinė miškųapskaita.2013 m. sausio 1d. (State Forest Assessment,January 1,2013). Kaunas,2013, 130 p. (manuscript)
Forest 2012 N/A
4.2.2 Classification and definitions
National class Definition
Distribution of forest by groups and subgroups I group. Reservedforests 10 strict reserves II group. Special–purpose forests A)forests for protection of ecosystems 21 reserves 22 forests withprotected nature monuments 23 forests for the Baltic Sea andCuronian Lagoon protection (1 km) 24 soil protecting (anti-erosion) forests B) recreational forests 25 forest parks 26 resortforest 27 city forests 28 forest of recreational sites III group.Protective forests 31 reserves 32 forests of protective zones inState parks 33 forests of buffer zones around State parks 34forest around factories 35 forests of protective and aestheticvalue near roads 36 forests for field protection 37 forests of seedstands 38 forests of protective zones for water bodies IV group.Exploitable forests 40 exploitable forests
N/A
N/A N/A
N/A N/A
N/A N/A
4.2.3 Original data
Distribution of forest by groups and subgroups
Name offorest bygroupsandsubgroups
Year1997
Year2000
Year2005
Year2007
2010 2012
Comments
ha ha ha ha ha ha

FRA 2015 – Country Report, Lithuania
36
I group. Reservedforests
21166 21298 25691,2 25931,0 26263,6 26292,8
strictreserves
13000 13413 25691,2 25931,0 26263,6 26292,8
strictreservesin stateparks
8040 7796
smallstrictreserves
126 89
II group . Special–purposeforests
241012 243248 260617,8 261973,2 264734,6 266754,5
A) forests forprotectionofecosystems
reserves 129524 136679 161227,2 163548,1 169979,6 171553,1
forestswithprotectednaturemonuments
2329 2634 5466,1 5553,1 4671,4 4649,7
forests forthe BalticSea andCuronianLagoonprotection(1 km)
7593 66 531,3 526,7 524,6 524,6
soilprotecting(anti-erosion)forests
18038 19381 27079,3 26461,2 24661,2 24392,0
geneticreserves
2878 3234

FRA 2015 – Country Report, Lithuania
37
experimentalplots
214 214
foreststandsof highproductivity
616 672
protectedareas ofnaturalresources
1200 2122
B) recreationalforests
forestparks
44768 40234 38321,0 38402,9 31414,8 32460,5
resortforest
3513 3513 4048,6 4049,9 4049,1 3993,4
cityforests
9669 15312 13874,4 13672,0 13069,7 12895,2
forest ofrecreationalsites
12091 11649 10069,9 9759,3 9987,2 10419,9
recreationalzonesin stateparks
8579 7538 6377,0 5866,1
III group. Protectiveforests
276576 306660 340609,8 344045,2 330258,7 331352,5
reserves 47847 58051 83030,8 85548,7 84554,2 83836,8
forests ofprotectivezonesin Stateparks
55338 57992 52081,7 54018,9 52126.3 51470,1
FRA 2015 – Country Report, Lithuania
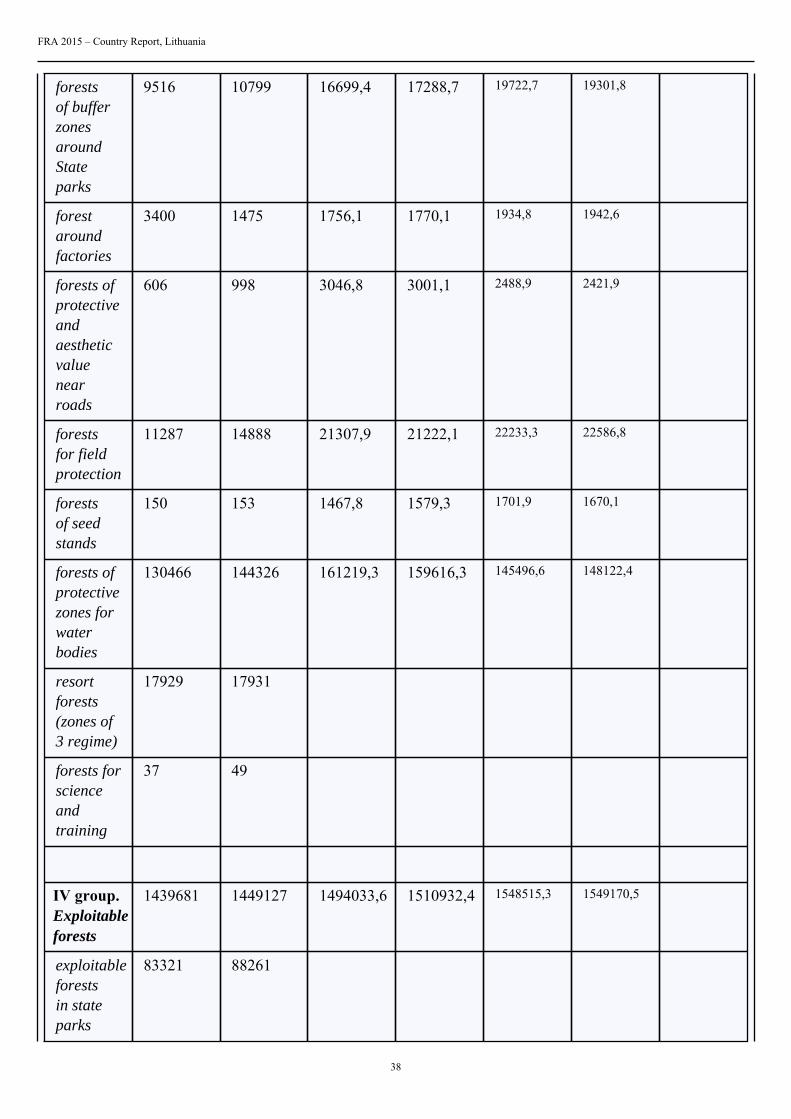
38
forestsof bufferzonesaroundStateparks
9516 10799 16699,4 17288,7 19722,7 19301,8
forestaroundfactories
3400 1475 1756,1 1770,1 1934,8 1942,6
forests ofprotectiveandaestheticvaluenearroads
606 998 3046,8 3001,1 2488,9 2421,9
forestsfor fieldprotection
11287 14888 21307,9 21222,1 22233,3 22586,8
forestsof seedstands
150 153 1467,8 1579,3 1701,9 1670,1
forests ofprotectivezones forwaterbodies
130466 144326 161219,3 159616,3 145496,6 148122,4
resortforests(zones of3 regime)
17929 17931
forests forscienceandtraining
37 49
IV group. Exploitableforests
1439681 1449127 1494033,6 1510932,4 1548515,3 1549170,5
exploitableforestsin stateparks
83321 88261

FRA 2015 – Country Report, Lithuania
39
commercialforests
1356360 1360866
Primary designated function
Forest area (1000 hectares)FRA 2015Categories
1990 2000 2005 2007 2010 2012
Production 1412 1466 1494 1511 1549 1549
Protectionof soil andwater
171 178 210 207 192 195
Conservationofbiodiversity
160 166 193 196 201 203
Socialservices
75 78 66 66 65 66
Multipleuse
127 132 158 163 163 161
Other(pleasespecify incommentsbelow thetable)
0 0 0 0 0 0
No /unknown
0 0 0 0 0 0
TOTAL 1945 2020 2121 2143 2170 2174
4.3 Analysis and processing of national data4.3.1 Adjustment
Not applied

FRA 2015 – Country Report, Lithuania
40
4.3.2 Estimation and forecasting
The data for the 2015 derived by extrapolation from data of 2010 and 2012
4.3.3 Reclassification
Every forest stand by its primary function is designated to 4 forest groups and 18 subgroups.
Adequacy of forests with national primary function to FRA classes is presented in below table.
National class Definition
Production 40 Exploitable forests
Protection of soil and water 24 Soil protecting (anti-erosion) forests
36 Forests for field protection
38 Forests of protective zones for water bodies
Conservation of biodiversity 10 Forests of strict reserves
21 Forests of II-d forest group reserves
22 Forests with protected nature monuments
23 Forests for the Baltic Sea and CuronianLagoon protection (1 km)
Social services 25 Forest parks
26 Resort forest
27 City forests
28 Forest of recreational sites
29 R ecreational zones in state parks

FRA 2015 – Country Report, Lithuania
41
Multiple purpose 31 Forests of III-d forest group reserves
32 Forests of protective zones in State parks
33 Forests of buffer zones around State parks
34 Forest around factories
35 Forests of protective and aesthetic value nearroads
37 Forests of seed stands
No or unknown function
4.4 DataTable 4a
Forest area (000 hectares)Categories
1990 2000 2005 2010 2015
Production forest 1412 1466 1494 1549 1550
Multiple useforest
127 132 158 163 163
Table 4b
Rank Name of product Key species
Commercial valueof NWFP removals
2010 (value 1000local currency)
NWFP category
1 st Mushrooms Cantarellus cibariusBoletus edulis
29399 1
2 nd Beries Vaccinium myrtllusVaccinium oxycoccusVaccinium vitis-idaea
10892 1
3 rd Bush meat Alces alces Cervuselaphus Capreoluscapreolus Sus ccrofa
12346 12
4 th Cristmas trees Picea abies 3750 6
5 th Skins Lepus europaeusVulpes vulpesNyctareutesprocyonoides Castorfiber Martes martesOndatra ziberthicaMustela vison
1354 10

FRA 2015 – Country Report, Lithuania
42
6 th Raw material formedicine
n.d. 508 13
7 th N/A N/A N/A N/A
8 th N/A N/A N/A N/A
9 th N/A N/A N/A N/A
10 th N/A N/A N/A N/A
TOTAL 58249.00
2010
Name of local currency LITAS ( LT )
Category
Plant products / raw material
1 Food
2 Fodder
3 Raw material for medicine and aromatic products
4 Raw material for colorants and dyes
5 Raw material for utensils handicrafts construction
6 Ornamental plants
7 Exudates
8 Other plant products
Animal products / raw material
9 Living animals
10 Hides skins and trophies
11 Wild honey and beewax
12 Wild meat
13 Raw material for medicine
14 Raw material for colorants
15 Other edible animal products
FRA 2015 – Country Report, Lithuania
43
16 Other non-edible animal products
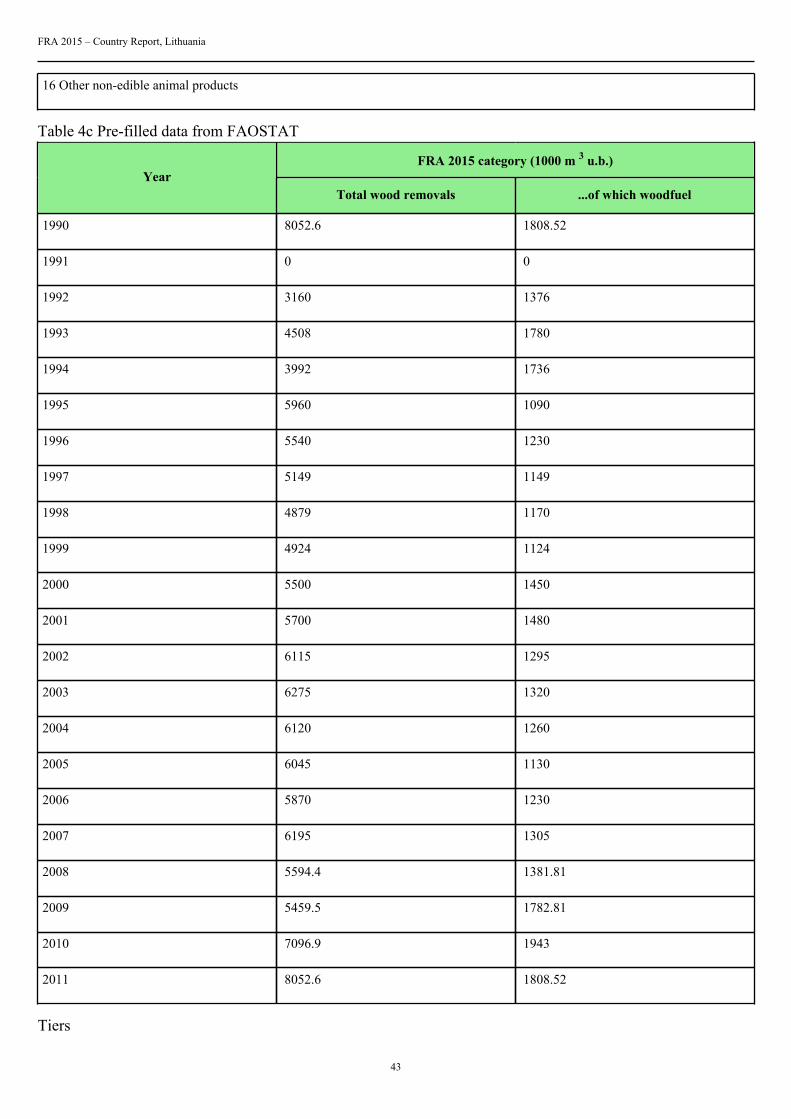
Table 4c Pre-filled data from FAOSTAT
FRA 2015 category (1000 m 3 u.b.)Year
Total wood removals ...of which woodfuel
1990 8052.6 1808.52
1991 0 0
1992 3160 1376
1993 4508 1780
1994 3992 1736
1995 5960 1090
1996 5540 1230
1997 5149 1149
1998 4879 1170
1999 4924 1124
2000 5500 1450
2001 5700 1480
2002 6115 1295
2003 6275 1320
2004 6120 1260
2005 6045 1130
2006 5870 1230
2007 6195 1305
2008 5594.4 1381.81
2009 5459.5 1782.81
2010 7096.9 1943
2011 8052.6 1808.52
Tiers

FRA 2015 – Country Report, Lithuania
44
Category Tier for status Tier for reported trend
Production forest Tier 3 Tier 3
Multiple use forest Tier 3 Tier 3
Tier Criteria
Category Tier for status Tier for reported trend
Production forest Multiple use forest Tier 3: Updated including fieldverifications national forest mapsincluding functions Tier 2: Forest mapsolder than 6 years including forestfunctions Tier 1: Other
Tier 3 : Estimate based on repeatedcompatible tiers 3 (tier for status) Tier 2 :Estimate based on repeated compatible tier2 or combination tier 3 and 2 or 1 (tier forstatus) Tier 1 : Other
4.5 Comments
Category Comments related todata definitions etc Comments on the reported trend
Production forest N/A N/A
Multiple use forest Forests of protective and aesthetic valuenear roads are considered as multiplepurpose, but not social services forest.
N/A
Total wood removals N/A N/A
Commercial value of NWFP N/A N/A
Other general comments to the table
Different system of forest classification into groups and categories was applied in 1990, comparing to classifications, which isused now. Since 1990 were not essential changes in requirements to functional forest classification. We have accepted the sameproportions of forest land classification by functions in 1990 as well as in 2000.

FRA 2015 – Country Report, Lithuania
45
5. How much forest area is managed for protection of soil and water and ecosystemservices?Documents for this question:
• Guide for country reporting FRA 2015• FRA 2015 Terms and Definitions
5.1 Categories and definitions
Category Definition
Protection of soil andwater
Forest area designated or managed for protection of soil and water
...of which productionof clean water (sub-category)
Forest area primarily designated or managed for water production, where most human uses are excludedor heavily modified to protect water quality.
...of which coastalstabilization (sub-category)
Forest area primarily designated or managed for coastal stabilization.
...of which desertificationcontrol (sub-category)
Forest area primarily designated or managed for desertification control.
...of which avalanchecontrol (sub-category)
Forest area primarily designated or managed to prevent the development or impact of avalanches onhuman life assets or infrastructure.
...of which erosion, floodprotection or reducingflood risk (sub-category)
Forest area primarily designated or managed for protecting communities or assets from the impacts oferosion riparian floods and landslides or for providing flood plain services.
...of which other (sub-category)
Forest area primarily designated or managed for other protective functions.
Ecosystem services,cultural or spiritual values
Forest area primarily designated or managed for selected ecosystem services or cultural or spiritualvalues.
...of which publicrecreation (sub-category)
Forest area designated or managed for public recreation.
...of which carbon storageor sequestration (sub-category)
Forest area designated or managed for carbon storage or sequestration.
...of which spiritual orcultural services (sub-category)
Forest area designated or managed for spiritual or cultural services.
...of which other (sub-category)
Forest area designated or managed for other ecosystem services.
5.2 National data5.2.1 Data sources
References to sourcesof information Variables Years Additional comments
1 Lithuania FRA_2010 countryreport
Protection of soil andwater ,Ecosystem services,cultural or spiritual values
1990-2005 N/A

FRA 2015 – Country Report, Lithuania
46
2 Valstybinė miškųapskaita.2011 m. sausio 1d. (State Forest Assessment,January 1,2011). Kaunas,2011, 124 p. (manuscript)
Protection of soil andwater ,Ecosystem services,cultural or spiritual values
2010 N/A
3 Valstybinė miškųapskaita.2013 m. sausio 1d. (State Forest Assessment,January 1,2013). Kaunas,2013, 130 p. (manuscript)
Protection of soil andwater ,Ecosystem services,cultural or spiritual values
2012 N/A
4 N/A N/A N/A N/A
5.2.2 Classification and definitions
National class Definition
According 4.2.2 table N/A
N/A N/A
N/A N/A
N/A N/A
5.2.3 Original data
According to table 4.2.3
5.3 Analysis and processing of national data5.3.1 Adjustment
5.3.2 Estimation and forecasting
Data for 2015 are extrapolated from 2010 and 2012
5.3.3 Reclassification
5.4 DataTable 5a
Categories Forest area (1000 hectares)

FRA 2015 – Country Report, Lithuania
47
1990 2000 2005 2010 2015
Protection of soiland water
171 178 210 192 199
... of whichproduction ofclean water
0 0 0 0 0
... of whichcoastalstabilization
155 159 183 167 174
... of whichdesertificationcontrol
0 0 0 0 0
... of whichavalanchecontrol
0 0 0 0 0
... of whicherosion, floodprotection orreducing floodrisk
16 19 27 25 25
... of which other(please specifyin commentsbelow the table)
0 0 0 0 0
Other
N/A
Table 5b
Forest area (1000 hectares)Categories
1990 2000 2005 2010 2015
Ecosystem services,cultural or spiritualvalues
75 78 66 65 63
...of which publicrecreation
75 78 66 65 63
...of whichcarbon storage orsequestration
0 0 0 0 0
...of which spiritualor cultural services
0 0 0 0 0
...of which other(please specify incomments belowthe table)
0 0 0 0 0
Tiers

FRA 2015 – Country Report, Lithuania
48
Category Tier for reported trend Tier for status
Protection of soil and water Tier 3 Tier 3
Ecosystem services, cultural or spiritualvalues
Tier 3 Tier 3
Tier criteria
Category Tier for status Tier for reported trend
Protection of soil and water Tier 3: High reliability data derived eitherfrom high intensity sample survey or dataobtained from national or state agenciesresponsible for regulations or legislationrelating to soil and water protection. Tier2: Approaches based on low intensityor incomplete sample-based surveys orstudies that provide data for specific areasthat is extrapolated through statisticalanalysis to national level estimates. Tier 1:Other
Tier 3 : Estimate based on repeatedcompatible tiers 3 (tier for status) Tier 2 :Estimate based on repeated compatible tier2 or combination tier 3 and 2 or 1 (tier forstatus) Tier 1 : Other
• Cultural or spiritual values• Public recreation• Spiritual or cultural services• Other
Tier 3: High reliability data derivedeither from high intensity sample surveyor data obtained from national or stateagencies responsible for regulations. Tier2: Approaches based on low intensityor incomplete sample-based surveys orstudies that provide data for specific areasthat is extrapolated through statisticalanalysis to national level estimates. Tier 1:Other
Tier 3 : Estimate based on repeatedcompatible tiers 3 (tier for status) Tier 2 :Estimate based on repeated compatible tier2 or combination tier 3 and 2 or 1 (tier forstatus) Tier 1 : Other
5.5 Comments
Category Comments related todata definitions etc Comments on the reported trend
Protection of soil and water Forest subgroups 23,24,38 ( t 4.2.2) N/A
Production of clean water N/A N/A
Coastal stabilization Forest subgroups 23,38 N/A
Desertification control N/A N/A
Avalanche control N/A N/A
Erosion, flood protection or reducing floodrisk
Forest subgroup 24 N/A
Other protective functions N/A N/A
Ecosystem services, cultural or spiritualvalues
Forest of II b group ( t 4.2.2) N/A
Public recreation Forest of II b group ( t 4.2.2) N/A
FRA 2015 – Country Report, Lithuania
49
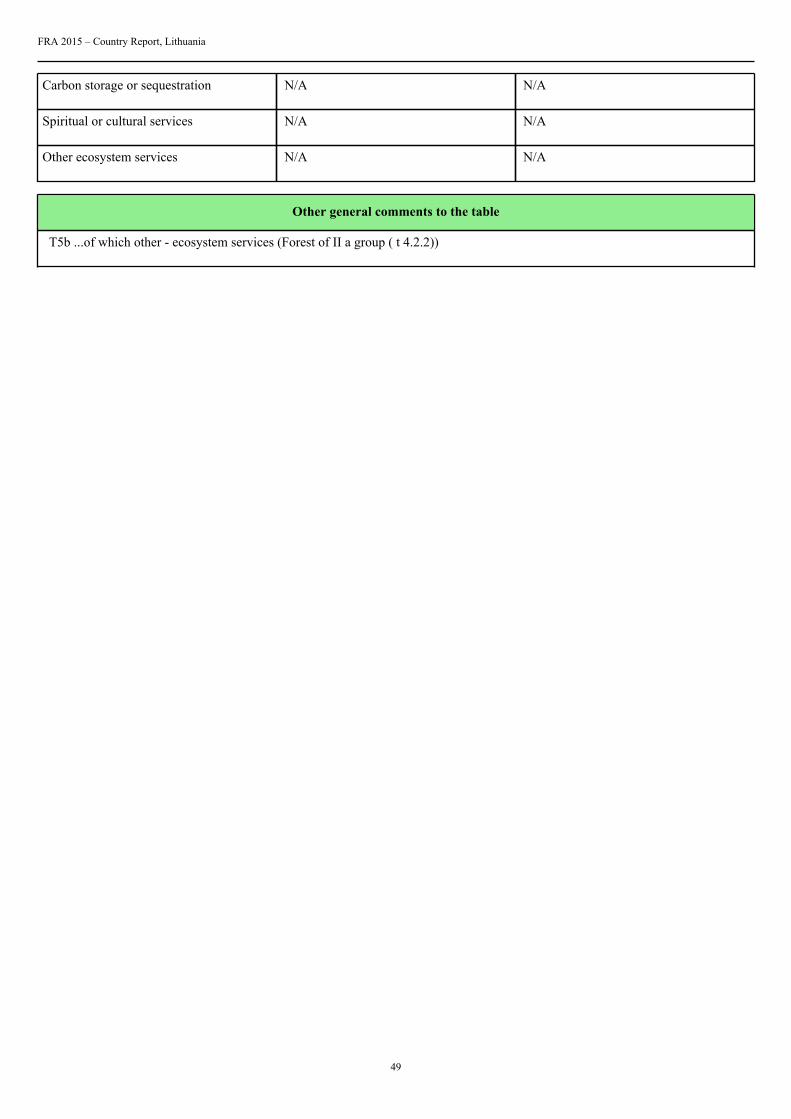
Carbon storage or sequestration N/A N/A
Spiritual or cultural services N/A N/A
Other ecosystem services N/A N/A
Other general comments to the table
T5b ...of which other - ecosystem services (Forest of II a group ( t 4.2.2))

FRA 2015 – Country Report, Lithuania
50
6. How much forest area is protected and designated for the conservation of biodiversityand how has it changed over time?Documents for this question:
• Guide for country reporting FRA 2015• FRA 2015 Terms and Definitions
6.1 Categories and definitions
Category Definition
Conservation ofbiodiversity
Forest area designated primarily for conservation of biological diversity. Includes but is not limited toareas designated for biodiversity conservation within the protected areas.
Forest area withinprotected areas
Forest area within formally established protected areas independently of the purpose for which theprotected areas were established.
6.2 National data6.2.1 Data sources
References to sourcesof information Variables Years Additional comments
1 Lithuania FRA_2010 countryreport
N/A 1990-2005 N/A
2 Lietuvos miškų ūkio statistika2011. Kaunas, 2011, 184p. (Lithuanian statisticalYearbook of forestry 2011.Kaunas, 2011, p.184)
Protected areas 2010 N/A
3 Lietuvos miškų ūkio statistika2013. Kaunas, 2013, 184p. (Lithuanian statisticalYearbook of forestry 2013.Kaunas, 2013, p.184)
Protected areas 2012 N/A
4 Valstybinė miškųapskaita.2011 m. sausio 1d. (State Forest Assessment,January 1,2011). Kaunas,2011, 124 p. (manuscript)
Forest 2010 N/A
5 Valstybinė miškųapskaita.2013 m. sausio 1d. (State Forest Assessment,January 1,2013). Kaunas,2013, 130 p. (manuscript)
Forest 2012 N/A
6.2.2 Classification and definitions
National class Definition
See 4.2.2. N/A
FRA 2015 – Country Report, Lithuania
51
N/A N/A
N/A N/A
N/A N/A
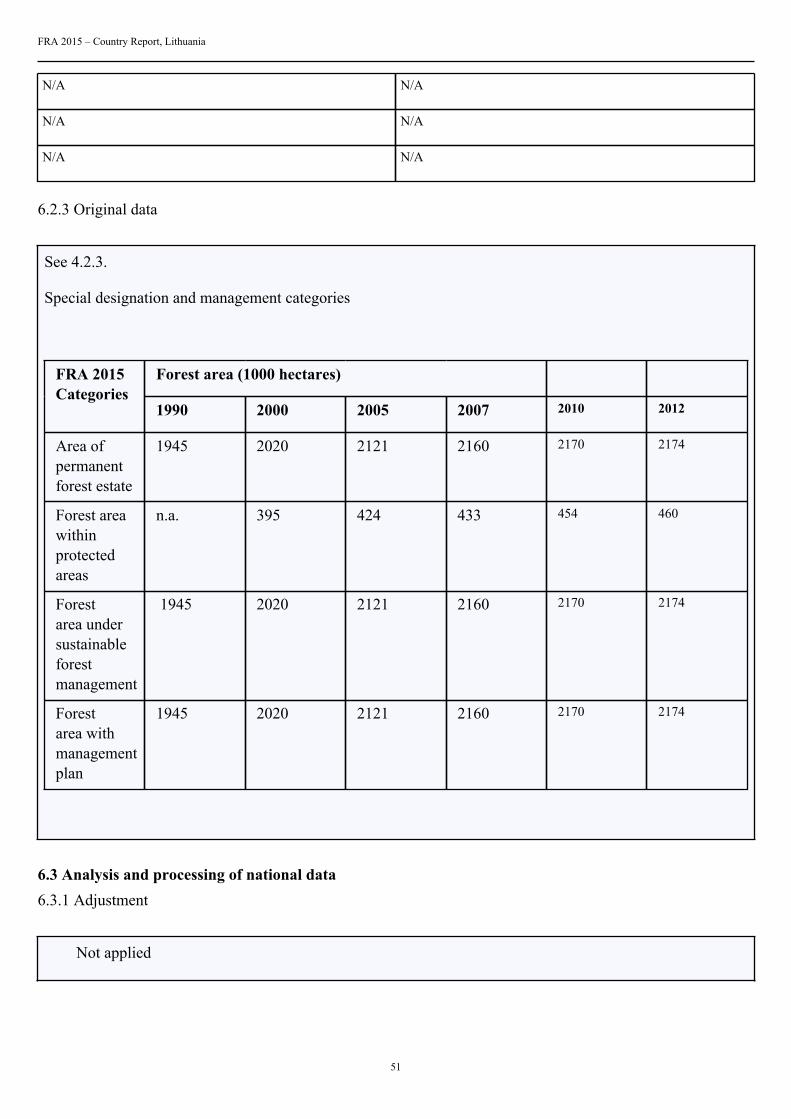
6.2.3 Original data
See 4.2.3.
Special designation and management categories
Forest area (1000 hectares) FRA 2015Categories
1990 2000 2005 2007 2010 2012
Area ofpermanentforest estate
1945 2020 2121 2160 2170 2174
Forest areawithinprotectedareas
n.a. 395 424 433 454 460
Forestarea undersustainableforestmanagement
1945 2020 2121 2160 2170 2174
Forestarea withmanagementplan
1945 2020 2121 2160 2170 2174
6.3 Analysis and processing of national data6.3.1 Adjustment
Not applied

FRA 2015 – Country Report, Lithuania
52
6.3.2 Estimation and forecasting
See 4.3.2.
6.3.3 Reclassification
See 4.3.3.
6.4 DataTable 6
Forest area (000 hectares)Categories
1990 2000 2005 2010 2015
Conservation ofbiodiversity
160 166 193 201 205
Forest areawithin protectedareas
N/A 395 424 454 460
Tiers
Category Tier for status Tier for reported trend
Conservation of biodiversity Tier 3 Tier 3
Forest area within protected areas Tier 3 Tier 3
Tier criteria
Category Tier for status Tier for reported trend
• Conservation of biodiversity• Forests within protected areas
Tier 3: Data obtained from national orstate agencies responsible for conservationand protected area or legislation relatingto area protection. Tier 2: Studies thatprovide data for specific areas that isextrapolated through statistical analysis tonational level estimates Tier 1 Other
Tier 3 : Estimate based on repeatedcompatible tiers 3 (tier for status) Tier 2 :Estimate based on repeated compatible tier2 or combination tier 3 and 2 or 1 (tier forstatus) Tier 1 : Other
6.5 Comments
Category Comments related todata definitions etc Comments on the reported trend
Conservation of biodiversity Forest subgroups 10,21,22,23 N/A
Forest area within protected areas Include forests in: 1. Strict naturereserves, 2. Nature reserves, 3. Nationalparks, 4. Regional parks
N/A

FRA 2015 – Country Report, Lithuania
53
Other general comments to the table
Different system of forest classification into groups and categories was applied in 1990, comparing to classifications, which isused now. Since 1990 were not essential changes in requirements to functional forest classification. We have accepted the sameproportions of forest land classification by functions in 1990 as well as in 2000.
FRA 2015 – Country Report, Lithuania
54
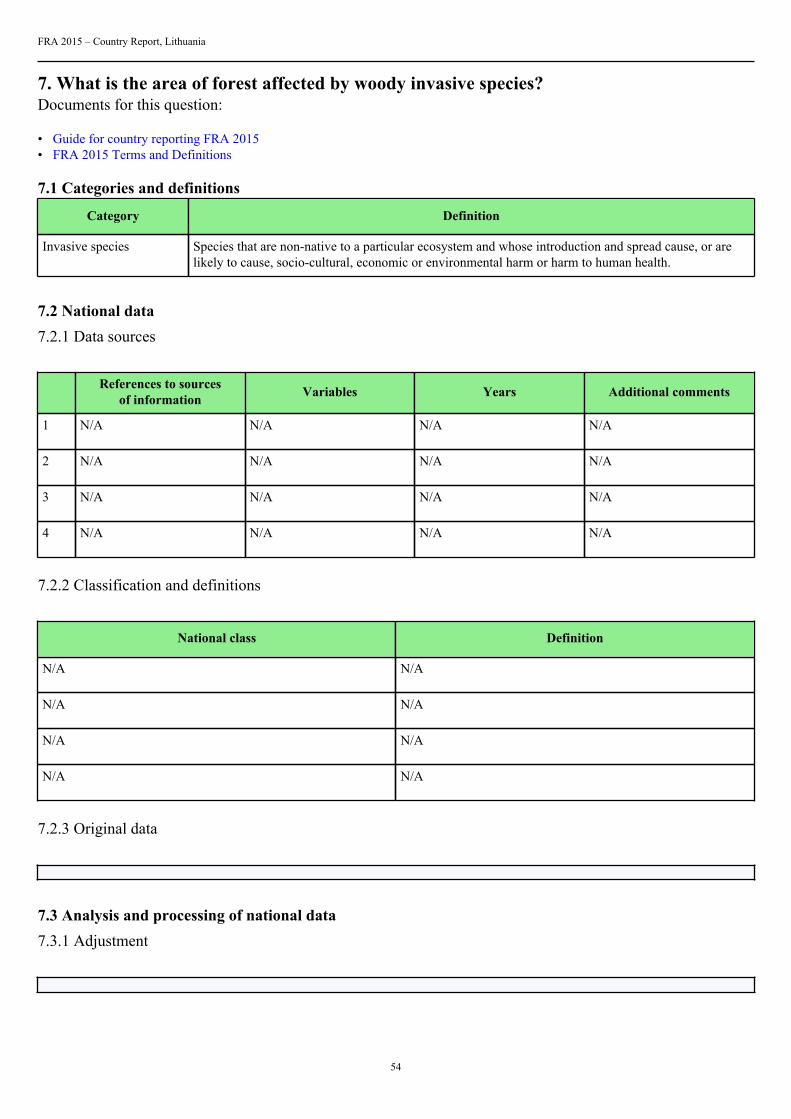
7. What is the area of forest affected by woody invasive species?Documents for this question:
• Guide for country reporting FRA 2015• FRA 2015 Terms and Definitions
7.1 Categories and definitions
Category Definition
Invasive species Species that are non-native to a particular ecosystem and whose introduction and spread cause, or arelikely to cause, socio-cultural, economic or environmental harm or harm to human health.
7.2 National data7.2.1 Data sources
References to sourcesof information Variables Years Additional comments
1 N/A N/A N/A N/A
2 N/A N/A N/A N/A
3 N/A N/A N/A N/A
4 N/A N/A N/A N/A
7.2.2 Classification and definitions
National class Definition
N/A N/A
N/A N/A
N/A N/A
N/A N/A
7.2.3 Original data
7.3 Analysis and processing of national data7.3.1 Adjustment
FRA 2015 – Country Report, Lithuania
55
7.3.2 Estimation and forecasting
7.3.3 Reclassification
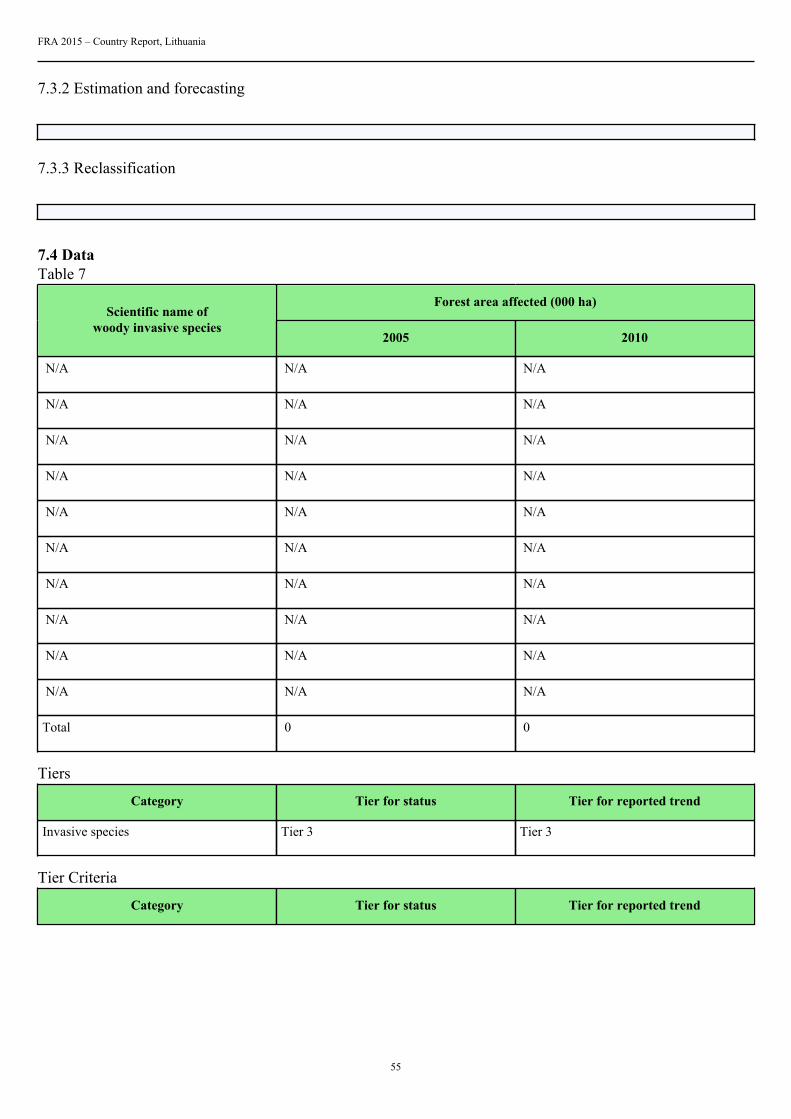
7.4 DataTable 7
Forest area affected (000 ha)Scientific name of
woody invasive species2005 2010
N/A N/A N/A
N/A N/A N/A
N/A N/A N/A
N/A N/A N/A
N/A N/A N/A
N/A N/A N/A
N/A N/A N/A
N/A N/A N/A
N/A N/A N/A
N/A N/A N/A
Total 0 0
Tiers
Category Tier for status Tier for reported trend
Invasive species Tier 3 Tier 3
Tier Criteria
Category Tier for status Tier for reported trend
FRA 2015 – Country Report, Lithuania
56
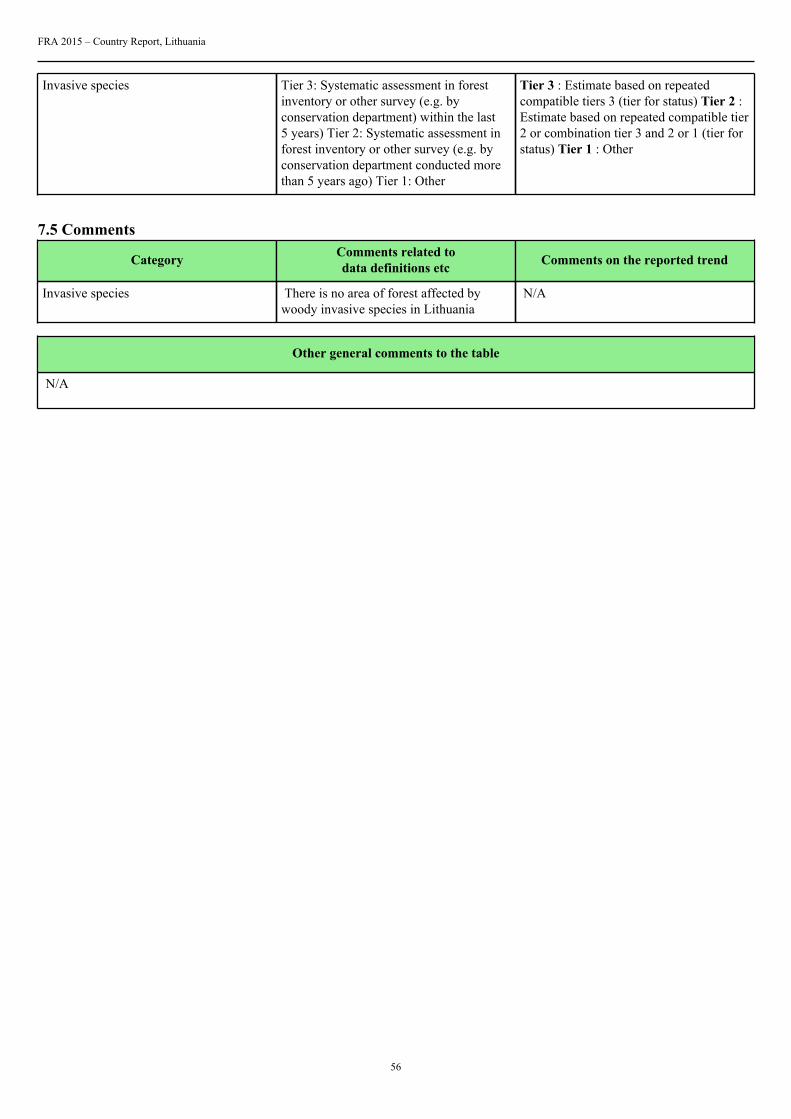
Invasive species Tier 3: Systematic assessment in forestinventory or other survey (e.g. byconservation department) within the last5 years) Tier 2: Systematic assessment inforest inventory or other survey (e.g. byconservation department conducted morethan 5 years ago) Tier 1: Other
Tier 3 : Estimate based on repeatedcompatible tiers 3 (tier for status) Tier 2 :Estimate based on repeated compatible tier2 or combination tier 3 and 2 or 1 (tier forstatus) Tier 1 : Other
7.5 Comments
Category Comments related todata definitions etc Comments on the reported trend
Invasive species There is no area of forest affected bywoody invasive species in Lithuania
N/A
Other general comments to the table
N/A

FRA 2015 – Country Report, Lithuania
57
8. How much forest area is damaged each year?Documents for this question:
• Guide for country reporting FRA 2015• FRA 2015 Terms and Definitions
8.1 Categories and definitions
Category Definition
Number of fires Number of fires per year
Burned area Area burned per year
Outbreaks of insects A detectable reduction in forest health caused by a sudden increase in numbers of harmful insects.
Outbreaks of diseases A detectable reduction in forest health caused by a sudden increase in numbers of harmful pathogens,such as bacteria, fungi, phytoplasma or virus.
Severe weather events Damage caused severe weather events, such as snow, storm, drought, etc.
8.2 National data8.2.1 Data sources
References to sourcesof information Variables Years Additional comments
1 Information from Fire andRescue Departament
Total area of fires 2003-2012 N/A
2 Lietuvos miškų ūkio statistika2013. Kaunas, 20, 184p. (Lithuanian statisticalYearbook of forestry 20.Kaunas, 20, p.184)
Disturbance by Forest fires 2003-2012 N/A
3 Lietuvos miškų ūkio statistika2013. Kaunas, 20, 184p. (Lithuanian statisticalYearbook of forestry 20.Kaunas, 20, p.184)
Disturbance by insects,diseases, snow-wind
2007-2012 N/A
4 N/A N/A N/A N/A
8.2.2 Classification and definitions
National class Definition
All are according to FRA-2015 definitions N/A
N/A N/A
N/A N/A

FRA 2015 – Country Report, Lithuania
58
N/A N/A
8.2.3 Original data
8.3 Analysis and processing of national data8.3.1 Adjustment
8.3.2 Estimation and forecasting
8.3.3 Reclassification
8.4 DataTable 8a
000 ha, number of fires
2003 2004 2005 2006 2007Category
000 ha # 000 ha # 000 ha # 000 ha # 000 ha #
Totalland areaburned
N/A N/A 13.301 3740 4.063 2587 33.798 8584 3.294 2465
... ofwhichforestareaburned
0.436 885 0.253 468 0.051 301 1.199 1545 0.038 251
2008 2009 2010 2011 2012Category
000 ha # 000 ha # 000 ha # 000 ha # 000 ha #
Totalland areaburned
5 5553 13 7233 5.878 4346 5 4443 5 3856
... ofwhichforestareaburned
0.112 301 0.315 507 0.022 110 0.293 142 0.02 81
Table 8b

FRA 2015 – Country Report, Lithuania
59
Outbreak category Description/name Year(s) of latest outbreak Area damaged (000 hectares)
1 Ips typographus 2007-2012 31.7
1 Diprion pini 2011 2.1
1 Dendrolimus pini 2008-2010,2012 5.6
1 Lymantria dispar 2012-2011 0.1
1 Panolis flammea 2008 0.2
1 Physocermes piceae 2009-2011 8.8
2 Ash dieback 2007-2012 24
2 Oak dieback 2007-2012 17
3 Snow,Wind 2008-2011 65
N/A N/A N/A N/A
Outbreak category
1 Insects
2 Diseases
3 Severe weather events
Tiers
Category Tier for status Tier for trend
Area affected by fire Tier 3 Tier 3
• Insects• Diseases• Severe weather events
Tier 3 Tier 3
Tier criteria
Category Tier for status Tier for reported trend
Burned area Tier 3 : National fire monitoring routinesTier 2 : Remote sensing surveys Tier 1 :Other
Tier 3 : Estimate based on repeatedcompatible tiers 3 (tier for status) Tier 2 :Estimate based on repeated compatible tier2 or combination tier 3 and 2 or 1 (tier forstatus) Tier 1 : Other
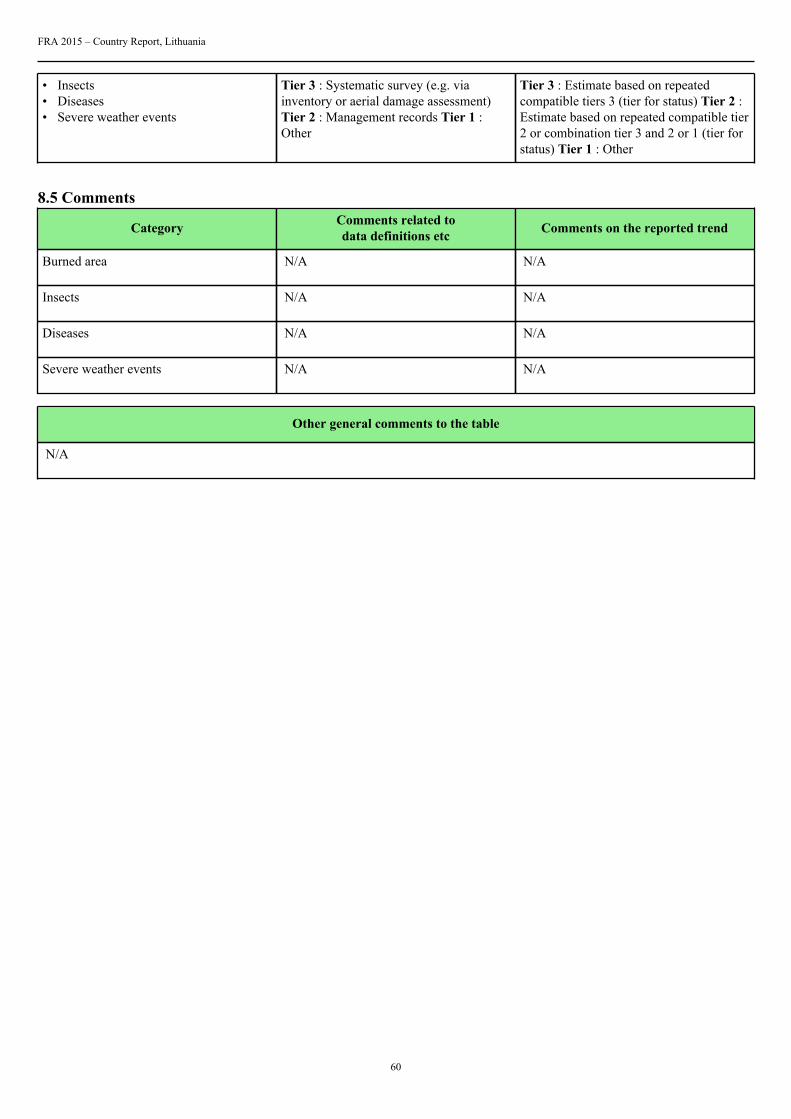
FRA 2015 – Country Report, Lithuania
60
• Insects• Diseases• Severe weather events
Tier 3 : Systematic survey (e.g. viainventory or aerial damage assessment)Tier 2 : Management records Tier 1 :Other
Tier 3 : Estimate based on repeatedcompatible tiers 3 (tier for status) Tier 2 :Estimate based on repeated compatible tier2 or combination tier 3 and 2 or 1 (tier forstatus) Tier 1 : Other
8.5 Comments
Category Comments related todata definitions etc Comments on the reported trend
Burned area N/A N/A
Insects N/A N/A
Diseases N/A N/A
Severe weather events N/A N/A
Other general comments to the table
N/A

FRA 2015 – Country Report, Lithuania
61
9. What is the forest area with reduced canopy cover?Documents for this question:
• Guide for country reporting FRA 2015• FRA 2015 Terms and Definitions
Category Definition
Reduction in canopycover
Forest that has undergone a reduction of canopy cover of more than 20% between the years 2000 and2010 within the forest canopy cover range of 30-80% as detected by the MODIS VCF sensor.
Table 9
Category Area of forest with reduced canopy cover (000 ha)
Reduction in canopycover
N/A
Tiers
Category Tier for reported trend
Reduction in canopycover
N/A
Tier criteria
Category Tier for reported trend
Reduction in canopycover
Tier 3 : Remote sensing with ground truthing and/or Landsat imagery Tier 2 : Remote sensing usingModis (using pre-filled data provided by FAO) Tier 1 : Expert opinion
Comments
Category Comments related to data definitions etc
Reduction in canopycover
N/A
Other general comments

FRA 2015 – Country Report, Lithuania
62
10. What forest policy and regulatory framework exists to support implementation ofsustainable forest management SFM?Documents for this question:
• Guide for country reporting FRA 2015• FRA 2015 Terms and Definitions
10.1 Categories and definitions
Category Definition
Policies supportingsustainable forestmanagement
Policies or strategies that explicitly encourage sustainable forest management.
Legislation andregulations supportingsustainable forestmanagement
Legislation and regulations that govern and guide sustainable forest management, operations and use.
10.2 National data10.2.1 Data sources
References to sourcesof information Variables Years Additional comments
1 Lietuvos Respublikosaplinkos ministerijosValstybinės miškų tarnybos2010 m. sausio 14 d.įsakymas Nr. 11-10-V „DėlMiškotvarkos darbų vykdymoinstrukcijos patvirtinimo“ /Valstybės Žinios, 2010,Nr. 45-2182 (Stand Forestinventry instruction)
N/A N/A N/A
2 Lietuvos Respublikos miškųįstatymas (Valstybės Žinios,1994, Nr. 96-1872; ValstybėsŽinios, 2001, Nr. 35-1161)(The Republic of LithuaniaForestry Law)
legislative act 1994 N/A
3 NACIONALINĖ MIŠKŲŪKIO SEKTORIAUSPLĖTROS 2012–2020 METŲPROGRAMA PatvirtintaLietuvos RespublikosVyriausybės 2012 m.gegužės 23 d. nutarimu Nr.569 (National strategy ofForestry)
N/A N/A N/A
4 N/A N/A N/A N/A
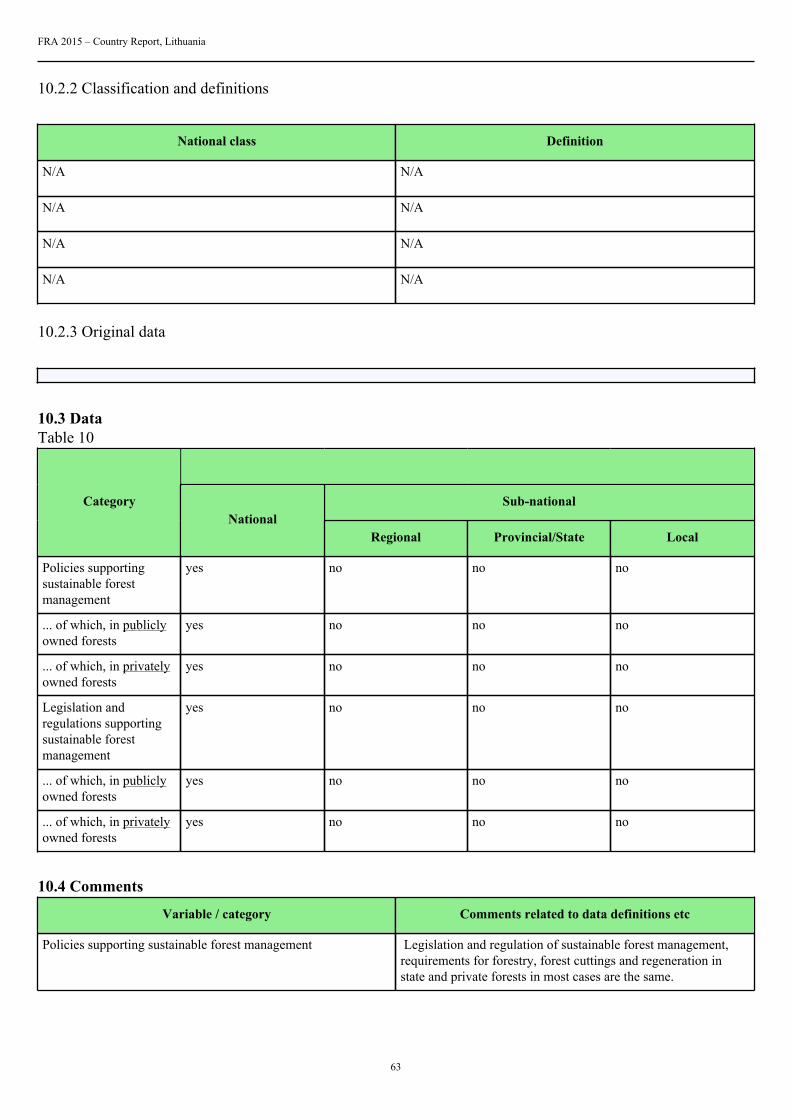
FRA 2015 – Country Report, Lithuania
63
10.2.2 Classification and definitions
National class Definition
N/A N/A
N/A N/A
N/A N/A
N/A N/A
10.2.3 Original data
10.3 DataTable 10
Sub-nationalCategoryNational
Regional Provincial/State Local
Policies supportingsustainable forestmanagement
yes no no no
... of which, in publiclyowned forests
yes no no no
... of which, in privatelyowned forests
yes no no no
Legislation andregulations supportingsustainable forestmanagement
yes no no no
... of which, in publiclyowned forests
yes no no no
... of which, in privatelyowned forests
yes no no no
10.4 Comments
Variable / category Comments related to data definitions etc
Policies supporting sustainable forest management Legislation and regulation of sustainable forest management,requirements for forestry, forest cuttings and regeneration instate and private forests in most cases are the same.

FRA 2015 – Country Report, Lithuania
64
Legislation and regulations supporting sustainable forestmanagement
N/A
Other general comments

FRA 2015 – Country Report, Lithuania
65
11. Is there a national platform that promotes stakeholder participation in forest policydevelopment?Documents for this question:
• Guide for country reporting FRA 2015• FRA 2015 Terms and Definitions
11.1 Categories and definitions
Category Definition
National stakeholderplatform
A recognized procedure that a broad range of stakeholders can use to provide opinions, suggestions,analysis, recommendations and other input into the development of national forest policy.
11.2 National data11.2.1 Data sources
References to sources of information Years Additional comments
1 APLINKOS MINISTROĮSAKYMAS “DĖL MIŠKŲ ŪKIOKONSULTACINĖS TARYBOSPRIE APLINKOS MINISTERIJOSSUDARYMO” 2003 m. kovo 31 d.Nr. 151 Vilnius (Advicing counsil offorestry)
2003 N/A
2 N/A N/A N/A
3 N/A N/A N/A
4 N/A N/A N/A
Table 11Is there a national platform that promotes or allows forstakeholder participation in forest policy development?
yes
11.3 Comments
Category Comments related to data definitions etc
National stakeholder platform Advising council of forestry is established in the EnvironmentMinistry. Consist from representatives of main institutionsrelated to forestry, nongovernmental institutions, Natureorganizations, private and state foresters,
Other general comments

FRA 2015 – Country Report, Lithuania
66
12. What is the forest area intended to be in permanent forest land use and how has itchanged over time?Documents for this question:
• Guide for country reporting FRA 2015• FRA 2015 Terms and Definitions
12.1 Categories and definitions
Category Definition
Forest area intended to bein permanent forest landuse
Forest area that is designated or expected to be retained as forest and is highly unlikely to be convertedto other land use.
...of which permanentforest estate (sub-category)
Forest area that is designated by law or regulation to be retained as forest and may not be converted toother land use.
12.2 National data12.2.1 Data sources
References to sourcesof information Variables Years Additional comments
1 FRA 2010 country report Forest 1990-2005 N/A
2 Valstybinė miškųapskaita.2011 m. sausio 1d. (State Forest Assessment,January 1,2011). Kaunas,2011, 124 p. (manuscript)
Forest 2010 N/A
3 Lietuvos miškų ūkio statistika2011. Kaunas, 2011, 184p. (Lithuanian statisticalYearbook of forestry 2011.Kaunas, 2011, p.184)
Forest area within protectedareas
2010 N/A
4 N/A N/A N/A N/A
12.2.2 Classification and definitions
National class Definition
N/A N/A
N/A N/A
N/A N/A
N/A N/A
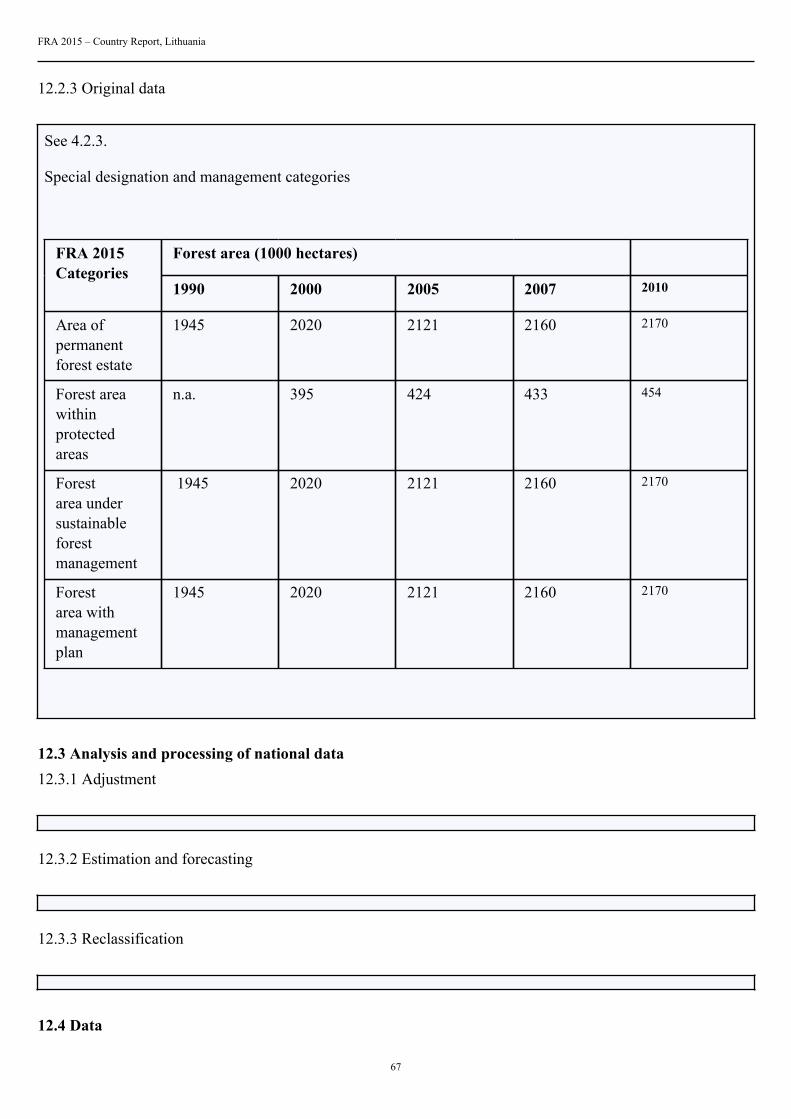
FRA 2015 – Country Report, Lithuania
67
12.2.3 Original data
See 4.2.3.
Special designation and management categories
Forest area (1000 hectares) FRA 2015Categories
1990 2000 2005 2007 2010
Area ofpermanentforest estate
1945 2020 2121 2160 2170
Forest areawithinprotectedareas
n.a. 395 424 433 454
Forestarea undersustainableforestmanagement
1945 2020 2121 2160 2170
Forestarea withmanagementplan
1945 2020 2121 2160 2170
12.3 Analysis and processing of national data12.3.1 Adjustment
12.3.2 Estimation and forecasting
12.3.3 Reclassification
12.4 Data

FRA 2015 – Country Report, Lithuania
68
Table 12
Categories Forest area 2010 (000 ha)
Forest area intended to be in permanentforest land use
2170
... of which permanent forest estate 2170
Tiers
Category Tier for status
Forest area intended to be in permanent forest land use Tier 3
Permanent forest estate Tier 3
Tier Criteria
Category Tier for status
Forest area intended to be in permanent forest land use Tier 3 : National or sub-national land use plans strategydocuments or other reports within the past 10 years Tier 2 :National or sub-national land use plans strategy documents orother reports within the past 20 years Tier 1 : Other
Permanent forest estate Tier 3 : National or sub-national land use plans strategydocuments or other reports within the past 10 years Tier 2 :National or sub-national land use plans strategy documents orother reports within the past 20 years Tier 1 : Other
12.5 Comments
Category Comments related to data definitions etc
Forest area intended to be in permanent forest land use N/A
Permanent forest estate N/A
Other general comments

FRA 2015 – Country Report, Lithuania
69
13. How does your country measure and report progress towards SFM at the nationallevel?Documents for this question:
• Guide for country reporting FRA 2015• FRA 2015 Terms and Definitions
13.1 Categories and definitions
Category Definition
Forest area monitoredunder a national forestmonitoring framework
Forest area monitored by a national monitoring framework or systems that provide measurement basedperiodic monitoring of forest extent and quality.
Forest reporting atnational scale
National reporting of forest extent and characteristics that includes some measure of progress towardsustainable forest management.
13.2 National data13.2.1 Data sources
References to sourcesof information Variables Years Additional comments
1 Lietuvos Respublikos MiškųĮstatymas. (The Republicof Lithuania ForestryLaw)Valstybės Žinios, 2001,Nr. 35-1161, 4-13 p
Forest inventory, reports N/A N/A
2 Valstybinės miškųinventorizacijos atrankosmetodų nuostatai, patvirtintiAplinkos ministro 2004m. lapkričio 8 d. įsakymuNr. D1-570 (engl. Theregulations of NationalForest Inventory by samplingmethod approved by orderNo D1-570 of 8 November2004 of the Minister ofEnvironment of the Republicof Lithuania) (Žin., 2004,17-6343; 2012, Nr. 16-694).
National Forest Inventory(NFI)
N/A N/A
3 Lietuvos Respublikosaplinkos ministerijosValstybinės miškų tarnybos2010 m. sausio 14 d.įsakymas Nr. 11-10-V „DėlMiškotvarkos darbų vykdymoinstrukcijos patvirtinimo“ /Valstybės Žinios, 2010, Nr.45-2182
Stand Forest inventory (SFI) N/A N/A
4 N/A N/A N/A N/A
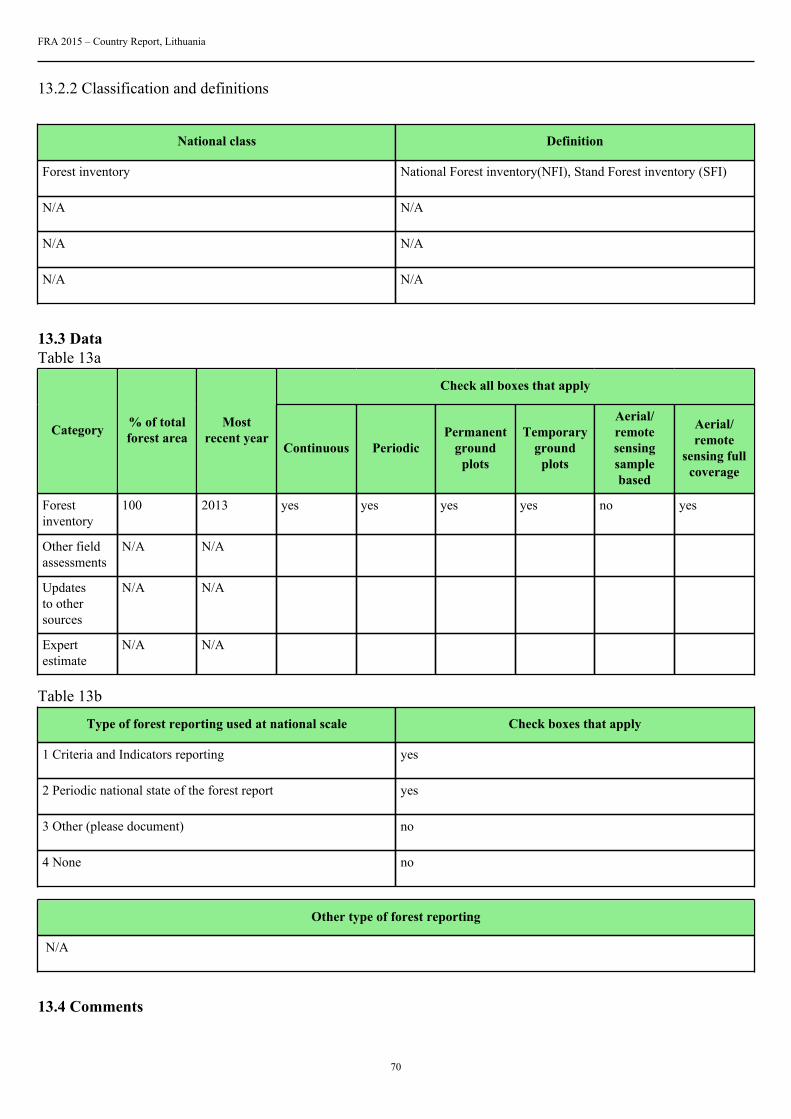
FRA 2015 – Country Report, Lithuania
70
13.2.2 Classification and definitions
National class Definition
Forest inventory National Forest inventory(NFI), Stand Forest inventory (SFI)
N/A N/A
N/A N/A
N/A N/A
13.3 DataTable 13a
Check all boxes that apply
Category % of totalforest area
Mostrecent year
Continuous PeriodicPermanent
groundplots
Temporaryground
plots
Aerial/remotesensingsamplebased
Aerial/remote
sensing fullcoverage
Forestinventory
100 2013 yes yes yes yes no yes
Other fieldassessments
N/A N/A
Updatesto othersources
N/A N/A
Expertestimate
N/A N/A
Table 13b
Type of forest reporting used at national scale Check boxes that apply
1 Criteria and Indicators reporting yes
2 Periodic national state of the forest report yes
3 Other (please document) no
4 None no
Other type of forest reporting
N/A
13.4 Comments

FRA 2015 – Country Report, Lithuania
71
Category Comments
Periodic national state of the forest report 1. Annual State Forest Assessment 2. Edition "Lithuanianstatistical Yearbook of forestry "
N/A N/A
N/A N/A
Other general comments

FRA 2015 – Country Report, Lithuania
72
14. What is the area of forest under a forest management plan and how is this monitored?Documents for this question:
• Guide for country reporting FRA 2015• FRA 2015 Terms and Definitions
14.1 Categories and definitions
Category Definition
Forest area withmanagement plan
Forest area that has a long-term documented management plan, aiming at defined management goalswhich is periodically revised
...of which for production(sub-category)
Forest management plan mainly focused on production
...of which forconservation (sub-category)
Forest management plan mainly focused on conservation
Monitoring of forestmanagement plans
Government monitoring of forest management plan implementation conducted through field visits oraudits of forest management plan performance
14.2 National data14.2.1 Data sources
References to sourcesof information Variables Years Additional comments
1 Lietuvos miškų statistika.1998 m. sausio 1 d.(Lithuanian Forest Statistics1998.01.01). Kaunas, 1998
Forest 1997 N/A
2 Lietuvos miškų valstybinėapskaita 2001 m. sausio1d. (Lithuanian ForestAssessment. January 1 2001).Kaunas, 2001
Forest 2000 N/A
3 Valstybinė miškų apskaita2006 m. sausio 1 d. (StateForest Assessment, January 12006). Kaunas, 2006
Forest 2005 N/A
4 Valstybinė miškų apskaita2011 m. sausio 1 d. (StateForest Assessment, January 12011). Kaunas, 2011.
Forest 2010 N/A
14.3 DataTable 14a
Forest plan type Forest area 2010 (000 ha)
Forest area with management plan 2170
... of which for production 1879
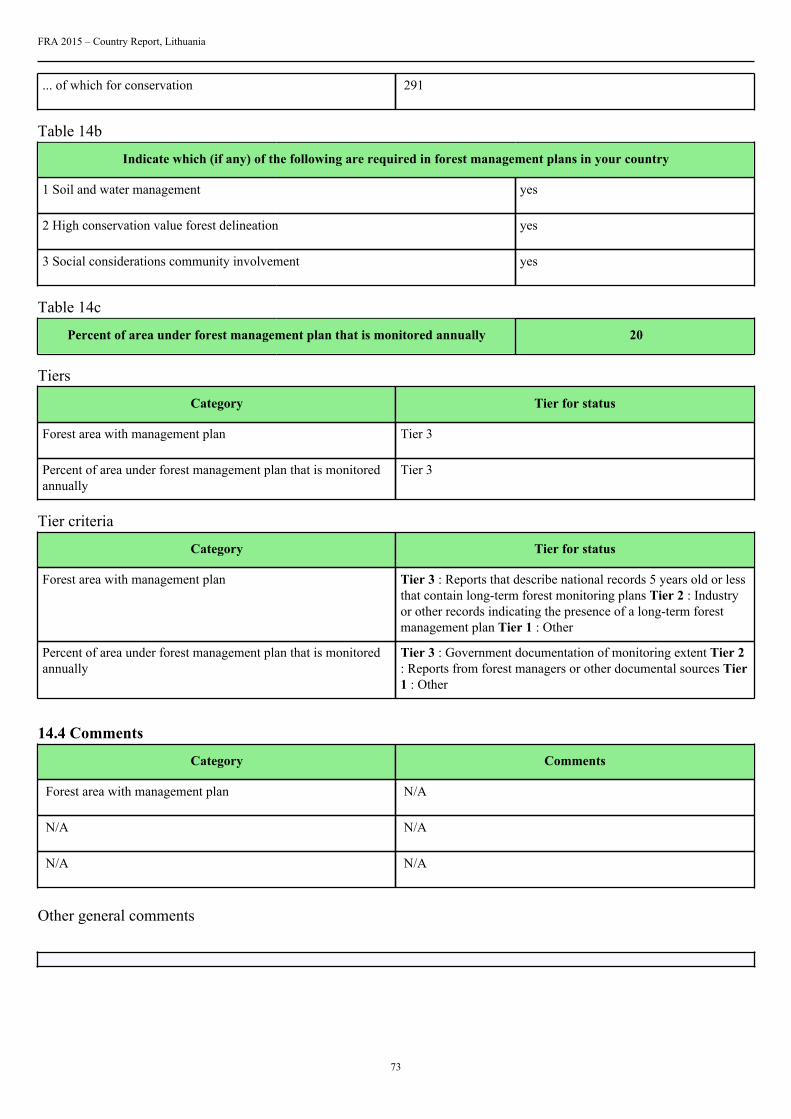
FRA 2015 – Country Report, Lithuania
73
... of which for conservation 291
Table 14b
Indicate which (if any) of the following are required in forest management plans in your country
1 Soil and water management yes
2 High conservation value forest delineation yes
3 Social considerations community involvement yes
Table 14c
Percent of area under forest management plan that is monitored annually 20
Tiers
Category Tier for status
Forest area with management plan Tier 3
Percent of area under forest management plan that is monitoredannually
Tier 3
Tier criteria
Category Tier for status
Forest area with management plan Tier 3 : Reports that describe national records 5 years old or lessthat contain long-term forest monitoring plans Tier 2 : Industryor other records indicating the presence of a long-term forestmanagement plan Tier 1 : Other
Percent of area under forest management plan that is monitoredannually
Tier 3 : Government documentation of monitoring extent Tier 2: Reports from forest managers or other documental sources Tier1 : Other
14.4 Comments
Category Comments
Forest area with management plan N/A
N/A N/A
N/A N/A
Other general comments
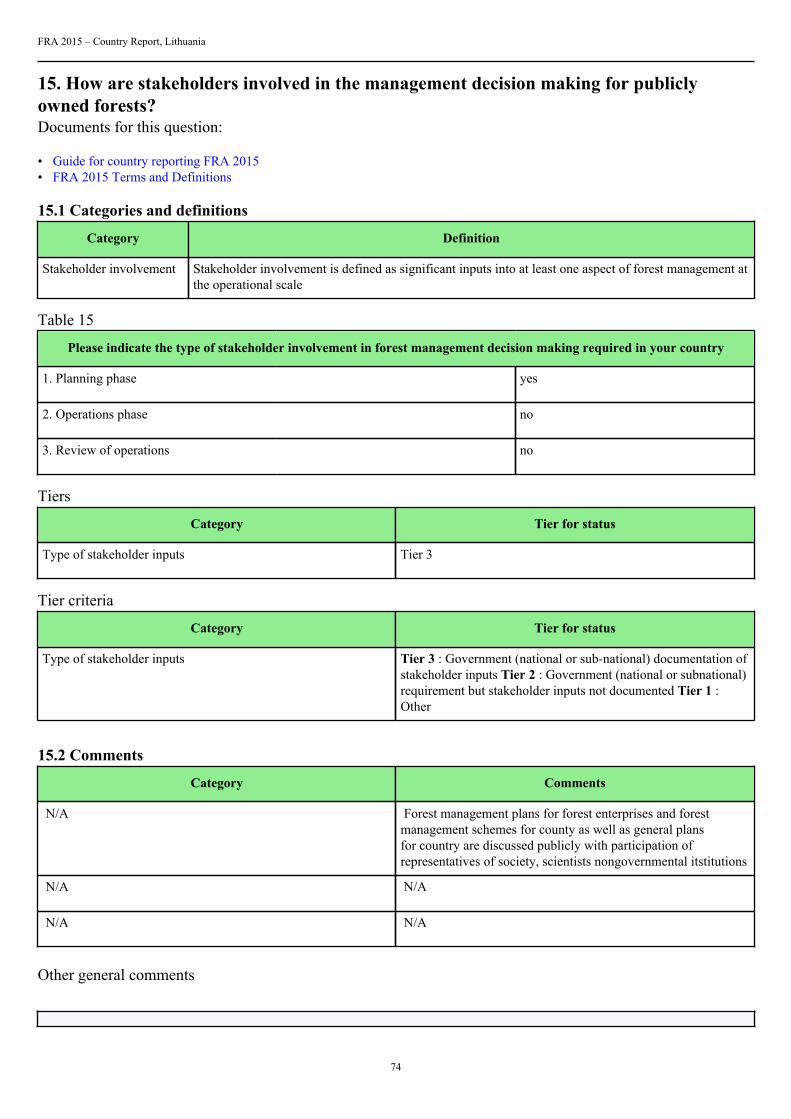
FRA 2015 – Country Report, Lithuania
74
15. How are stakeholders involved in the management decision making for publiclyowned forests?Documents for this question:
• Guide for country reporting FRA 2015• FRA 2015 Terms and Definitions
15.1 Categories and definitions
Category Definition
Stakeholder involvement Stakeholder involvement is defined as significant inputs into at least one aspect of forest management atthe operational scale
Table 15
Please indicate the type of stakeholder involvement in forest management decision making required in your country
1. Planning phase yes
2. Operations phase no
3. Review of operations no
Tiers
Category Tier for status
Type of stakeholder inputs Tier 3
Tier criteria
Category Tier for status
Type of stakeholder inputs Tier 3 : Government (national or sub-national) documentation ofstakeholder inputs Tier 2 : Government (national or subnational)requirement but stakeholder inputs not documented Tier 1 :Other
15.2 Comments
Category Comments
N/A Forest management plans for forest enterprises and forestmanagement schemes for county as well as general plansfor country are discussed publicly with participation ofrepresentatives of society, scientists nongovernmental itstitutions
N/A N/A
N/A N/A
Other general comments

FRA 2015 – Country Report, Lithuania
75
16. What is the area of forest under an independently verified forest certification scheme?Documents for this question:
• Guide for country reporting FRA 2015• FRA 2015 Terms and Definitions
16.1 Categories and definitions
Category Definition
FSC certification Forest area certified under the Forest Stewardship Council certification scheme
PEFC certification Forest area certified under the Programme for the Endorsement of Forest Certification scheme
Other international forestmanagement certification
Forest area certified under an international forest management certification scheme with publishedstandards and is independently verified by a third-party, excluding FSC and PEFC certification.
Certified forest areausing a domestic forestmanagement certificationscheme
Area certified under a forest management certification scheme with published standards that arenationally recognized and independently verified by a thirdparty
16.2 DataTable 16a
Forest area (000 ha)International forest
management certification2000 2001 2002 2003 2004 2005 2006
FSC 0 0 66.14 448.57 644.8 1005.53 1007.34
PEFC 0 0 0 0 0 0 0
Other 0 0 0 0 0 0 0
2007 2008 2009 2010 2011 2012
FSC 1044.32 677.09 976.94 1033.2 1049.41 1055.35
PEFC 0 0 0 0 0 0
Other 0 0 0 0 0 0
Table 16b
Forest area (000 ha)Domestic forest
management certification2000 2001 2002 2003 2004 2005 2006
Not applied 0 0 0 0 0 0 0
N/A 0 0 0 0 0 0 0
N/A 0 0 0 0 0 0 0

FRA 2015 – Country Report, Lithuania
76
2007 2008 2009 2010 2011 2012
Not applied 0 0 0 0 0 0
0 0 0 0 0 0
0 0 0 0 0 0
Tier criteria
Category Tier for status
International forest management certification Tier 3: International forest management scheme recordsmaintained by the certifying organization for the reporting yearTier 2: International forest management scheme records reportedby the certifying organization for a period 2 years prior to thereporting year Tier: 1 Other
Domestic forest management certification Tier 3: National registry reports for domestic forest managementcertification maintained by the certifying organization for thereporting year Tier 2: Domestic forest management schemerecords reported by the certifying organization for a period 2years prior to the reporting year Tier: 1 Other
Tiers
Category Tier for status
International forest management certification Tier 3
Domestic forest management certification Tier 3
16.3 Comments
Category Comments related to data definitions etc
Certified forest area using an international forest managementcertification scheme
N/A
Domestic forest management certification Not applied
Other general comments
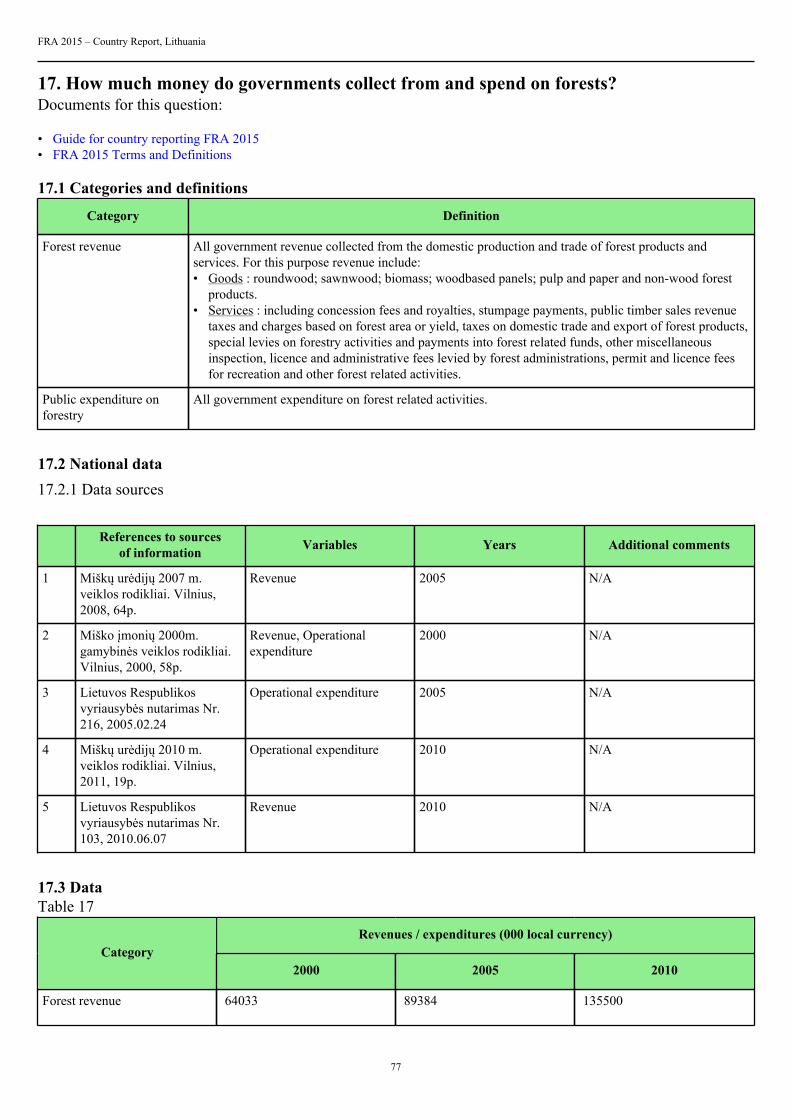
FRA 2015 – Country Report, Lithuania
77
17. How much money do governments collect from and spend on forests?Documents for this question:
• Guide for country reporting FRA 2015• FRA 2015 Terms and Definitions
17.1 Categories and definitions
Category Definition
Forest revenue All government revenue collected from the domestic production and trade of forest products andservices. For this purpose revenue include:• Goods : roundwood; sawnwood; biomass; woodbased panels; pulp and paper and non-wood forest
products.• Services : including concession fees and royalties, stumpage payments, public timber sales revenue
taxes and charges based on forest area or yield, taxes on domestic trade and export of forest products,special levies on forestry activities and payments into forest related funds, other miscellaneousinspection, licence and administrative fees levied by forest administrations, permit and licence feesfor recreation and other forest related activities.
Public expenditure onforestry
All government expenditure on forest related activities.
17.2 National data17.2.1 Data sources
References to sourcesof information Variables Years Additional comments
1 Miškų urėdijų 2007 m.veiklos rodikliai. Vilnius,2008, 64p.
Revenue 2005 N/A
2 Miško įmonių 2000m.gamybinės veiklos rodikliai.Vilnius, 2000, 58p.
Revenue, Operationalexpenditure
2000 N/A
3 Lietuvos Respublikosvyriausybės nutarimas Nr.216, 2005.02.24
Operational expenditure 2005 N/A
4 Miškų urėdijų 2010 m.veiklos rodikliai. Vilnius,2011, 19p.
Operational expenditure 2010 N/A
5 Lietuvos Respublikosvyriausybės nutarimas Nr.103, 2010.06.07
Revenue 2010 N/A
17.3 DataTable 17
Revenues / expenditures (000 local currency)Category
2000 2005 2010
Forest revenue 64033 89384 135500

FRA 2015 – Country Report, Lithuania
78
Public expenditure on forestry 12385 13000 25400
2000 2005 2010
Name of Local Currency LITAS (LTL) LITAS (LTL) LITAS (LTL)
17.4 Comments
Category Comments related to data definitions etc
Forest revenue Forest revenue consist of personal income tax and VAT
Public expenditure on forestry N/A
Other general comments N/A
Other general comments

FRA 2015 – Country Report, Lithuania
79
18. Who owns and manages the forests and how has this changed?Documents for this question:
• Guide for country reporting FRA 2015• FRA 2015 Terms and Definitions
18.1 Categories and definitions
Category Definition
Public ownership Forest owned by the State or administrative units of the public administration or by institutions orcorporations owned by the public administration.
...of which owned by thestate at national scale(sub-category)
Forest owned by the State at the national scale or administrative units of the public administration or byinstitutions or corporations owned by the public administration.
...of which owned by thestate at the sub-nationalgovernment scale (sub-category)
Forest owned by the State at the sub-national government scale or administrative units of the publicadministration or by institutions or corporations owned by the public administration.
Private ownership Forest owned by individuals, families, communities, private cooperatives corporations and otherbusiness entities, private, religious and educational institutions, pension or investment funds, NGOs,nature conservation associations and other private institutions.
...of which individuals(sub-category)
Forest owned by individuals and families.
...of which privatebusiness entities andinstitutions (sub-category)
Forest owned by private corporations cooperatives companies and other business entities as well asprivate nonprofit organizations such as NGOs nature conservation associations, and private religiousand educational institutions etc.
...of which local tribal andindigenous communities(sub-category)
Forest owned by a group of individuals belonging to the same community residing within or in thevicinity of a forest area or forest owned by communities of indigenous or tribal people The communitymembers are coowners that share exclusive rights and duties and benefits contribute to the communitydevelopment.
Unknown ownership Forest area where ownership is unknown includes areas where ownership is unclear or disputed.
Categories related tomanagement rights
of public forestsDefinition
Public Administration The Public Administration (or institutions or corporations owned by the Public Administration) retainsmanagement rights and responsibilities within the limits specified by the legislation.
Individuals households Forest management rights and responsibilities are transferred from the Public Administration toindividuals or households through long-term leases or management agreements.
Private companies Forest management rights and responsibilities are transferred from the Public Administration tocorporations, other business entities private cooperatives, private nonprofit institutions and associations,etc., through long-term leases or management agreements.
Communities Forest management rights and responsibilities are transferred from the Public Administration to localcommunities (including indigenous and tribal communities) through long-term leases or managementagreements.
Other form ofmanagement rights
Forests for which the transfer of management rights does not belong to any of the categories mentionedabove.
18.2 National data
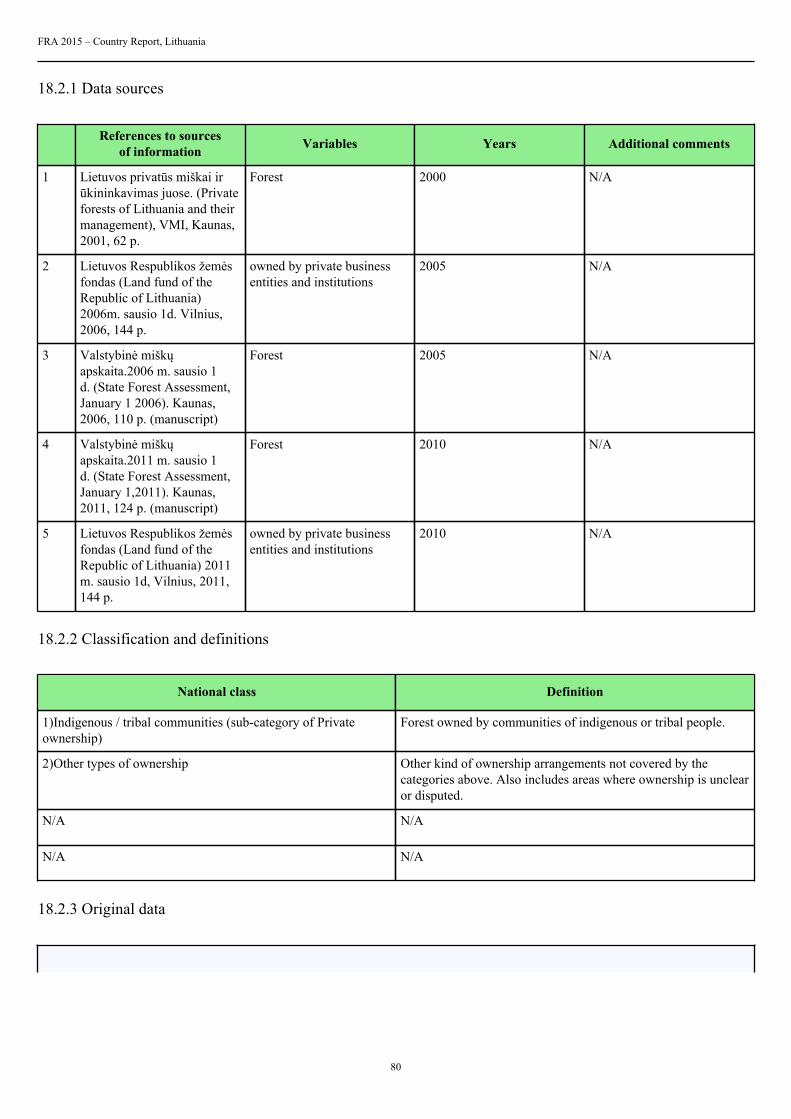
FRA 2015 – Country Report, Lithuania
80
18.2.1 Data sources
References to sourcesof information Variables Years Additional comments
1 Lietuvos privatūs miškai irūkininkavimas juose. (Privateforests of Lithuania and theirmanagement), VMI, Kaunas,2001, 62 p.
Forest 2000 N/A
2 Lietuvos Respublikos žemėsfondas (Land fund of theRepublic of Lithuania)2006m. sausio 1d. Vilnius,2006, 144 p.
owned by private businessentities and institutions
2005 N/A
3 Valstybinė miškųapskaita.2006 m. sausio 1d. (State Forest Assessment,January 1 2006). Kaunas,2006, 110 p. (manuscript)
Forest 2005 N/A
4 Valstybinė miškųapskaita.2011 m. sausio 1d. (State Forest Assessment,January 1,2011). Kaunas,2011, 124 p. (manuscript)
Forest 2010 N/A
5 Lietuvos Respublikos žemėsfondas (Land fund of theRepublic of Lithuania) 2011m. sausio 1d, Vilnius, 2011,144 p.
owned by private businessentities and institutions
2010 N/A
18.2.2 Classification and definitions
National class Definition
1)Indigenous / tribal communities (sub-category of Privateownership)
Forest owned by communities of indigenous or tribal people.
2)Other types of ownership Other kind of ownership arrangements not covered by thecategories above. Also includes areas where ownership is unclearor disputed.
N/A N/A
N/A N/A
18.2.3 Original data

FRA 2015 – Country Report, Lithuania
81
Forest area (1000 hectares) FRA 2015Categories
1990 2000 2005 2010
Public ownership 1945 1562 1404 1333
Private ownership 0 458 717 837
...of which ownedby individuals
0 458 705 792
...of whichowned by privatebusiness entitiesand institutions
0 0 12 45
...of whichowned by localcommunities
0 0 0 0
...of whichowned byindigenous / tribalcommunities
0 0 0 0
Other types ofownership
0 0 0 0
TOTAL 1945 2020 2121 2170
18.3 Analysis and processing of national data18.3.1 Adjustment
Not applied.
18.3.2 Estimation and forecasting
Not applied.
18.3.3 Reclassification
Not applied.

FRA 2015 – Country Report, Lithuania
82
18.4 DataTable 18a
Forest area (1000 hectares)Categories
1990 2000 2005 2010
Public ownership 1945 1562 1404 1333
... of which ownedby the state atnational scale
1945 1562 1404 1333
... of which ownedby the state atthe sub-nationalgovernment scale
0 0 0 0
Private ownership 0 458 717 837
... of which ownedby individuals
0 458 705 792
... of which ownedby private businessentities andinstitutions
0 0 12 45
... of which ownedby local, tribaland indigenouscommunities
0 0 0 0
Unknownownership
0 0 0 0
TOTAL 1945.00 2020.00 2121.00 2170.00
Tiers
Category Tier for status Tier for reported trend
Public ownership Tier 3 Tier 3
Private ownership Tier 3 Tier 3
Unknown ownership Tier 3 Tier 3
Tier criteria
Category Tier for status Tier for reported trend
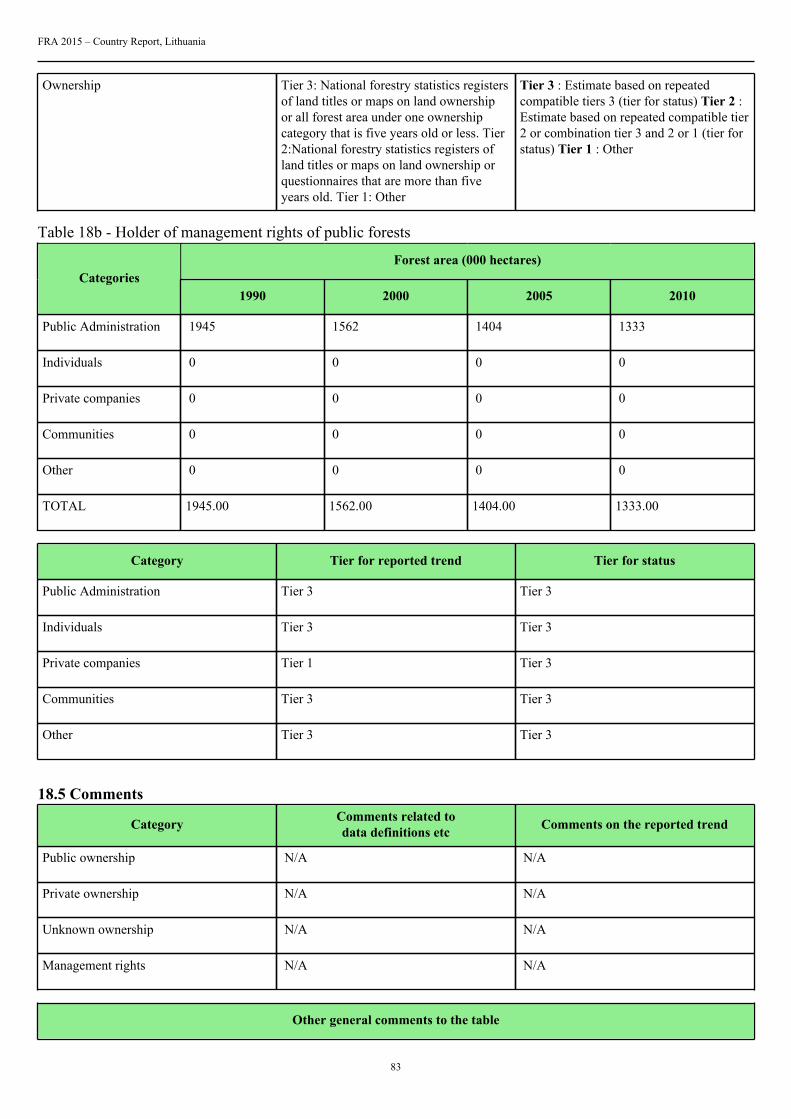
FRA 2015 – Country Report, Lithuania
83
Ownership Tier 3: National forestry statistics registersof land titles or maps on land ownershipor all forest area under one ownershipcategory that is five years old or less. Tier2:National forestry statistics registers ofland titles or maps on land ownership orquestionnaires that are more than fiveyears old. Tier 1: Other
Tier 3 : Estimate based on repeatedcompatible tiers 3 (tier for status) Tier 2 :Estimate based on repeated compatible tier2 or combination tier 3 and 2 or 1 (tier forstatus) Tier 1 : Other
Table 18b - Holder of management rights of public forests
Forest area (000 hectares)Categories
1990 2000 2005 2010
Public Administration 1945 1562 1404 1333
Individuals 0 0 0 0
Private companies 0 0 0 0
Communities 0 0 0 0
Other 0 0 0 0
TOTAL 1945.00 1562.00 1404.00 1333.00
Category Tier for reported trend Tier for status
Public Administration Tier 3 Tier 3
Individuals Tier 3 Tier 3
Private companies Tier 1 Tier 3
Communities Tier 3 Tier 3
Other Tier 3 Tier 3
18.5 Comments
Category Comments related todata definitions etc Comments on the reported trend
Public ownership N/A N/A
Private ownership N/A N/A
Unknown ownership N/A N/A
Management rights N/A N/A
Other general comments to the table
FRA 2015 – Country Report, Lithuania
84
N/A

FRA 2015 – Country Report, Lithuania
85
19. How many people are directly employed in forestry?Documents for this question:
• Guide for country reporting FRA 2015• FRA 2015 Terms and Definitions
19.1 Categories and definitions
Category Definition
Full-time equivalents(FTE)
A measurement equal to one person working full-time during a specified reference period.
Employment in forestry Employment in activities related to production of goods derived from forests. This category correspondsto the ISIC/NACE Rev. 4 activity A02 (Forestry and logging).
19.2 National data19.2.1 Data sources
References to sourcesof information Variables Years Additional comments
1 Lietuvos Miškų ūkiostatistika 2003. Kaunas, 2003,112 p. (Lithuanian statisticalyearbook of Forestry 2003.Kaunas, 2003, p.112)
N/A 1990, 2000 N/A
2 Lietuvos miškų ūkio statistika2008. Kaunas, 2008, 152p. (Lithuanian statisticalYearbook of forestry 2008.Kaunas, 2008, p.152)
N/A 2005 N/A
3 Information from StateService of Protected Areas
N/A 2005 N/A
4 Lietuvos miškų ūkio statistika2011. Kaunas, 2011, 184p. (Lithuanian statisticalYearbook of forestry 2011.Kaunas, 2011, p.184)
N/A 2010 N/A
19.2.2 Classification and definitions
National class Definition
N/A N/A
N/A N/A
N/A N/A
N/A N/A
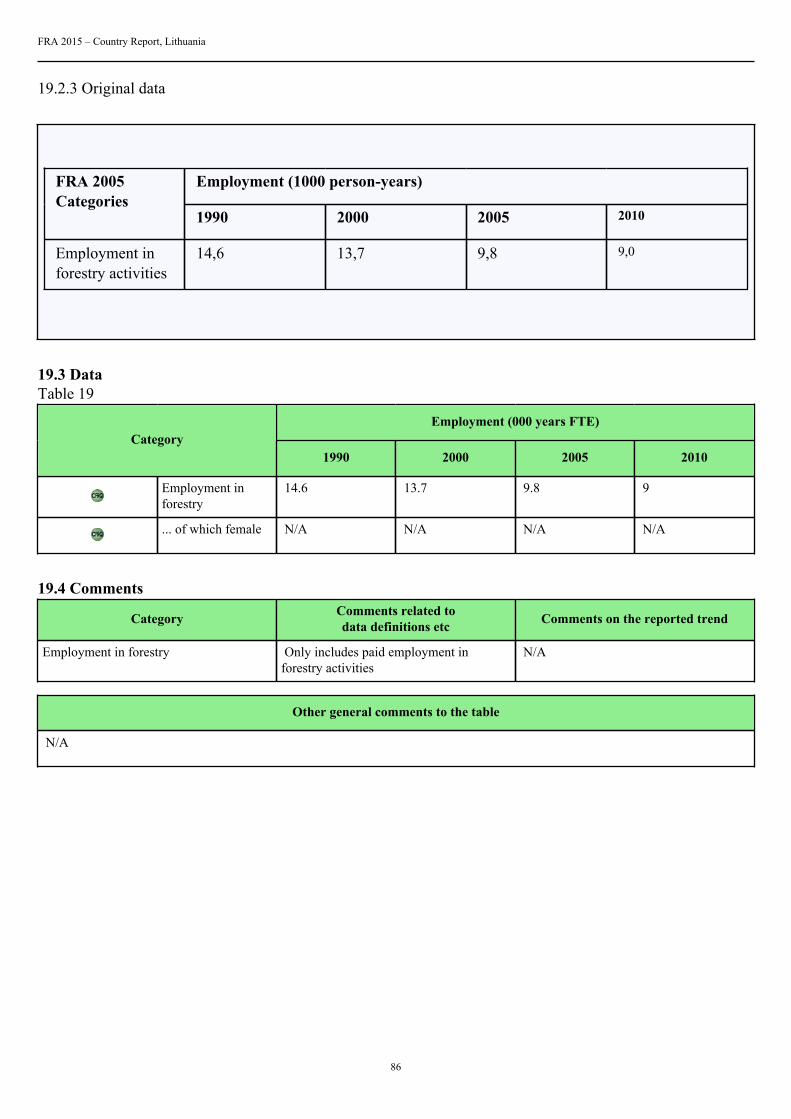
FRA 2015 – Country Report, Lithuania
86
19.2.3 Original data
Employment (1000 person-years)FRA 2005Categories
1990 2000 2005 2010
Employment inforestry activities
14,6 13,7 9,8 9,0
19.3 DataTable 19
Employment (000 years FTE)Category
1990 2000 2005 2010
Employment inforestry
14.6 13.7 9.8 9
... of which female N/A N/A N/A N/A
19.4 Comments
Category Comments related todata definitions etc Comments on the reported trend
Employment in forestry Only includes paid employment inforestry activities
N/A
Other general comments to the table
N/A
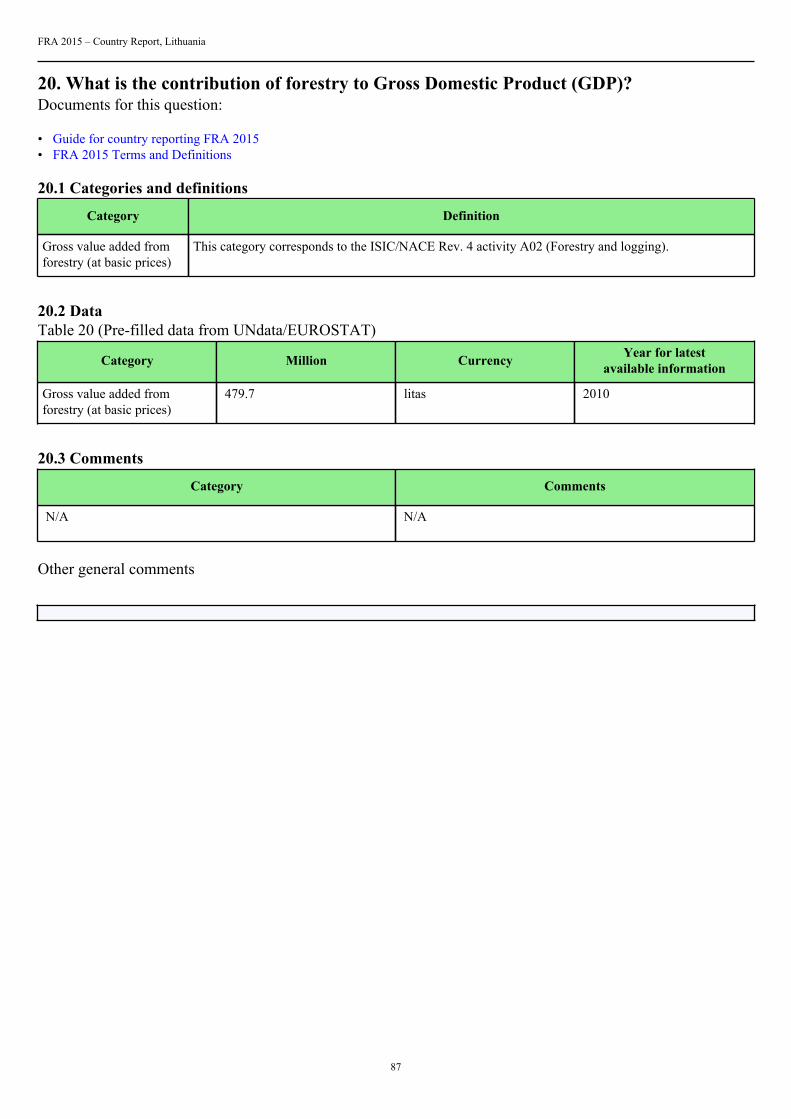
FRA 2015 – Country Report, Lithuania
87
20. What is the contribution of forestry to Gross Domestic Product (GDP)?Documents for this question:
• Guide for country reporting FRA 2015• FRA 2015 Terms and Definitions
20.1 Categories and definitions
Category Definition
Gross value added fromforestry (at basic prices)
This category corresponds to the ISIC/NACE Rev. 4 activity A02 (Forestry and logging).
20.2 DataTable 20 (Pre-filled data from UNdata/EUROSTAT)
Category Million Currency Year for latestavailable information
Gross value added fromforestry (at basic prices)
479.7 litas 2010
20.3 Comments
Category Comments
N/A N/A
Other general comments
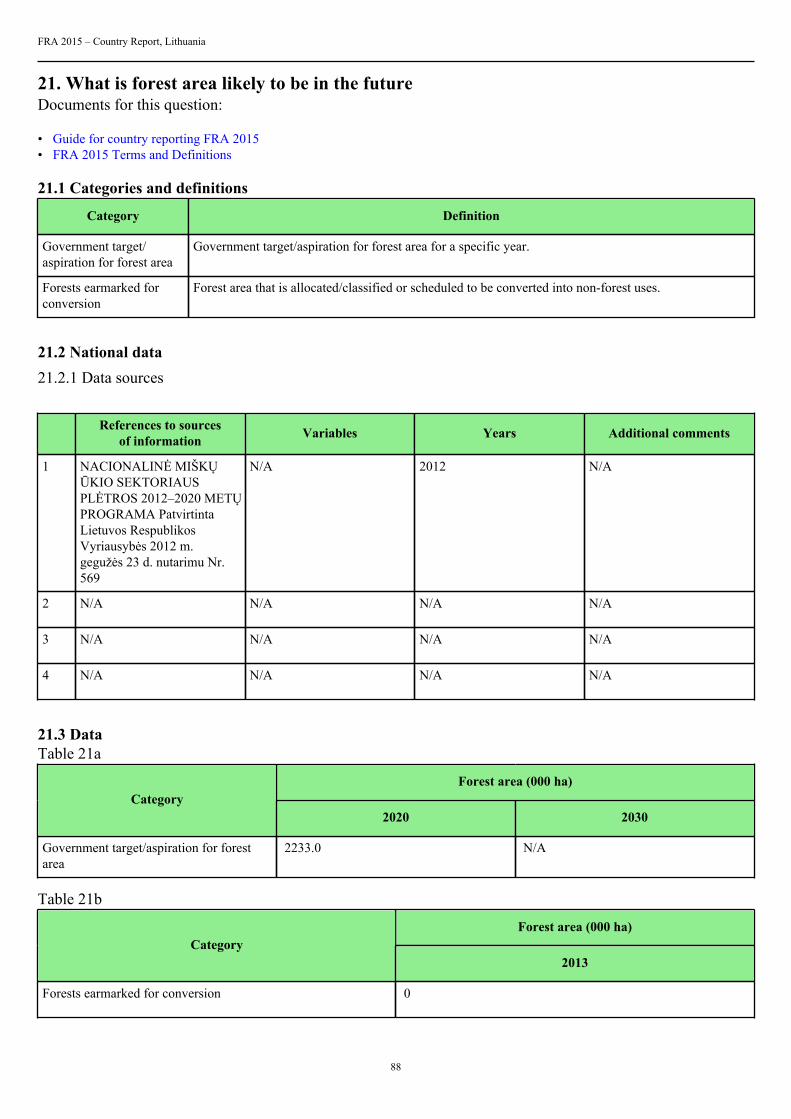
FRA 2015 – Country Report, Lithuania
88
21. What is forest area likely to be in the futureDocuments for this question:
• Guide for country reporting FRA 2015• FRA 2015 Terms and Definitions
21.1 Categories and definitions
Category Definition
Government target/aspiration for forest area
Government target/aspiration for forest area for a specific year.
Forests earmarked forconversion
Forest area that is allocated/classified or scheduled to be converted into non-forest uses.
21.2 National data21.2.1 Data sources
References to sourcesof information Variables Years Additional comments
1 NACIONALINĖ MIŠKŲŪKIO SEKTORIAUSPLĖTROS 2012–2020 METŲPROGRAMA PatvirtintaLietuvos RespublikosVyriausybės 2012 m.gegužės 23 d. nutarimu Nr.569
N/A 2012 N/A
2 N/A N/A N/A N/A
3 N/A N/A N/A N/A
4 N/A N/A N/A N/A
21.3 DataTable 21a
Forest area (000 ha)Category
2020 2030
Government target/aspiration for forestarea
2233.0 N/A
Table 21b
Forest area (000 ha)Category
2013
Forests earmarked for conversion 0
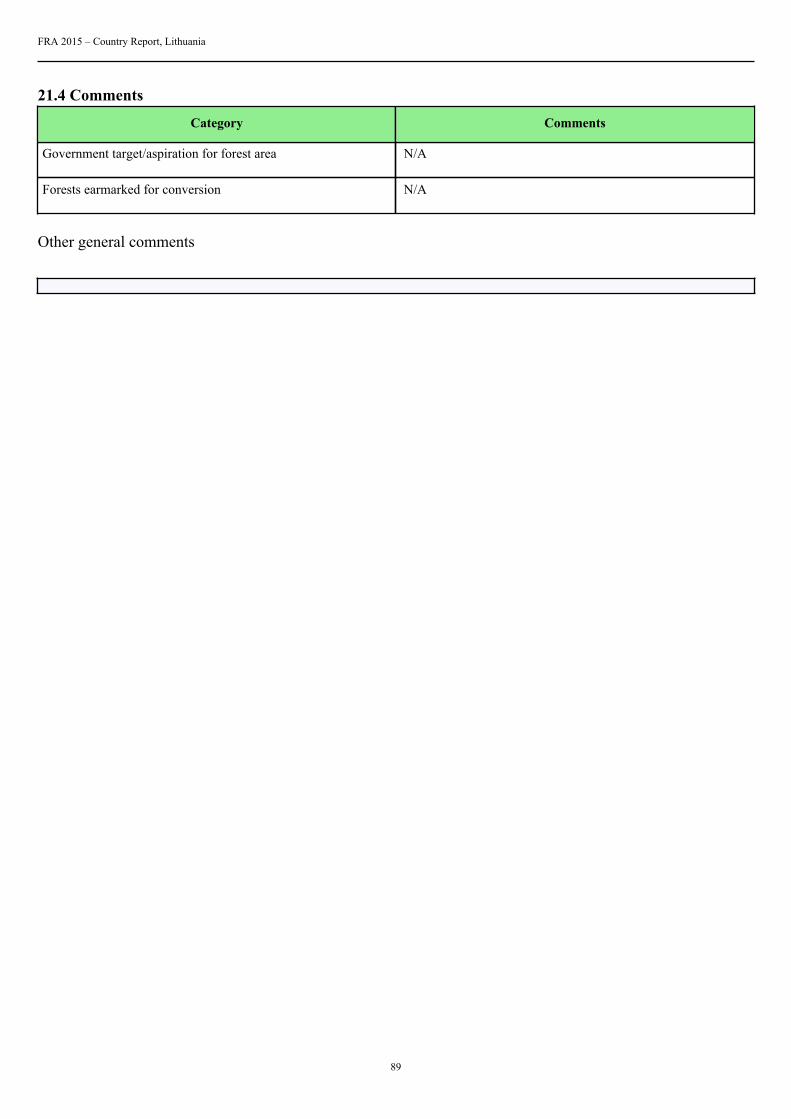
FRA 2015 – Country Report, Lithuania
89
21.4 Comments
Category Comments
Government target/aspiration for forest area N/A
Forests earmarked for conversion N/A
Other general comments