Embed Size (px)
Citation preview
DaltonTransactions
PAPER
Cite this: Dalton Trans., 2019, 48,9376
Received 29th April 2019,Accepted 2nd June 2019
DOI: 10.1039/c9dt01786k
rsc.li/dalton
Lithium ion dynamics in LiZr2(PO4)3 andLi1.4Ca0.2Zr1.8(PO4)3†
Isabel Hanghofer,*a Bernhard Gadermaier, a Alexandra Wilkening,a
Daniel Rettenwander a and H. Martin R. Wilkening *a,b
High ionic conductivity, electrochemical stability and small interfacial resistances against Li metal anodes
are the main requirements to be fulfilled in powerful, next-generation all-solid-state batteries.
Understanding ion transport in materials with sufficiently high chemical and electrochemical stability,
such as rhombohedral LiZr2(PO4)3, is important to further improve their properties with respect to transla-
tional Li ion dynamics. Here, we used broadband impedance spectroscopy to analyze the electrical
responses of LiZr2(PO4)3 and Ca-stabilized Li1.4Ca0.2Zr1.8(PO4)3 that were prepared following a solid-state
synthesis route. We investigated the influence of the starting materials, either ZrO2 and Zr(CH3COO)4, on
the final properties of the products and studied Li ion dynamics in the crystalline grains and across grain
boundary (g.b.) regions. The Ca2+ content has only little effect on bulk properties (4.2 × 10⁻⁵ S cm−1 at
298 K, 0.41 eV), but, fortunately, the g.b. resistance decreased by 2 orders of magnitude. Whereas, 7Li
spin-alignment echo nuclear magnetic resonance (NMR) confirmed long-range ion transport as seen by
conductivity spectroscopy, 7Li NMR spin–lattice relaxation revealed much smaller activation energies
(0.18 eV) and points to rapid localized Li jump processes. The diffusion-induced rate peak, appearing at
T = 282 K, shows Li+ exchange processes with rates of ca. 109 s−1 corresponding, formally, to ionic
conductivities in the order of 10−3 S cm−1 to 10−2 S cm−1.
1. Introduction
In the years to come, all-solid-state Li or Na batteries1 areexpected to replace conventional systems2 that still rely onflammable aprotic electrolytes. Ceramic cells may take advan-tage of highly flexible design possibilities if batteries withdimensions in the mm range are considered.3,4 Moreover,ceramic batteries are going to withstand higher temperaturesthan their analogous cells with liquid components.5
For their realization, ceramic electrolytes with sufficientlyhigh ionic conductivities are, however, needed.5–9 The overallperformance of NaSICON-type (Na SuperIonic CONductor)conductors10,11 has attracted renewed interest to study theinfluence of synthesis conditions and dopants on morphologyand ion dynamics. Earlier reports have shown that LiM2(PO4)3(M: Ge, Ti, Sn, Hf, Zr) exhibits good chemical stabilities under
ambient conditions. This property comes along with a wideelectrochemical stability window.12,13 LiTi2(PO4)3 is known as avery good Li-ion conductor but it suffers from the fact thatTi(IV) can easily be reduced to Ti(III) when in contact withmetallic Li.14
In contrast to LiTi2(PO4)3-based ceramics, including thosein which Ti4+ is partly replaced by Al3+, LiZr2(PO4)3 (LZP)shows a much better stability against Li anodes. If in contactwith a Li metallic anode LZP forms stable decomposing pro-ducts, such as Li3P and layer-structured Li8ZrO6, that are ableto conduct Li ions when present as thin layers. Importantly,this interphase also reveals sufficiently good wetting propertieswith respect to both Li metal and the electrolyte.15 LZP crystal-lizes with different structures, ionic conductivities sensitivelydepend on both the overall morphology and the defect chem-istry involved. The ionic conductivity can be improved byincorporating different metals such as Y3+, Sc3+, Al3+, La3+ orCa2+; this strategy is usually accompanied by a stabilization ofthe rhombohedral structure.13,16–22 LZP is typically prepared atcalcination temperatures of ca. 1173 K, the phase appearingunder these conditions is denoted as the α-phase of LZP,which is subdivided in a orthorhombic form (α) and a mono-clinic one (α′). At higher sintering temperatures, that is,approximately at 1423 K, the highly conductive rhombohedralstructure α-LiZr2(PO4)3 crystallizing with R3̄c symmetry is
†Electronic supplementary information (ESI) available: Further X-ray powderpatterns, results from structure solution and Nyquist plots. See DOI: 10.1039/c9dt01786k
aInstitute for Chemistry and Technology of Materials, Christian Doppler Laboratory
for Lithium Batteries, Graz University of Technology (NAWI Graz), Stremayrgasse 9,
A-8010 Graz, Austria. E-mail: [email protected] – European Research Institute, CNRS FR3104, Hub de l’Energie,
Rue Baudelocque, 80039 Amiens, France. E-mail: [email protected]
9376 | Dalton Trans., 2019, 48, 9376–9387 This journal is © The Royal Society of Chemistry 2019
Ope
n A
cces
s A
rtic
le. P
ublis
hed
on 0
3 Ju
ne 2
019.
Dow
nloa
ded
on 2
/8/2
022
6:40
:06
PM.
Thi
s ar
ticle
is li
cens
ed u
nder
a C
reat
ive
Com
mon
s A
ttrib
utio
n 3.
0 U
npor
ted
Lic
ence
.
View Article OnlineView Journal | View Issue
formed. α′-LiZr2(PO4)3, obtained at lower temperatures, isusually a mixture of monoclinic LZP and triclinic LZP; its ionicconductivity is reported to be in the order of 10−8 S cm−1
whereas α-LiZr2(PO4)3 shows values around 10−5 S cm−1.15,22–25
In this work, the structure variation of different educts onthe product formed is discussed. We analysed Li ion dynamicsin LiZr2(PO4)3 and Li1+2xCaxZr2−x(PO4)3 (LCZP) by both broad-band impedance spectroscopy26,27 and 7Li nuclear magneticresonance (NMR) spectroscopy, i.e., by recording diffusion-induced spin–lattice relaxation rates.28–30 The latter are sensi-tive to both short-range and long-range ion transport throughthe crystal lattice of LZP. As we deal with powder samples withcrystallite diameters in the µm range, NMR rates measured inthe laboratory frame of reference are solely sensitive to bulkion dynamics.
2. Experimental2.1. Sample preparation
LiZr2(PO4)3 (LZP) was prepared via a classic solid-state reactionby mixing stoichiometric amounts of Li2CO3 (Sigma Aldrich≥99%), (NH4)2HPO4 (Sigma Aldrich ≥99.9%) with either ZrO2
(Sigma Aldrich ≥99%) or Zr(CH3COO)4 (= Zr(ac)4). The startingcompounds were mechanically milled for 2 hours by using ahigh-energy planetary ball mill (Fritsch Pulverisette 7 Premiumline) at a rotation speed of 400 rpm. We used ZrO2 beakers(45 mL), which were filled with 180 balls made of ZrO2 (5 mmin diameter). The subsequent calcination process was carriedout in Al2O3 crucibles at 900 °C (heating rate 10 °C min−1) for10 hours, where the decomposition of the hydrogen phosphatestarts and initiates the reaction with Li2CO3. The resultingwhite powder was milled again for 2 hours at 400 rpm to guar-antee a good contact between the particles. Finally, themixture was pressed with 0.4 tons into pellets with a diameterof 5 mm. The pellets were filled into Al2O3 crucibles andsintered at 1150 °C (heating rate 10 °C min−1) for 20 hours. Toincorporate Ca2+ into LZP we used CaCO3 (Alfa Aesar, >99%).An excess of 10 wt% Li2CO3 should compensate the loss oflithium during the high temperature heating process leadingto Li1.4Ca0.2Zr1.8(PO4)3 (LCZP). For the synthesis of LZP (andLCZP) using Zr(CH3COO)4 we needed to prepare the acetate asfollows.31 20 mmol Zirconium oxochloride (Sigma-Aldrich99.99%) was dissolved under reflux in 100 mL of a mixture ofMeCOOH (Sigma-Aldrich ≥99.5%) and Me(COO)2O (SigmaAldrich ≥99%) (1 : 9). After the mixture was allowed to cool toroom temperature, a white crystalline deposit appeared.Finally, it was filtered and dried at 60 °C under vacuum.
2.2. X-ray powder diffraction
The sample obtained after the calcination process and thefinally sintered product were characterized by X-ray powderdiffraction (XRPD). We used a Bruker D8 Advance diffract-ometer operating with Bragg Brentano geometry and Cu Kα
radiation. Diffractograms were recorded in air atmosphere andat room temperature covering a 2θ range from 20° to 100° with
a step size of 0.02° (2 s per step). Rietveld analysis(X-PertHighScorePlus (PANanalytical)) was used to refine thediffraction data.
2.3. Impedance spectroscopy
For the impedance measurements the sintered samples wereequipped with gold electrodes by a sputtering process. Goldelectrodes with a layer thickness of 100 nm were applied onboth sides with a sputter coater (LEICA EM SCD 050) to ensurea good electrical contact. To avoid any influence of moisture,the samples were dried at 60 °C under vacuum prior to theimpedance measurements.
Impedance spectra were recorded with a NovocontrolConcept 80 broadband dielectric spectrometer equipped witha BDS 1200 cell combined with an active ZGS cell(Novocontrol). We measured complex impedances over a fre-quency range of ten decades (10 mHz to 10 MHz). The temp-erature in the sample holder was varied from 173 K to 473 K insteps of 20 K; the temperature program was automatically con-trolled by a QUATRO cryosystem (Novocontrol). During themeasurements a dry nitrogen atmosphere was build uparound the sample in the cryostat to avoid any contaminationwith water and/or oxygen.
2.4. Nuclear magnetic resonance measurements
For the time-domain NMR measurements, the powdersamples LiZr2(PO4)3 and Li1.4Ca0.2Zr1.8(PO4)3 were sealed inDuran glass tubes (ca. 4 cm in length and 3 mm in diameter).During the sealing procedure they were kept under dynamicvacuum to safely protect them from any contact with humidair. We used 7Li NMR line shape measurements, spin latticerelaxation (SLR) experiments as well as 7Li spin alignmentecho (SAE) NMR to collect information about Li activationenergies and jump rates. Longitudinal NMR SLR rates (1/T1) aswell as spin-lock rates (1/T1ρ) were measured with a BrukerAvance III spectrometer that is connected to a shimmed cryo-magnet with a nominal magnetic field of 7 Tesla. This fieldcorresponds to a 7Li Larmor frequency of ω0/2π = 116 MHz.For the measurements at temperatures ranging from 173 K to583 K a ceramic temperature probe (Bruker Biospin) was used.Depending on temperature and at a power level of 180 W theπ/2 pulse length ranged from 2.2 µs to 2.4 µs.
7Li NMR SLR rates (1/T1 = R1) in the laboratory frame wereacquired with the well-known saturation recovery pulsesequence. This sequence uses a comb of closely spaced π/2pulses to destroy any longitudinal magnetization Mz. The sub-sequent recovery of Mz was detected as a function of waitingtime td with a π/2 reading pulse: 10 × π/2 − td − π/2 –
acquisition.32,33 To construct the magnetization transientsMz(td), we plotted the area under the free induction decays vs.td. The transients Mz(td) were parameterized with stretchedexponentials, Mz(td) ∝ 1 − exp(−(t/T1)γ), to extract the rates R1.Additionally, rotating frame 7Li NMR SLRρ rates 1/T1ρ (= R1ρ)were measured by means of the spin lock technique: π/2-plock –acquisition.32 Here, we used a locking frequency ω1/2π of20 kHz. The duration of the spin-lock pulse tlock was varied
Dalton Transactions Paper
This journal is © The Royal Society of Chemistry 2019 Dalton Trans., 2019, 48, 9376–9387 | 9377
Ope
n A
cces
s A
rtic
le. P
ublis
hed
on 0
3 Ju
ne 2
019.
Dow
nloa
ded
on 2
/8/2
022
6:40
:06
PM.
Thi
s ar
ticle
is li
cens
ed u
nder
a C
reat
ive
Com
mon
s A
ttrib
utio
n 3.
0 U
npor
ted
Lic
ence
.View Article Online
from 10 µs to 460 ms. To ensure full longitudinal relaxationbetween each scan the recycle delay was set to 5 × T1. The R1ρrates were obtained by analyzing the resulting transientsMρ(tlock) with stretched exponentials with the form Mρ(tlock) ∝exp(−(tlock/T1ρ)κ). The stretching exponent γ varied from 1 to0.8, the exponent κ ranges from 1 to 0.6.
Finally, mixing time (tm) dependent 7Li SAE NMR decaycurves were recorded with the help of the Jeener–Broekaert34,35
three-pulse sequence: (90°)X-tp–(45°)Y-tm–45°-acq. We used aconstant preparation time tp of 25 µs to acquire two-timesinus–sinus single-spin correlation functions. The mixing timewas varied from 30 µs up to several seconds. A suitable phasecycle34,36 was employed to suppress unwanted coherences andto eliminate, as best as possible, dipolar contributionsaffecting the echo that appears after the reading pulse.36
Fourier transformation of the spin alignment echoes, startingfrom the top of the signal, yields 7Li SAE NMR spectra usefulto highlight quadrupole intensities due to the interaction ofthe quadrupole moment of the 7Li spin (spin-quantumnumber I = 3/2) and a non-vanishing electric field gradient.
3. Results and characterization3.1. Characterization via X-ray powder diffraction
The purity of the crystalline samples synthesized was exam-ined by XRPD. As mentioned above, diffraction patterns werecollected at room temperature and under air atmosphere. Thefirst XRPD pattern was recorded directly after the calcinationprocess, i.e., after removal of CO2, NH3 and H2O at 900 °C, thepattern is depicted in Fig. S1.† After this calcination step(10 hours), we see that LiZr2(PO4)3 crystallizes with monoclinicstructure (space group P121/c1, see Fig. S1 (ESI)†). Sinteringthe samples yields a crystalline material that is in agreement
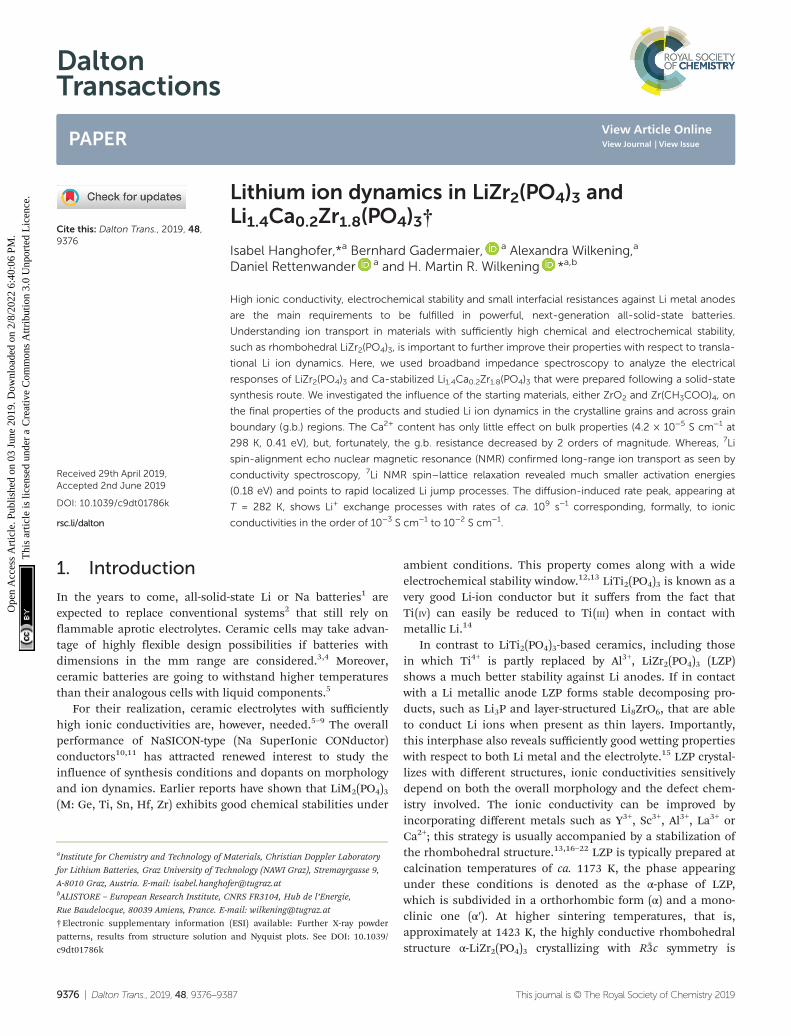
with the rhombohedral NaSICON structure37 (space group R3̄c,Fig. 1);19 the corresponding XRPD pattern is shown in Fig. 2.This phase is isostructural with the sibling compoundLiTi2(PO4)3.
38 The increase in conductivity before and after sin-tering, i.e., the difference in ionic transport properties ofmonoclinic and rhombohedral LZP is illustrated in Fig. S1b.†
The Zr2(PO4)3 framework of rhombohedral NaSICON-typeLZP consists of two ZrO6 octahedra and three PO4 tetrahedrasharing O atoms. The octahedral and tetrahedral units arealternating with the cations to form infinite chains parallel tothe ternary axis of the structure. Each PO4 unit shares its
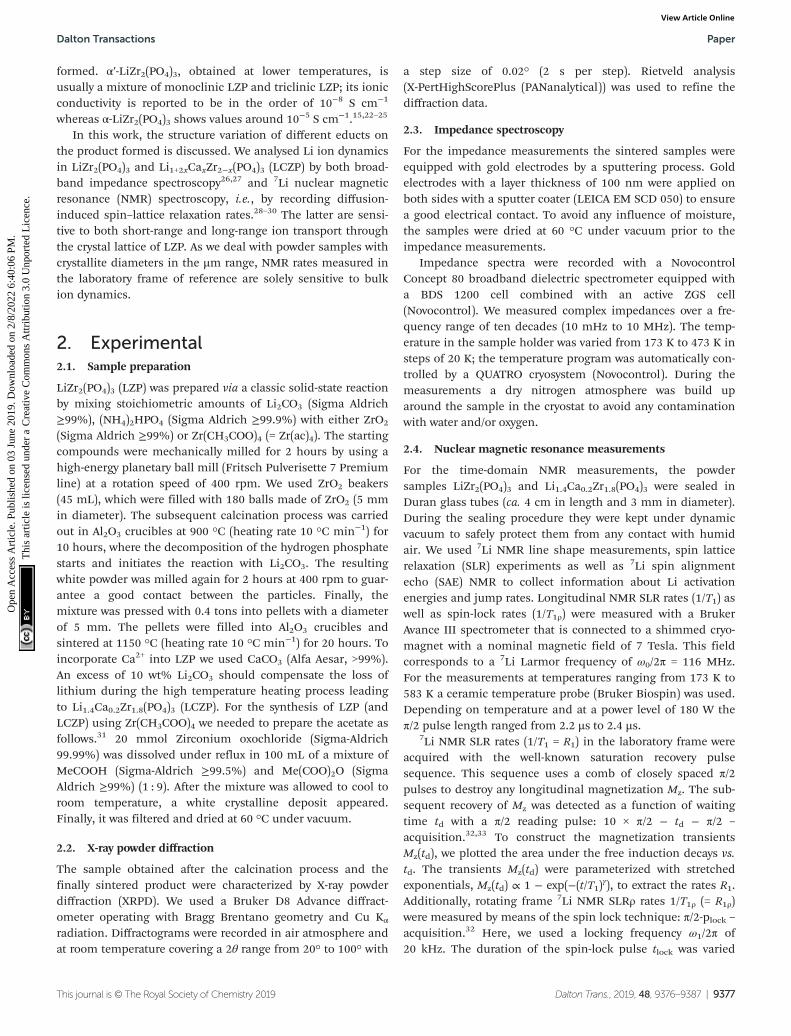
Fig. 1 Left: Rhombohedral crystal structure of LiZr2(PO4)3. The tetrahedra in purple represent PO4-units, octahedra in pink show ZrO6, while theblue spheres denote the Li+ ions. Li+ is octahedrally coordinated by oxygen anions of the ZrO6 octahedra. Right: Section of the rhombohedral crystalstructure to show interstitial sites A2; the Li ions may use to jump between the regularly occupied sites A1. The A1–A1 distance is 6.3 Å, which is, pre-sumably, much too large for a direct jump process.
Fig. 2 Rietveld refinement of LZP using ZrO2 as educt. The sample wassintered at 1150 °C for 20 hours in a closed Al2O3-crucible. LZP crystal-lizes with space group R3̄cH, see Table S1† for further information.Selected reflections have been indexed with vertical bars. A very smallamount (<4 wt%) of ZrO2 was detected. The inset shows the ab-plane ofthe rhombohedral NaSICON structure with the viewing direction alongthe c-axis.
Paper Dalton Transactions
9378 | Dalton Trans., 2019, 48, 9376–9387 This journal is © The Royal Society of Chemistry 2019
Ope
n A
cces
s A
rtic
le. P
ublis
hed
on 0
3 Ju
ne 2
019.
Dow
nloa
ded
on 2
/8/2
022
6:40
:06
PM.
Thi
s ar
ticle
is li
cens
ed u
nder
a C
reat
ive
Com
mon
s A
ttrib
utio
n 3.
0 U
npor
ted
Lic
ence
.View Article Online
oxygen with four ZrO6 octahedra of three Zr2(PO4)3 units toform the NaSICON framework. A 3D network of conductionpathways is formed that is used by the ions to diffuse throughthe crystal. In this case the Li ions (6b) are octahedrally co-ordinated by oxygen ions (36f ) at the intersection of three con-duction channels (A1). The A1 sites are located between pairsof ZrO6 octahedra along the c-axis, while the (vacant) intersti-tial sites (□) A2 can be found between O3ZrO3A1O3Zr-□-O3ZrO3A1. Since the A1–A1 distance in LZP is rather larger,we assume that interstitial sites, such as A2, are involved in Li+
diffusion. Because of the large spatial separation of Li ions inLZP, we expect rather low homonuclear dipole–dipole inter-actions resulting in narrow 7Li NMR lines even in the rigidlattice regime, see below.
In Fig. 2 the result of our Rietveld analysis of the diffractionpattern of LiZr2(PO4)3 synthesized by using ZrO2 as educt isshown. Our structure solution indeed points to rhombohedralsymmetry characterized by the space group R3̄cH (ICSD, no.201935), as already found by the study of Petit et al.19 Via high-temperature neutron diffraction (T ≥ 423 K), Catti et al.reported on two Li+ positions displaced from the A1 and A2sites (see Fig. S2†).24 Here, in addition to the main rhombo-hedral phase, a minor impurity of ZrO2 (<4 wt%) is seen (seeblack bars). Rietveld analysis yields the following lattice pro-perties a (= b) = 8.824 Å and c = 22.456 Å; V = 1514.24 Å3. Bydoping this sample with 5 wt% and 10 wt% Ca2+ thecell volume decreases (1512.64 Å3 (5 wt% Ca), 1506.22 Å3
(10 wt% Ca)) as expected; for further information we refer toTable S1 in the ESI.†
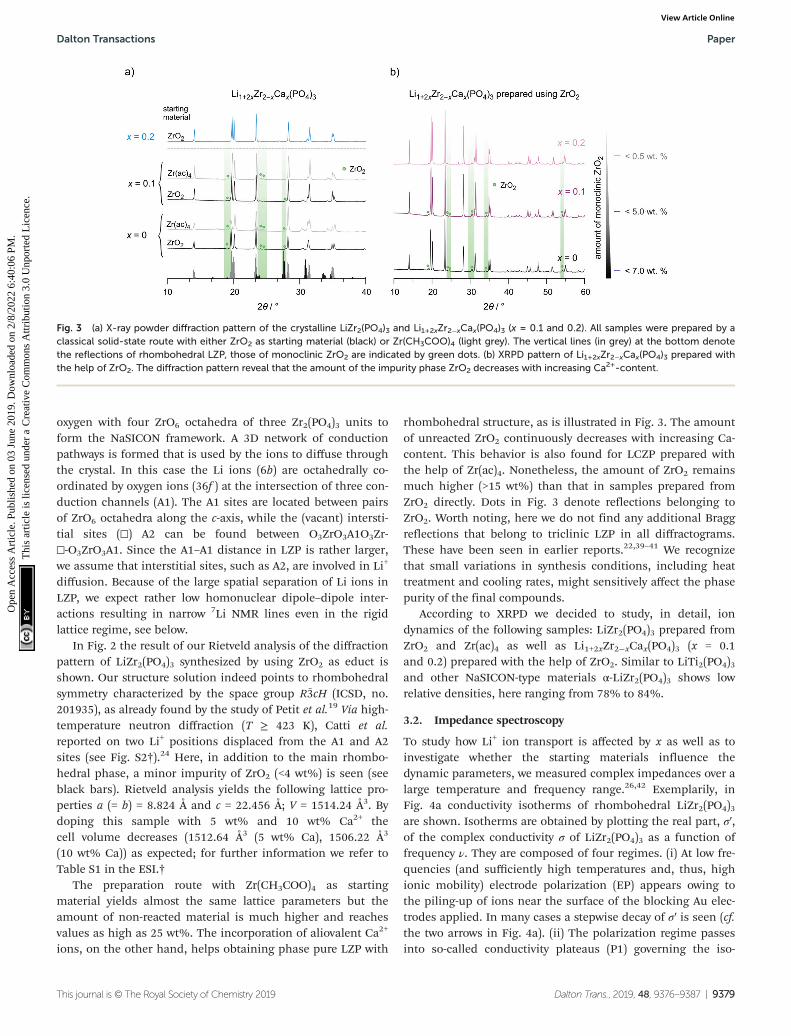
The preparation route with Zr(CH3COO)4 as startingmaterial yields almost the same lattice parameters but theamount of non-reacted material is much higher and reachesvalues as high as 25 wt%. The incorporation of aliovalent Ca2+
ions, on the other hand, helps obtaining phase pure LZP with
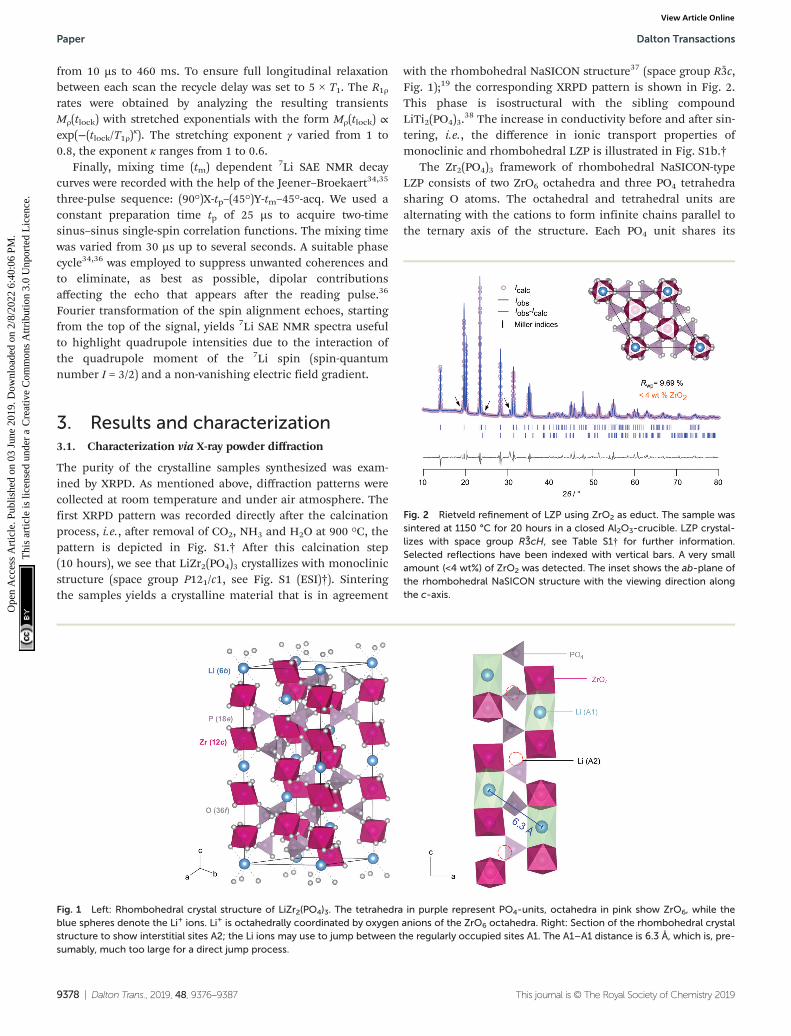
rhombohedral structure, as is illustrated in Fig. 3. The amountof unreacted ZrO2 continuously decreases with increasing Ca-content. This behavior is also found for LCZP prepared withthe help of Zr(ac)4. Nonetheless, the amount of ZrO2 remainsmuch higher (>15 wt%) than that in samples prepared fromZrO2 directly. Dots in Fig. 3 denote reflections belonging toZrO2. Worth noting, here we do not find any additional Braggreflections that belong to triclinic LZP in all diffractograms.These have been seen in earlier reports.22,39–41 We recognizethat small variations in synthesis conditions, including heattreatment and cooling rates, might sensitively affect the phasepurity of the final compounds.
According to XRPD we decided to study, in detail, iondynamics of the following samples: LiZr2(PO4)3 prepared fromZrO2 and Zr(ac)4 as well as Li1+2xZr2−xCax(PO4)3 (x = 0.1and 0.2) prepared with the help of ZrO2. Similar to LiTi2(PO4)3and other NaSICON-type materials α-LiZr2(PO4)3 shows lowrelative densities, here ranging from 78% to 84%.
3.2. Impedance spectroscopy
To study how Li+ ion transport is affected by x as well as toinvestigate whether the starting materials influence thedynamic parameters, we measured complex impedances over alarge temperature and frequency range.26,42 Exemplarily, inFig. 4a conductivity isotherms of rhombohedral LiZr2(PO4)3are shown. Isotherms are obtained by plotting the real part, σ′,of the complex conductivity σ of LiZr2(PO4)3 as a function offrequency ν. They are composed of four regimes. (i) At low fre-quencies (and sufficiently high temperatures and, thus, highionic mobility) electrode polarization (EP) appears owing tothe piling-up of ions near the surface of the blocking Au elec-trodes applied. In many cases a stepwise decay of σ′ is seen (cf.the two arrows in Fig. 4a). (ii) The polarization regime passesinto so-called conductivity plateaus (P1) governing the iso-
Fig. 3 (a) X-ray powder diffraction pattern of the crystalline LiZr2(PO4)3 and Li1+2xZr2−xCax(PO4)3 (x = 0.1 and 0.2). All samples were prepared by aclassical solid-state route with either ZrO2 as starting material (black) or Zr(CH3COO)4 (light grey). The vertical lines (in grey) at the bottom denotethe reflections of rhombohedral LZP, those of monoclinic ZrO2 are indicated by green dots. (b) XRPD pattern of Li1+2xZr2−xCax(PO4)3 prepared withthe help of ZrO2. The diffraction pattern reveal that the amount of the impurity phase ZrO2 decreases with increasing Ca2+-content.
Dalton Transactions Paper
This journal is © The Royal Society of Chemistry 2019 Dalton Trans., 2019, 48, 9376–9387 | 9379
Ope
n A
cces
s A
rtic
le. P
ublis
hed
on 0
3 Ju
ne 2
019.
Dow
nloa
ded
on 2
/8/2
022
6:40
:06
PM.
Thi
s ar
ticle
is li
cens
ed u
nder
a C
reat
ive
Com
mon
s A
ttrib
utio
n 3.
0 U
npor
ted
Lic
ence
.View Article Online
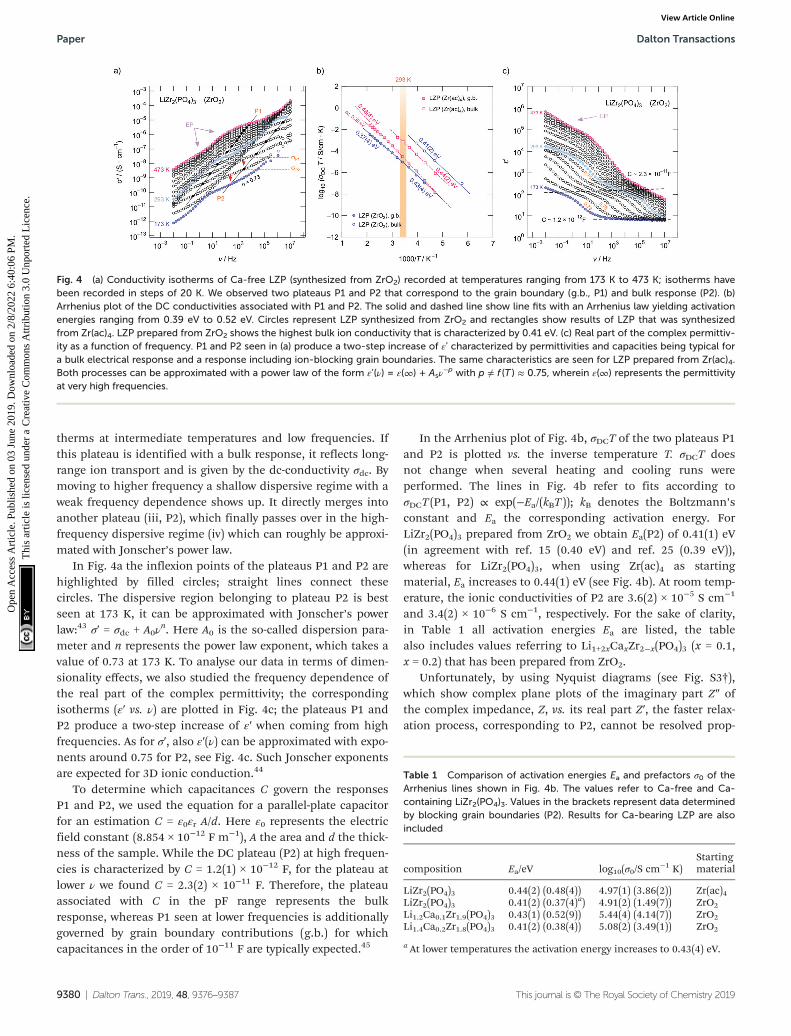
therms at intermediate temperatures and low frequencies. Ifthis plateau is identified with a bulk response, it reflects long-range ion transport and is given by the dc-conductivity σdc. Bymoving to higher frequency a shallow dispersive regime with aweak frequency dependence shows up. It directly merges intoanother plateau (iii, P2), which finally passes over in the high-frequency dispersive regime (iv) which can roughly be approxi-mated with Jonscher’s power law.
In Fig. 4a the inflexion points of the plateaus P1 and P2 arehighlighted by filled circles; straight lines connect thesecircles. The dispersive region belonging to plateau P2 is bestseen at 173 K, it can be approximated with Jonscher’s powerlaw:43 σ′ = σdc + A0ν
n. Here A0 is the so-called dispersion para-meter and n represents the power law exponent, which takes avalue of 0.73 at 173 K. To analyse our data in terms of dimen-sionality effects, we also studied the frequency dependence ofthe real part of the complex permittivity; the correspondingisotherms (ε′ vs. ν) are plotted in Fig. 4c; the plateaus P1 andP2 produce a two-step increase of ε′ when coming from highfrequencies. As for σ′, also ε′(ν) can be approximated with expo-nents around 0.75 for P2, see Fig. 4c. Such Jonscher exponentsare expected for 3D ionic conduction.44
To determine which capacitances C govern the responsesP1 and P2, we used the equation for a parallel-plate capacitorfor an estimation C = ε0εr A/d. Here ε0 represents the electricfield constant (8.854 × 10⁻¹² F m−1), A the area and d the thick-ness of the sample. While the DC plateau (P2) at high frequen-cies is characterized by C = 1.2(1) × 10−12 F, for the plateau atlower ν we found C = 2.3(2) × 10−11 F. Therefore, the plateauassociated with C in the pF range represents the bulkresponse, whereas P1 seen at lower frequencies is additionallygoverned by grain boundary contributions (g.b.) for whichcapacitances in the order of 10−11 F are typically expected.45
In the Arrhenius plot of Fig. 4b, σDCT of the two plateaus P1and P2 is plotted vs. the inverse temperature T. σDCT doesnot change when several heating and cooling runs wereperformed. The lines in Fig. 4b refer to fits according toσDCT (P1, P2) ∝ exp(−Ea/(kBT )); kB denotes the Boltzmann’sconstant and Ea the corresponding activation energy. ForLiZr2(PO4)3 prepared from ZrO2 we obtain Ea(P2) of 0.41(1) eV(in agreement with ref. 15 (0.40 eV) and ref. 25 (0.39 eV)),whereas for LiZr2(PO4)3, when using Zr(ac)4 as startingmaterial, Ea increases to 0.44(1) eV (see Fig. 4b). At room temp-erature, the ionic conductivities of P2 are 3.6(2) × 10−5 S cm−1
and 3.4(2) × 10−6 S cm−1, respectively. For the sake of clarity,in Table 1 all activation energies Ea are listed, the tablealso includes values referring to Li1+2xCaxZr2−x(PO4)3 (x = 0.1,x = 0.2) that has been prepared from ZrO2.
Unfortunately, by using Nyquist diagrams (see Fig. S3†),which show complex plane plots of the imaginary part Z″ ofthe complex impedance, Z, vs. its real part Z′, the faster relax-ation process, corresponding to P2, cannot be resolved prop-
Fig. 4 (a) Conductivity isotherms of Ca-free LZP (synthesized from ZrO2) recorded at temperatures ranging from 173 K to 473 K; isotherms havebeen recorded in steps of 20 K. We observed two plateaus P1 and P2 that correspond to the grain boundary (g.b., P1) and bulk response (P2). (b)Arrhenius plot of the DC conductivities associated with P1 and P2. The solid and dashed line show line fits with an Arrhenius law yielding activationenergies ranging from 0.39 eV to 0.52 eV. Circles represent LZP synthesized from ZrO2 and rectangles show results of LZP that was synthesizedfrom Zr(ac)4. LZP prepared from ZrO2 shows the highest bulk ion conductivity that is characterized by 0.41 eV. (c) Real part of the complex permittiv-ity as a function of frequency. P1 and P2 seen in (a) produce a two-step increase of ε’ characterized by permittivities and capacities being typical fora bulk electrical response and a response including ion-blocking grain boundaries. The same characteristics are seen for LZP prepared from Zr(ac)4.Both processes can be approximated with a power law of the form ε’(ν) = ε(∞) + Asν
−p with p ≠ f (T ) ≈ 0.75, wherein ε(∞) represents the permittivityat very high frequencies.
Table 1 Comparison of activation energies Ea and prefactors σ0 of theArrhenius lines shown in Fig. 4b. The values refer to Ca-free and Ca-containing LiZr2(PO4)3. Values in the brackets represent data determinedby blocking grain boundaries (P2). Results for Ca-bearing LZP are alsoincluded
composition Ea/eV log10(σ0/S cm−1 K)Startingmaterial
LiZr2(PO4)3 0.44(2) (0.48(4)) 4.97(1) (3.86(2)) Zr(ac)4LiZr2(PO4)3 0.41(2) (0.37(4)a) 4.91(2) (1.49(7)) ZrO2Li1.2Ca0.1Zr1.9(PO4)3 0.43(1) (0.52(9)) 5.44(4) (4.14(7)) ZrO2Li1.4Ca0.2Zr1.8(PO4)3 0.41(2) (0.38(4)) 5.08(2) (3.49(1)) ZrO2
a At lower temperatures the activation energy increases to 0.43(4) eV.
Paper Dalton Transactions
9380 | Dalton Trans., 2019, 48, 9376–9387 This journal is © The Royal Society of Chemistry 2019
Ope
n A
cces
s A
rtic
le. P
ublis
hed
on 0
3 Ju
ne 2
019.
Dow
nloa
ded
on 2
/8/2
022
6:40
:06
PM.
Thi
s ar
ticle
is li
cens
ed u
nder
a C
reat
ive
Com
mon
s A
ttrib
utio
n 3.
0 U
npor
ted
Lic
ence
.View Article Online
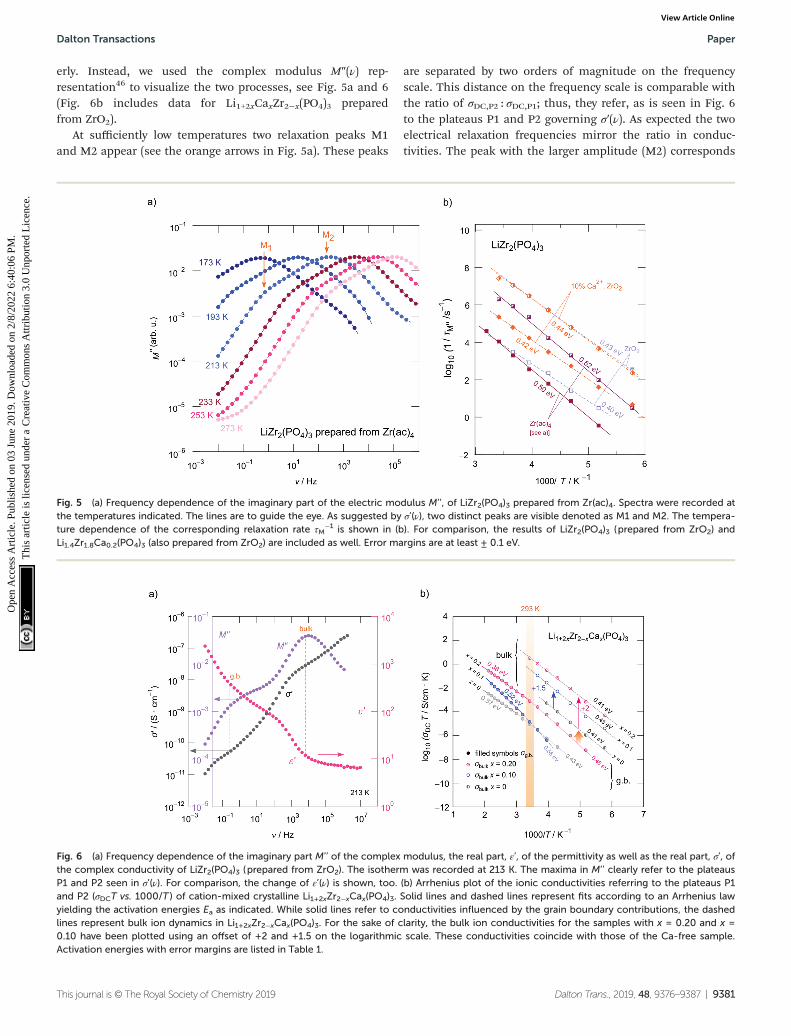
erly. Instead, we used the complex modulus M″(ν) rep-resentation46 to visualize the two processes, see Fig. 5a and 6(Fig. 6b includes data for Li1+2xCaxZr2−x(PO4)3 preparedfrom ZrO2).
At sufficiently low temperatures two relaxation peaks M1and M2 appear (see the orange arrows in Fig. 5a). These peaks
are separated by two orders of magnitude on the frequencyscale. This distance on the frequency scale is comparable withthe ratio of σDC,P2 : σDC,P1; thus, they refer, as is seen in Fig. 6to the plateaus P1 and P2 governing σ′(ν). As expected the twoelectrical relaxation frequencies mirror the ratio in conduc-tivities. The peak with the larger amplitude (M2) corresponds
Fig. 5 (a) Frequency dependence of the imaginary part of the electric modulus M’’, of LiZr2(PO4)3 prepared from Zr(ac)4. Spectra were recorded atthe temperatures indicated. The lines are to guide the eye. As suggested by σ’(ν), two distinct peaks are visible denoted as M1 and M2. The tempera-ture dependence of the corresponding relaxation rate τM
−1 is shown in (b). For comparison, the results of LiZr2(PO4)3 (prepared from ZrO2) andLi1.4Zr1.8Ca0.2(PO4)3 (also prepared from ZrO2) are included as well. Error margins are at least ± 0.1 eV.
Fig. 6 (a) Frequency dependence of the imaginary part M’’ of the complex modulus, the real part, ε’, of the permittivity as well as the real part, σ’, ofthe complex conductivity of LiZr2(PO4)3 (prepared from ZrO2). The isotherm was recorded at 213 K. The maxima in M’’ clearly refer to the plateausP1 and P2 seen in σ’(ν). For comparison, the change of ε’(ν) is shown, too. (b) Arrhenius plot of the ionic conductivities referring to the plateaus P1and P2 (σDCT vs. 1000/T ) of cation-mixed crystalline Li1+2xZr2−xCax(PO4)3. Solid lines and dashed lines represent fits according to an Arrhenius lawyielding the activation energies Ea as indicated. While solid lines refer to conductivities influenced by the grain boundary contributions, the dashedlines represent bulk ion dynamics in Li1+2xZr2−xCax(PO4)3. For the sake of clarity, the bulk ion conductivities for the samples with x = 0.20 and x =0.10 have been plotted using an offset of +2 and +1.5 on the logarithmic scale. These conductivities coincide with those of the Ca-free sample.Activation energies with error margins are listed in Table 1.
Dalton Transactions Paper
This journal is © The Royal Society of Chemistry 2019 Dalton Trans., 2019, 48, 9376–9387 | 9381
Ope
n A
cces
s A
rtic
le. P
ublis
hed
on 0
3 Ju
ne 2
019.
Dow
nloa
ded
on 2
/8/2
022
6:40
:06
PM.
Thi
s ar
ticle
is li
cens
ed u
nder
a C
reat
ive
Com
mon
s A
ttrib
utio
n 3.
0 U
npor
ted
Lic
ence
.View Article Online
to P2 in σ′(ν), the one with the smaller amplitude (M1)represents a relaxation process with a longer relaxation time(cf. P1), see also Fig. 6. As an estimation, M″ is proportional tothe inverse capacitance, M″ ∝ 1/C.45,47 Thus, we expect peakM2 to be characterized by a larger amplitude (3.4 pF) than M1(30.1 pF). C1/C2 ≈ 10 is in good agreement with the amplituderatio seen in Fig. 5a and 6a.
In order to compare activation energies extracted fromσDC(P1, P2) we determined characteristic electrical relaxationfrequencies 1/τM using the modulus peaks of Fig. 5a. 1/τMrefers to frequencies at which the peaks appear. A comparisonof activation energies for selected compounds is shown inFig. 5b; errors are, at least, in the order of ±0.01 eV.
As mentioned in the beginning, Ca2+ incorporationincreases the ionic conductivity of LZP. Fig. 6b shows thechange in σDCT (P1, P2) of Li1+2xCaxZr2−x(PO4)3 prepared fromZrO2 for x = 0, x = 0.1 and x = 0.2. Most importantly, whileσDCT (P2), which refers to bulk ion dynamics, is only slightlyaffected by x (Ea ranges from 0.41 eV to 0.43 eV, see Fig. 6band Table 1 that also includes the prefactors), Ca2+ incorpor-ation mainly reduces the g.b. resistance. We clearly see thatσDCT (P1) is by two orders of magnitude larger than that of thesample with x = 0, see Fig. 6b. Most likely, the sinteringprocess benefits from a Ca-rich composition, which helpsreducing the blocking nature of surface regions of theLi1+2xCaxZr2−x(PO4)3 crystallites. For x = 0.2 we obtain σDC(P2) =4.2 × 10⁻⁵ S cm−1 at 293 K. This value is only slightly lowerthan that of Li et al.15 (3.8 × 10⁻⁵ S cm−1) when samples arecompared that have been prepared by conventional sintering.If pellets were fired by spark plasma sintering, bulk values of1.8 × 10−4 S cm−1 were reported.15 It would be interesting to
see, in coming studies, whether Ca2+, here acting as a sinteringaid, segregates in the g.b. regions; such segregation wouldexplain the finding that ion transport in the bulk regions isonly little affected by Ca2+ incorporation.
Careful inspection of σDCT (P1) reveals that, if the sampleswith x = 0.2 is considered as an example (Fig. 6b), a slight kinkis seen for temperatures well above room temperature; the acti-vation energy changes from 0.48 eV to 0.38 eV at higher T.Presumably, Ca2+ in the grain boundaries influences the Li+
arrangements in these regions. Li+ order/disorder phenomenamight lead to such changes.
3.3. Ion dynamics as seen by NMR measurements
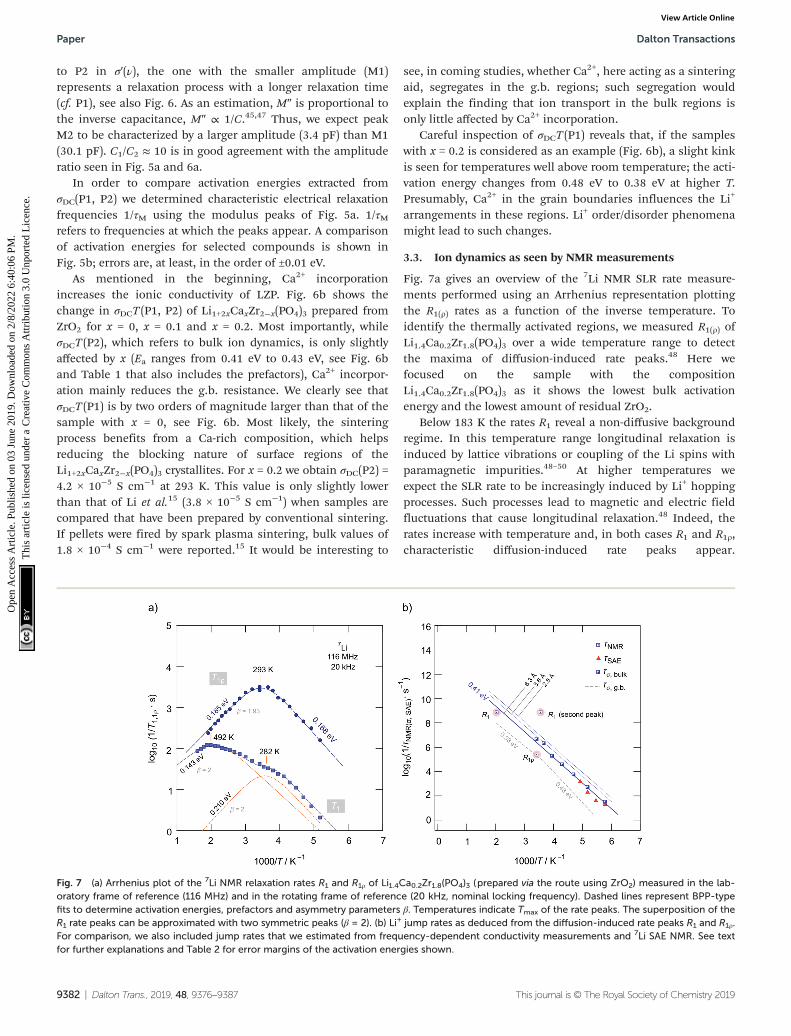
Fig. 7a gives an overview of the 7Li NMR SLR rate measure-ments performed using an Arrhenius representation plottingthe R1(ρ) rates as a function of the inverse temperature. Toidentify the thermally activated regions, we measured R1(ρ) ofLi1.4Ca0.2Zr1.8(PO4)3 over a wide temperature range to detectthe maxima of diffusion-induced rate peaks.48 Here wefocused on the sample with the compositionLi1.4Ca0.2Zr1.8(PO4)3 as it shows the lowest bulk activationenergy and the lowest amount of residual ZrO2.
Below 183 K the rates R1 reveal a non-diffusive backgroundregime. In this temperature range longitudinal relaxation isinduced by lattice vibrations or coupling of the Li spins withparamagnetic impurities.48–50 At higher temperatures weexpect the SLR rate to be increasingly induced by Li+ hoppingprocesses. Such processes lead to magnetic and electric fieldfluctuations that cause longitudinal relaxation.48 Indeed, therates increase with temperature and, in both cases R1 and R1ρ,characteristic diffusion-induced rate peaks appear.
Fig. 7 (a) Arrhenius plot of the 7Li NMR relaxation rates R1 and R1ρ of Li1.4Ca0.2Zr1.8(PO4)3 (prepared via the route using ZrO2) measured in the lab-oratory frame of reference (116 MHz) and in the rotating frame of reference (20 kHz, nominal locking frequency). Dashed lines represent BPP-typefits to determine activation energies, prefactors and asymmetry parameters β. Temperatures indicate Tmax of the rate peaks. The superposition of theR1 rate peaks can be approximated with two symmetric peaks (β = 2). (b) Li+ jump rates as deduced from the diffusion-induced rate peaks R1 and R1ρ.For comparison, we also included jump rates that we estimated from frequency-dependent conductivity measurements and 7Li SAE NMR. See textfor further explanations and Table 2 for error margins of the activation energies shown.
Paper Dalton Transactions
9382 | Dalton Trans., 2019, 48, 9376–9387 This journal is © The Royal Society of Chemistry 2019
Ope
n A
cces
s A
rtic
le. P
ublis
hed
on 0
3 Ju
ne 2
019.
Dow
nloa
ded
on 2
/8/2
022
6:40
:06
PM.
Thi
s ar
ticle
is li
cens
ed u
nder
a C
reat
ive
Com
mon
s A
ttrib
utio
n 3.
0 U
npor
ted
Lic
ence
.View Article Online
Importantly, we recognize that R1 passes through two maximalocated at Tmax = 282 K and 492 K, respectively. In general, atTmax the motional correlation rate 1/τc is related to ω0 via therelation τcω0 ≈ 1. The so-called motional correlation rate 1/τc isidentical, within a factor of two, with the Li+ jump rate 1/τ.48,50
For R1ρ, this maximum condition changes to τcω1 ≈ 0.5.51 Asω0 and ω1 differ by more than three orders of magnitude, weare able to characterize Li+ motional correlation rates in LCZPwith values in both the kHz and MHz range.52
Here, we approximated the superposition of the two R1 ratepeaks by a sum of two Lorentzian-shaped spectral densityfunctions J (ω0, T ) ∝ τc/(1 + (ω0τc)
β) according to the conceptintroduced by Bloembergen, Purcell and Pound (BPP) for 3Disotropic diffusion,53,54 see dashed line in Fig. 7a that followsthe R1 rates. For each peak we used a single term to deconvo-lute the temperature dependence of the overall R1 ratesmeasured, cf. the dashed-dotted lines in Fig. 7a, which will bediscussed below. The rate 1/τc usually obeys the Arrheniusrelation 1/τc = 1/τc,0 exp(−Ea/(kBT )); 1/τc,0 represents the pre-exponential factor that is typically identified as the “attemptfrequency” of the jump process.55
In general, J (ω0, T ) is the Fourier transform of the under-lying motional correlation function G(t′).48 If G(t′) is or can bewell approximated with a single exponential, β equals 2.Values smaller than 2 are expected for correlated motion,which is, e.g., seen for cations exposed to an irregularly shapedpotential landscape. In such a landscape short-ranged Li+
diffusion will be different to long-range ion transport. In par-ticular, forth-and-back jumps or, more generally speaking,localized motions will govern the rate R1 in the low-tempera-ture regime, which is characterized by τcω0 ≫ 1. In this regimewe have J (ω0) ∝ τc
−1ω0−β with (1 < β ≤ 2). β < 2 produces asym-
metric rate peaks which are often found for structurallycomplex ion conductors with a non-uniformly shaped energylandscape. Ion dynamics in this regime are anticipated to beaffected by correlation effects because of both structural dis-order and strong Coulomb interactions of the moving ions.56
As the peak is asymmetric, the activation energy on thisside of the peak, Ea, low, is lower than that of the high-tempera-ture flank, Ea, high; the two values are linked to each other viaEa, low = (β(ρ) − 1)Ea, high. In the regime τcω0 ≪ 1, that is, on thehigh-temperature side of the peak, many jump events aresensed during one Larmor precession and the probability ishigh that also these jumps contribute to longitudinal relax-ation which are characterized by higher activation energies.Usually, on this side of the rate peak R1(1/T ) long-range Li iondynamics is sensed; in this limit we obtain J (ω0) ∝ τc.
29
In the present case, approximating the rate peaks with asum of two BPP-type spectral densities yields activation ener-gies of Ea,1 = 0.210(5) eV and Ea,2 = 0.143(5) eV. As both ratepeaks join up, information on β are difficult to obtain. Here,the fitting routine yields β = 2 for the two peaks resulting insymmetric peaks with Ea, low = Ea, high = Ea,i (i = 1, 2). Note thatthe peak at higher T (i = 2) is only partly visible which influ-ences the precise determination of Ea, high. We clearly recog-nize that Ea,i as determined from R1 SLR NMR turned out to be
significantly lower than Ea obtained from σDC measurementsdescribing bulk ion dynamics. The fact that Ea,i < Ea, DC showsthat the number of jump events seen by NMR does not includeall types of jumps needed for long-range diffusion. Obviously,the spin-fluctuations sensed by NMR are already sufficient togenerate a full R1 peak. Thus, we conclude that the Li+ ions inLCZP are highly mobile on a short-range length scale whilelong-range ion transport is, however, characterized by muchlarger activation energies than 0.2 eV. This situation resemblesthat of Li+ ion dynamics in argyrodite-type Li6PS5I, which hasbeen studied recently by our group.42 Here, we assume thatrapid forward–backward exchange processes between the sitesA1 and A2 might be responsible for the peaks seen in NMRspin–lattice relaxometry. A2 sites might be occupied insamples with x > 0. Here, especially the peak appearing atTmax = 282 K for Li1.4Ca0.2Zr1.8(PO4)3 points to rapid (localized)exchange processes with residence times in the order ofseveral ns. According to ω0τc ≈ 1 we estimate that at Tmax thejump rate should be in the order of 1/τ = 7.3 × 10⁸ s−1 ≈ 109
s−1. A very similar behavior has recently been seen also forNaSICON-type Na3.4Sc0.4Zr1.6(SiO4)2PO4.
To complement our R1 measurements, we carried out spin-lock NMR SLR measurements at a locking frequency of 20kHz. As expected we detected a prominent spin-lock NMRpeak R1ρ(1/T ) at much lower temperature than 492 K. A singlepeak appears at Tmax = 293 K. It turned out to be slightly asym-metric with an activation energy of Ea, high = 0.185(5) eV andEa, low = 0.168(5) eV. At first glance we would say that the R1ρpeak might correspond to the R1 peak seen at Tmax = 492 K.Keeping, however, both the locking frequency of only 20 kHzand the rather low activation energy of 0.185 eV in mind, theR1ρ peak belonging to R1(1/T ) with Tmax = 492 K would beexpected to appear at much lower temperatures than ambient.Even if we replace ω1 by an effective frequency ω1, eff (>ω1),which takes local magnetic fields into account that increaseω1, no satisfactory joint fit results that is characterized by thesame Ea and the same τc,0 for the two peaks. Here, only unreli-ably high ω1, eff values reaching the MHz range would result ina joint fit connecting the two peaks. Table 2 shows an overviewof the results obtained from analyzing the three peaks indivi-dually by BPP-type spectral density functions. It also includesthe amplitudes CNMR in R1(ρ) = CNMR J (ω0, T ). We see that theamplitudes of the two R1 rate peaks differ by approximatelyone order of magnitude. Most likely, stronger quadrupolarrelaxation governs the peak appearing at higher T. The corres-ponding prefactor 1/τ0 is relatively low, while that of the peakshowing up at 282 K (1/τ0 = 5.9 × 10¹² s−1) is consistent withfrequencies typically expected for phonons.
The above-mentioned jump rate derived from SLR NMR atTmax (1/τ = 7.3 × 10⁸ s−1) can be converted into diffusion coeffi-cients with the help of the Einstein–Smoluchowski equationaccording to DNMR = a2/(6τ), which is valid for 3D diffusion.29
As an estimation, by inserting a = 6.3 Å, which is simply theshortest Li–Li distance, we obtain DNMR = a2/(6τ) = 4.8 × 10⁻¹¹
m2 s−1. Assuming the interstitial sites A2 participating inexchange processes DNMR reduces to 1.8 × 10⁻¹¹ m2 s−1. A dis-
Dalton Transactions Paper
This journal is © The Royal Society of Chemistry 2019 Dalton Trans., 2019, 48, 9376–9387 | 9383
Ope
n A
cces
s A
rtic
le. P
ublis
hed
on 0
3 Ju
ne 2
019.
Dow
nloa
ded
on 2
/8/2
022
6:40
:06
PM.
Thi
s ar
ticle
is li
cens
ed u
nder
a C
reat
ive
Com
mon
s A
ttrib
utio
n 3.
0 U
npor
ted
Lic
ence
.View Article Online
tance of a = 6.3 Å is, of course, by far too long for a singlehopping process. In the structural model of Catti et al. the dis-tance reduced to 4.2 Å at 423 K.24
In the Arrhenius plot of Fig. 7b we compare the rates 1/τfrom NMR (1/τNMR) with those obtained after converting σDCinto jump rates by using the Nernst Einstein equation. As wedo not know the exact jump distance, we calculated 1/τσ forthree different values of a. 1/τσ represents an average valuemainly influenced by Li+ jumps necessary for long-range iontransport. Most likely, the R1 peak appearing at 492 K is morerelated to jump processes enabling the ions to move overlonger distances. The large discrepancy between 1/τNMR(282 K)and 1/τσ once again visualizes that the R1(1/T ) peak at low Treflects localized jump processes. We do not find evidencesthat this peak originates from any phase transitions, as thephase-pure Ca-bearing samples show rhombohedral structure.For comparison, in Fig. 7b we also included 1/τσ rates esti-mated from conductivity values that characterize the influenceof grain boundaries. Interestingly, 1/τNMR(293 K, R1ρ) = 2.5 ×10⁵ s−1, which we estimated via the relation ω1τc ≈ 0.5, seeabove, agrees with 1/τσ, g.b. In contrast to R1, which as far asµm-sized crystallites are considered, is mainly affected by bulkprocesses, the corresponding spin-lock NMR rates R1ρ seemsto be (also partly) sensitive to ion dynamics also influenced byinterfacial processes. This behaviour is consistent with the fol-lowing comparison. At frequencies in the kHz range (ω1/2π =20 kHz) and at T = 282 K the isotherms σ′(ν) are mainly influ-enced by the g.b. response rather than bulk ion dynamics.
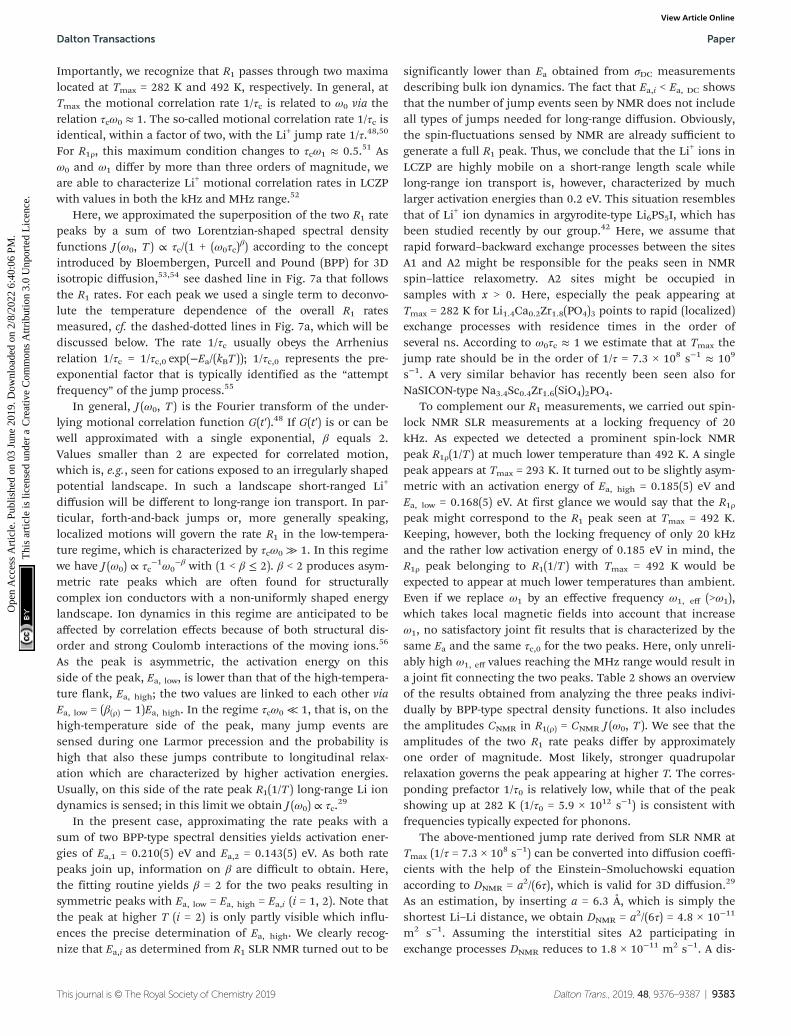
To shed more light on long-range ion dynamics, we used7Li NMR line shape measurements and 7Li SAE NMRexperiments46,57–60 to further characterize ionic transport inLCZP. Via SAE NMR we should be able to get access todiffusion parameters that characterize ion transport overlonger distances as the method is sensitive to exchange pro-cesses on the time scale that is comparable to that of DC con-ductivity measurements.48 In Fig. 8a variable-temperature 7LiNMR spectra of Li1.4Ca0.2Zr1.8(PO4)3 are shown. Remarkably, attemperatures as low as 213 K a relatively narrow NMR line isdetected whose width is only 1.4 kHz. Usually, we would expecta width in the order of several kHz due to 7Li–7Li dipolar inter-actions. Here, the large Li–Li distance of 6.3 Å between the A1sites, and between A1 sites and Li ions occupying interstitialsites in samples with x > 0, leads to relatively weak dipole–dipole interactions producing a narrow line already in the rigid-
lattice regime. With increasing temperature, the line undergoesa slight narrowing process because of Li diffusion that averagesdipolar couplings. Finally, at even higher temperatures, i.e., inthe extreme narrowing regime, its width is only governed by theinhomogeneity of the external magnetic field.
Interestingly, at 313 K two satellite lines emerge that belongto a first-order quadrupole powder pattern arising from theinteraction of the quadrupole moment of the 7Li nucleus (I =3/2) with a non-vanishing electric field gradient (EFG) at thenuclear site. The EFG is produced by the electric charge distri-bution in the direct neighborhood of the 7Li nucleus. Thisadditional interaction alters the Zeeman levels and, thus, alsothe associated (angular) Zeeman frequency ω0 towards ω0 ±ωQ.
32,54 The singularities seen in Fig. 8a correspond to the 90°satellite transitions of a powder pattern, which typically showup at sufficiently high T; this feature belongs to the universalcharacteristics of crystalline materials studied by NMR.32,50,61
Their distance on the frequency scale, if we simply assume anEFG with axial symmetry, corresponds to δ/2. δ is the quadru-pole coupling constant. A distance of 49 kHz leads to δ = 98kHz,58 which is in fair agreement with the value reported byPetit et al.20 Here, this value should, however, be interpreted asan average value, as we cannot exclude a small distribution ofEFGs the ions are exposed to at very low temperatures. At verylow T, the intensity of the singularities is too low to be detect-able by single pulse experiments. Instead, echo experimentsshould be used that are able to avoid receiver dead time effects.In Fig. 8b (see inset) a spectrum is shown that is the Fouriertransform of a stimulated echo. Indeed, a sharp central line islocated on top of a broad quadrupole foot. Hence, we concludethat the Li ions are exposed to a distribution of EFGs.
Fluctuations in ωQ seen by the ions when jumping betweenelectrically inequivalent sites can be used to record sinus–sinus two-time correlation functions. In Fig. 8a the change ofthe 7Li SAE amplitude S2 is shown vs. the logarithmic mixingtime tm. S2 depends on both the preparation time tp and tm.Here, we measured the decay curve at fixed tp (= 20 µs) but vari-able mixing time. Stretched exponentials of the form S2 ∝ exp(−(tm/τSAE)λ), with a stretching factor λ ranging from 0.21 to0.37, are best suited to describe the dependence of S2(tp =const., tm) in this temperature regime. In general, stretchingfactors deviating from λ = 1 indicate non-Debye-like motionalprocess. For example, such deviations can arise from motionsin disordered matrices or in confined dimensions59,62 leading
Table 2 Results of analyzing the 7Li NMR rate peaks R1 and R1ρ of Li1.4Ca0.2Zr1.8(PO4)3. The coupling constant CNMR, which is the amplitude of therate peak, J (ω0) = CNMRτc/(1 + (ω0τc)
β, turned out to be in the range of 1010 and 1011 s−2. Values in the order of 10−13 s for τ0 correspond to (inverse)phonon frequencies
Ea (= Ea, high) CNMR β(ρ) τ0
R1 (Tmax = 492 K) 0.143(5) eV 1.8(1) × 1011 s−2 2 4.1(2) × 10−11 sR1 (Tmax = 282 K) 0.210(5) eV 2.5(1) × 1010 s−2 1.93 1.7(2) × 10−13 sR1,ρ (Tmax = 293 K) 0.185(5) eV 1.5(1) × 109 s−2 2 2.8(1) × 10−9 s
(0.168(5) eV)a
a The value in brackets refers to Ea, low of the R1ρ peak seen at 293 K.
Paper Dalton Transactions
9384 | Dalton Trans., 2019, 48, 9376–9387 This journal is © The Royal Society of Chemistry 2019
Ope
n A
cces
s A
rtic
le. P
ublis
hed
on 0
3 Ju
ne 2
019.
Dow
nloa
ded
on 2
/8/2
022
6:40
:06
PM.
Thi
s ar
ticle
is li
cens
ed u
nder
a C
reat
ive
Com
mon
s A
ttrib
utio
n 3.
0 U
npor
ted
Lic
ence
.View Article Online
to motional correlation functions whose decay slows downwith increasing observation time. With increasing T the inflex-ion point of the echo decay curves shifts towards shorter tm. Atthe same time, the shape of S2 steadily becomes morestretched until a value of λ = 0.21 is reached at T = 203 K. Atsufficiently long mixing times the curves S2(tp = const., tm)always reach S2,∞ = 0, which either indicates a rather largenumber of quadrupole frequencies involved or which points tothe influence of dipolarly coupled spins, as is well-describedin literature.36 The rates 1/τSAE governing the stretched decayfunctions are included in Fig. 7b. We recognize that they are infair agreement with those rates, 1/τσ, bulk, which were esti-mated from bulk ionic conductivities of Li1.4Ca0.2Zr1.8(PO4)3.
4. Conclusion
We used a conventional solid-state reaction procedure to syn-thesize NaSICON-type LiZr2(PO4)3 and investigated both itsionic conductivity and Li+ diffusivity by broadband conduc-tivity measurements and NMR spectroscopy. Ca2+ incorpor-ation helps prepare Li1+2xZr2−xCax(PO4)3 crystallizing withrhombohedral symmetry. While bulk ion dynamics is notinfluenced by the Ca2+ content, the grain boundaries in LZCPturn out to be less blocking for Li+ ions as compared to thesample with x = 0. We observed an increase in the low-fre-quency ionic conductivity by two orders of magnitude whenincreasing x from x = 0 to x = 0.2. For Li1.4Ca0.2Zr1.8(PO4)3
7LiNMR relaxometry revealed rapid localized Li+ jump processes
with activation energies of 0.21 eV and 0.14 eV. The diffusion-induced rate peak seen at 282 K points to a very high jumprate in the order of 109 s−1 at this temperature. On the otherhand, 7Li spin-alignment echo spectroscopy confirmed thatlong-range ion transport in the bulk regions ofLi1.4Zr1.8Ca0.2(PO4)3 needs to be characterized by an activationenergy of 0.41 eV as determined by variable-frequency conduc-tivity measurements.
Conflicts of interest
There are no conflicts to declare.
Acknowledgements
This project has received funding from the European Union’sHorizon 2020 research and innovation programme undergrant agreement no. 769929. We thank the DeutscheForschungsgemeinschaft for further support (FOR1277,WI3600(2-1;4-2). Further support by the K-project ‘safe battery’(FFG) is highly appreciated.
References
1 J. Janek and W. G. Zeier, Nat. Energy, 2016, 1, 16141.2 D. Larcher and J. M. Tarascon, Nat. Chem., 2015, 7, 19–29.
Fig. 8 (a) 7Li NMR spectra of Li1.4Ca0.2Zr1.8(PO4)3 recorded at the temperatures indicated. The NMR line transforms from a Gaussian shape at lowtemperatures to a Lorentzian one at elevated T. Clearly visible and well-defined quadrupole powder patterns emerge at temperatures higher than313 K. (b) 7Li SAE NMR decay curves of LCZP whose spectra are shown in (a). Decay curves follow stretched exponentials (0.2 < γ < 0.4) which are shownas solid lines. Data have been recorded at a Larmor frequency of 116 MHz. See text for further details. Inset: Fourier transform of a spin-alignment echo,starting from the top of the echo, which was recorded at a fixed tp of 20 µs and a short mixing time of tm = 100 µs. In addition to a “central line” a ratherbroad quadrupole foot is visible illustrating the distribution of EFGs seen by the Li ions in the dynamic regime of the rigid lattice.
Dalton Transactions Paper
This journal is © The Royal Society of Chemistry 2019 Dalton Trans., 2019, 48, 9376–9387 | 9385
Ope
n A
cces
s A
rtic
le. P
ublis
hed
on 0
3 Ju
ne 2
019.
Dow
nloa
ded
on 2
/8/2
022
6:40
:06
PM.
Thi
s ar
ticle
is li
cens
ed u
nder
a C
reat
ive
Com
mon
s A
ttrib
utio
n 3.
0 U
npor
ted
Lic
ence
.View Article Online
3 J. I. Hur, L. C. Smith and B. Dunn, Joule, 2018, 2, 1187–1201.
4 E. Quartarone and P. Mustarelli, Chem. Soc. Rev., 2011, 40,2525–2540.
5 J. C. Bachman, S. Muy, A. Grimaud, H. H. Chang, N. Pour,S. F. Lux, O. Paschos, F. Maglia, S. Lupart, P. Lamp,L. Giordano and Y. Shao-Horn, Chem. Rev., 2016, 116, 140–162.
6 Z. Z. Zhang, Y. J. Shao, B. Lotsch, Y. S. Hu, H. Li, J. Janek,L. F. Nazar, C. W. Nan, J. Maier, M. Armand andL. Q. Chen, Energy Environ. Sci., 2018, 11, 1945–1976.
7 Y. Inaguma, K. Funayama, A. Aimi, D. Mori, Y. Hamasaki,K. Ueda, M. Ikeda, T. Ohno and K. Mitsuishi, Solid StateIonics, 2018, 321, 29–33.
8 A. Sakuda, A. Hayashi and M. Tatsumisago, Sci. Rep., 2013,3, 2261.
9 A. Hayashi, K. Noi, A. Sakuda and M. Tatsumisago, Nat.Commun., 2012, 3, 856.
10 M. Guin and F. Tietz, J. Power Sources, 2015, 273, 1056–1064.
11 M. Guin, F. Tietz and O. Guillon, Solid State Ionics, 2016,293, 18–26.
12 H. Xie, J. B. Goodenough and Y. Li, J. Power Sources, 2011,196, 7760–7762.
13 V. Ramar, S. Kumar, S. R. Sivakkumar and P. Balaya,Electrochim. Acta, 2018, 271, 120–126.
14 S. Hasegawa, N. Imanishi, T. Zhang, J. Xie, A. Hirano,Y. Takeda and O. Yamamoto, J. Power Sources, 2009, 189,371–377.
15 Y. T. Li, W. D. Zhou, X. Chen, X. J. Lu, Z. M. Cui, S. Xin,L. G. Xue, Q. X. Jia and J. B. Goodenough, Proc. Natl. Acad.Sci. U. S. A., 2016, 113, 13313–13317.
16 H. Xie, Y. Li and J. B. Goodenough, RSC Adv., 2011, 1,1728–1731.
17 C. R. Mariappan, P. Kumar, A. Kumar, S. Indris,H. Ehrenberg, G. Vijaya Prakash and R. Jose, Ceram. Int.,2018, 44, 15509–15516.
18 L. Xiaojuan, F. Xue, L. Wenwei, L. Haitao and Z. Yunjie,Adv. Engin. Res., International Conference on Advances inEnergy, Environment and Chemical Engineering, 2015,pp. 227–230, DOI: DOI: 10.2991/aeece-15.2015.45.
19 D. Petit, P. Colomban, G. Collin and J. P. Boilot, Mater. Res.Bull., 1986, 21, 365–371.
20 D. Petit and B. Sapoval, Solid State Ionics, 1986, 21, 293–304.
21 M. Casciola, U. Costantino, L. Merlini, I. G. K. Andersenand E. K. Andersen, Solid State Ionics, 1988, 26, 229–235.
22 M. Catti and S. Stramare, Solid State Ionics, 2000, 136–137,489–494.
23 M. Catti, S. Stramare and R. Ibberson, Solid State Ionics,1999, 123, 173–180.
24 M. Catti, A. Comotti and S. Di Blas, Chem. Mater., 2003, 15,1628–1632.
25 H. El-Shinawi, C. Greaves and J. Janek, RSC Adv., 2015, 5,17054–17059.
26 F. Preishuber-Pflügl, P. Bottke, V. Pregartner, B. Bitschnauand M. Wilkening, Phys. Chem. Chem. Phys., 2014, 16,9580–9590.
27 S. Lunghammer, Q. Ma, D. Rettenwander, I. Hanzu,F. Tietz and H. M. R. Wilkening, Chem. Phys. Lett., 2018,701, 147–150.
28 B. Stanje, D. Rettenwander, S. Breuer, M. Uitz, S. Berendts,M. Lerch, R. Uecker, G. Redhammer, I. Hanzu andM. Wilkening, Ann. Phys., 2017, 529, 1700140.
29 M. Uitz, V. Epp, P. Bottke and M. Wilkening,J. Electroceram., 2017, 38, 142–156.
30 V. Epp, Q. L. Ma, E. M. Hammer, F. Tietz andM. Wilkening, Phys. Chem. Chem. Phys., 2015, 17, 32115–32121.
31 N. P. Kuz’mina, A. E. Altsybeev, I. P. Malkerova,A. S. Alikhanyan and I. E. Korsakov, Russ. J. Inorg. Chem.,2006, 51, 1750–1754.
32 V. Epp, Ö. Gün, H. J. Deiseroth and M. Wilkening, Phys.Chem. Chem. Phys., 2013, 15, 7123.
33 E. Fukushima and S. B. W. Roeder, Experimental PulseNMR. A Nuts and Bolts Approach, Addison-Wesley Publ.Comp., Reading, 1981.
34 R. Böhmer, J. Magn. Reson., 2000, 147, 78–88.35 J. Jeener and P. Broekaert, Phys. Rev., 1967, 157, 232–240.36 F. Qi, G. Diezemann, H. Böhm, J. Lambert and R. Böhmer,
J. Magn. Reson., 2004, 169, 225–239.37 C. Masquelier, C. Wurm, J. Rodríguez-Carvajal, J. Gaubicher
and L. Nazar, Chem. Mater., 2000, 12, 525–532.38 A. Aatiq, M. Ménétrier, L. Croguennec, E. Suard and
C. Delmas, J. Mater. Chem., 2002, 12, 2971–2978.39 K. Arbi, M. Ayadi-Trabelsi and J. Sanz, J. Mater. Chem.,
2002, 12, 2985–2990.40 I. A. Stenina, Y. A. Velikodnyi, V. A. Ketsko and
A. B. Yaroslavtsev, Inorg. Mater., 2004, 40, 967–970.41 J. Sanz, J. M. Rojo, R. Jiménez, J. E. Iglesias and J. Alamo,
Solid State Ionics, 1993, 62, 287–292.42 I. Hanghofer, M. Brinek, S. L. Eisbacher, B. Bitschnau,
M. Volck, V. Hennige, I. Hanzu, D. Rettenwander andH. M. R. Wilkening, Phys. Chem. Chem. Phys., 2019, 21,8489–8507.
43 A. K. Jonscher, Nature, 1977, 267, 673–679.44 D. L. Sidebottom, Phys. Rev. Lett., 1999, 83, 983–986.45 J. T. S. Irvine, D. C. Sinclair and A. R. West, Adv. Mater.,
1990, 2, 132–138.46 B. Ruprecht, H. Billetter, U. Ruschewitz and M. Wilkening,
J. Phys.: Condens. Matter, 2010, 22, 245901.47 S. Breuer, D. Prutsch, Q. L. Ma, V. Epp, F. Preishuber-
Pflügl, F. Tietz and M. Wilkening, J. Mater. Chem. A, 2015,3, 21343–21350.
48 M. Wilkening and P. Heitjans, ChemPhysChem, 2012, 13,53–65.
49 M. Wilkening, V. Epp, A. Feldhoff and P. Heitjans, J. Phys.Chem. C, 2008, 112, 9291–9300.
50 A. Kuhn, S. Narayanan, L. Spencer, G. Goward,V. Thangadurai and M. Wilkening, Phys. Rev. B: Condens.Matter Mater. Phys., 2011, 83, 094302.
Paper Dalton Transactions
9386 | Dalton Trans., 2019, 48, 9376–9387 This journal is © The Royal Society of Chemistry 2019
Ope
n A
cces
s A
rtic
le. P
ublis
hed
on 0
3 Ju
ne 2
019.
Dow
nloa
ded
on 2
/8/2
022
6:40
:06
PM.
Thi
s ar
ticle
is li
cens
ed u
nder
a C
reat
ive
Com
mon
s A
ttrib
utio
n 3.
0 U
npor
ted
Lic
ence
.View Article Online
51 A. Kuhn, M. Kunze, P. Sreeraj, H. D. Wiemhöfer,V. Thangadurai, M. Wilkening and P. Heitjans, Solid StateNucl. Magn. Reson., 2012, 42, 2–8.
52 M. Wilkening, V. Epp, A. Feldhoff and P. Heitjans, J. Phys.Chem. C, 2008, 112, 9291–9300.
53 N. Bloembergen, E. M. Purcell and R. V. Pound, Phys. Rev.,1948, 73, 679–712.
54 A. Abragam, The Principles of Nuclear Magnetism, ClaredonPress, Oxford, 1961.
55 P. M. Richards, in Topics in Current Physics,ed. M. B. Salamon, Springer, Berlin, 1979, vol. 15.
56 A. Bunde, P. Maass and M. Meyer, Phys. A, 1992, 191, 433–437.
57 P. Bottke, D. Rettenwander, W. Schmidt, G. Amthauer andM. Wilkening, Chem. Mater., 2015, 27, 6571–6582.
58 M. Wilkening and P. Heitjans, J. Phys.: Condens. Matter,2006, 18, 9849–9862.
59 M. Wilkening and P. Heitjans, Phys. Rev. B: Condens. MatterMater. Phys., 2008, 77, 024311.
60 M. Wilkening, A. Kuhn and P. Heitjans, Phys. Rev. B, 2008,78, 054303.
61 R. Bertermann, W. Müller-Warmuth, C. Jansen,F. Hiltmann and B. Krebs, Solid State Ionics, 1999, 117,245–255.
62 P. Bottke, Y. Ren, I. Hanzu, P. G. Bruce and M. Wilkening,Phys. Chem. Chem. Phys., 2014, 16, 1894–1901.
Dalton Transactions Paper
This journal is © The Royal Society of Chemistry 2019 Dalton Trans., 2019, 48, 9376–9387 | 9387
Ope
n A
cces
s A
rtic
le. P
ublis
hed
on 0
3 Ju
ne 2
019.
Dow
nloa
ded
on 2
/8/2
022
6:40
:06
PM.
Thi
s ar
ticle
is li
cens
ed u
nder
a C
reat
ive
Com
mon
s A
ttrib
utio
n 3.
0 U
npor
ted
Lic
ence
.View Article Online